Embed Size (px)
Citation preview

JOURNALOFNEUROPHYSIOLOGY Vol. 70, No. 5, November 1993. Printed in L’.S.A.
Synchronization of Motor-Unit Firings in Several Human Muscles
CARLO J. DE LUCA, ANDREW M. ROY, AND ZEYNEP ERIM NeuroMuscular Research Center and Department of Biomedical Engineering, Boston University, Boston, Massachusetts 02215
SUMMARY AND CONCLUSIONS
1. Synchronization of concurrently active motor-unit firings was studied in six human muscles performing isometric constant- force contractions at 30% of the maximal level. The myoelectric signal was detected with a quadrifilar needle electrode and was decomposed into its constituent motor-unit action-potential trains with the Precision Decomposition technique, whose accu- racy has been proven previously.
2. Synchronization was considered as the tendency of two mo- tor units to fire at fixed time intervals with respect to each other more often than would be expected if the motor units fired inde- pendently. A rigorous statistical technique was used to measure the presence of peaks in the cross-interval histogram of pairs of motor-unit action-potential trains. The location of the center of peak as well as their width and amplitude were measured. A synch index was developed to measure the percentage of firings that were synchronized. The percentage of concurrently active motor-unit pairs that contained synchronized firings was measured.
3. Synchronization of motor-unit firings was observed to occur in two modalities. The short-term modality was seen as a peak in the cross-interval histogram centered about zero-time delay (0.5 t 2.9 ms, mean t SD) and with an average width of 4.5 & 2.5 ms. The long-term modality was seen as a peak centered at latencies ranging from 8 to 76 ms. On the average, the peaks of the long- term synchronization were 36% lower but had approximately the same width as the peaks for the short-term synchronization. Short-term synchronization was seen in 60% of the motor-unit pairs, whereas long-term synchronization was seen in 10% of the pairs.
4. Short-term synchronization occurred in bursts of consecu- tive firings, ranging in number from 1 to 10, with 9 1% of all syn- chronized firings occurring in groups of 1 or 2; and the bursts of discharges appeared at sporadic times during the contraction.
5. The amount of synchronization in motor-unit pairs was found to be low. In the six muscles that were tested, an average of 8.0% of all the firings were short-term synchronized, and an aver- age of 1.0% were long-term synchronized. The synch index was statistically indistinguishable (P = 0.07-0.89) among the different muscles and among 9 of the 11 subjects tested.
6. Sixty percent of concurrently active motor-unit pairs dis- played short-term synchronization, 10% of the pairs displayed long-term synchronization, and 8% displayed both modalities. Motor-unit synchronization level was significantly lower in the larger muscles [ tibialis anterior ( 54% short-term, 13% long-term) and deltoid (45% short-term, 12% long-term)] than in the smaller muscles [ first dorsal interosseous (7 1% short-term, 15% long- term), extensor carpi ulnar-is (74% short term, 11% long-term), and the extensor carpi radialis longus (69% short-term, 9% long- term)], and in 2 of the 11 subjects.
7. The amount of synchronization was not found to be depen- dent on the recruitment threshold of the motor units or on the difference between the recruitment thresholds of any two motor units that displayed synchronization.
8. Our results argue against the common presynaptic fiber- branches hypothesis and the muscle afferent feedback hypothesis
that have previously been used to explain the occurrence of syn- chronization.
9. We suggest that synchronization among motor-unit firings may not have a significant physiological purpose; instead, it may be a by-product of the activity of other physiological mechanisms.
10. We introduce a new hypothesis for explaining synchroniza- tion. Oscillators within the CNS drive motoneurons to fire in synchrony occasionally. This hypothesis requires no direct com- mon physical connection to drive the motoneurons and is capable of explaining all our observations.
INTRODUCTION
The phenomenon of asynchronous motor-unit firings has often been considered to be consistent with the ability of muscles to produce smooth contractions (Rack and Westbury 1969; Shiavi and Negin 1975 among others). If motor units were to fire completely synchronously, smooth muscle force production would be difficult regardless of the amount of filtering performed by compliant and viscous muscle components. Nonetheless, some degree of interde- pendence could exist without seriously jeopardizing smooth force output. Conversely, it is conceivable that syn- chronization of motor-unit firings could temporarily in- crease the force generated by the muscle by yielding a super- position of motor-unit force twitches; and if synchroniza- tion were sustained, the force output of the muscle might increase at the expense of force smoothness. Indeed, several researchers have invoked synchronization as the mecha- nism responsible for increases in the amplitude of the myo- electric signal ( Bigland-Ritchie et al. 198 1; Missiuro et al. 1962 ) . Furthermore, other researchers have associated syn- chronization with compressions in the frequency spectrum of the myoelectric signal (Naeije and Zorn 1982; Zwarts et al. 1987). Hence there exists the concern whether concur- rently active motor units operate completely independently or if the firings of groups of motor units occur at dependent latencies.
Indirect indications of synchronous motor-unit dis- charges have been reported through the analysis of the gross myoelectric signal. Inferences of synchronized motor-unit firings have been deduced from the myoelectric signal de- tected during fatigue ( Dietz et al. 1976; Lloyd 197 1; Person and Mishin 1964), in muscles that were subject to rigorous exercise ( Milner-Brown et al. 197 5 ) , during contractions in which the firing rate of motor units was constrained to a targeted value under voluntary control (Datta and Ste- phens 1990), during rhythmic contractions of respiratory muscles (Sears and Stagg 1976), and in the presence of physiological tremor (Dietz et al. 1976; Logigian et al. 1988). Although some studies (Kranz and Baumgarter
2010 0022-3077/93 $2.00 Copyright 0 1993 The American Physiological Society

SYNCHRONIZATION OF MOTOR-UNIT FIRINGS 2011
1974; Shiavi and Negin 1975 ) involving the direct observa- TABLE 1. Documentation of relevant information about the tion of motor-unit firings in man reported no significant study synchronization among motor units, most studies (Adam et al. 1978; Datta and Stephens 1990; Logigian et al. 1988; Muscle Subjects Contractions MUAPTs Pairs Mori 1975; Mori and Ishida 1976; Sears and Stagg 1976; among others) generally agree that synchronization does
iD1 5 22 71 104
exist. ECU 4 15 65 81 ECRL 4 12 35 31
Two hypotheses have been advanced to explain the occur- Deltoid 7 7 22 30 rence of synchronization. One postulates the joint occur- TA 5 27 93 128 rence of excitatory postsynaptic potentials ( EPSPs) from 001 4 8 20 17
common presynaptic fibers (Sears and Stagg 1976). The other speculates that modulations in the muscle-afferent
MUAPTs, motor-unit action-potential trains; FDI, 1 st dorsal inter- osseous; ECU, extensor carpi ulnaris; ECRL, extensor carpi radialis lon-
feedback (particularly the stretch reflex) cause motor-unit gus; TA, tibialis anterior; 001, orbicularis oris inferior. firings to synchronize (Mori 1975 ) .
, In our study motor-unit synchronization was defined as muscle by producing an “ooh” sound. In these experiments the the tendency for two motor units to fire with dependent force was not measured, but the subjects were instructed to per- latencies relative to each other more often than would be form the contractions in a consistent and similar fashion. expected if the motor units were to fire randomly but inde- Details concerning the number of subjects, contractions, num- pendently. We limited the study to constant-force contrac- ber of motor-unit action-potential trains ( MUAPTs), and num-
tions because, in this force paradigm, we were able to ob- ber of motor-unit pairs studied for each muscle are presented in
serve numerous motor units consistently. This study was Table 1 .
designed to address the following questions. What are the characteristics of synchronized firings ? How can the Acquisition of MUAPTs amount and nature of the synchronous behavior be quanti- fied and described? Does the amount and nature of synchro- MUAPTs were obtained by using the myoelectric signal acqui-
nous behavior change for different muscles and among dif- sition and decomposition technique reported by Mambrito and
ferent subjects? Is there a relationship between the recruit- De Luca ( 1983, 1984) and Stashuk and De Luca (1989). The technique is now referred to as Precision Decomposition. Three
ment threshold of motor units and the synchronous channels of myoelectric signal were detected by the use of a special- behavior? Finally, can further clarification be added to the ized quadrifilar needle electrode. These signals were amplified, cause of synchronous behavior?
Preliminary accounts of this work have been presented to the Society for Neuroscience (De Luca et al. 1984; Scala et al. 1986a,b), the American Association of Electrodiagnos- tic Medicine (Scala et al. 1986), and the International Soci- ety of Electrophysiological Kinesiology (De Luca et al. 1992).
band-pass filtered from 1 to 10 kHz, and, along with the muscle force measured from the transducer, stored on FM magnetic tape. The myoelectric signals were time compressed, digitized at 50 kHz, and decomposed into individual MUAPTs. The Precision Decomposition algorithms use template matching, template up- dating, and motor-unit firing statistics to identify individual mo- tor-unit firing times. Earlier studies have shown that the accuracy of this technique can be as high as 100% (Mambrito and De Luca 1983, 1984). All the MUAPTs analyzed in this study were decom- posed, and all the interfiring intervals were confirmed to be correct by accounting for all the action potentials identified and inspect- ing all the motor-unit action-potential trains to verify that no unex-
METHODS
Muscles and contraction paradigms studied Experiments were performed on a total of 11 subjects having no pectedly long or short firing interval was present. Figure 1 shows
known neurological disorders, with ages ranging from 20 to 59 y typical information derived with the use of the Precision Decom- r ( mean = 30, SD = 12). More than one muscle was tested in some position technique*
of the subjects. All signed an informed consent form approved by
lower limb, the tibialis anterior (TA). In separate experiments, each of these muscles was constrained to contract isometrically in
the local Institutional Review Board before participating in the experiment.
a specially designed apparatus that immobilized the adjacent joints and measured the force output with a stiff ( 3.0 N/pm) trans- ducer. The subjects were asked to sustain contractions at a con-
The following muscles were studied in the upper limb: the first
stant force of
dorsal interosseous (FDI), the extensor carpi ulnar-is (ECU), the
-30% of the maximal voluntary contraction
extensor carpi radialis longus (ECRL), the deltoid; and in the
(MVC) level. The force recording arrangements for the various experiments were executed according to established practice. Spe- cific details of the experiments have been described previously: for the FDI and the deltoid muscles see De Luca et al. ( 1982), for the TA see Broman et al. ( 1985); and for the ECU and ECRL see Creigh ( 1984).
Four of the subjects participated in a set of experiments that were performed on the orbicularis oris inferior (001) muscle lo- cated in the lower lip. The subjects were asked to contract the
units have employed the cross-correlogram of the firing time inter- vals. The cross-correlogram of point processes is a distribution of all order forward and backward recurrence times of an alternate point process with respect to a reference point process. Although
Cross-interval histogram
cross-correlograms may be appropriate for estimating motor-unit synchronization at short (near 0) latencies, they are not appro-
Previous studies (Basmajian and De Luca 1985; Datta and Ste-
priate for estimating synchronization at long latencies. Because MUAPTs have a low coefficient of variation [on the order of 15%
phens 1990; Dietz et al. 1976; Logigian et al. 1988; Sears and Stagg
in normal circumstances ( Basmajian and De Luca 1985)], each subsequent occurrence of the alternate process is not truly random
1976) directed at describing the synchronous behavior of motor
with respect to the reference process. In other words, in a cross- correlogram it is possible that the second- or third-order peaks, which occur at longer time latencies, could be dependent on the first- or second-order peaks (Perkel et al. 1967). Thus peaks at long latencies could be due to actual physiological interdepen-

2012 C. J. DE LUCA, A. M. ROY, AND 2. ERIM
MU# MU#
5 5
/ 1 1
- 0 0 b 1‘0 1‘0 1'5 1'5 20 20 25 25
TIME (s) TIME (s)
FIG. 1. FIG. 1. Represents individual motor-unit action-potential trains Represents individual motor-unit action-potential trains (MUAPTs) of 5 concurrently active motor units of the 1st dorsal inter- (MUAPTs) of 5 concurrently active motor units of the 1st dorsal inter- osseous muscle and the corresponding isometric force. Firing times of each osseous muscle and the corresponding isometric force. Firing times of each individual motor unit are depicted by vertical bars. Solid line represents individual motor unit are depicted by vertical bars. Solid line represents the force output of the muscle. the force output of the muscle.
dence or to the low coefficient of variation of the interming inter- vals, or to a combination of these two factors. We were concerned about the possibility of blurring the occurrence of long-latency peaks that might be present because of physiological interdepen- dence of the interfiring intervals. Thus we chose to use an alterna- tive approach, the cross-interval histogram.
Cross-interval histograms were constructed from pairs of MUAPTs by measuring only the first-order forward and backward recurrence times (the nearest forward and backward firing times) of the alternate motor unit with respect to each firing of a reference motor unit. The reference motor unit was chosen as the one whose MUAPT had the least number of firings. Figure 2 shows a sche- matic representation of how these measurements were made. The recurrence times were then used to increment the bins represent- ing the corresponding latencies in the cross-interval histogram. The resolution of the histogram, i.e., the binwidth, was chosen to be 2 ms. (Tests were performed with I-ms binwidths; however the variability from bin to bin reduced the distinction of the peaks in the cross-interval histograms.) The number of firings of the refer- ence motor unit ranged from 76 to 647. Figure 3 shows typical cross-interval histograms constructed by the use of this technique.
Motor Unit Train 2
(alternate)
& t, 4-c I I I L
Motor Unit Train 1
(reference)
I
Time
t, forward first order recurrence time &, backward first order recurrence time
FIG. 2. Schematic description of the forward and backward lst-order recurrence times. Firing times of each individual motor unit are depicted by vertical bars. Train 1 represents the firings of the reference (triggering) motor unit. Train 2 represents the firings of the alternate unit.
; . . . . . .
m I LLJ -60 -40 -20 0 20 40 60
. .
. . .
n B cn 30 0 1
TIME DELAY (ms) FIG. 3. A: example of a cross-interval histogram that displays short-
term synchronization. In this example the reference motor unit fired 268 times. B: example of long-term synchronization. In this example the refer- ence motor unit fired 292 times. Two outer vertical broken lines represent the average interfiring interval of the reference motor unit. These cross-in- terval histograms are from 2 pairs of motor units obtained from different trials of the tibialis anterior muscle during a 30% maximal voluntary con- traction ( MVC) .
Distribution of recurrence times It is well established (Perkel et al. 1967; among others) that for
independent point processes the probability density of the first- order forward and backward recurrence times are equal and may be expressed as
P(O = 11 - W)lIM where p(t) is the probability density function of first-order recur- rence times, F(t) is the probability distribution of the interfiring intervals of the alternate point process, and 1Mis the mean interfir- ing interval of the alternate point process.
Since the variation of the interfiring intervals for normal motor units is relatively low, having coefficients of variation on the order of 15% (Basmajian and De Luca 1985 ), the distribution F( t) has a considerably steep slope near t = A4. Hence F(t) may be approxi- mated by a step function, and the probability density p(t) may be approximated by the uniform density function
p(t) = l/M t <iW = 0 t>A4
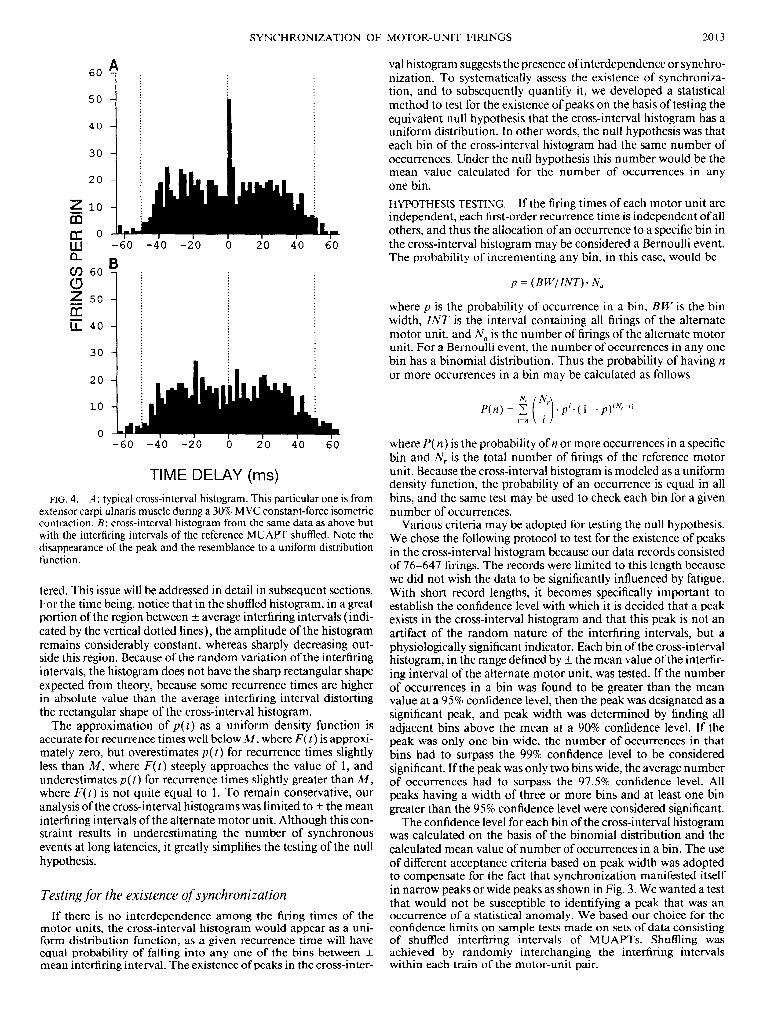
Practical justification for approximating the probability distribu- tion times of recurrence times is provided by Fig. 4, which displays a cross-interval histogram obtained from experimental data in A and a cross-interval histogram obtained by shuffling the interfiring intervals of one of the MUAPTs in B. Shuffling removes any interdependence between the firing intervals of the MUAPTs, even though the probabilistic structure of the process is kept unal-
SYNCHRONIZATION OF MOTOR-UNIT FIRINGS 2013
60 4
50 -
40 -
30 -
20 -
7 10 - m CT 0 LLl -60 -40 - CL cf) cs z - CT LL
60 B
50
40
30 /
. . .
40 60
TIME DELAY (ms) FIG. 4. A: typical cross-interval histogram. This particular one is from
extensor carpi ulnaris muscle during a 30% MVC constant-force isometric contraction. B: cross-interval histogram from the same data as above but with the interfiring intervals of the reference MUAPT shuffled. Note the disappearance of the peak and the resemblance to a uniform distribution function.
tered. This issue will be addressed in detail in subsequent sections. For the time being, notice that in the shuffled histogram, in a great portion of the region between t average interfiring intervals (indi- cated by the vertical dotted lines), the amplitude of the histogram remains considerably constant, whereas sharply decreasing out- side this region. Because of the random variation of the interfiring intervals, the histogram does not have the sharp rectangular shape expected from theory, because some recurrence times are higher in absolute value than the average interfiring interval distorting the rectangular shape of the cross-interval histogram.
The approximation of p(t) as a uniform density function is accurate for recurrence times well below M, where F(t) is approxi- mately zero, but overestimates p(t) for recurrence times slightly less than A& where F(t) steeply approaches the value of 1, and underestimates p(t) for recurrence times slightly greater than 1M, where F(t) is not quite equal to 1. To remain conservative, our analysis of the cross-interval histograms was limited to ? the mean interfiring intervals of the alternate motor unit. Although this con- straint results in underestimating the number of synchronous events at long latencies, it greatly simplifies the testing of the null hypothesis.
Testing for the existence of synchronization If there is no interdependence among the firing times of the
motor units, the cross-interval histogram would appear as a uni- form distribution function, as a given recurrence time will have equal probability of falling into any one of the bins between t mean interfiring interval. The existence of peaks in the cross-inter-
val histogram suggests the presence of interdependence or synchro- nization. To systematically assess the existence of synchroniza- tion, and to subsequently quantify it, we developed a statistical method to test for the existence of peaks on the basis of testing the equivalent null hypothesis that the cross-interval histogram has a uniform distribution. In other words, the null hypothesis was that each bin of the cross-interval histogram had the same number of occurrences. Under the null hypothesis this number would be the mean value calculated for the number of occurrences in any one bin. HYPOTHESIS TESTING. If the firing times of each motor unit are independent, each first-order recurrence time is independent of all others, and thus the allocation of an occurrence to a specific bin in the cross-interval histogram may be considered a Bernoulli event. The probability of incrementing any bin, in this case, would be
p =(BW/INT)*N,
where p is the probability of occurrence in a bin, BW is the bin width, INT is the interval containing all firings of the alternate motor unit, and N, is the number of firings of the alternate motor unit. For a Bernoulli event, the number of occurrences in any one bin has a binomial distribution. Thus the probability of having n or more occurrences in a bin may be calculated as follows
~1 N, w-0 = c
( 1 . pi. ( 1 - p)‘N,-O
i=n i
where P(n) is the probability of yI or more occurrences in a specific bin and N, is the total number of firings of the reference motor unit. Because the cross-interval histogram is modeled as a uniform density function, the probability of an occurrence is equal in all bins, and the same test may be used to check each bin for a given number of occurrences.
Various criteria may be adopted for testing the null hypothesis. We chose the following protocol to test for the existence of peaks in the cross-interval histogram because our data records consisted of 76-647 firings. The records were limited to this length because we did not wish the data to be significantly influenced by fatigue. With short record lengths, it becomes specifically important to establish the confidence level with which it is decided that a peak exists in the cross-interval histogram and that this peak is not an artifact of the random nature of the interfiring intervals, but a physiologically significant indicator. Each bin of the cross-interval histogram, in the range defined by t the mean value ofthe interfir- ing interval of the alternate motor unit, was tested. If the number of occurrences in a bin was found to be greater than the mean value at a 95% confidence level, then the peak was designated as a significant peak, and peak width was determined by finding all adjacent bins above the mean at a 90% confidence level. If the peak was only one bin wide, the number of occurrences in that bins had to surpass the 99% confidence level to be considered significant. If the peak was only two bins wide, the average number of occurrences had to surpass the 97.5% confidence level. All peaks having a width of three or more bins and at least one bin greater than the 95% confidence level were considered significant.
The confidence level for each bin of the cross-interval histogram was calculated on the basis of the binomial distribution and the calculated mean value of number of occurrences in a bin. The use of different acceptance criteria based on peak width was adopted to compensate for the fact that synchronization manifested itself in narrow peaks or wide peaks as shown in Fig. 3. We wanted a test that would not be susceptible to identifying a peak that was an occurrence of a statistical anomaly. We based our choice for the confidence limits on sample tests made on sets of data consisting of shuffled interfiring intervals of MUAPTs. Shuffling was achieved by randomly interchanging the interfiring intervals within each train of the motor-unit pair.

2014 C. J. DE LUCA, A. M. ROY, AND Z. ERIM
Quantification of synchronization For each peak where the null hypothesis was rejected, five pa-
rameters were calculated: the synch index, the motor unit synch, the peak width, the peak amplitude, and the peak location.
The Synch Index represents the percentage of synchronized fir- ings beyond what would be expected simply because of the ran- dom nature of motor-unit discharges even if the two motor-unit trains were completely independent of each other. This parameter was calculated as follows
with Synch Index = [SIG Area/(Total Ares/2)] x 100
SIG Area = Peak Area - Mean Area
Mean Area = Mean Occur l SIG Bins
Mean Occur = Total Area/Total Bins where Peak Area is the total area under the cross-interval histo- gram in the bins designated as a significant peak. Mean Area is the total area under the mean value level, in the bins designated as belonging to a significant peak, i.e., the total number of occur- rences that the cross-interval histogram would be expected to con- tain in this region due to the random nature of the signals. SIG Area is the area of the peak exceeding the expected value, i.e., the number of occurrences in the peak beyond what would be nor- mally expected from random variations. Mean Occur is the num- ber of occurrences that would be expected to fall in each bin of the cross-interval histogram even if the motor units fired indepen- dently. Totaf Bins is the number of bins into which the cross-inter- val histogram is divided. SIG Bins is the number of bins desig- nated as belonging to the peak. Total Area is the total area under the cross-interval histogram between t the average IF1 of the alter- nate MUAPT. Total Area/2 is the total number of the firings of the reference motor unit that were considered as triggers in the cross-interval histogram. This calculation is shown graphically in Fig. 5.
The Motor-Unit Synch represents the percentage of concur- rently active motor-unit pairs that contain synchronized firings. In other words, it is the ratio of motor-unit pairs that contained at least one significant peak, to the total number of motor-unit pairs studied. The Peak Width was calculated as described above. The Peak Amplitude was defined as the number of occurrences in the bin containing the highest number of occurrences, normalized by the mean value of the histogram. The Peak Location was defined as the location of the median of the occurrences in the peak width.
The statistical error associated with our technique for identify- ing and quantifying synchronization was measured as follows. For each motor-unit pair, the interfiring intervals within the alternate MUAPT were shuffled randomly. This procedure removes any interdependence among the firings of the reference and alternate motor units and should, in theory, produce uniform cross-interval histograms with no significant peaks. Figure 4 displays the cross- interval histogram for two motor units in A, and the histogram obtained for the same units after shuffling in B. Notice the flatten- ing effect of shuffling on the histogram. However, even though the interdependence between the two MUAPTs are removed, they still constitute stochastic processes, and some chance synchroniza- tion may occur. Measuring these chance occurrences by the use of the described technique provides an empirical estimate of the error level inherent in statistical evaluations of synchronization (see black areas in Figs. 10 and 11).
RESULTS
Characteristics and modalities of synchronization Synchronization of motor-unit firings occurred in bursts
of varying length (mostly of 1 or 2 consecutive discharges) that occurred sporadically throughout the contraction. A
5
0 66 40 20 20 40 60
TIME DELAY (ms)
PEAK AREA - MEAN AREA SYNCH INDEX =
TOTAL AREA /2 FIG. 5. Example illustrating how the synch index is defined. Darkened
area shows synchronous occurrences that are beyond what would be ex- pected if motor units fired independently. Horizontal dashed line shows the average value of occurrences-in a bin-whereas the solid horizontal line represents the 95% confidence level. PEAK AREA-MEAN AREA refers to the area under the cross-interval histogram in the peak region that sur- passes the expected level. TOTAL AREA refers to the total area under the histogram between & the mean IF1 of the alternate motor unit, whereas TOTAL AREA/2 represents the total number of firings of the reference motor unit that were considered in the histogram (see text for details). This example is from a 30% MVC contraction of the first dorsal inter- osseous.
visual inspection indicated that the timing of the bursts was not concurrent with any systematic behavior of the force. Examples of this behavior may be seen in Fig. 6. An analy- sis was performed to measure the number of bursts that occurred during the contractions and the number of consec- utive discharges in each burst. For this purpose we counted the number of consecutive firings in a pair of MUAPTs that had a delay that fell into the interval defined by the width and location of the peak. Figure 7 presents the result of this analysis from 111 pairs of motor units from the FDI muscle obtained during 30% MVC isometric contractions. Note that 76% of the synchronized discharges occur as single dis- charges and 16% as two consecutive discharges. We re- peated the measurements after shuffling the data to com- pare the results with those that would be expected to occur by chance. Note that synchronous firings also occurred in the shuffled data as represented by the dark bars in the same figure. However, they were more than five times more domi- nant in the natural data.
The distribution of the location of the peaks in the histo- grams was plotted in Fig. 8. The occurrences of the peaks may be separated into two categories; those that occur within *6 ms of zero time latency between the discharges, and those that occur at greater latencies. These groupings of occurrences were classified as two modalities of synchroni- zation: short-term and long-term. The terminology is adopted from previous publications (Kirkwood and Sears 1978; Sears and Stagg 1976). Figure 3 presents one exam- ple of each. In A, the peak indicating synchronization oc- curred within a few milliseconds on both sides of zero-time

SYNCHRONIZATION OF MOTER-UNIT FIRINGS 2015
-75 -50 -25 0 25 50 75
10 11 12 13 TIME DELAY (ms)
TIME (s) FIG. 8. Distribution of peak location for all contractions of all muscles. Note that most synchronous events are short term and fall into the *6-ms
FIG. 6. Examples of synchronized discharges between 3 MUAPTs. interval. Long-term synchronous peaks have latencies that occur through- These data were obtained from the first dorsal interosseous muscle during out the full range up to 75 ms. a 30% MVC constant-force contraction. Firings within a specific latency from each other are marked. Note that only 2 or 3 consecutive discharges are synchronized and that the force trace shows no apparent indication of enhanced force output at or near the time of synchronization. This exam- ple was typical of the synchronization behavior that was observed.
the synchronization parameters as a function of subject and muscle categories. The results are presented in Table 2. The percentage of synchronized firings (synch index) was statis- tically indistinguishable among the muscles studied but was statistically distinguishable (P < 0.05 ) among subjects. On the other hand, the percentage of concurrently active mo- tor-unit pairs (MU synch) that revealed synchronization varied significantly (P < 0.003) among some subjects and less significantly (P < 0.045) among different muscles. To study this apparent distinction, t tests were performed on each subgroup to further focus on the source of the statisti- cal distinction.
delay. Short-term synchronization was observed in 60% of the motor-unit pairs. In Fig. 3B two peaks are evident at approximately - 15 and +30 ms, indicating long-term syn- chronization. Long-term synchronization was observed in 10% of the motor-unit pairs; and in 8% of the pairs both modalities were observed.
Figure 9 shows that the amplitudes of the peaks of the long-term synchronization are considerably lower than those of the short-term synchronization, and the widths are approximately similar. (Statistical measurements were not performed because the variables were themselves statistical measures of other statistical variables.)
One-way analysis of variance (ANOVA) was performed to investigate if trends of significant differences existed for
Synchronization as a function of muscle
Figure 10 presents the means and standard deviations of the synchronization parameters found among all the con- tractions of all the subjects studied in the six muscles tested. Short-term synchronization was found in all the muscles, whereas long-term synchronization was seen in five out of the six muscles studied. As a reference, each bar contains a
loo- .
9 L80- cn W a
c) z 60- W . a u 3 40- c) I c) 0 m- 8 0 . z
0 1
0 NATURAL DATA n SHUFFLED DATA
black fill that indicates the mean value of the synch index calculated for the shuffled data. This information repre- sents a measure of the average stochastic noise present in these kinds of measurements.
The top panel presents the values of the synch index. For the short-term synchronization the values ranged from 0 to 40.0%. The means for the various muscles ranged from 6.68 to 9.42%, the standard deviations from 3.82 to 13.8%, and the coefficient of variation from 0.47 to 1.55. t Tests per- formed across the values for each of the muscles, revealed no significant distinction among the short-term synch in- dex of different muscles (see Table 3). The synch index for the long-term synchronization was considerably less than that observed in the short-term modality, but distinctly greater than that expected to occur by chance. The mean values ranged from 0 to 2.22% with a standard deviation of 0.80%.
L
b 1 - 8 8 8 8 2 3 4 5 6 7 8 9
NO. CONSECUTIVE DISCHARGES FIG. 7. Distribution of consecutive synchronous discharges. Number
of occurrences are represented as a percentage of the total number of syn- The bottom panel presents the values of the percentage of
chronized firings in the natural data. Note that 76% of synchronous dis- motor-unit pairs that had some degree of synchronization charges occur as single discharges, and 16Y0 occur as 2 consecutive dis- (MU synch). For the short-term synchronization the val- charges. ues ranged from 13 to 100%. The mean value of the various

2016 C. J. DE LUCA, A. M. ROY, AND Z. ERIM
A
cn W c) z W a a 3 c) 0 0 L loo-,
B
0 . cj 80- z I
601
n LONG TERM 0 SHORT TERM
400 600 % EXPECTED VALUE
L l
I I l I I
4 a 12 16 20 WIDTH (ms)
FIG. 9. A : distribution of peak amplitude values for all contractions of all muscles. Note that short-term synchronous events have a greater peak amplitude. B: distribution of peak width values in all muscles of all contrac- tions.
muscles ranged from 45 to 74%, the standard deviation from 17 to 26%, and the coefficient of variation from 0.26 to 0.58. Table 4 presents the results from the t tests per- formed among muscles; they reveal some significant associ- ation among some muscles. The smaller muscles of the up- per limb (FDI, ECU, and ECRL) are statistically indistin- guishable in terms of percentage of motor units that displayed short-term synchronization. Similarly, the behav- ior of the two large muscles, the TA and deltoid, is statisti- cally indistinguishable. However, the FDI, ECU, and ECRL are statistically distinguishable (P < 0.011 to P < 0.157) from the larger muscles, the deltoid and the TA. (A comparison with the 001 muscle was not made because the force generated by this muscle was not monitored. Thus we do not know the magnitude of the force and if the contrac-
TABLE 2. Signz$cance levels for t tests on the synchronization parameters across muscles and across subjects
Group Synch Index MU Synch
Muscle Subject
P = 0.780 P = 0.050
P = 0.045 P = 0.003
24 22 20 18 i 16 -- 14 -- 12 -- 10 --
8 -- 6 -- 4 -- 2 -- 0
T L 3I 60 0 t z I ?; 40
t
lssl FDI 30%
ECU ~30%
cl ECRL 230%
DELT 30%
m TA 30%
001
m ERROR LEVEL
SHORT LONG FIG. 10. Mean and standard deviation of the synch index and motor-
unit ( MU) synch values, obtained from all the contractions in each of the 6 muscles. Dark area represents the synch index value of shuffled data. This corresponds to an error measure of the statistical approach used. All the contractions were isometric and at 30% MVC level.
tion was isometric.) The distinction in the percentage of concurrently active motor-unit pairs that display short- term synchronization appears to be based more on size of the muscle than its location (proximal or distal) or limb (upper and lower). The percentage of motor-unit pairs that displayed long-term synchronization was considerably less than those that displayed short-term synchronization; the mean values ranged from 0 to 15% with a standard devia- tion of 5%. But the occurrence of long-term synchroniza- tion was measurably greater than that expected to occur by chance. Although our strict criteria for designating the pres- ence of a long-term peak identified only a few motor-unit pairs as displaying this modality of synchronization, those occurrences that fulfilled the significance criteria were clearly indicative of the existence of this type of modality. Further conviction of the presence of the long-term synchro- nization can be secured by referring to Fig. 3 B.
Synchronization as a function of subjects
Figure 11 presents the means and standard deviations of the synchronization parameters found among all the con- tractions of all the muscles (001 not included) studied in eight subjects. The data of both short-term and long-term synchronization are reported. The top panel presents the values of the svnch index of the short-term synchronization

SYNCHRONIZATION OF MOTOR-UNIT FIRINGS 2017
TABLE 3. Signijkance levels for t tests on the level of synchronization in pairs of motor units (synch index) among muscles
Muscle FDI ECU ECRL Deltoid TA 001
Mean
ECU ECRL Deltoid TA 001
8.0 + 5.6 (22) [0.70]
P = 0.391 P = 0.46 1 P = 0.847 P = 0.498 P = 0.787
9.4 It 4.4 (15) [0.47]
P = 0.066 P = 0.346 P = 0.072 P = 0.890
6.6 + 2.6 (12) [0.47]
P = 0.606 P = 0.775 P = 0.590
7.6 + 4.4 (7) [OS71
P = 0.799 P = 0.802
7.0 + 3.8 (27) [OS41
P = 0.525
8.8 + 13.8 (8) [1.55]
Values in Mean are means & SD with number of motor units in parentheses and coefficient of variation in brackets. For abbreviations, see Table 1.
that ranged from 0 to 19.46%. The mean values for the various subjects ranged from 3.62 to 10.42%, the standard deviation from 1.32 to 5.16%, and the coefficient of varia- tion from 0.17 to 0.94. A t test performed among the values of each subject revealed some sporadic statistical distinc- tion between some of the subjects as may be seen in Table 6, but overall the results were inconclusive, possibly because of the small number of motor-unit pairs available in most subjects. However, when the relationship of the percentage of motor-unit pairs that revealed short-term synchroniza- tion was studied, a different pattern emerged. The bottom panel presents these values. The mean values for the differ- ent subjects ranged from 37 to 79%, the standard deviation from 0 to 47%, and the coefficient of variation from 0 to 0.7 1. Table 6 presents the t tests performed among the sub- jects. Two subjects had significantly lower percentage of synchronized pairs than the rest of the subjects. However, even this result should be interpreted with some caution because the number of motor-unit pairs per subject was small.
Synchronization as a function of recruitment threshold
We were also interested in investigating if synchroniza- tion parameters were associated with the recruitment threshold of motor units (during 30% MVC contractions). Figure 12 presents the data on the recruitment threshold: synchronization interaction. When the recruitment thresh- old of the reference motor unit of pairs with some synchro- nization is plotted against the recruitment threshold of the alternate motor unit, most of the data points fall below the diagonal. This is so because the motor units with the fewer number of firings, which is generally the one with the greater recruitment threshold, was designated as the refer- ence motor unit. However, other than this, the plot reveals
no associative pattern between the recruitment thresholds of motor-unit pairs that displayed synchronization.
When synch index of motor-unit pairs was plotted as a function of the difference of the recruitment thresholds, no systematic relationship was evident. When the location of the short-term and long-term synchronization peaks of the cross-interval histograms were plotted as a function of the threshold difference, a clustering around zero time (0.54 t 2.38 ms, mean t SD) was noticeable throughout the range of threshold differences. This indicates that short-term syn- chronization has a distribution about t = 0 and that it oc- curs between motor units of all thresholds. Also, we can observe the following characteristics of synchronization. I ) There are relatively fewer occurrences ( 56 vs. 246) of long- term synchronization as compared with short-term synchro- nization. 2) The values of the latencies of long-term syn- chronization appear to be unrelated to the difference in the threshold of the two motor units. 3) The value of the synch index appears to be unrelated to the recruitment threshold of the reference motor unit. 4) The value of the synch index appears to be unrelated to the difference in the recruitment threshold.
The patterns of the data in Fig. 12 were also noted when the data were plotted separately for each muscle, providing assurance that the noted behavior was not an accidental fortuitous superposition of the data.
DISCUSSION
As indicated in the introduction, during the past three decades there have been conflicting reports on the existence of synchronization among motor units in human muscles. However, the majority of reports agree that synchroniza- tion does exist. Noteworthy among the supporting reports are the studies of Buchthal and Madsen ( 1950), who
TABLE 4. Sign&ance levels for t tests on the percentage of concurrentlyjring motor units that contain short-term synchronized Jirings (MU synch) among muscles
Muscle FDI ECU ECRL Deltoid TA 001
Mean
ECU ECRL Deltoid TA 001
71 + 26 (12) [0.36]
P = 0.792 P = 0.852 P = 0.100 P = 0.05 1 P = 0.203
74 2 19 (14) [0.26]
P = 0.637 P = 0.027 P = 0.011 P = 0.068
69 AI 22 (6) [0.32]
P = 0.155 P = 0.157 P = 0.233
45 + 26 (4) [0.58]
P = 0.464 P = 0.787
54 k 22 (21) [0.40]
P = 0.758
50& 17(3) [0.33]
Values in Mean are means k SD with number of motor units in parentheses and coefficient of variation in brackets. Note that the 001 is not compared with the TA and deltoid because the force of contraction in the 001 was not 30% maximal voluntary contraction and the contraction was not known to be isometric. For abbreviations, see Table 1.

C. J. DE LUCA, A.. M
u ABCDEFGH
120 T ‘0‘ k 80 c zc I
4 60
> 0 40 3 = 20
t
FIG. 11.
ABCDEFGH
ABCDEFGH ABCDEFGH
SHORT LONG Mean and standard deviation of the synch index and MU
synch values obtained from 8 of the subjects (indicated by a letter). Dark area represents the values of shuffled data. This corresponds to an error measure of the statistical approach used. All the contractions were isomet- ric and at 30% MVC level.
worked with human biceps and various small muscles of the hand; Dietz et al. ( 1976)) who worked with the FDI and the triceps surae; Sears and Stagg ( 1976) with the intercos- tal muscles of cats and one human; Mori ( 1975) with the TA; Datta and Stephens ( 1990) with the FDI; and Logigian et al. ( 1988) with the extensor carpi radialis brevis. All the previous investigations were bounded by technical limita- tions and restricted to analyzing data that were collected during low level contractions, typically at values of 0.5- 1 N in the muscles of the hand and forearm. Our results, which also provide clear evidence of synchronization, extend the force range of observation to 30% MVC (generally 5-7 N for the FDI) representing a fivefold increase in the force level.
To reiterate, in this study synchronization was defined as the tendency for two motor units to fire with dependent latencies relative to each other more often than if the motor units fired independently. Therefore synchronization im- plies that the discharge times of groups of motor units are dependent. Unlike the common drive phenomenon (De Luca et al. 1982), which is based on the trends in the mo- tor-unit firing rates, synchronization is based on individual discharge times. The procedures used to statistically test for synchronization between motor-unit pairs were based on cross-interval histograms similar to those suggested by Per- kel et al. ( 1967) and previously used by Shiavi and Negin ( 1975) and Kranz and Baumgarter ( 1974). The use of cross-interval histograms limits the analvsis to first-order
ROY, AND Z. ERIM
effects, avoids the problems of periodic peaks in the cross- correlation histograms as reported by Perkel et al. ( 1967 ), and allows for a robust and simple bin-by-bin statistical determination of dependent latencies.
We found two modalities of synchronization: short-term synchronization and long-term synchronization. The short-term synchronization was characterized by a sharp peak in the cross-interval histogram that had a width of less than t6 ms. Similar observations have been reported from other studies (Datta and Stephens 1990; Kirkwood and Sears 1978; Logigian et al. 1988; Sears and Stagg 1976). But unlike all these previous investigators, we did not find any meaningful (only 1.2% of the cases) short-term synchroni- zation with a peak width greater than t 10 ms. Instead, we found a previously unreported modality of synchronous be- havior: long-term synchronization that manifested itself in relatively lower amplitude peaks having relatively similar width and centered at latencies ranging from 8 to 76 ms. This mode of synchronization was found in all 11 subjects and in 5 out of the 6 muscles investigated, with the singular exception of the 001. Although clearly present, long-term synchronization was relatively rare compared with the short-term synchronization; it was found in only 10% of the motor-unit pairs. The value of the relative latency of the long-term synchronization showed no systematic relation- ship to the individual muscles, to the absolute and relative recruitment threshold of the motor units. One possible rea- son for this modality of synchronization not being observed by previous investigators may be due to our use of the first- order cross-interval histogram rather than the cross-correla- tion histogram most commonly used by previous re- searchers. As discussed in METHODS, the first-order cross- interval histogram has the potential of providing a crisper view of the behavior of long-term synchronization. Also, we have data in which all the interfiring intervals were identi- fied correctly through our Precision Decomposition tech- nique.
Short-term synchronization had peaks that were cen- tered around zero time delay (0.54 t 2.38 ms) for all the motor-unit pairs investigated. It may be seen in Fig. 12 that the location of the peaks did not become biased away from zero as a function of the difference between the recruitment threshold of the two motor units. This observation indi- cates that the relative time delay between two motor units displaying short-term synchronization is not likely to be due to the relative difference in the conduction velocity of the axons innervating the two motor units. Were this so, the expected increase in the conduction velocity between two motoneurons recruited further apart would shift the center of the synchronization peak. The most likely explanation for short-term synchronization remains that originally mathematically and empirically affirmed by Kirkwood and Sears ( 1978 ) ; which is, two motoneurons are excited at, or nearly at, the same time and the two time courses of the raised probability of firing vary slightly between the two motoneurons, thereby resulting in positive and negative rel- ative latencies of a few milliseconds.
Our data indicated that the amount of synchronization (synch index) was considerably low, with only an average of 8.0% of the firings being short-term synchronized, and 1.0% being long-term synchronized. Although difficult to compare with svnchronization measures of previous re-

SYNCHRONIZATION OF MOTOR-UNIT FIRINGS 2019
FIG. 12. Synchronization parameters as a function of motor-unit recruitment threshold. Motor-unit I is the trig- gering unit, and motor-unit 2 is the alternate unit. The sym- 601 THR refers to recruitment threshold and THR 1 -THR2 is the difference in the thresholds of the 2 motor units tested. Synch Index is the measure of the synchronization and Synch Lot is the location of the peak in the histogram indi- cating the latency of synchronization.
32
'0' b
28
- 24
a 20
r\ 16 z 12
ZC 8
9 4 > O 0
28 -
24 -
20 -
16 -
12 -
8-
4- 0 0
-30 -20 -10 0 10 20 30
THR MU1 (%MVC) THFWTHR2 (%MVC)
ports, in general our values of the amount of synchroniza- tion were comparable with those reported by Sears and Stagg (1976), Dietz et al. (1976), Logigian et al. (1988), and Nordstrom et al. ( 1992). But they were considerably less than those observed by Datta and Stephens ( 1990), who, using their own measures, reported more synchroniza- tion than found in other reports. The discrepancy may be due to the procedure they employed to collect the data, in addition to the different synchronization index used. In their experiments isometric contractions in which the force level was slowly increased (ramped) were used to deter- mine recruitment level. The subject was then requested to make a contraction such that both units fired continuously with one, unit A, firing at 10 pulses/s. Hence the controlled parameter in their experiments was the firing rate, whereas in ours, it was the force output of the muscle. Furthermore, almost all their data were collected at force levels <l N, allowing them to observe a limited group of low-threshold motor units. It is also highly probable that at such low force levels, the motor units that they observed were active at a level very close to their recruitment thresholds, and hence their firings were unstable. Our protocol involved force lev- els up to 7 N, allowing for motor units of a much larger range of recruitment thresholds to be studied when they have reached stable firing rates.
The synch index was statistically indistinguishable among the FDI, ECU, ECRL, TA, and deltoid muscles (see Table 3 for details). In contrast, the number of concur- rently active motor-unit pairs that displayed synchronized firings was found to differ among muscles. The larger mus- cles, the TA and the deltoid, had statistically significant lower percentages ( 54 and 45, respectively) of synchro- nized concurrently active motor-unit pairs than all the other smaller muscles (ranging from 69 to 74%), which were tested at 30% MVC level (see Table 4 for details). When the data were analyzed as a function of subjects, the
synch index was found to be occasionally statistically distin- guishable among some subjects, but no systematic interac- tion could be noted ( see Table 5 for details). The MU synch was found to be lower (43 and 37%) in two subjects, and statistically indistinguishable among the rest of the subjects (ranging from 59 to 79%; see Table 6 for details). These two subjects had no outwardly manifested neurological distinc- tions.
Thus, when synchronization does occur, the amount ap- pears to be reasonably consistent for all muscles and sub- jects tested. But the number of concurrently active motor units that become synchronized can vary in different mus- cles and different subjects.
Like Dengler et al. ( 1984), we also found that motor-unit firings occurred in bursts or clusters that appeared at spo- radic intervals during the contraction. But unlike Datta and Stephens ( 1990), we did not observe an inverse relation- ship between synch index and recruitment threshold, and the synch index was not dependent on the difference in the recruitment threshold of the motor units.
Mechanisms of synchronization
Two primary mechanisms have been hypothesized to ex- plain the occurrence of synchronization.
I ) Feedback mechanism. Two motoneurons receive feedback from the stretch reflex, recurrent inhibition, and other peripheral mechanisms that have a common effect on the excitation or inhibition of two motoneurons, causing synchronous discharges to occur for a few consecutive fir- ings. This hypothesis was introduced by Hammond et al. ( 1956 ) and Halliday and Redfern ( 1956 ) . It has been sup- ported recently by Logigian et al. ( 1988 ) .
2) Common physical-connection mechanism. Two moto- neurons receive common input from two branches of a common stem presynaptic fiber. This concept was first in-

2020 C. J. DE LUCA, A. M. ROY, AND 2. ERIM
TABLE 5. Statistics of the level of synchronization in pairs of motor units (synch index) among subjects
Subject PF AR MR NP HB JV ss YM ME AK MM
Mean 6.2 +_ 2.8(12) 9.4 i 5.0 (19) 3.6 f 3.4 (5) 9.2 + 4.0 (4) 7.2 + 4.8 (6) 5.2 +- 2.6 (7) 7.0 + 3.0 (4) 10.4 f 5.2 (9) 5.6 + 3.8 (4) 7.8 + 1.4 (3) 10.2 + 2.4 (3) [0.47] [O-53] [0.94] [0.42] [0.66] [0.53] [0.44] [0.50] [0.70] [O. 171 [0.24]
AR P = 0.049 MR P= 0.133 P = 0.024 NP P= 0.114 P = 0.925 P = 0.054 HB P = 0.574 P = 0.341 P = 0.192 P = 0.502 JV P = 0,427 P = 0.040 P = 0.420 P = 0.065 P= 0.334 ss P = 0.657 P= 0.351 P= 0.172 P= 0.394 P = 0.926 P = 0.321 YM P = 0.027 P = 0.625 P = 0.022 P = 0.690 P = 0.245 P = 0.027 P = 0.243 ME P = 0.718 P= 0.157 P = 0.457 P = 0.225 P = 0.571 P= 0.832 P= 0.583 P = 0.120 AK P= 0.369 P = 0.582 P = 0.094 P= 0.579 P= 0.841 P= 0.142 P= 0.674 P= 0.419 P = 0.378 MM P = 0.049 P= 0.831 P = 0.029 P = 0.740 P = 0.359 P = 0.024 P = 0.203 P= 0.930 P= 0.113 P = 0.224
Values in Mean are means + SD with number of motor units in parentheses and coefficient of variation in brackets.
traduced by Sears and Stagg ( 1976) and has been supported recently by Datta and Stephens ( 1990).
Both of these hypotheses fail to account for all of the findings of our study, especially that regarding the existence of long-term synchronization. The first shortcoming of the mechanism involving the dominance of the input from the feedback loops is revealed by the levels of synchronization in the 001 and FDI muscles, two muscles whose structure and function of feedback mechanisms differ considerably. In these muscles the average values of the synch index of the short-term synchronization were essentially similar to those of the other muscles. (Although the contractions of the 001 muscle were not performed with the same control over the generated force, it is reasonable to compare the measures of synchronization in a qualitative manner.) It is generally agreed that the 001 does not contain spindles (Abbs and Cole 1982; Bruesch 1944), and Renshaw feedback has not been reported in this muscle. It is true that weak reflexes have been observed in response to mechanical excitation; however, it has been suggested that they are primarily noci- ceptive in nature (Abbs and Cole 1982), whereas the FDI muscle is known to have an average density of spindles comparable with other muscles of the upper limb (Peck et al. 1984). Also, recent work by Rossi and Mazzocchio ( 199 1) indicates that the more distal muscles, such as the intrinsic muscles of the foot and in the FDI (A. Rossi, per- sonal communication), do not exhibit recurrent inhibition. Thus it is likely that the FDI may similarly lack recurrent inhibition. Given that one muscle (001) contains no spin- dles and that the other (FDI) contains an average density of spindles, and neither is likely to exhibit recurrent inhibi- tion, it follows that during the constant-force isometric con-
tractions studied, the stretch reflex and recurrent inhibition feedback mechanisms may not play an important role in inducing synchronization. Nonetheless, it remains conceiv- able that in rhythmic contractions such as postural adjust- ments (studied by Mori 1975) and breathing (studied by Sears and Stagg 1976) the stretch reflex loop may play a relevant role. But this possibility remains to be proven.
There is another argument that further reduces confi- dence in the feedback mechanism: the presence of long- term synchronization. Recurrent inhibition cannot be in- voked to explain long-term synchronization, even in mus- cles that do exhibit recurrent inhibition, because the relative latency reaches high values (76 ms) that are consid- erably beyond the time-loop delays of this system. The stretch reflex also could not account for long-term synchro- nization, because the location of the long-term synchroniza- tion peak was not related to the difference in the recruit- ment thresholds of the two motor units in the pair, as shown in Fig. 12. According to the generally accepted size principle, higher threshold motor units generally consist of motoneurons that have axons with larger diameters and greater conduction velocities. If the stretch reflex feedback were involved in inducing synchronization, one would ex- pect the location of the peak to be inversely related to the magnitude of the difference between the threshold differ- ences of the motor-unit pair. Our data do not support this expectation ( see Fig. 12 ) . Also, the stretch reflex argument would predict that the peak location for the deltoid muscle would occur at considerably shorter latency than that of the FDI. Our data do not support this expectation. Instead we found the location of the long-term synchronization peak of the deltoid to range from 10 to 32 ms and that of the FDI
TABLE 6. Statistics of the percentage of concurrentZyJiring motor units that contain short-term synchronizedfirings (MU synch) among subjects
Subject PF AR MR NP HB JV ss YM
Mean
AR MR NP HB JV ss YM
64 k 24 (10) [0.37]
P = 0.165 P = 0.736 P = 0.848 P = 0.090 P = 0.020 P = 0.912 P = 0.250
76 AI 16 (13) 59+ 13(3) 67 k 0 (4) 43 + 16 (5) 37* 13(6) 67 AI 47 (2) 79 AZ 25 (7) [0.2 I] [0.22] [O.OO] [0.36] [0.35] [0.7 l] [0.32]
P= 0.110 P = 0.260 P = 0.286 P = 0.001 P = 0.173 P = 0.019 P = 0.000 P = 0.042 P = 0.002 P = 0.500 P = 0.545 P = 0.799 P = 1.000 P = 0.307 P = 0.154 P = 0.793 P = 0.249 P = 0.375 P = 0.018 P = 0.003 P = 0.626
Values in Mean are means + SD with number of motor units in parentheses and coefficient of variation in brackets.

SYNCHRONIZATION OF MOTOR-UNIT FIRINGS 202 1
to range from 8 to 50 ms. It is hypothetically possible to conglomerate a sequence of interactions between the stretch reflex loop and recurrent inhibition that could pro- duce the behavior seen in the peaks of the long-term syn- chronization. However, such a scenario would be entirely speculative and considerably imaginative.
The second mechanism advanced to explain synchroniza- tion, that based on common physical connections, is partic- ularly inviting in light of the work by Fetz and Cheney ( 1980), who provided circumstantial evidence for the exis- tence for a common physical input, and the work of Shin- oda et al. ( 198 1 ), who, by staining and electrophysiological techniques, were able to observe that some corticospinal axons gave off branches that terminated in different moto- neuron pools. However, there are three main questions that the common physical-connection mechanism leaves unan- swered. 1) Why is the amount of synchronization so low (8.0% short-term, 1 .O% long-term)? 2) Why does synchro- nization occur in sporadic bursts? 3) How is it possible to observe latencies as long as 76 ms?
The first two points raise questions about the significance of connectivity as the common branches hypothesis pro- poses. If the “hard wiring” of the system were the predomi- nant factor affecting synchronization, firings of motor-unit pairs that displayed any synchronization would have a ten- dency to synchronize in longer bursts, and the degree of synchronization would be considerable, because the branches of the presynaptic fibers would provide dominant excitation to the motoneurons. However, we observe that only -8% of the discharges are synchronized and that this synchronization occurs in bursts. Moreover, if common stem presynaptic branches are assumed to be the reason for synchronization, no explanation can be found for the long latencies observed, considering the conduction velocity dif- ferences and the distances involved.
We prefer to engage a different point of view in interpret- ing synchronization; we employ the concept of neuronal oscillators. In 1967 Bernstein proposed the existence of a central timing mechanism for regulating and coordinating motor activity. Two decades later, Llinas and Yarom ( 1986) found an 8- to 1 ~-HZ oscillator in the neurons of the inferior olive. They hypothesized that oscillators of this kind act as pacemakers for sensorimotor integration, thus possibly explaining the ubiquitous physiological tremor. Oscillators have also been commonly observed as alpha and theta waves from the brain in humans, and reports of gangli- onic oscillators in invertebrates are becoming more fre- quent (Elble and Koller 1990). Although it is often conve- nient to conceptualize oscillators as individual neurons that have regular repetitive discharges, it is also possible to con- struct an oscillator from a neuronal network, whose neu- rons are interconnected in such a manner as to produce oscillations (Kepler et al. 1990; Sharp et al. 1992; Smale 1974). Thus, from a conceptual point of view, an oscillator mechanism has a reasonable basis for being a candidate to explain the occurrence of synchronization.
Consider the arrangement presented in Fig. 13. Oscillator 1 interacts with both motoneurons, whereas oscillator 2 in- teracts only with motoneuron 2. Each motoneuron has a set of excitatory and inhibitory inputs that consist of all the other peripheral and central connections to the motoneu- Tons. These sets are not necessarily identical for each moto-
Central and Peripheral Inputs
E, ‘1 I* E*
+ +
‘?p_:‘i?\ (+’ 01 Jo2
FIG. 13. Schematic diagram suggesting a possible arrangement of oscil- lators that could explain the observed synchronous behavior. E, excitatory inputs; I, inhibitory inputs; T, recruitment thresholds of motor units; 0, oscillators.
neuron. The firing of a motoneuron is determined by the excitation it receives, i.e., the algebraic sum of all the inputs that converge on it. In general, the excitation from the in- puts other than the oscillators may be dominant enough (either in a positive or negative direction) to determine whether the motoneuron will fire. On occasion, when the net excitation to a motoneuron is just below that required to make it fire, the excitatory input from an oscillatory is sufficient to induce the motoneuron to fire.
For the time being, the two oscillators are assumed to have nearly similar firing rates, to be entrained, and to be phase shifted by a time interval, 7. A more detailed analysis must consider factors such as the regularity of the firings of each oscillator, the relationships of the firing rates of the two oscillators, the stability of the phase relationship be- tween the firings of the two oscillators, differences in the conduction time delays in the different outputs of the oscil- lators, and refractory periods of the motoneurons that are synchronized. Under the above assumptions, the four dis- tinct physiological conditions that can arise (i.e., non- synchronized firing activity, short-term synchronization, long-term synchronization, and the simultaneous occur- rence of both short- and long-term synchronization) can be explained via the model as follows.
I ) Nonsynchronizedjring. Inputs other than those of the oscillators are prevalent in causing the motoneurons to reach their firing thresholds. Hence the two motoneurons have no tendency to fire at the same time or at fixed inter- vals from each other.
2) Short-term synchronization. Input from the common oscillator is crucial in bringing the net excitation levels of both motoneurons above their respective thresholds. Thus the two motoneurons have a tendency to reach their firing thresholds at the same time or at a short interval from each other.
3) Long-term synchronization. Input from oscillator 1, combined with the other central and peripheral inputs, is sufficient to bring motoneuron I above its firing threshold. However, it is not sufficient to bring motoneuron 2 to its threshold. On the other hand, input from oscillator 2 (which has a delay of 7 compared with oscillator 1) is able to increase the net excitation to motoneuron 2 beyond the threshold level. Hence the two motoneurons have a ten- dency to fire at a latency of 7 with respect to each other.

2022 C. J. DE LUCA, A. M.
4) Concurrent short-term and long-term synchronization. Inputs from both oscillators are critical in bringing the net excitation levels of the two motoneurons above their re- spective thresholds. At some instances throughout the con- traction, oscillator 1 drives the motoneurons to fire at close instances to each other, whereas at other instances oscilla- tor 1, combined with other inputs, brings motoneuron I to its threshold (but not motoneuron 2), whereas input from oscillator 2 (which has a delay of 7 compared to oscillator 1) is sufficient to force motoneuron 2 over its threshold. Hence the two motoneurons have a tendency to reach their firing thresholds at two different latencies with respect to each other, one close to zero and the other longer, corre- sponding to the delay, 7, between the two oscillators.
For the mathematically inclined reader, the operation of the model can be described by the following equations
Motoneuron I z E’,‘)(t) - 5 Iii)< t) - T, + O,(t) 2 0 i=l i=l
Motoneuron 2 i Ey)( t) - 2 I(2)(t) - T2 + O,(t) + O,( t - T) 2 0 i=l i=l
where t is the time; 7 is the time delay in the order of the long-term synchronization latency; E\‘)( t) is the ith excit- atory input to motoneuron 1, where i ranges from 1 to 1M; Ey)( t) is the ith excitatory input to motoneuron 2, where i ranges from 1 to J; Pf) is the ith inhibitory input to moto- neuron 1, where i ranges from 1 to N; Z’,i)( t) is the ith inhibitory input to motoneuron 2, where i ranges from 1 to K; 0, (t) and O,( t) are the excitatory inputs from oscillator 1 and oscillator 2; A4 and J are the total number of excit- atory inputs to motoneuron 1 and motoneuron 2, respec- tively; N and K are the total number of inhibitory inputs to motoneuron 1 and motoneuron 2, respectively; and T, and & are the excitation thresholds of motoneuron 1 and moto- neuron 2, respectively; for the present discussion these are assumed to be constant.
The proposed model is able to account for all the obser- vations noted in this paper, including those that prove to be the most problematic for the theories advanced so far to explain synchronization. Let us consider the primary ones individually.
1) Long-term synchronization. As described above, the presence of the second oscillator, with a phase shift (on the order of long-term synchronization latencies) with respect to the common oscillator, is able to explain the existence of long-term synchronization.
2) The sporadic and variable-length nature of the bursts of synchronized discharges that occur during constant force isometric contraction. The weak dominance of the oscilla- tor would be persistently suppressed at random by the chance superposition of the peripheral and central inhibi- tory inputs, and the fluctuations in the central drive to the motoneurons.
3) The presence of synchronization in the 001 muscle, which, in all likelihood, contains no spindles. The oscillator concept does not require afferent inputs to synchronize mo- toneurons.
For all the above considerations the model that we are submitting to further discussion and elaboration seems to be appropriate for explaining the available information concerning synchronization during constant-force isomet-
ROY, AND Z. ERIM
ric contractions. Even if it appears to be, perhaps, too ab- stract and to contain parameters not yet clearly defined, it does account for all the experimental findings and does not fall into the pitfall of overspecifying the physiological de- scription that leads to contradictions with available data. The use of oscillators to explain our results is not without precedence. Oscillators have been found to be useful in ex- plaining tremor; for a review see Elble and Koller ( 1990). It is conceivable that pathological tremor may be caused by an increased drive from the neuronal oscillators that more effectively overcome the ambient inhibitory inputs to the motoneurons.
Consequences of synchronization
Given that synchronization has been seen to occur among only a small percentage (8.0% short-term, 1.0% long-term) of the motor-unit firings, not in all the concur- rently active motor units (60% short-term, 10% long-term), only at sporadic intervals, and in short bursts, the question arises as to the purpose of synchronization.
The occurrence of synchronization has been invoked to explain increases in the amplitude of the myoelectric signal ( Bigland-Ritchie et al. 198 1; Missiuro et al. 1962) and com- pressions in the frequency spectrum of the myoelectric sig- nal (Naeije and Zorn 1982; Zwartz et al. 1987) during sus- tained contractions. Our data indicate that such an explana- tion should be seriously cautioned. Synchronization occurs in bursts and sporadically; any one episode of synchroniza- tion is not sustained beyond a few (typically ~3) consecu- tive firings. See Figs. 6 and 7 for details. These characteris- tics are counter-indicative to rendering an increase in the myoelectric signal amplitude.
Also, it has been postulated that motor units synchronize to increase the total force output of the muscle fibers. Our data do not support this conjecture. Two of our observa- tions argue against this conjecture. First, as apparent in Fig. 6, the net force output does not consistently increase during episodes of synchronization. Second, synchronization oc- curs in short ( l- or 2-firing) sporadic bursts. Albeit, the measured force represents the net force at the joint, it is nonetheless difficult to envision compensatory antagonistic mechanisms that would obliterate a net force increase.
The observations made in this study all indicate that syn- chronization of motor-unit firings may not have a signifi- cant physiological purpose in generating constant-force con- tractions. It appears more likely that synchronization is a by-product of other physiological mechanisms that are de- signed to perform other physiologically significant func- tions.
We are grateful to Dr. D. Stashuk for assistance in the statistical analysis, Dr. James Collins for general comments, G. Scala for performing some of the data analysis, Drs. G. Kamen and Y. Masakado for collecting some of the data, and H. Batra for technical assistance.
This work was supported financially by Liberty Mutual Insurance Co. and the Rehabilitation Research and Development Service of the Veterans Administration.
Address for reprint requests: C. J. De Luca, NeuroMuscular Research Center, Boston University, 44 Cummington St., Boston, MA 022 15.
Received 11 February 1993; accepted in final form 18 June 1993.

SYNCHRONIZATION OF MOTOR-UNIT FIRINGS 2023
REFERENCES
ABBS, J. H., AND COLE, K. J. Consideration of bulbar and suprabulbar afferent influences upon speech motor coordination and programming. In: Speech Motor Control, edited by S. Grillner, B. Lindblom, J. Lubker, and A. Persson. Oxford, UK: Pergamon, 1982, p. 159-l 86.
ADAM, D., WINDHURST, U., AND INBAR, G. F. The effect of recruitment inhibition on the cross correlated firing patterns of motoneurons (and their relation to signal transmission in the spinal cord-muscle channel.) Biol. Cybern. 29: 229-235, 1978.
BASMAJIAN, J. V. AND DE LUCA, C. J. lMu.scZes Alive ( 5th ed.). Baltimore, MD: Williams & Wilkinson, 1985, p. 132-138.
BERNSTEIN, N. The Co-ordination and Regulation ofMovements. Oxford, UK: Pergamon, 1967.
BIGLAND-RITCHIE, B., DONVAN, E. F., AND ROUSSOS, C. S. Conduction velocity and EMG power spectrum changes in fatigue of sustained maxi- mal efforts. J. Appl. Physiol. 5 1: 1300- 1305, 198 1.
BROMAN, H., BILOTTO, G., AND DE LUCA, C. J. Myoelectric signal con- duction velocity and spectral parameters: influence of force and time. Appl. Physiol. 32: 1428-1437, 1985.
BRUESCH, S. R. The distribution of myelinated afferent fibers in the branches of the cat’s facial nerve. J. Cump. Neural. 8 1: 169- 183, 1944.
BUCHTHAL, F. AND MADSEN, A. Synchronous activity in normal and atro- phic muscle. Electroencephalogr. Clin. Neurophysiol. 2: 425-444, 1950.
CREIGH, J. L. Motor Unit Interactions of a Synergist/Antagonist Muscle Pair (M. S. thesis). Cambridge, MA: MIT, 1984.
DATTA, A. K. AND STEPHENS, J. A. Synchronization of motor unit activity during voluntary contractions in man. J. Physiol. Land. 422: 397-4 19, 1990.
DE LUCA, C. J., LEFEVER, R. S., MCCUE, M. P., AND XENAIUS, A. P. Behavior of human motor units in different muscles during linearly varying contractions. J. Physiol. Lond. 329: 13- 128, 1982.
DE LUCA, C. J., BROMAN, H., AND MAMBRITO, B. Synchronization of motor units within different muscles. Proc. 14th Annu. Meet. Sot. Neur- osci. 905, October, 1984, p. 802.
DE LUCA, C. J., ROY, A. M., AND ERIM, Z. Synchronization of motor unit firings in several human muscles. 9th Int. Congr. Int. Sot. Electrophy- siol. Kinesiology, Florence, Italy, June 1992, p. 149.
DENGLER, R., WOLF, W., BIRK, P., AND STRUPPLER, A. Synchronous dis- charged in pairs of steadily firing motor units tend to form clusters. Neurosci. Lett. 47: 167- 172, 1984.
DIETZ, V., BISCHOFBERGER, E., WITA, G., AND FREUND, H. J. Correlation between the discharge of two simultaneously recorded motor units and physiologic tremor. Electroencephalogr. Clin. Neurophysiol. 40: 97- 105, 1976.
ELBLE, R. J. AND KOLLER, W. C. Tremor. Baltimore, MD: Johns Hopkins Univ. Press, 1990.
FETZ, E. E. AND CHENEY, P. D. Postspike facilitation of forelimb muscle activity by primate corticomotoneuronal cells. J. Neurophysiol. 44: 751-772, 1980.
HALLIDAY, A. M. AND REDFERN, J. W. T. An analysis of finger tremor in healthy subjects. J. Physiol. Land. 134: 600-6 11, 1956.
HAMMOND, P. H., MERTON, P. A., AND SUTTON, C. G. Nervous gradation of muscular contraction. Br. Med. Bull. 12: 2 14-2 18, 1956.
HINES, M. AND TOWER, S. S. Studies on the innervation of skeletal mus- cles. Bull. Johns Hopkins Hosp. 42: 264-27 1, 1928.
KEPLER, T. B., MARDER, E., AND ABBOTT, L. F. The effect of electrical coupling on the frequency of model neuronal oscillators. Science Wash. DC 248: 83-85, 1990.
KIRKWOOD, P. A. AND SEARS, T. A. The synaptic connections to the inter- costal motoneuron as revealed by the average common excitation po- tential. J. Physiol. Lond. 275: 103-l 34, 1978.
KRANZ, H. AND BAUMGARTER, G. Human alpha motoneuron discharge, a statistical analysis. Brain Res. 67: 324-329, 1974.
LLINAS, R. AND YAROM, Y. Oscillatory properties of guinea-pig inferior
LLOYD, A. J. Surface electromyography during sustained isometric con- tractions. J. Appl. Physiol. 30: 7 13-7 19, 197 1.
LOGIGIAN, E. I., WIERZBICKA, M. M., BRUYNINCKX, F., WEIGNER, A. W., SHAHANI, B. T., AND YOUNG, R. R. Motor unit synchronization in physiologic, enhanced physiologic, and voluntary tremor in man. Ann. Neural. 23: 242-250, 1988.
MAMBRITO, B. AND DE LUCA, C. J. Acquisition and decomposition of the EMG signal. In: Progress in Clinical Neurophysiology. Computer-Aided Electromyography, edited by J. E. Desmedt. Basel: Karger, 1983, vol. 10, p. 285-306.
MAMBRITO, B. AND DE LUCA, C. J. A technique for the detection, decom- position and analysis of the EMG signal. Electroencephalogr. Clin. Neu- rophysiol. 58: 175- 188, 1984.
MILNER-BROWN, H. S., STEIN, R. B., AND LEE, G. L. Synchronization of human motor units: possible roles of exercise and supraspinal reflexes. Electroencephalogr. Clin. Neurophysiol. 38: 245-254, 1975.
MISSIURO, W., KIRSCHNER, H., KOZLOWSKI, S. Electromyographic mani- festation of fatigue during work of different intensity. Acta Physiol. Pal. 13: 11-23, 1962.
MORI, S. Entrainment of motor unit discharges as a neuronal mechanism of synchronization. J. Neurophysiol. 38: 859-870, 1975.
MORI, S. AND ISHIDA, A. Synchronization of motor units and its simula- tion in parallel feed-back system. Biol. Cybern. 2 1: 107- 111, 1976.
NAEIJE, M. AND ZORN, H. Relation between EMG power spectrum shifts and muscle fiber action potential conduction velocity changes during local muscular fatigue in man. Eur. J. Appl. Physiol. 50: 23-33, 1982.
NORDSTROM, A. M., FUGLEVAND, A. J., AND ENOKA, R. M. Estimating the strength of common input to human motoneurons from the cross- correlogram. J. Physiol. Lond. 453: 547-574, 1992.
PECK, D., BUXTON, D. F., AND NITZ, A. A comparison of spindle concen- tration in large and small muscles acting in parallel combinations. J. Morph. 180: 243-252, 1984.
PERKEL, D. H., GERSTEIN, G. L., AND MOORE, G. P. Neuronal spike trains and stochastic processes. II. Simultaneous single spike trains. Biophys. J. 7: 419-440, 1967.
PERSON, R. S. AND MISHIN, L. N. Auto and cross-correlation analysis of the electrical activity of muscles. Med. Electron. Biol. Eng. 2: 155- 159, 1964.
RACK, P. M. H. AND WESTBURY, D. R. The effects of length and stimulous rate on the tension in the isometric cat soleus muscle. J. Physiol. Lond. 204: 443-460, 1969.
ROSSI, A. AND MAZZOCCHIO, R. Presence of homonymous recurrent inhi- bition in motoneurons supplying different lower limb muscles in hu- mans. Exp. Brain Res. 84: 367-373, 199 1.
SCALA, G. A., STASHUK, D. W., AND DE LUCA, C. J. Synchronous behav- ior of motor units. 16th Annu. Meet. Sot. Neurosci. 133, November, 1986a.
SCALA, G. A., STASHUK, D. W., AND DE LUCA, C. J. Synchronization of motor unit discharges. AAEE Annu. Meet. 109, September, 1986b.
SEARS, T. A. AND STAGG, D. Short term synchronization of intercostal motoneurone activity. J. Physiol. Land. 263: 357-38 1, 1976.
SHARP, A. A., ABBOTT, A., AND MARDER, E. Artificial electrical synapses in oscillatory networks. J. Neurophysiol. 67: 169 l- 1694, 1992.
SHIAVI, R. AND NEGIN, M. Multivariate analysis of simultaneous active motor units in human skeletal muscle. Biol. Cybern. 20: 9- 16, 1975.
SHINODA, Y., YOKOTA, J., AND FUTAMI, T. Divergent projection of indi- vidual corticospinal axons to motoneurons of multiple muscles in the monkey. Neurosci. Lett. 23: 7-12, 198 1.
SMALE, S. A mathematical model of two cells via Turing’s equation. In: Some Mathematical Questions in Biology V, edited by J. D. Cowan. Providence, RI: Am. Math. Sot. Lecture Notes in the Life Sci., 1974, vol. 6, p. 15-26.
STASHUK, D. AND DE LUCA, C. J. Update on the decomposition and analy- sis of EMG signals. In: Computer-Aided Electromyography and Expert Systems, edited by J. E. Desmedt. Amsterdam: Elsevier, 1989, p. 33-37.
ZWARTZ, M. J., VAN WEERDEN, T. W., AND HAENEN, H. T. M. Relation- ship between average muscle fiber conduction velocity and EMG power
olivary neurones and their pharmacological modulation: and in vitro spectra during isometric contraction, recovery and -applied ischemia. study. J. Physiol. Lond. 376: 163- 182, 1986. Eur. J. Appl. Physiol. 56: 2 12-2 16, 1987.