Embed Size (px)
Citation preview
1
Phone: +61 2 9292 7400
Fax: +61 2 9292 7404
Address: Level 11, 80 Clarence Street Sydney NSW 2000
Email: [email protected]
Follow us: Visit www.prpsydney.com.au to follow us
© Copyright Preston Rowe Paterson Australasia Pty Limited
About This Report
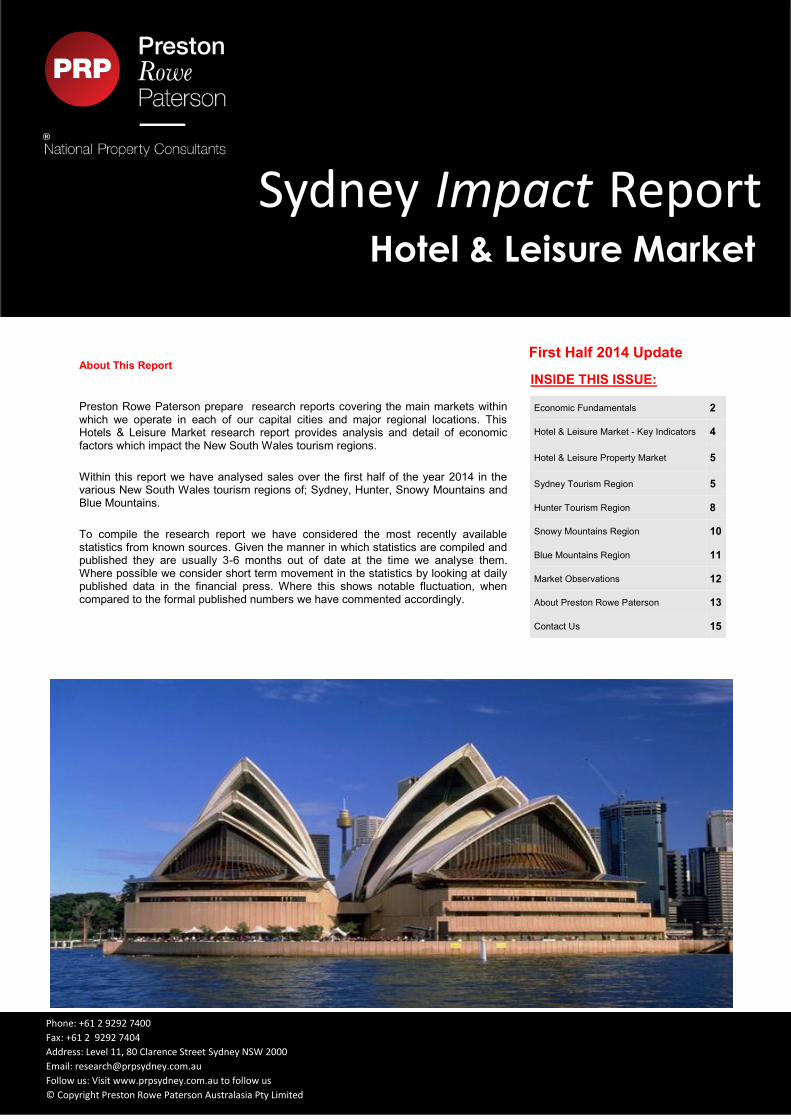
Preston Rowe Paterson prepare research reports covering the main markets within which we operate in each of our capital cities and major regional locations. This Hotels & Leisure Market research report provides analysis and detail of economic factors which impact the New South Wales tourism regions.
Within this report we have analysed sales over the first half of the year 2014 in the various New South Wales tourism regions of; Sydney, Hunter, Snowy Mountains and Blue Mountains.
To compile the research report we have considered the most recently available statistics from known sources. Given the manner in which statistics are compiled and published they are usually 3-6 months out of date at the time we analyse them. Where possible we consider short term movement in the statistics by looking at daily published data in the financial press. Where this shows notable fluctuation, when compared to the formal published numbers we have commented accordingly.
Economic Fundamentals 2
Hotel & Leisure Market - Key Indicators 4
Hotel & Leisure Property Market 5
Sydney Tourism Region 5
Hunter Tourism Region 8
Snowy Mountains Region 10
Blue Mountains Region 11
Market Observations 12
About Preston Rowe Paterson 13
Contact Us 15
INSIDE THIS ISSUE:
First Half 2014 Update
Hotel & Leisure Market
Sydney Impact Report
2
Phone: +61 2 9292 7400
Fax: +61 2 9292 7404
Address: Level 11, 80 Clarence Street Sydney NSW 2000
Email: [email protected]
Follow us: Visit www.prpsydney.com.au to follow us
© Copyright Preston Rowe Paterson Australasia Pty Limited
Economic Fundamentals
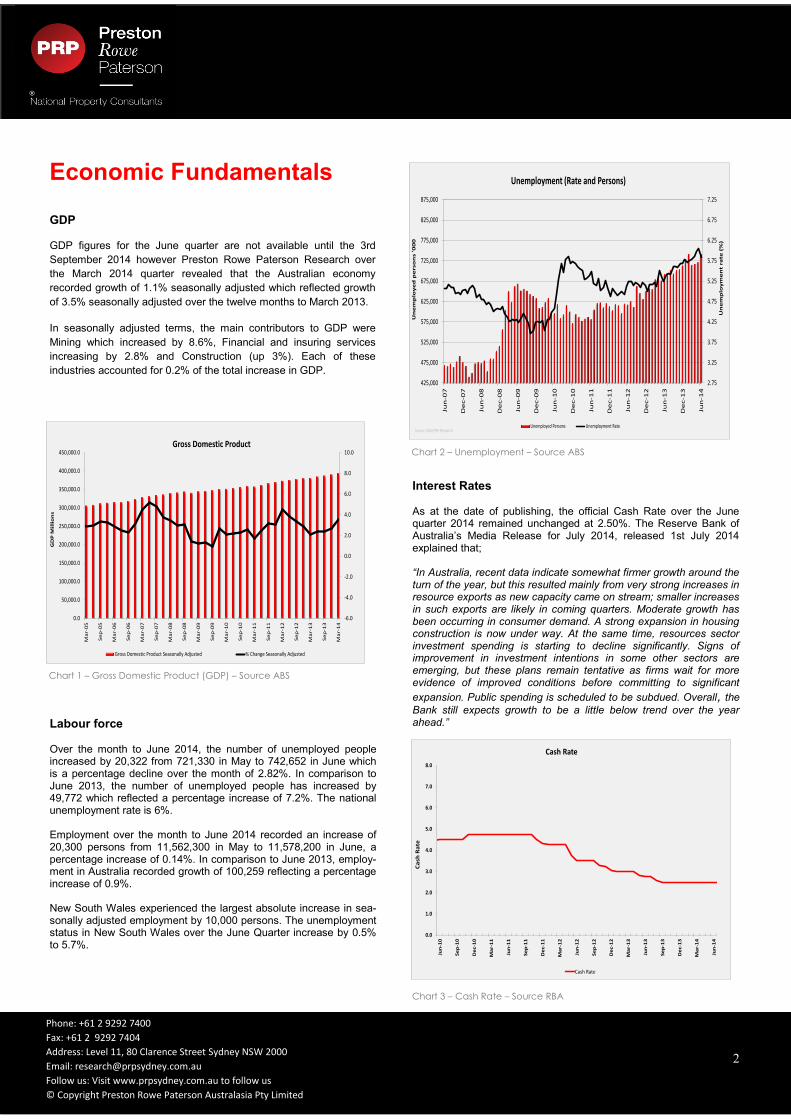
GDP GDP figures for the June quarter are not available until the 3rd
September 2014 however Preston Rowe Paterson Research over
the March 2014 quarter revealed that the Australian economy
recorded growth of 1.1% seasonally adjusted which reflected growth
of 3.5% seasonally adjusted over the twelve months to March 2013.
In seasonally adjusted terms, the main contributors to GDP were
Mining which increased by 8.6%, Financial and insuring services
increasing by 2.8% and Construction (up 3%). Each of these
industries accounted for 0.2% of the total increase in GDP.
Chart 1 – Gross Domestic Product (GDP) – Source ABS
Labour force Over the month to June 2014, the number of unemployed people increased by 20,322 from 721,330 in May to 742,652 in June which is a percentage decline over the month of 2.82%. In comparison to June 2013, the number of unemployed people has increased by 49,772 which reflected a percentage increase of 7.2%. The national unemployment rate is 6%. Employment over the month to June 2014 recorded an increase of 20,300 persons from 11,562,300 in May to 11,578,200 in June, a percentage increase of 0.14%. In comparison to June 2013, employ-ment in Australia recorded growth of 100,259 reflecting a percentage increase of 0.9%. New South Wales experienced the largest absolute increase in sea-sonally adjusted employment by 10,000 persons. The unemployment status in New South Wales over the June Quarter increase by 0.5% to 5.7%.
Interest Rates As at the date of publishing, the official Cash Rate over the June quarter 2014 remained unchanged at 2.50%. The Reserve Bank of Australia’s Media Release for July 2014, released 1st July 2014 explained that; “In Australia, recent data indicate somewhat firmer growth around the turn of the year, but this resulted mainly from very strong increases in resource exports as new capacity came on stream; smaller increases in such exports are likely in coming quarters. Moderate growth has been occurring in consumer demand. A strong expansion in housing construction is now under way. At the same time, resources sector investment spending is starting to decline significantly. Signs of improvement in investment intentions in some other sectors are emerging, but these plans remain tentative as firms wait for more evidence of improved conditions before committing to significant
expansion. Public spending is scheduled to be subdued. Overall, the
Bank still expects growth to be a little below trend over the year ahead.”
Chart 3 – Cash Rate – Source RBA
Chart 2 – Unemployment – Source ABS
2
0.0
1.0
2.0
3.0
4.0
5.0
6.0
7.0
8.0
Jun
-10
Se
p-1
0
De
c-1
0
Ma
r-1
1
Jun
-11
Se
p-1
1
De
c-1
1
Ma
r-1
2
Jun
-12
Se
p-1
2
De
c-1
2
Ma
r-1
3
Jun
-13
Se
p-1
3
De
c-1
3
Ma
r-1
4
Jun
-14
Ca
sh R
ate
Cash Rate
Cash Rate
-6.0
-4.0
-2.0
0.0
2.0
4.0
6.0
8.0
10.0
0.0
50,000.0
100,000.0
150,000.0
200,000.0
250,000.0
300,000.0
350,000.0
400,000.0
450,000.0
Ma
r-0
5
Se
p-0
5
Ma
r-0
6
Se
p-0
6
Ma
r-0
7
Se
p-0
7
Ma
r-0
8
Se
p-0
8
Ma
r-0
9
Se
p-0
9
Ma
r-1
0
Se
p-1
0
Ma
r-1
1
Se
p-1
1
Ma
r-1
2
Se
p-1
2
Ma
r-1
3
Se
p-1
3
Ma
r-1
4
GD
P M
illi
on
s
Gross Domestic Product
Gross Domestic Product Seasonally Adjusted % Change Seasonally Adjusted
2.75
3.25
3.75
4.25
4.75
5.25
5.75
6.25
6.75
7.25
425,000
475,000
525,000
575,000
625,000
675,000
725,000
775,000
825,000
875,000
Jun
-07
De
c-0
7
Jun
-08
De
c-0
8
Jun
-09
De
c-0
9
Jun
-10
De
c-1
0
Jun
-11
De
c-1
1
Jun
-12
De
c-1
2
Jun
-13
De
c-1
3
Jun
-14
Un
em
plo
ym
en
t ra
te (
%)
Un
em
plo
ye
d p
ers
on
s '0
00
Unemployment (Rate and Persons)
Unemployed Persons Unemployment RateSource: ABS/PRP Research
3
Phone: +61 2 9292 7400
Fax: +61 2 9292 7404
Address: Level 11, 80 Clarence Street Sydney NSW 2000
Email: [email protected]
Follow us: Visit www.prpsydney.com.au to follow us
© Copyright Preston Rowe Paterson Australasia Pty Limited
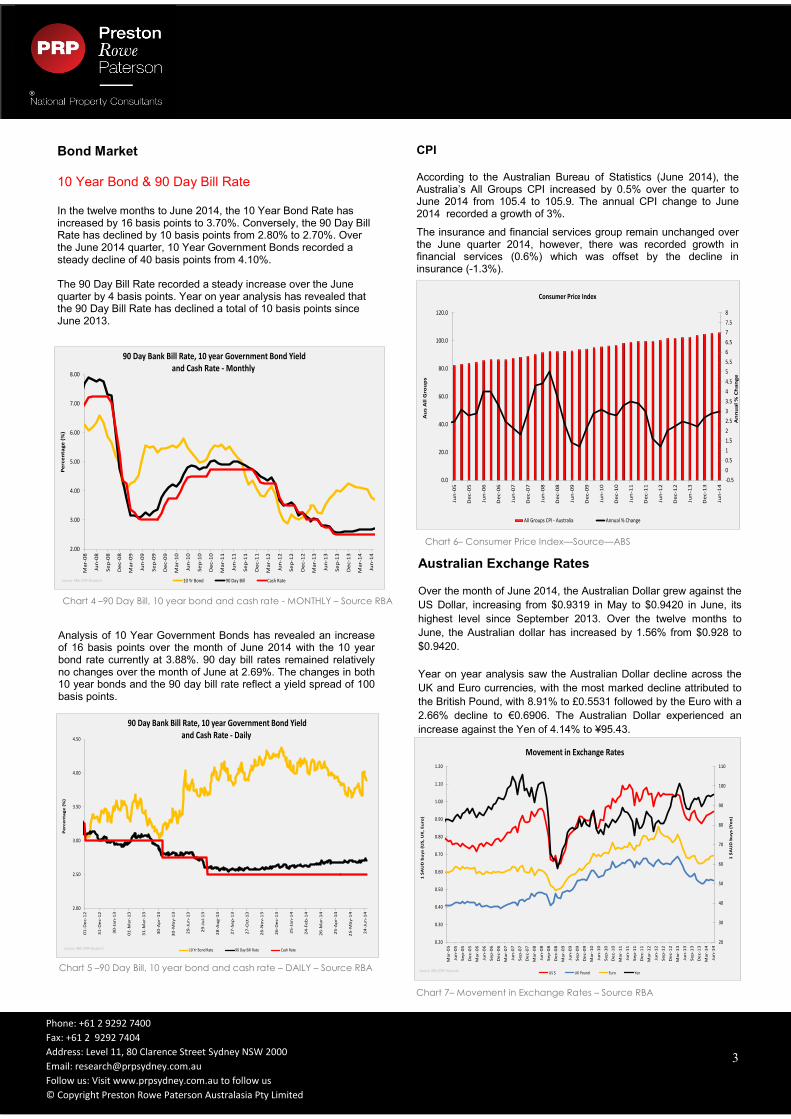
Bond Market 10 Year Bond & 90 Day Bill Rate In the twelve months to June 2014, the 10 Year Bond Rate has increased by 16 basis points to 3.70%. Conversely, the 90 Day Bill Rate has declined by 10 basis points from 2.80% to 2.70%. Over the June 2014 quarter, 10 Year Government Bonds recorded a steady decline of 40 basis points from 4.10%. The 90 Day Bill Rate recorded a steady increase over the June quarter by 4 basis points. Year on year analysis has revealed that the 90 Day Bill Rate has declined a total of 10 basis points since June 2013.
Chart 4 –90 Day Bill, 10 year bond and cash rate - MONTHLY – Source RBA
Analysis of 10 Year Government Bonds has revealed an increase of 16 basis points over the month of June 2014 with the 10 year bond rate currently at 3.88%. 90 day bill rates remained relatively no changes over the month of June at 2.69%. The changes in both 10 year bonds and the 90 day bill rate reflect a yield spread of 100 basis points.
Chart 5 –90 Day Bill, 10 year bond and cash rate – DAILY – Source RBA
CPI According to the Australian Bureau of Statistics (June 2014), the Australia’s All Groups CPI increased by 0.5% over the quarter to June 2014 from 105.4 to 105.9. The annual CPI change to June 2014 recorded a growth of 3%.
The insurance and financial services group remain unchanged over the June quarter 2014, however, there was recorded growth in financial services (0.6%) which was offset by the decline in insurance (-1.3%).
Chart 6– Consumer Price Index—Source—ABS
Australian Exchange Rates
Over the month of June 2014, the Australian Dollar grew against the
US Dollar, increasing from $0.9319 in May to $0.9420 in June, its
highest level since September 2013. Over the twelve months to
June, the Australian dollar has increased by 1.56% from $0.928 to
$0.9420.
Year on year analysis saw the Australian Dollar decline across the
UK and Euro currencies, with the most marked decline attributed to
the British Pound, with 8.91% to £0.5531 followed by the Euro with a
2.66% decline to €0.6906. The Australian Dollar experienced an
increase against the Yen of 4.14% to ¥95.43.
Chart 7– Movement in Exchange Rates – Source RBA
3
2.00
3.00
4.00
5.00
6.00
7.00
8.00
Ma
r-0
8
Jun
-08
Se
p-0
8
De
c-0
8
Ma
r-0
9
Jun
-09
Se
p-0
9
De
c-0
9
Ma
r-1
0
Jun
-10
Se
p-1
0
De
c-1
0
Ma
r-1
1
Jun
-11
Se
p-1
1
De
c-1
1
Ma
r-1
2
Jun
-12
Se
p-1
2
De
c-1
2
Ma
r-1
3
Jun
-13
Se
p-1
3
De
c-1
3
Ma
r-1
4
Jun
-14
Pe
rce
nta
ge
(%
)
90 Day Bank Bill Rate, 10 year Government Bond Yield and Cash Rate - Monthly
10 Yr Bond 90 Day Bill Cash RateSource: RBA /PRP Research
2.00
2.50
3.00
3.50
4.00
4.50
01
-De
c-1
2
31
-De
c-1
2
30
-Ja
n-1
3
01
-Ma
r-1
3
31
-Ma
r-1
3
30
-Ap
r-1
3
30
-Ma
y-1
3
29
-Ju
n-1
3
29
-Ju
l-1
3
28
-Au
g-1
3
27
-Se
p-1
3
27
-Oct-
13
26
-No
v-1
3
26
-De
c-1
3
25
-Ja
n-1
4
24
-Fe
b-1
4
26
-Ma
r-1
4
25
-Ap
r-1
4
25
-Ma
y-1
4
24
-Ju
n-1
4
Pe
rce
nta
ge
(%
)
90 Day Bank Bill Rate, 10 year Government Bond Yield and Cash Rate - Daily
10 Yr Bond Rate 90 Day Bill Rate Cash RateSource: RBA /PRP Research
-0.5
0
0.5
1
1.5
2
2.5
3
3.5
4
4.5
5
5.5
6
6.5
7
7.5
8
0.0
20.0
40.0
60.0
80.0
100.0
120.0
Jun
-05
De
c-0
5
Jun
-06
De
c-0
6
Jun
-07
De
c-0
7
Jun
-08
De
c-0
8
Jun
-09
De
c-0
9
Jun
-10
De
c-1
0
Jun
-11
De
c-1
1
Jun
-12
De
c-1
2
Jun
-13
De
c-1
3
Jun
-14
An
nu
al
% C
ha
ng
e
Au
s A
ll G
rou
ps
Consumer Price Index
All Groups CPI - Australia Annual % Change
20
30
40
50
60
70
80
90
100
110
0.20
0.30
0.40
0.50
0.60
0.70
0.80
0.90
1.00
1.10
1.20
Ma
r-0
5
Jun
-05
Se
p-0
5
De
c-0
5
Ma
r-0
6
Jun
-06
Se
p-0
6
De
c-0
6
Ma
r-0
7
Jun
-07
Se
p-0
7
De
c-0
7
Ma
r-0
8
Jun
-08
Se
p-0
8
De
c-0
8
Ma
r-0
9
Jun
-09
Se
p-0
9
De
c-0
9
Ma
r-1
0
Jun
-10
Se
p-1
0
De
c-1
0
Ma
r-1
1
Jun
-11
Se
p-1
1
De
c-1
1
Ma
r-1
2
Jun
-12
Se
p-1
2
De
c-1
2
Ma
r-1
3
Jun
-13
Se
p-1
3
De
c-1
3
Ma
r-1
4
Jun
-14
1 $
AU
D b
uy
s (Y
en
)
1 $
AU
D b
uy
s (U
S,
UK
, E
uro
)
Movement in Exchange Rates
US $ UK Pound Euro YenSource: RBA /PRP Research
4
Phone: +61 2 9292 7400
Fax: +61 2 9292 7404
Address: Level 11, 80 Clarence Street Sydney NSW 2000
Email: [email protected]
Follow us: Visit www.prpsydney.com.au to follow us
© Copyright Preston Rowe Paterson Australasia Pty Limited
4
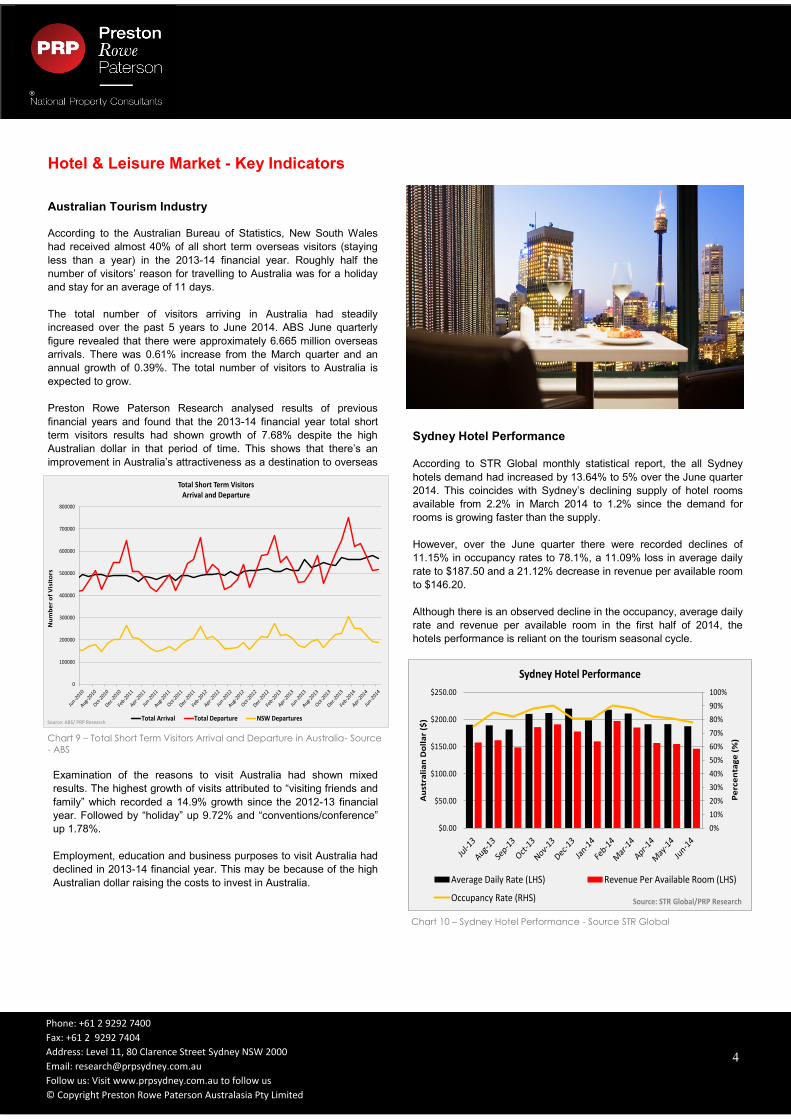
Hotel & Leisure Market - Key Indicators Australian Tourism Industry
According to the Australian Bureau of Statistics, New South Wales
had received almost 40% of all short term overseas visitors (staying
less than a year) in the 2013-14 financial year. Roughly half the
number of visitors’ reason for travelling to Australia was for a holiday
and stay for an average of 11 days.
The total number of visitors arriving in Australia had steadily
increased over the past 5 years to June 2014. ABS June quarterly
figure revealed that there were approximately 6.665 million overseas
arrivals. There was 0.61% increase from the March quarter and an
annual growth of 0.39%. The total number of visitors to Australia is
expected to grow.
Preston Rowe Paterson Research analysed results of previous
financial years and found that the 2013-14 financial year total short
term visitors results had shown growth of 7.68% despite the high
Australian dollar in that period of time. This shows that there’s an
improvement in Australia’s attractiveness as a destination to overseas
Chart 9 – Total Short Term Visitors Arrival and Departure in Australia- Source
- ABS
Sydney Hotel Performance
According to STR Global monthly statistical report, the all Sydney
hotels demand had increased by 13.64% to 5% over the June quarter
2014. This coincides with Sydney’s declining supply of hotel rooms
available from 2.2% in March 2014 to 1.2% since the demand for
rooms is growing faster than the supply.
However, over the June quarter there were recorded declines of
11.15% in occupancy rates to 78.1%, a 11.09% loss in average daily
rate to $187.50 and a 21.12% decrease in revenue per available room
to $146.20.
Although there is an observed decline in the occupancy, average daily
rate and revenue per available room in the first half of 2014, the
hotels performance is reliant on the tourism seasonal cycle.
Chart 10 – Sydney Hotel Performance - Source STR Global
0
100000
200000
300000
400000
500000
600000
700000
800000
Nu
mb
er
of
Vis
ito
rs
Total Short Term Visitors Arrival and Departure
Total Arrival Total Departure NSW DeparturesSource: ABS/ PRP Research
Examination of the reasons to visit Australia had shown mixed
results. The highest growth of visits attributed to “visiting friends and
family” which recorded a 14.9% growth since the 2012-13 financial
year. Followed by “holiday” up 9.72% and “conventions/conference”
up 1.78%.
Employment, education and business purposes to visit Australia had
declined in 2013-14 financial year. This may be because of the high
Australian dollar raising the costs to invest in Australia.
0%
10%
20%
30%
40%
50%
60%
70%
80%
90%
100%
$0.00
$50.00
$100.00
$150.00
$200.00
$250.00
Pe
rce
nta
ge
(%
)
Au
stra
lia
n D
oll
ar
($)
Sydney Hotel Performance
Average Daily Rate (LHS) Revenue Per Available Room (LHS)
Occupancy Rate (RHS) Source: STR Global/PRP Research

5
Phone: +61 2 9292 7400
Fax: +61 2 9292 7404
Address: Level 11, 80 Clarence Street Sydney NSW 2000
Email: [email protected]
Follow us: Visit www.prpsydney.com.au to follow us
© Copyright Preston Rowe Paterson Australasia Pty Limited
Sydney Tourism Region The Sydney tourism region is bounded by the suburbs of Campbelltown, Palm Beach, Penrith, Picton, Richmond, Sutherland and Wiseman Ferry. However, for the purpose of this research report, Preston Rowe Paterson Research will focus on hotels and leisure properties in the Sydney metropolitan areas. According to Destination NSW (DNSW), the Sydney tourist region
had received 31.2 million visitors and accounted for 38.78% of
NSW tourism market share in the year ending to March 2014.
Domestic and international visitors had spent approximately
$14,503 million on day trips and overnight stays in the Sydney
region.
5
Chart 9—Sydney Tourism Region Overnight Visitors —Source Destination
NSW
Hotel & Leisure Property Market
Data collected from the DNSW accommodation breakdown in year end to March 2014 is based on the length of overnight stays visitors spend in the particular type of accommodation. The figures below are not based on the number of visitors staying at the particular type of accommodation. Domestic visitors’ favoured overnight accommodation in the Sydney tourism region was ‘friends or relatives properties’ which amounted to 51% share of accommodation, followed by 16.8% for ’hotel or motor inn below 4 stars’ overnight stay and 14.9% prefer a ’luxury hotel or resort 4 or 5 star’. Only 3.6% of domestic visitors prefer to rent a ‘house, apartment, flat or unit’ for their overnight stay. Approximately 43.9% of international visitors stayed at a rented ‘house, apartment, flat or unit’, 29.6% stayed at a ’friends or relatives property’ and 5.6% chose to stay overnight in Sydney at a ’backpacker or hostel’ during their short term visit.
0
5
10
15
20
25
0
2000000
4000000
6000000
8000000
10000000
2009 2010 2011 2012 2013 2014
Da
ys
Nu
mb
er
of
Pe
rso
ns
Sydney Tourism RegionOvernight Visitors
Domestic Visitors International Visitors
Average Length of Stay (Domestic) Average Length of Stay (International)
Source: PRP Research
Data and information from the Property Council of Australia/ANZ:
Property Industry Confidence Survey June Quarter 2014 has been
analysed to derive at the following findings; Hotel capital values is
expected to grow strongly in all states and territories except ACT.
The NSW hotel capital 12-month growth expectations index showed
that there had been little to no change between the March and June
quarter 2014 at an approximate index value of 13.
Hotels construction activity in Australia is expected to grow through to
the September quarter. According to the PCA/ANZ confidence
survey, the 12-month sentiment to construction activity expectations
had increased by 12.9% in index between June 2013 and June 2014.
According to the Property Council of Australia/IPD Australia index, the Australian hotel returns grew 10.7%, which was an increase of 269 basis points over three months to June 2014. The capital returns showed that there is an improved investor demand and strong occupancy rate.
Tourist Accommodation The Sydney CBD tourism region recorded the highest volume of tourists and longest stay than the regional NSW tourism regions. In the year ending to March 2014, the Sydney tourism region had received nearly 8.7 million domestic overnight visitors with an average length of stay of 2.7 days and 29 million international overnight visitors with 21.6 days of average length of stay. Domestic visitors spent nearly 23.2 million nights in the Sydney region and international visitors spent nearly 62.1 million nights, up 12.4% and 6.9% respectively in comparison to year ending March 2013.
6
Phone: +61 2 9292 7400
Fax: +61 2 9292 7404
Address: Level 11, 80 Clarence Street Sydney NSW 2000
Email: [email protected]
Follow us: Visit www.prpsydney.com.au to follow us
© Copyright Preston Rowe Paterson Australasia Pty Limited
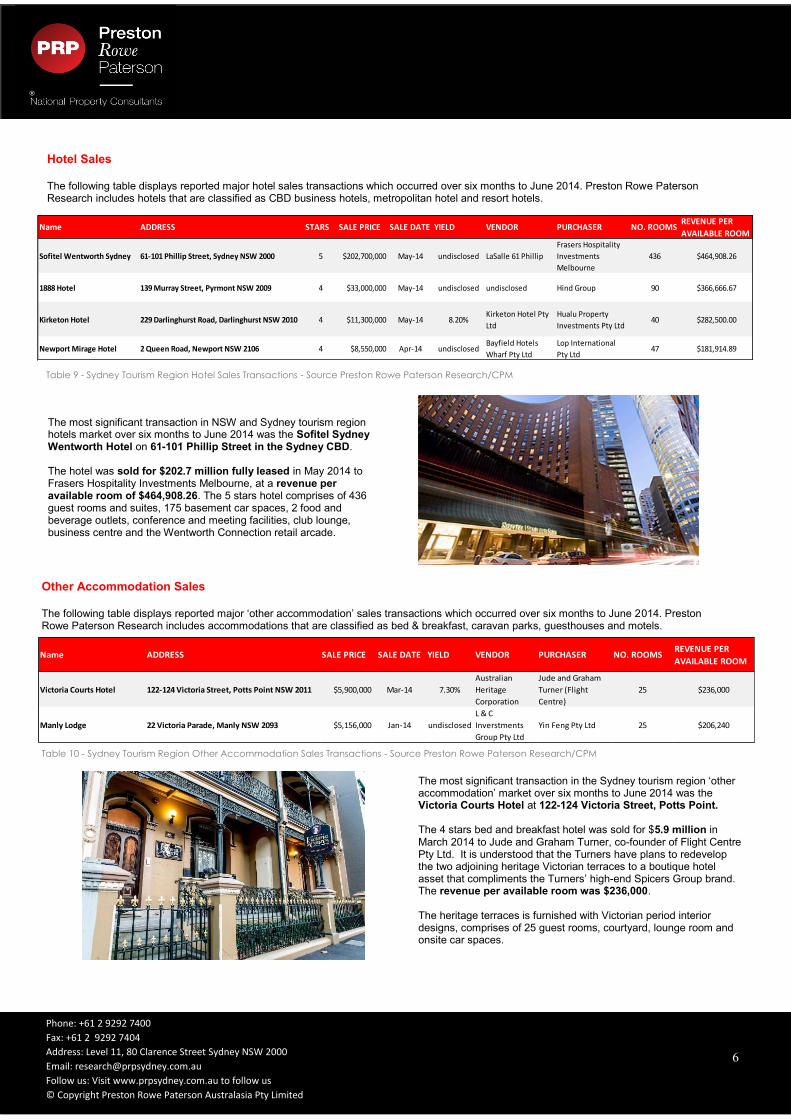
Hotel Sales The following table displays reported major hotel sales transactions which occurred over six months to June 2014. Preston Rowe Paterson Research includes hotels that are classified as CBD business hotels, metropolitan hotel and resort hotels.
The most significant transaction in NSW and Sydney tourism region hotels market over six months to June 2014 was the Sofitel Sydney Wentworth Hotel on 61-101 Phillip Street in the Sydney CBD. The hotel was sold for $202.7 million fully leased in May 2014 to Frasers Hospitality Investments Melbourne, at a revenue per available room of $464,908.26. The 5 stars hotel comprises of 436 guest rooms and suites, 175 basement car spaces, 2 food and beverage outlets, conference and meeting facilities, club lounge, business centre and the Wentworth Connection retail arcade.
Table 9 - Sydney Tourism Region Hotel Sales Transactions - Source Preston Rowe Paterson Research/CPM
6
Other Accommodation Sales The following table displays reported major ‘other accommodation’ sales transactions which occurred over six months to June 2014. Preston Rowe Paterson Research includes accommodations that are classified as bed & breakfast, caravan parks, guesthouses and motels.
Table 10 - Sydney Tourism Region Other Accommodation Sales Transactions - Source Preston Rowe Paterson Research/CPM
The most significant transaction in the Sydney tourism region ‘other accommodation’ market over six months to June 2014 was the Victoria Courts Hotel at 122-124 Victoria Street, Potts Point. The 4 stars bed and breakfast hotel was sold for $5.9 million in March 2014 to Jude and Graham Turner, co-founder of Flight Centre Pty Ltd. It is understood that the Turners have plans to redevelop the two adjoining heritage Victorian terraces to a boutique hotel asset that compliments the Turners’ high-end Spicers Group brand. The revenue per available room was $236,000. The heritage terraces is furnished with Victorian period interior designs, comprises of 25 guest rooms, courtyard, lounge room and onsite car spaces.
Name ADDRESS STARS SALE PRICE SALE DATE YIELD VENDOR PURCHASER NO. ROOMSREVENUE PER
AVAILABLE ROOM
Sofitel Wentworth Sydney 61-101 Phillip Street, Sydney NSW 2000 5 $202,700,000 May-14 undisclosed LaSalle 61 Phillip
Frasers Hospitality
Investments
Melbourne
436 $464,908.26
1888 Hotel 139 Murray Street, Pyrmont NSW 2009 4 $33,000,000 May-14 undisclosed undisclosed Hind Group 90 $366,666.67
Kirketon Hotel 229 Darlinghurst Road, Darlinghurst NSW 2010 4 $11,300,000 May-14 8.20%Kirketon Hotel Pty
Ltd
Hualu Property
Investments Pty Ltd40 $282,500.00
Newport Mirage Hotel 2 Queen Road, Newport NSW 2106 4 $8,550,000 Apr-14 undisclosedBayfield Hotels
Wharf Pty Ltd
Lop International
Pty Ltd47 $181,914.89
Name ADDRESS SALE PRICE SALE DATE YIELD VENDOR PURCHASER NO. ROOMSREVENUE PER
AVAILABLE ROOM
Victoria Courts Hotel 122-124 Victoria Street, Potts Point NSW 2011 $5,900,000 Mar-14 7.30%
Australian
Heritage
Corporation
Jude and Graham
Turner (Flight
Centre)
25 $236,000
Manly Lodge 22 Victoria Parade, Manly NSW 2093 $5,156,000 Jan-14 undisclosed
L & C
Inverstments
Group Pty Ltd
Yin Feng Pty Ltd 25 $206,240
7
Phone: +61 2 9292 7400
Fax: +61 2 9292 7404
Address: Level 11, 80 Clarence Street Sydney NSW 2000
Email: [email protected]
Follow us: Visit www.prpsydney.com.au to follow us
© Copyright Preston Rowe Paterson Australasia Pty Limited
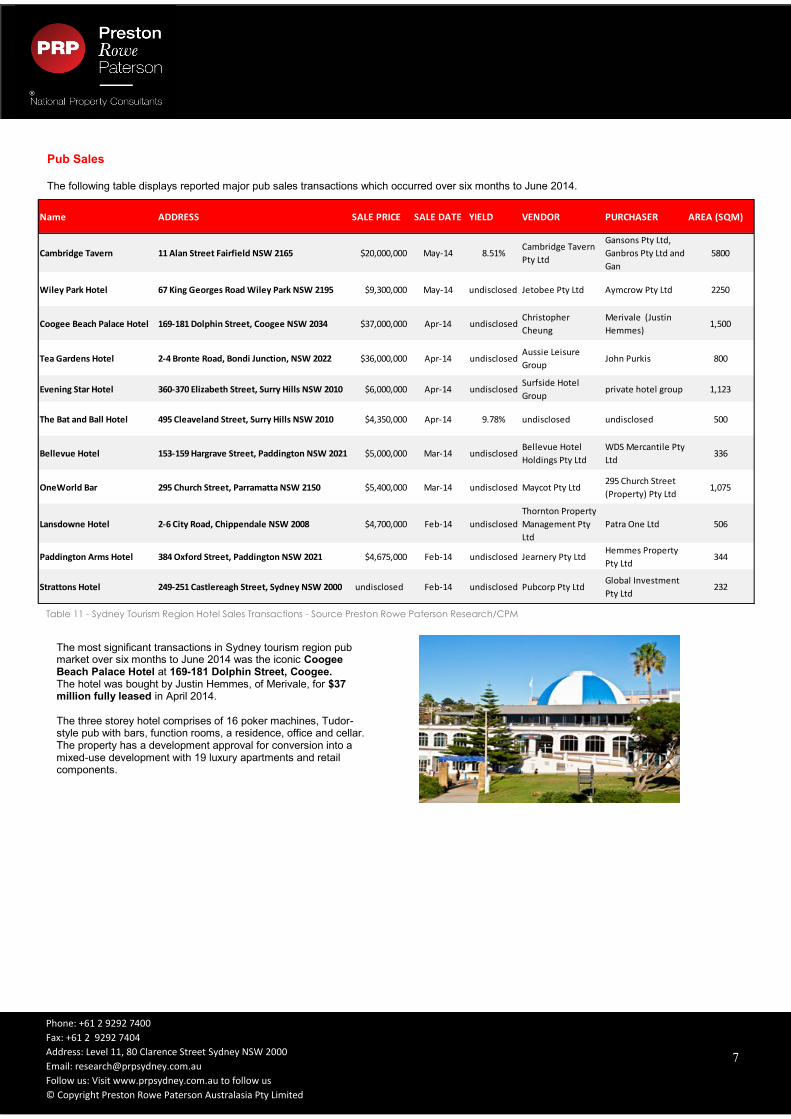
Pub Sales The following table displays reported major pub sales transactions which occurred over six months to June 2014.
Table 11 - Sydney Tourism Region Hotel Sales Transactions - Source Preston Rowe Paterson Research/CPM
The most significant transactions in Sydney tourism region pub market over six months to June 2014 was the iconic Coogee Beach Palace Hotel at 169-181 Dolphin Street, Coogee. The hotel was bought by Justin Hemmes, of Merivale, for $37 million fully leased in April 2014. The three storey hotel comprises of 16 poker machines, Tudor-style pub with bars, function rooms, a residence, office and cellar. The property has a development approval for conversion into a mixed-use development with 19 luxury apartments and retail components.
Name ADDRESS SALE PRICE SALE DATE YIELD VENDOR PURCHASER AREA (SQM)
Cambridge Tavern 11 Alan Street Fairfield NSW 2165 $20,000,000 May-14 8.51%Cambridge Tavern
Pty Ltd
Gansons Pty Ltd,
Ganbros Pty Ltd and
Gan
5800
Wiley Park Hotel 67 King Georges Road Wiley Park NSW 2195 $9,300,000 May-14 undisclosed Jetobee Pty Ltd Aymcrow Pty Ltd 2250
Coogee Beach Palace Hotel 169-181 Dolphin Street, Coogee NSW 2034 $37,000,000 Apr-14 undisclosedChristopher
Cheung
Merivale (Justin
Hemmes)1,500
Tea Gardens Hotel 2-4 Bronte Road, Bondi Junction, NSW 2022 $36,000,000 Apr-14 undisclosedAussie Leisure
GroupJohn Purkis 800
Evening Star Hotel 360-370 Elizabeth Street, Surry Hills NSW 2010 $6,000,000 Apr-14 undisclosedSurfside Hotel
Group private hotel group 1,123
The Bat and Ball Hotel 495 Cleaveland Street, Surry Hills NSW 2010 $4,350,000 Apr-14 9.78% undisclosed undisclosed 500
Bellevue Hotel 153-159 Hargrave Street, Paddington NSW 2021 $5,000,000 Mar-14 undisclosedBellevue Hotel
Holdings Pty Ltd
WDS Mercantile Pty
Ltd336
OneWorld Bar 295 Church Street, Parramatta NSW 2150 $5,400,000 Mar-14 undisclosed Maycot Pty Ltd295 Church Street
(Property) Pty Ltd1,075
Lansdowne Hotel 2-6 City Road, Chippendale NSW 2008 $4,700,000 Feb-14 undisclosed
Thornton Property
Management Pty
Ltd
Patra One Ltd 506
Paddington Arms Hotel 384 Oxford Street, Paddington NSW 2021 $4,675,000 Feb-14 undisclosed Jearnery Pty LtdHemmes Property
Pty Ltd344
Strattons Hotel 249-251 Castlereagh Street, Sydney NSW 2000 undisclosed Feb-14 undisclosed Pubcorp Pty LtdGlobal Investment
Pty Ltd232
7
8
Phone: +61 2 9292 7400
Fax: +61 2 9292 7404
Address: Level 11, 80 Clarence Street Sydney NSW 2000
Email: [email protected]
Follow us: Visit www.prpsydney.com.au to follow us
© Copyright Preston Rowe Paterson Australasia Pty Limited
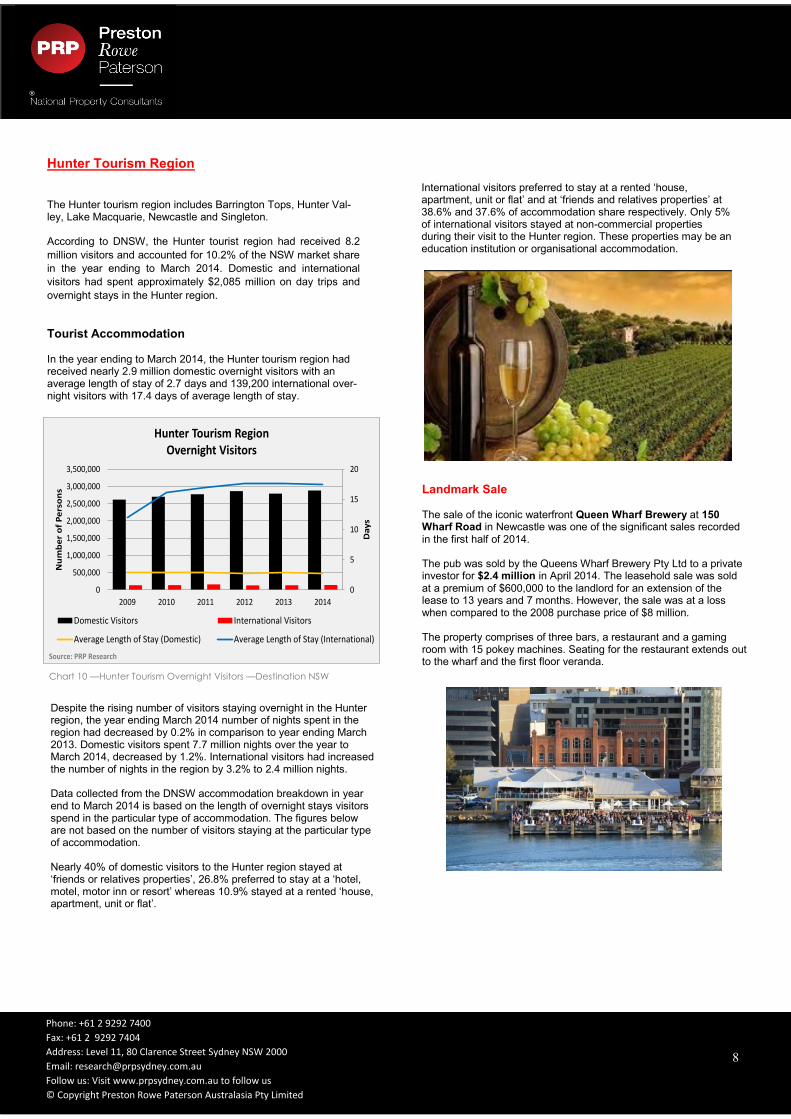
Hunter Tourism Region The Hunter tourism region includes Barrington Tops, Hunter Val-ley, Lake Macquarie, Newcastle and Singleton. According to DNSW, the Hunter tourist region had received 8.2
million visitors and accounted for 10.2% of the NSW market share
in the year ending to March 2014. Domestic and international
visitors had spent approximately $2,085 million on day trips and
overnight stays in the Hunter region.
Tourist Accommodation
In the year ending to March 2014, the Hunter tourism region had received nearly 2.9 million domestic overnight visitors with an average length of stay of 2.7 days and 139,200 international over-night visitors with 17.4 days of average length of stay.
8
International visitors preferred to stay at a rented ‘house, apartment, unit or flat’ and at ‘friends and relatives properties’ at 38.6% and 37.6% of accommodation share respectively. Only 5% of international visitors stayed at non-commercial properties during their visit to the Hunter region. These properties may be an education institution or organisational accommodation.
Chart 10 —Hunter Tourism Overnight Visitors —Destination NSW
0
5
10
15
20
0
500,000
1,000,000
1,500,000
2,000,000
2,500,000
3,000,000
3,500,000
2009 2010 2011 2012 2013 2014
Da
ys
Nu
mb
er
of
Pe
rso
ns
Hunter Tourism RegionOvernight Visitors
Domestic Visitors International Visitors
Average Length of Stay (Domestic) Average Length of Stay (International)
Source: PRP Research
Despite the rising number of visitors staying overnight in the Hunter region, the year ending March 2014 number of nights spent in the region had decreased by 0.2% in comparison to year ending March 2013. Domestic visitors spent 7.7 million nights over the year to March 2014, decreased by 1.2%. International visitors had increased the number of nights in the region by 3.2% to 2.4 million nights. Data collected from the DNSW accommodation breakdown in year end to March 2014 is based on the length of overnight stays visitors spend in the particular type of accommodation. The figures below are not based on the number of visitors staying at the particular type of accommodation. Nearly 40% of domestic visitors to the Hunter region stayed at ‘friends or relatives properties’, 26.8% preferred to stay at a ‘hotel, motel, motor inn or resort’ whereas 10.9% stayed at a rented ‘house, apartment, unit or flat’.
Landmark Sale The sale of the iconic waterfront Queen Wharf Brewery at 150 Wharf Road in Newcastle was one of the significant sales recorded in the first half of 2014. The pub was sold by the Queens Wharf Brewery Pty Ltd to a private investor for $2.4 million in April 2014. The leasehold sale was sold at a premium of $600,000 to the landlord for an extension of the lease to 13 years and 7 months. However, the sale was at a loss when compared to the 2008 purchase price of $8 million. The property comprises of three bars, a restaurant and a gaming room with 15 pokey machines. Seating for the restaurant extends out to the wharf and the first floor veranda.
9
Phone: +61 2 9292 7400
Fax: +61 2 9292 7404
Address: Level 11, 80 Clarence Street Sydney NSW 2000
Email: [email protected]
Follow us: Visit www.prpsydney.com.au to follow us
© Copyright Preston Rowe Paterson Australasia Pty Limited
Pub Sales The following table displays reported major pub sales transactions which occurred over six months to June 2014.
Table 13 - Hunter Tourism Region Investment Sales Transactions - Source Preston Rowe Paterson Research/CPM
The most significant transaction in the Hunter tourism region pub market over six months to June 2014 was the Shortland Hotel on 269 Sandgate Road, Shortland. The pub was sold by Padelon Pty Ltd for $3.383 million to the Short-land Hotel Ut Pty Ltd in March 2014. The property comprises of a bar, an attached retail space leased to Bottlemart and a separated block of 10 guestrooms which are occupied by residents. The pub is located across the City Bypass from the University of Newcastle and the Shortland Waters Golf Club.
Name ADDRESS SALE PRICE SALE DATE YIELD VENDOR PURCHASER AREA (SQM) RATE PER SQM
Queen Wharf Brewery 150 Wharf Road, Newcastle NSW 2300 $2,400,000 Apr-14 undisclosedQueens Wharf
Brewery Pty Ltdprivate investor 3,176 $755.67
Shortland Hotel 269 Sandgate Road, Shortland NSW 2307 $3,383,000 Jan-14 undisclosed Padelon Pty LtdShortland Hotel Ut Pty
Ltd6,150 $550.08
Other Accommodation Sales The following table displays reported major ‘other accommodation’ sales transactions which occurred over six months to June 2014. Preston Rowe Paterson Research includes accommodations that are classified as bed & breakfast, caravan parks, guesthouses and motels.
Table 12 - Hunter Tourism Region Investment Sales Transactions - Source Preston Rowe Paterson Research/CPM
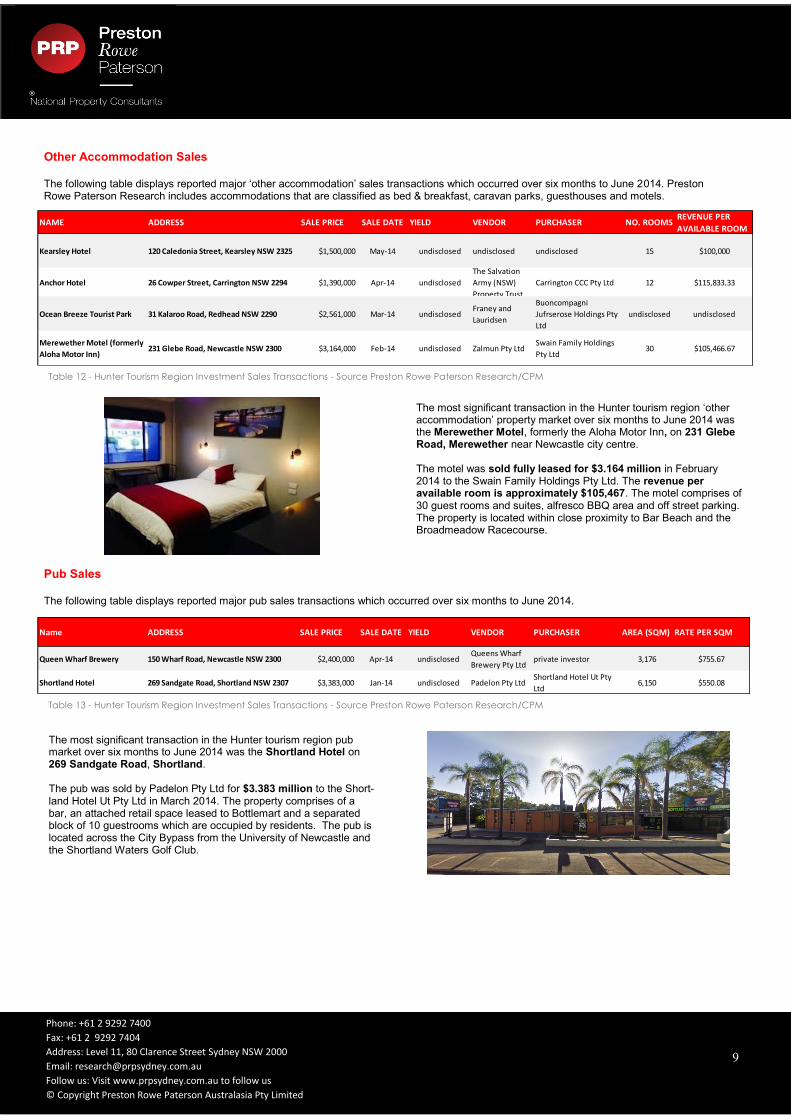
The most significant transaction in the Hunter tourism region ‘other accommodation’ property market over six months to June 2014 was the Merewether Motel, formerly the Aloha Motor Inn, on 231 Glebe Road, Merewether near Newcastle city centre. The motel was sold fully leased for $3.164 million in February 2014 to the Swain Family Holdings Pty Ltd. The revenue per available room is approximately $105,467. The motel comprises of 30 guest rooms and suites, alfresco BBQ area and off street parking. The property is located within close proximity to Bar Beach and the Broadmeadow Racecourse.
NAME ADDRESS SALE PRICE SALE DATE YIELD VENDOR PURCHASER NO. ROOMSREVENUE PER
AVAILABLE ROOM
Kearsley Hotel 120 Caledonia Street, Kearsley NSW 2325 $1,500,000 May-14 undisclosed undisclosed undisclosed 15 $100,000
Anchor Hotel 26 Cowper Street, Carrington NSW 2294 $1,390,000 Apr-14 undisclosed
The Salvation
Army (NSW)
Property Trust
Carrington CCC Pty Ltd 12 $115,833.33
Ocean Breeze Tourist Park 31 Kalaroo Road, Redhead NSW 2290 $2,561,000 Mar-14 undisclosedFraney and
Lauridsen
Buoncompagni
Jufrserose Holdings Pty
Ltd
undisclosed undisclosed
Merewether Motel (formerly
Aloha Motor Inn)231 Glebe Road, Newcastle NSW 2300 $3,164,000 Feb-14 undisclosed Zalmun Pty Ltd
Swain Family Holdings
Pty Ltd30 $105,466.67
9
10
Phone: +61 2 9292 7400
Fax: +61 2 9292 7404
Address: Level 11, 80 Clarence Street Sydney NSW 2000
Email: [email protected]
Follow us: Visit www.prpsydney.com.au to follow us
© Copyright Preston Rowe Paterson Australasia Pty Limited
10
Chart 11— Snowy Mountains Tourism Region Overnight Visitors —
Source Destination NSW
Approximately 28.7% of domestic visitors to the Snowy Mountains region prefer to stay at a ‘hotel or motor inn below 4 star’. 14.3% of visitors stayed at ‘friends or relatives properties’ and both renting ‘house, apartment, unit or flat’ and ‘caravan par or camping’ reached 13.9% in share of accommodation. The most popular accommodation for international visitors were renting ‘house, apartment, unit or flat’ at 40.2%, followed by staying at ‘hotel or motor inn below 4 star’ at 25.3%. ‘Caravan park or camp-ing’ attracted 18.8% of visitors and 17.2% stayed at non-commercial properties, whilst the remainder 15.1% stayed at ‘friends or relatives properties’ in the Snowy Mountains region.
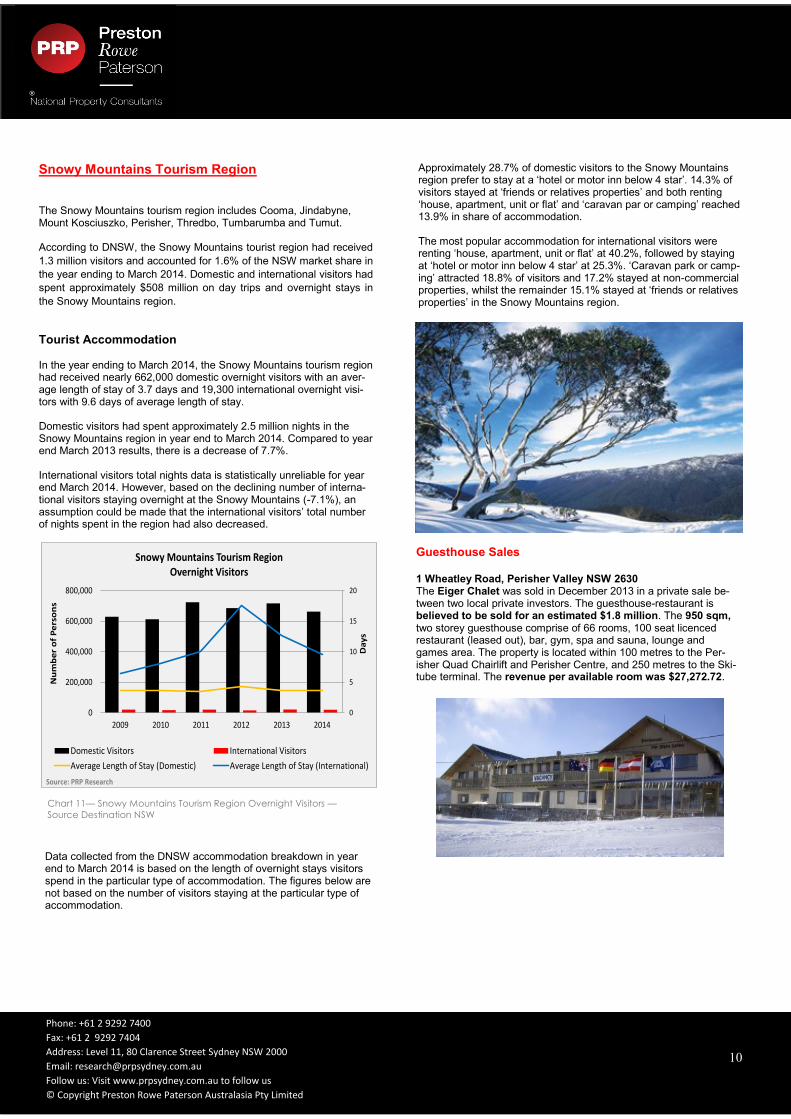
Snowy Mountains Tourism Region The Snowy Mountains tourism region includes Cooma, Jindabyne, Mount Kosciuszko, Perisher, Thredbo, Tumbarumba and Tumut. According to DNSW, the Snowy Mountains tourist region had received
1.3 million visitors and accounted for 1.6% of the NSW market share in
the year ending to March 2014. Domestic and international visitors had
spent approximately $508 million on day trips and overnight stays in
the Snowy Mountains region.
Tourist Accommodation
In the year ending to March 2014, the Snowy Mountains tourism region had received nearly 662,000 domestic overnight visitors with an aver-age length of stay of 3.7 days and 19,300 international overnight visi-tors with 9.6 days of average length of stay. Domestic visitors had spent approximately 2.5 million nights in the Snowy Mountains region in year end to March 2014. Compared to year end March 2013 results, there is a decrease of 7.7%. International visitors total nights data is statistically unreliable for year end March 2014. However, based on the declining number of interna-tional visitors staying overnight at the Snowy Mountains (-7.1%), an assumption could be made that the international visitors’ total number of nights spent in the region had also decreased.
0
5
10
15
20
0
200,000
400,000
600,000
800,000
2009 2010 2011 2012 2013 2014
Da
ys
Nu
mb
er
of
Pe
rso
ns
Snowy Mountains Tourism RegionOvernight Visitors
Domestic Visitors International Visitors
Average Length of Stay (Domestic) Average Length of Stay (International)
Source: PRP Research
Data collected from the DNSW accommodation breakdown in year end to March 2014 is based on the length of overnight stays visitors spend in the particular type of accommodation. The figures below are not based on the number of visitors staying at the particular type of accommodation.
Guesthouse Sales 1 Wheatley Road, Perisher Valley NSW 2630 The Eiger Chalet was sold in December 2013 in a private sale be-tween two local private investors. The guesthouse-restaurant is believed to be sold for an estimated $1.8 million. The 950 sqm, two storey guesthouse comprise of 66 rooms, 100 seat licenced restaurant (leased out), bar, gym, spa and sauna, lounge and games area. The property is located within 100 metres to the Per-isher Quad Chairlift and Perisher Centre, and 250 metres to the Ski-tube terminal. The revenue per available room was $27,272.72.
11
Phone: +61 2 9292 7400
Fax: +61 2 9292 7404
Address: Level 11, 80 Clarence Street Sydney NSW 2000
Email: [email protected]
Follow us: Visit www.prpsydney.com.au to follow us
© Copyright Preston Rowe Paterson Australasia Pty Limited
11
Chart 12— Blue Mountains Tourism Region Overnight Visitors —Source
Destination NSW
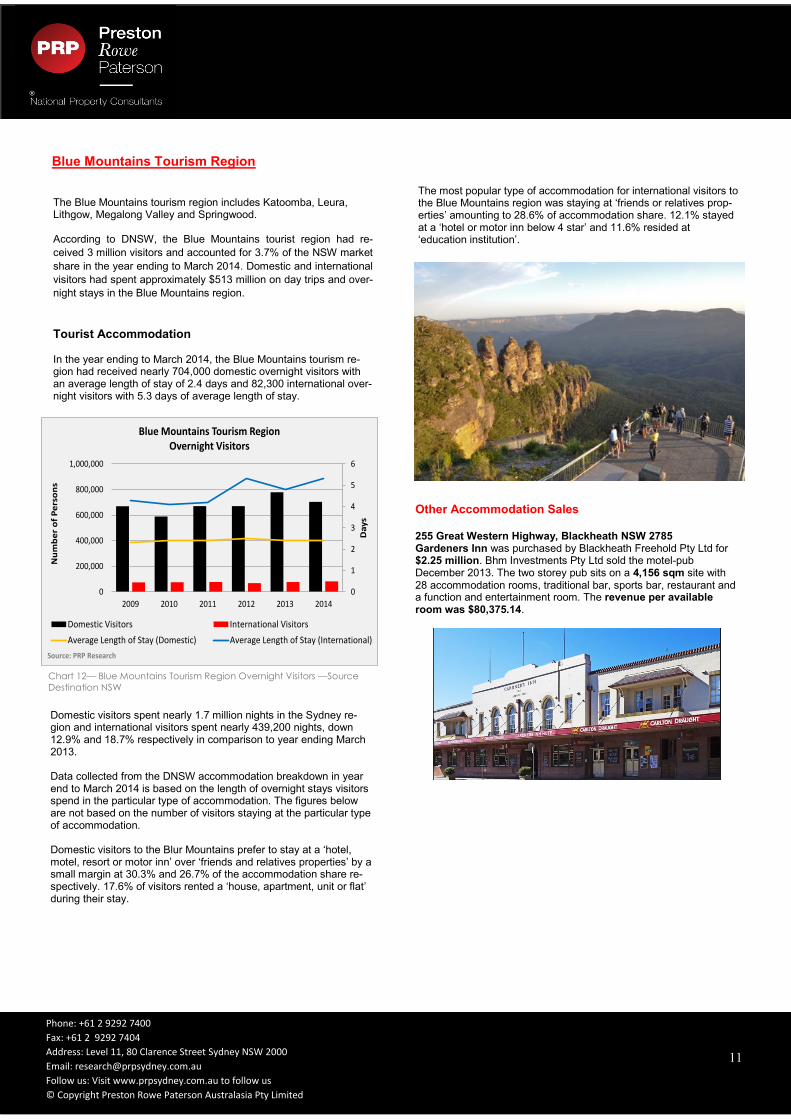
Blue Mountains Tourism Region
0
1
2
3
4
5
6
0
200,000
400,000
600,000
800,000
1,000,000
2009 2010 2011 2012 2013 2014
Da
ys
Nu
mb
er
of
Pe
rso
ns
Blue Mountains Tourism RegionOvernight Visitors
Domestic Visitors International Visitors
Average Length of Stay (Domestic) Average Length of Stay (International)
Source: PRP Research
Other Accommodation Sales 255 Great Western Highway, Blackheath NSW 2785 Gardeners Inn was purchased by Blackheath Freehold Pty Ltd for $2.25 million. Bhm Investments Pty Ltd sold the motel-pub December 2013. The two storey pub sits on a 4,156 sqm site with 28 accommodation rooms, traditional bar, sports bar, restaurant and a function and entertainment room. The revenue per available room was $80,375.14.
Domestic visitors spent nearly 1.7 million nights in the Sydney re-gion and international visitors spent nearly 439,200 nights, down 12.9% and 18.7% respectively in comparison to year ending March 2013. Data collected from the DNSW accommodation breakdown in year end to March 2014 is based on the length of overnight stays visitors spend in the particular type of accommodation. The figures below are not based on the number of visitors staying at the particular type of accommodation. Domestic visitors to the Blur Mountains prefer to stay at a ‘hotel, motel, resort or motor inn’ over ‘friends and relatives properties’ by a small margin at 30.3% and 26.7% of the accommodation share re-spectively. 17.6% of visitors rented a ‘house, apartment, unit or flat’ during their stay.
The Blue Mountains tourism region includes Katoomba, Leura, Lithgow, Megalong Valley and Springwood. According to DNSW, the Blue Mountains tourist region had re-
ceived 3 million visitors and accounted for 3.7% of the NSW market
share in the year ending to March 2014. Domestic and international
visitors had spent approximately $513 million on day trips and over-
night stays in the Blue Mountains region.
Tourist Accommodation
In the year ending to March 2014, the Blue Mountains tourism re-gion had received nearly 704,000 domestic overnight visitors with an average length of stay of 2.4 days and 82,300 international over-night visitors with 5.3 days of average length of stay.
The most popular type of accommodation for international visitors to the Blue Mountains region was staying at ‘friends or relatives prop-erties’ amounting to 28.6% of accommodation share. 12.1% stayed at a ‘hotel or motor inn below 4 star’ and 11.6% resided at ‘education institution’.
12
Phone: +61 2 9292 7400
Fax: +61 2 9292 7404
Address: Level 11, 80 Clarence Street Sydney NSW 2000
Email: [email protected]
Follow us: Visit www.prpsydney.com.au to follow us
© Copyright Preston Rowe Paterson Australasia Pty Limited
12
Market Observations In the June Quarter 2014, most investment activity occurred within
the Sydney tourism region. Preston Rowe Paterson Research had
observed that there were four significant hotel sales that sold for
double and triple digits in six months to June 2014.
According to DNSW, the hotels and leisure industry had experienced a yearly increase of 1.8% in domestic overnight visitors and a 5.2% growth in international overnight visitors to regional NSW, year ending to March 2014. There is an expectation of further potential growth in the NSW tourism regions and positive hotels performance indicators.
According to STR Global, the Sydney tourism environment is
improving based on a yearly analysis of the occupancy rate,
average daily rate and revenue per available room. In comparison
to June 2013, the June 2014 results showed growth in Sydney
hotels indicating a 1.5% increase in occupancy rates, 2.9% growth
on average daily rate and 4.5% increase in revenue per available
room.
The Sydney hotels and leisure market’s performance was relatively strong in comparison to other tourism regions. Local and foreign investors were particularly interested in larger, metropolitan CBD hotel and pubs. There had been a rise in foreign investors interest in Sydney tourism region hotels and leisure properties. The decrease in the Australian dollar may have been a factor to the improving hotels and leisure market. Factors that may have led to strong demand in the first half of 2014 were the unchanging low cash rate, scarcity of A Grade hotel/ leisure stocks in the current market and the tightening of supply. Over half of the observed sales in six months to June 2014 were pub investments. The market’s appetite for pub was strong in the first half of 2014 with many vendors putting out their multi-million dollar portfolios to take advantage of the high demand.
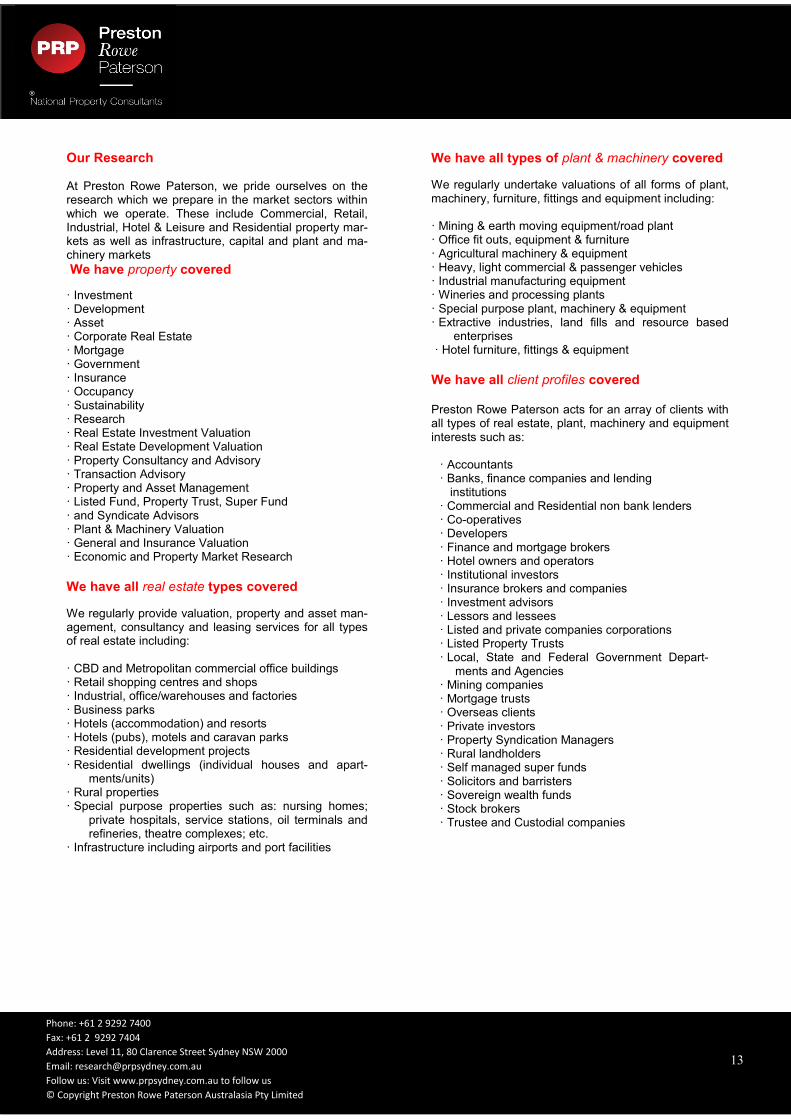
In the June quarter, there had been a few commercial property sales in the Sydney CBD that had been earmarked for hotel conversion purposes. The recent sales could spark a new trend in office-hotel conversions in the Sydney CBD. In six months to June 2014, the Singaporean group Toga Far East Hotels had been an active investor in office-hotel conversions. An example of this was the Ausgrid House building on 570 George Street, Sydney. It was bought in March for $151.8 million with the purpose of converting the commercial building into a hotel, retail and residential complex. Regional hotel and leisure market in NSW experienced moderate sales activity. The regional hotel/leisure market attractiveness is often limited by smaller populations and pedestrian traffic, lower socio-economic backgrounds, increases in operating costs and reliance on regional tourism. The Hunter Valley and Blue Mountains tourism regions did not receive as much attention from investors as the Sydney tourism region. Both regions experienced modest growth and investment sales. The Hunter region received the majority of attention from investors. The Snowy Mountains had remained reasonably slow with the majority of investors being owner occupiers. It was observed that there’s more supply than demand for hotel properties in the Snowy Mountains tourism region. Taking into account of the observation on current sales and hotels occupancy rates as at June 2014, the hotels and leisure property outlook is forecasted to be relatively strong and will grow through the rest of 2014. The Sydney tourism region is expected to grow in attractiveness to investors, tighten supply for hotel rooms and subsequently increase revenue per available room. Regional NSW is most likely to remain steady with similar level of property investment and tourism activity in the second half of 2014.
13
Phone: +61 2 9292 7400
Fax: +61 2 9292 7404
Address: Level 11, 80 Clarence Street Sydney NSW 2000
Email: [email protected]
Follow us: Visit www.prpsydney.com.au to follow us
© Copyright Preston Rowe Paterson Australasia Pty Limited
13
Our Research At Preston Rowe Paterson, we pride ourselves on the research which we prepare in the market sectors within which we operate. These include Commercial, Retail, Industrial, Hotel & Leisure and Residential property mar-kets as well as infrastructure, capital and plant and ma-chinery markets
We have property covered
· Investment · Development · Asset · Corporate Real Estate · Mortgage · Government · Insurance · Occupancy · Sustainability · Research · Real Estate Investment Valuation · Real Estate Development Valuation · Property Consultancy and Advisory · Transaction Advisory · Property and Asset Management · Listed Fund, Property Trust, Super Fund · and Syndicate Advisors · Plant & Machinery Valuation · General and Insurance Valuation · Economic and Property Market Research
We have all real estate types covered
We regularly provide valuation, property and asset man-agement, consultancy and leasing services for all types of real estate including: · CBD and Metropolitan commercial office buildings · Retail shopping centres and shops · Industrial, office/warehouses and factories · Business parks · Hotels (accommodation) and resorts · Hotels (pubs), motels and caravan parks · Residential development projects · Residential dwellings (individual houses and apart-
ments/units) · Rural properties · Special purpose properties such as: nursing homes;
private hospitals, service stations, oil terminals and refineries, theatre complexes; etc.
· Infrastructure including airports and port facilities
We have all types of plant & machinery covered
We regularly undertake valuations of all forms of plant, machinery, furniture, fittings and equipment including: · Mining & earth moving equipment/road plant · Office fit outs, equipment & furniture · Agricultural machinery & equipment · Heavy, light commercial & passenger vehicles · Industrial manufacturing equipment · Wineries and processing plants · Special purpose plant, machinery & equipment · Extractive industries, land fills and resource based
enterprises · Hotel furniture, fittings & equipment
We have all client profiles covered Preston Rowe Paterson acts for an array of clients with all types of real estate, plant, machinery and equipment interests such as: · Accountants · Banks, finance companies and lending
institutions · Commercial and Residential non bank lenders · Co-operatives · Developers · Finance and mortgage brokers · Hotel owners and operators · Institutional investors · Insurance brokers and companies · Investment advisors · Lessors and lessees · Listed and private companies corporations · Listed Property Trusts · Local, State and Federal Government Depart-
ments and Agencies · Mining companies · Mortgage trusts · Overseas clients · Private investors · Property Syndication Managers · Rural landholders · Self managed super funds · Solicitors and barristers · Sovereign wealth funds · Stock brokers · Trustee and Custodial companies
14
Phone: +61 2 9292 7400
Fax: +61 2 9292 7404
Address: Level 11, 80 Clarence Street Sydney NSW 2000
Email: [email protected]
Follow us: Visit www.prpsydney.com.au to follow us
© Copyright Preston Rowe Paterson Australasia Pty Limited
14
We have all locations covered From our capital city and regional office locations we serve our client’s needs throughout Australia. Globally, we operate directly or via our relationship offices for special purpose real estate asset classes, infrastructure and plant & machinery.
We have your needs covered Our clients seek our property (real estate, infrastructure, plant and machinery) services for a multitude of reasons including: · Acquisitions & Disposals · Alternative use & highest and best use analysis · Asset Management · Asset Valuations for financial reporting to meet ASIC,
AASB, IFRS & IVSC guidelines · Compulsory acquisition and resumption · Corporate merger & acquisition real estate due diligence · Due Diligence management for acquisitions and sales · Facilities management · Feasibility studies · Funds management advice & portfolio analysis · Income and outgoings projections and analysis · Insurance valuations (replacement & reinstatement
costs) · Leasing vacant space within managed properties · Listed property trust & investment fund valuations & re-
valuations · Litigation support · Marketing & development strategies · Mortgage valuations · Property Management · Property syndicate valuations and re-valuations · Rating and taxing objections · Receivership, Insolvency and liquidation valuations and
support/advice · Relocation advice, strategies and consultancy · Rental assessments and determinations · Sensitivity analysis · Strategic property planning
15
Phone: +61 2 9292 7400
Fax: +61 2 9292 7404
Address: Level 11, 80 Clarence Street Sydney NSW 2000
Email: [email protected]
Follow us: Visit www.prpsydney.com.au to follow us
© Copyright Preston Rowe Paterson Australasia Pty Limited
15
Sydney (Head Office)
Level 11, 80 Clarence Street
Sydney NSW 2000
PO BOX 4120, Sydney NSW 2001
P: 02 9292 7400
F: 02 9292 7404
W: www.prpsydney.com.au
Follow us:
Preston Rowe Paterson Australasia Pty Ltd
ACN: 060 005 807
The information provided within this publica-
tion should be regarded solely as a general
guide. We believe that the information herein
is accurate however no warranty of accuracy
or reliability is given in relation to any infor-
mation contained in this publication. Nor is
any responsibility for any loss or damage
whatsoever arising in any way for any repre-
sentation, act or omission, whether expressed
or implied (including responsibility to any per-
son or entity by reason of negligence) ac-
cepted by Preston Rowe Paterson Australasia
Pty Ltd or any of its associated offices or any
officer, agent or employee of Preston Rowe
Paterson Australasia Pty Limited.
Directors
Greg Preston
M: 0408 622 400
Greg Rowe
M: 0411 191 179
Associate Directors Chad Green M: 0448 656 103 E: [email protected] Neal Smith M: 0448 656 647 E: [email protected] Michael Goran M: 0448 757 134 E: [email protected] Erika Griffin M: 0448 886 335 E: [email protected]
Capital City Offices
Adelaide
Brisbane
Hobart
Melbourne
Sydney
Regional Offices
Albury Wodonga
Ballarat
Bendigo
Cairns Central Coast/Gosford Geelong Gold Coast Gippsland Griffith Horsham Mornington Newcastle Wagga Wagga Warrnambool
Relationship Offices
Canberra
Darwin
Perth
Other regional areas