Embed Size (px)
Citation preview
State of the Markets The IPO Window Reopens Third Quarter 2016
Written by SVB Analytics:
Steve Allan, CFA Head of Analytics
Sean Lawson Manager
Steven Kakowski Associate
Steven Pipp Associate
John Ortelle Manager
State of the Markets
State of the Markets 2
1 Market Dynamics ⁻ Investment and Exit Trends
2 Key Themes ⁻ M&A Restores Valuation Confidence ⁻ Public Unicorns Grow into Their Private Values

State of the Markets 3
Market Dynamics
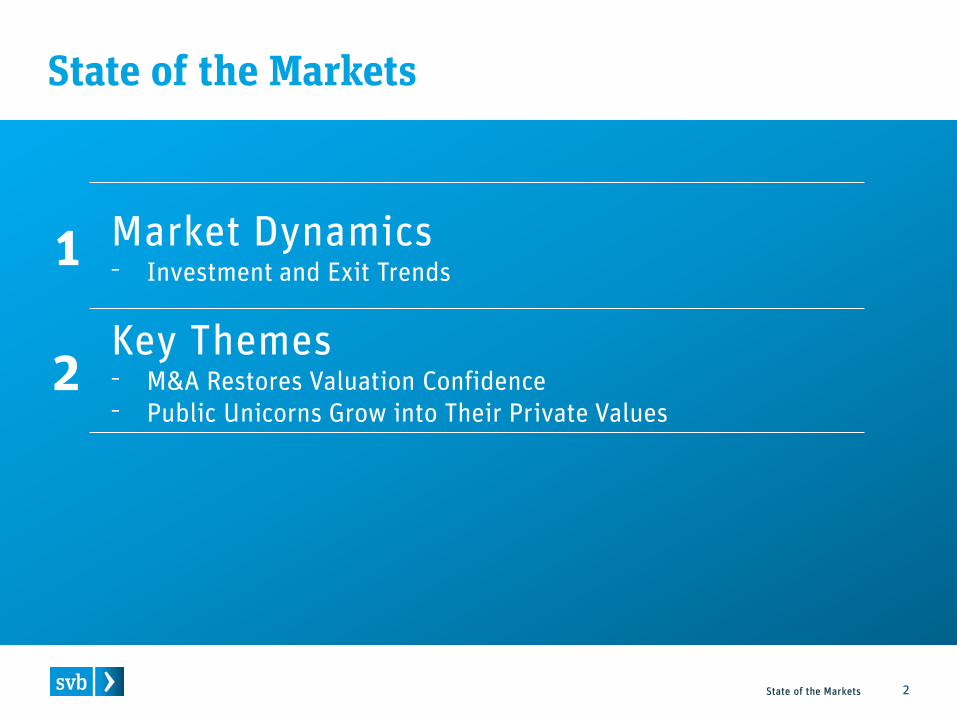
Equity Markets Weather Macro Storms
State of the Markets 4
Nasdaq Composite Index: Sep. 2008 – Sep. 2016
The U.S. equity markets have withstood several cycles of global macroeconomic and geopolitical uncertainty since early 2014, but in Q3 2016 reached all-time highs.
0
1,000
2,000
3,000
4,000
5,000
6,000
Sep '08 Sep '09 Sep '10 Sep '11 Sep '12 Sep '13 Sep '14 Sep '15 Sep '16
Source: S&P Capital IQ, Bloomberg, FiveThirtyEight
Year 2000 Peak
Market Movers: Q3 2016
26% 26%
47% 48% 53%
Sep '16 Nov '16 Dec '16 Feb '17 Mar '17
Implied Probability: Fed Funds Futures
25
50
75
100%
Sep ‘16
67.5%
32.5%
Clinton Trump
Presidential Election Forecasts
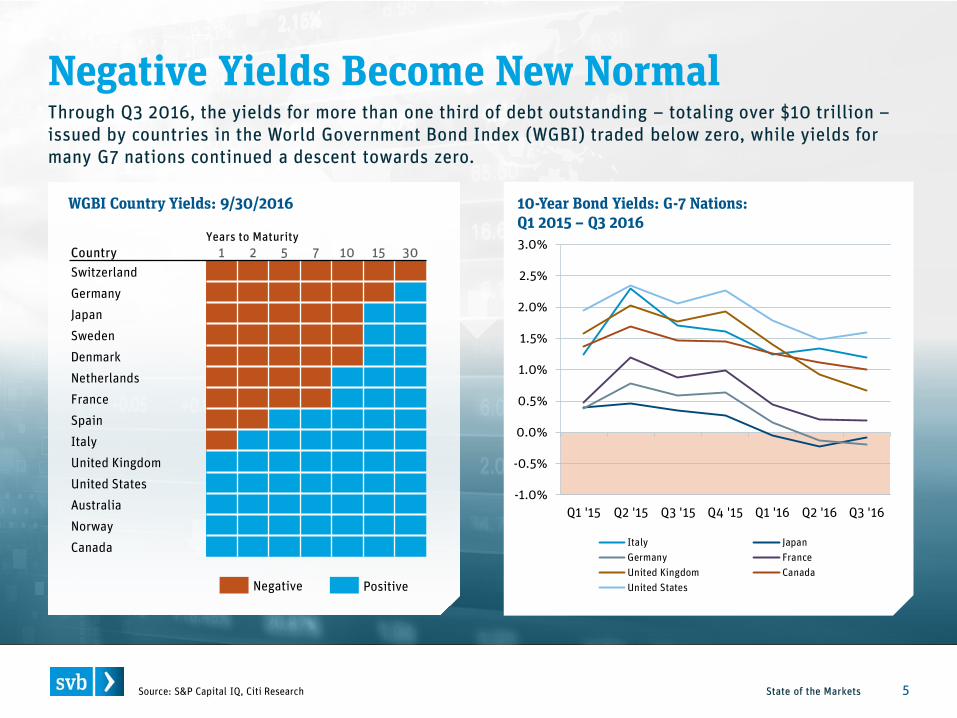
Negative Yields Become New Normal
State of the Markets 5
WGBI Country Yields: 9/30/2016
Source: S&P Capital IQ, Citi Research
10-Year Bond Yields: G-7 Nations: Q1 2015 – Q3 2016
Country 1 2 5 7 10 15 30 Switzerland Germany Japan Sweden Denmark Netherlands France Spain Italy United Kingdom United States Australia Norway Canada
Negative
-1.0%
-0.5%
0.0%
0.5%
1.0%
1.5%
2.0%
2.5%
3.0%
Q1 '15 Q2 '15 Q3 '15 Q4 '15 Q1 '16 Q2 '16 Q3 '16
Italy JapanGermany FranceUnited Kingdom CanadaUnited StatesPositive
Years to Maturity
Through Q3 2016, the yields for more than one third of debt outstanding – totaling over $10 trillion – issued by countries in the World Government Bond Index (WGBI) traded below zero, while yields for many G7 nations continued a descent towards zero.
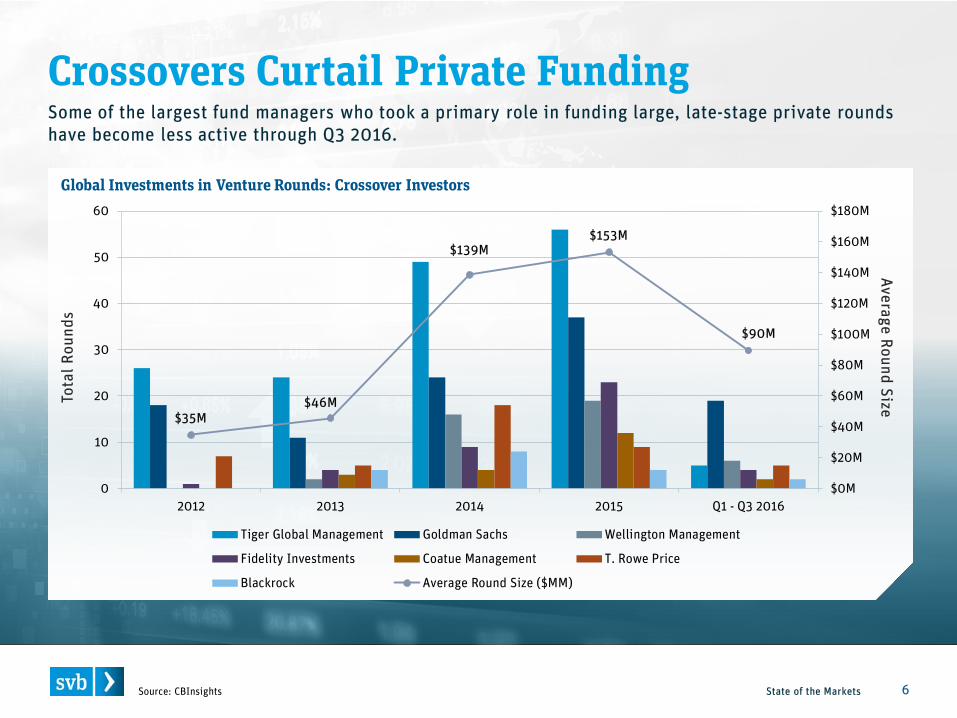
Crossovers Curtail Private Funding
State of the Markets 6 Source: CBInsights
Global Investments in Venture Rounds: Crossover Investors
Tota
l Rou
nds
Average Round Size $35M $46M
$139M $153M
$90M
$0M
$20M
$40M
$60M
$80M
$100M
$120M
$140M
$160M
$180M
0
10
20
30
40
50
60
2012 2013 2014 2015 Q1 - Q3 2016
Tiger Global Management Goldman Sachs Wellington Management
Fidelity Investments Coatue Management T. Rowe Price
Blackrock Average Round Size ($MM)
Some of the largest fund managers who took a primary role in funding large, late-stage private rounds have become less active through Q3 2016.
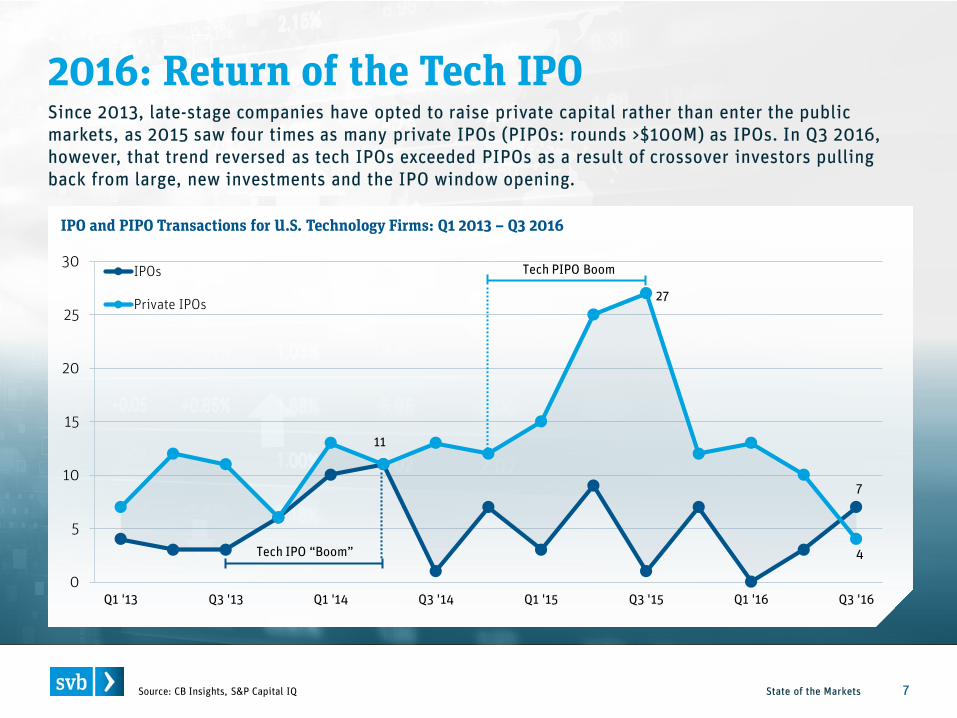
2016: Return of the Tech IPO
State of the Markets 7 Source: CB Insights, S&P Capital IQ
IPO and PIPO Transactions for U.S. Technology Firms: Q1 2013 – Q3 2016
0
5
10
15
20
25
30
Q1 '13 Q3 '13 Q1 '14 Q3 '14 Q1 '15 Q3 '15 Q1 '16 Q3 '16
IPOs
Private IPOs 27
4
11
7
Tech IPO “Boom”
Tech PIPO Boom
Since 2013, late-stage companies have opted to raise private capital rather than enter the public markets, as 2015 saw four times as many private IPOs (PIPOs: rounds >$100M) as IPOs. In Q3 2016, however, that trend reversed as tech IPOs exceeded PIPOs as a result of crossover investors pulling back from large, new investments and the IPO window opening.
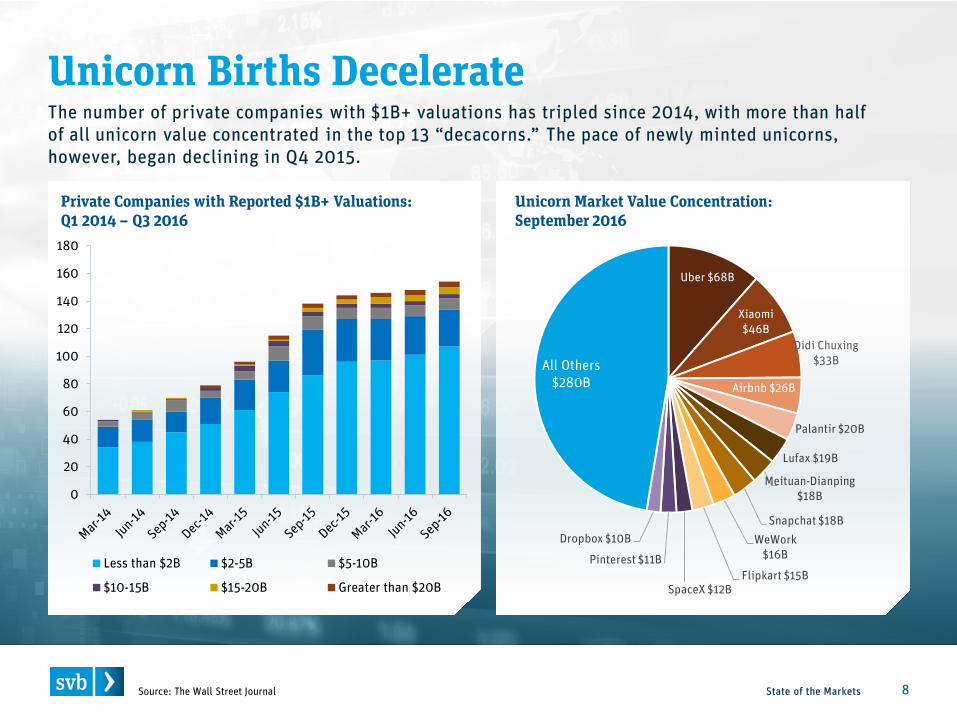
Unicorn Births Decelerate
State of the Markets 8 Source: The Wall Street Journal
Private Companies with Reported $1B+ Valuations: Q1 2014 – Q3 2016
Unicorn Market Value Concentration: September 2016
Uber $68B
Xiaomi $46B
Didi Chuxing $33B
Airbnb $26B
Palantir $20B
Lufax $19B
Meituan-Dianping $18B
Snapchat $18B WeWork
$16B
Flipkart $15B SpaceX $12B
Pinterest $11B
Dropbox $10B
All Others $280B
0
20
40
60
80
100
120
140
160
180
Less than $2B $2-5B $5-10B
$10-15B $15-20B Greater than $20B
The number of private companies with $1B+ valuations has tripled since 2014, with more than half of all unicorn value concentrated in the top 13 “decacorns.” The pace of newly minted unicorns, however, began declining in Q4 2015.
Tech Companies Stay Private Longer
State of the Markets 9
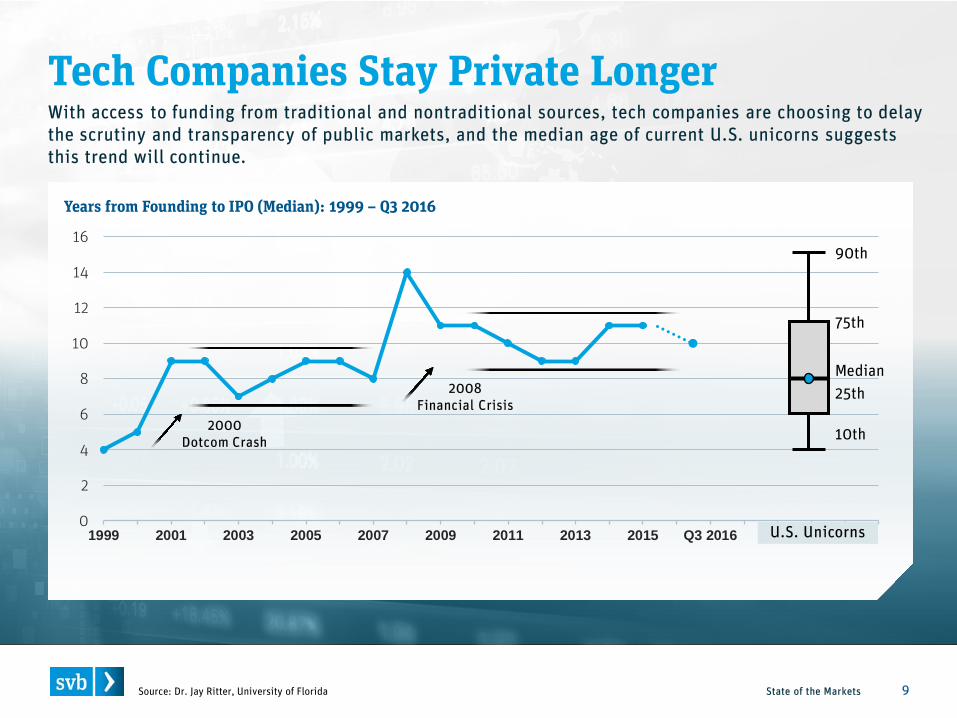
Years from Founding to IPO (Median): 1999 – Q3 2016
0
2
4
6
8
10
12
14
16
1999 2001 2003 2005 2007 2009 2011 2013 2015 Q3 2016
Source: Dr. Jay Ritter, University of Florida
U.S. Unicorns
2000 Dotcom Crash
2008 Financial Crisis
90th
10th
Median 25th
75th
With access to funding from traditional and nontraditional sources, tech companies are choosing to delay the scrutiny and transparency of public markets, and the median age of current U.S. unicorns suggests this trend will continue.
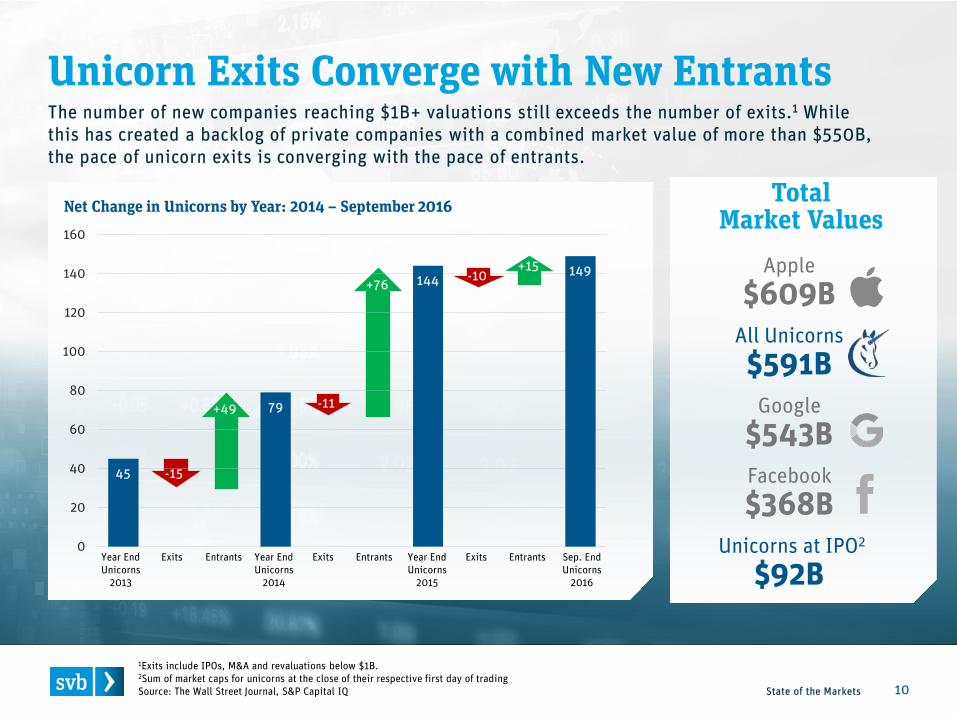
Net Change in Unicorns by Year: 2014 – September 2016
Unicorn Exits Converge with New Entrants
State of the Markets 10
Total Market Values
All Unicorns $591B
1Exits include IPOs, M&A and revaluations below $1B. 2Sum of market caps for unicorns at the close of their respective first day of trading Source: The Wall Street Journal, S&P Capital IQ
Year End Unicorns
2013
Exits Entrants Year End Unicorns
2015
Year End Unicorns
2014
Exits Entrants Exits Entrants Sep. End Unicorns
2016
45 -15
+49 79 -11
+76 144 149
0
20
40
60
80
100
120
140
160
Apple $609B
Google $543B Facebook $368B
Unicorns at IPO2
$92B
The number of new companies reaching $1B+ valuations still exceeds the number of exits.1 While this has created a backlog of private companies with a combined market value of more than $550B, the pace of unicorn exits is converging with the pace of entrants.
-10 +15
As Exit Conditions Improve, IPO Window Opens
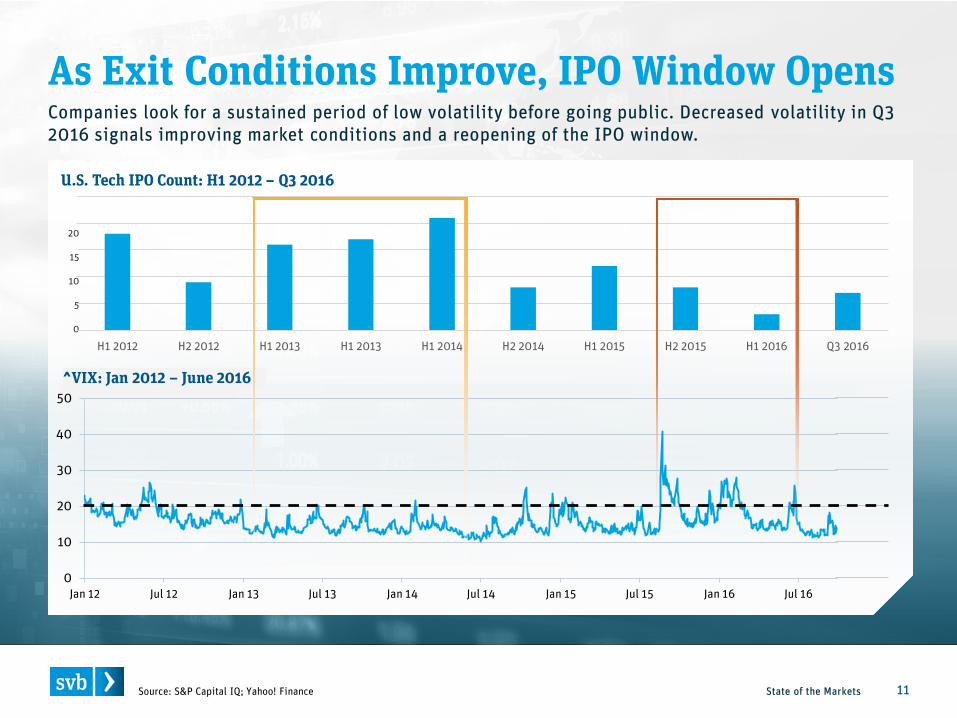
State of the Markets 11 Source: S&P Capital IQ; Yahoo! Finance
U.S. Tech IPO Count: H1 2012 – Q3 2016
20
15
10
5
0
^VIX: Jan 2012 – June 2016
0
10
20
30
40
50
Jan 12 Jul 12 Jan 13 Jul 13 Jan 14 Jul 14 Jan 15 Jul 15 Jan 16 Jul 16
H1 2012 H2 2012 H1 2013 H1 2013 H1 2014 H2 2014 H1 2015 H2 2015 H1 2016 Q3 2016
Companies look for a sustained period of low volatility before going public. Decreased volatility in Q3 2016 signals improving market conditions and a reopening of the IPO window.

State of the Markets 12
Q3 2016 Key Themes
Market Downswing and Idle Cash Spur SaaS M&A
State of the Markets 13
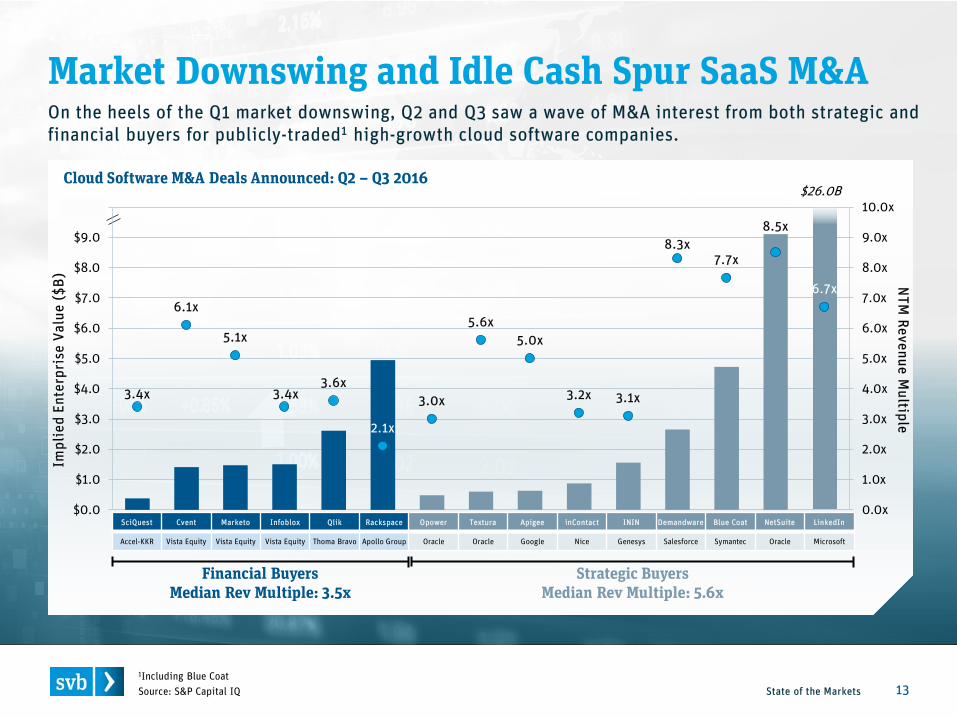
Cloud Software M&A Deals Announced: Q2 – Q3 2016
Source: S&P Capital IQ
$26.0B
Impl
ied
Ente
rpri
se V
alue
($B)
N
TM Revenue M
ultiple
Financial Buyers Median Rev Multiple: 3.5x
Strategic Buyers Median Rev Multiple: 5.6x
3.4x
6.1x
5.1x
3.4x 3.6x
2.1x
3.0x
5.6x 5.0x
3.2x 3.1x
8.3x 7.7x
8.5x
6.7x
0.0x
1.0x
2.0x
3.0x
4.0x
5.0x
6.0x
7.0x
8.0x
9.0x
10.0x
$0.0
$1.0
$2.0
$3.0
$4.0
$5.0
$6.0
$7.0
$8.0
$9.0
$10.0
SciQuest Cvent Marketo Infoblox Qlik Rackspace Opower Textura Apigee inContact ININ Demandware Blue Coat NetSuite LinkedIn
Accel-KKR Vista Equity Vista Equity Vista Equity Thoma Bravo Apollo Group Oracle Oracle Google Nice Genesys Salesforce Symantec Oracle Microsoft
On the heels of the Q1 market downswing, Q2 and Q3 saw a wave of M&A interest from both strategic and financial buyers for publicly-traded1 high-growth cloud software companies.
1Including Blue Coat
0.0x
1.0x
2.0x
3.0x
4.0x
5.0x
6.0x
7.0x
8.0x
9.0x
10.0x
3/31/15 6/30/15 9/30/15 12/31/15 3/31/16 6/30/16 9/30/16
M&A Flurry Restores Valuation Confidence
State of the Markets 14
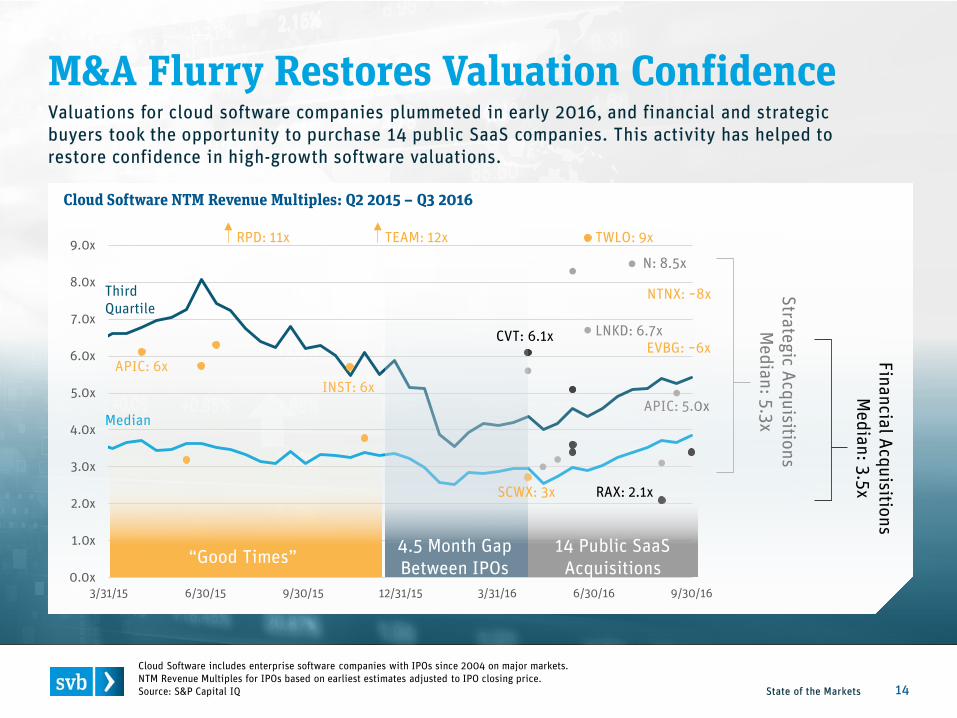
Cloud Software includes enterprise software companies with IPOs since 2004 on major markets. NTM Revenue Multiples for IPOs based on earliest estimates adjusted to IPO closing price. Source: S&P Capital IQ
Third Quartile
Median
Strategic Acquisitions M
edian: 5.3x
TEAM: 12x RPD: 11x
Financial Acquisitions M
edian: 3.5x
LNKD: 6.7x
N: 8.5x
TWLO: 9x
APIC: 6x
APIC: 5.0x INST: 6x
4.5 Month Gap Between IPOs
14 Public SaaS Acquisitions
RAX: 2.1x
CVT: 6.1x
NTNX: ~8x
EVBG: ~6x
SCWX: 3x
“Good Times”
Valuations for cloud software companies plummeted in early 2016, and financial and strategic buyers took the opportunity to purchase 14 public SaaS companies. This activity has helped to restore confidence in high-growth software valuations.
Cloud Software NTM Revenue Multiples: Q2 2015 – Q3 2016
Flurry of M&A Leaves Cash-Flush Investors
State of the Markets 15 Source: S&P Capital IQ
$12B $16B
$25B $25B
$62B
$72B
$1.5B $2.2B $2.8B $2.9B $3.7B $4.6B
$0
$10
$20
$30
$40
$50
$60
$70
$80
Q2 '15 Q3 '15 Q4 '15 Q1 '16 Q2 '16 Q3 '16
$B U
SD
Announced M&A – Proceeds to Floating Shares
Closed M&A – Proceeds to Floating Shares
IPO and Follow-On Offerings
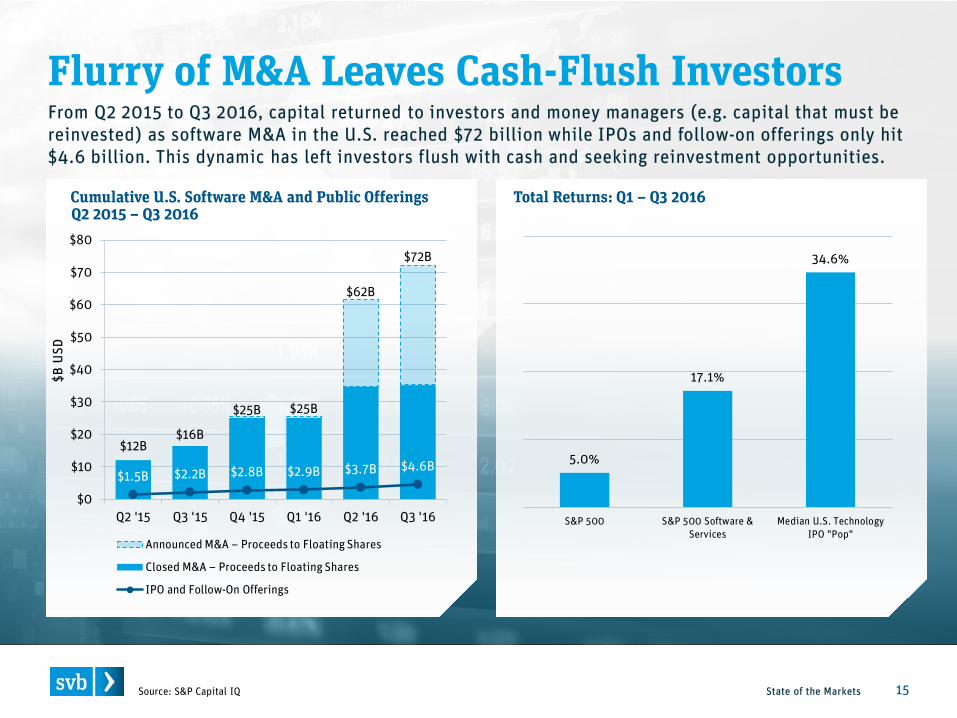
Cumulative U.S. Software M&A and Public Offerings Q2 2015 – Q3 2016
5.0%
17.1%
34.6%
S&P 500 S&P 500 Software &Services
Median U.S. TechnologyIPO "Pop"
Total Returns: Q1 – Q3 2016
From Q2 2015 to Q3 2016, capital returned to investors and money managers (e.g. capital that must be reinvested) as software M&A in the U.S. reached $72 billion while IPOs and follow-on offerings only hit $4.6 billion. This dynamic has left investors flush with cash and seeking reinvestment opportunities.
Public Unicorns Grow into Their Private Values
State of the Markets 16 Source: Wall Street Journal, S&P Capital IQ
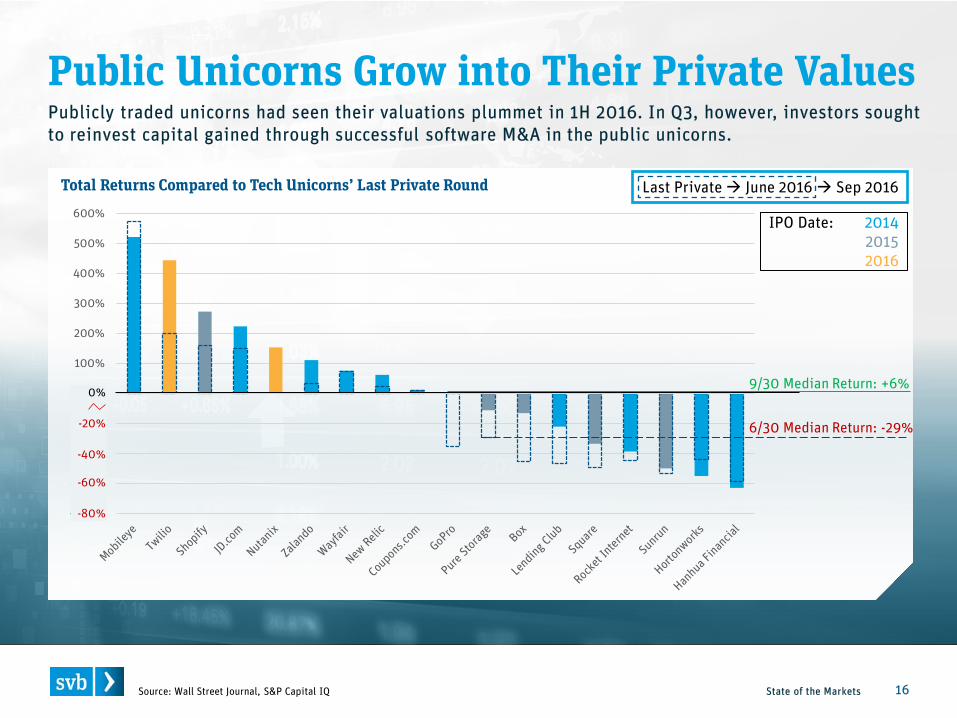
Total Returns Compared to Tech Unicorns’ Last Private Round Last Private June 2016 Sep 2016
-400%
-300%
-200%
-100%
0%
100%
200%
300%
400%
500%
600%
0%
-20%
-40%
-60%
-80%
IPO Date: 2014 2015 2016
6/30 Median Return: -29%
9/30 Median Return: +6%
Publicly traded unicorns had seen their valuations plummet in 1H 2016. In Q3, however, investors sought to reinvest capital gained through successful software M&A in the public unicorns.
Private Valuations Reveal Divergence
State of the Markets 17 Source: Pitchbook
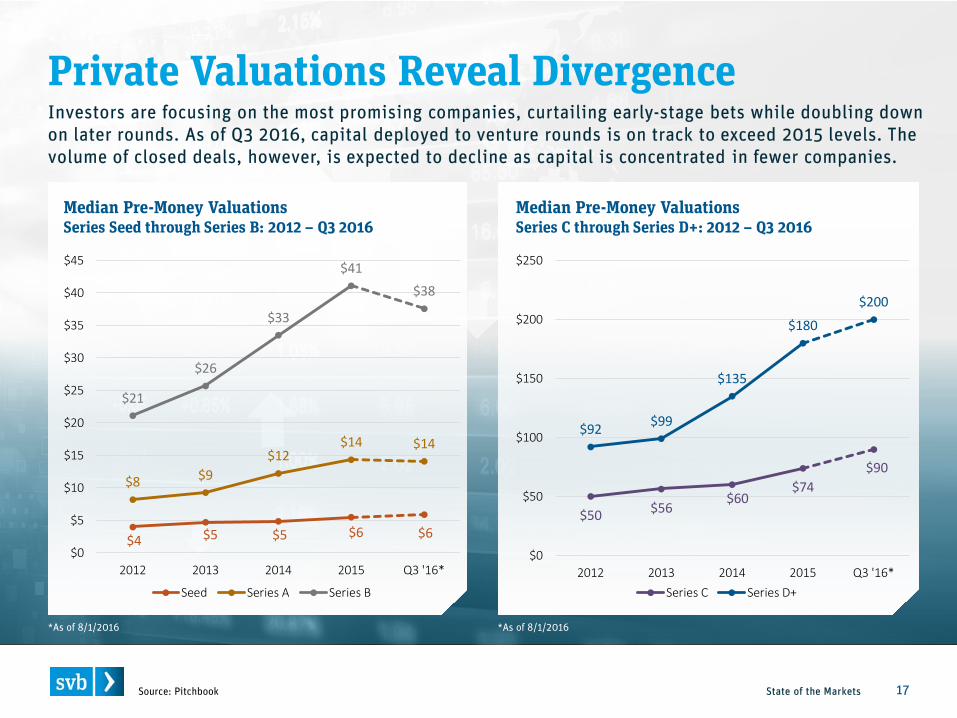
Median Pre-Money Valuations Series Seed through Series B: 2012 – Q3 2016
Median Pre-Money Valuations Series C through Series D+: 2012 – Q3 2016
$4 $5 $5 $6 $6
$8 $9 $12
$14 $14
$21
$26
$33
$41 $38
$0
$5
$10
$15
$20
$25
$30
$35
$40
$45
2012 2013 2014 2015 Q3 '16*
Seed Series A Series B
$50 $56 $60
$74 $90
$92 $99
$135
$180
$200
$0
$50
$100
$150
$200
$250
2012 2013 2014 2015 Q3 '16*Series C Series D+
*As of 8/1/2016 *As of 8/1/2016
Investors are focusing on the most promising companies, curtailing early-stage bets while doubling down on later rounds. As of Q3 2016, capital deployed to venture rounds is on track to exceed 2015 levels. The volume of closed deals, however, is expected to decline as capital is concentrated in fewer companies.
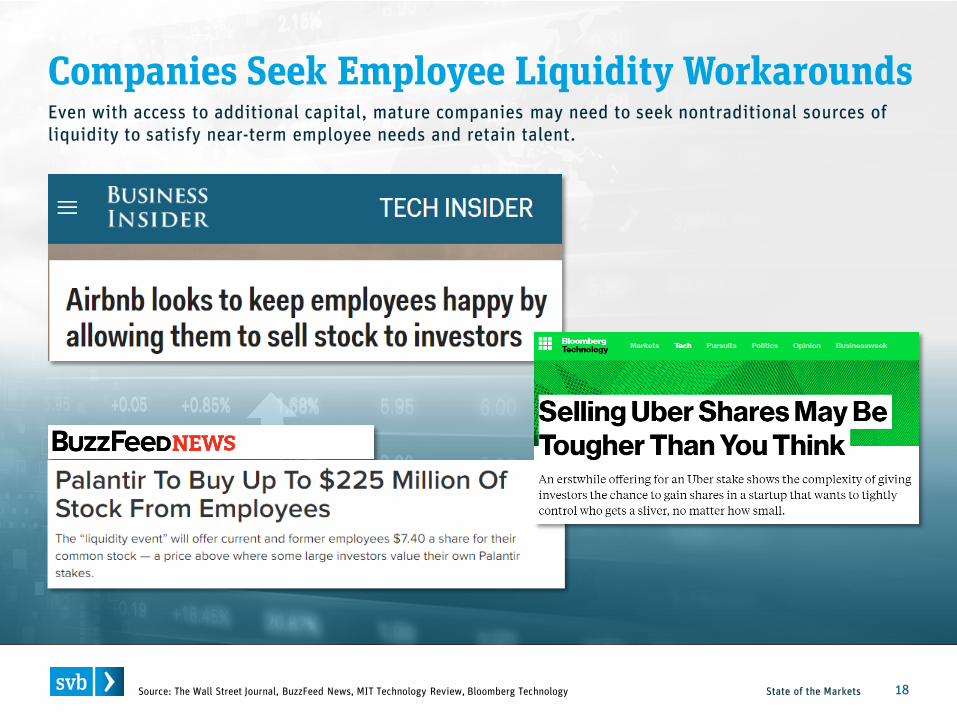
Companies Seek Employee Liquidity Workarounds
State of the Markets 18 Source: The Wall Street Journal, BuzzFeed News, MIT Technology Review, Bloomberg Technology
Even with access to additional capital, mature companies may need to seek nontraditional sources of liquidity to satisfy near-term employee needs and retain talent.

Report Authors
State of the Markets 19
Steven Pipp Associate, SVB Analytics [email protected]
Steve Allan, CFA Head of SVB Analytics [email protected]
Sean Lawson Manager, SVB Analytics [email protected]
John Ortelle Manager, SVB Analytics [email protected]
Steven Kakowski Associate, SVB Analytics [email protected]
About Silicon Valley Bank For more than 30 years, Silicon Valley Bank has helped innovative companies and their investors move bold ideas forward, fast. SVB provides targeted financial services and expertise through its offices in innovation centers around the world. With commercial, international and private banking services, SVB helps address the unique needs of innovators.
State of the Markets 20
This material, including without limitation to the statistical information herein, is provided for informational purposes only. The material is based in part on information from third-party sources that we believe to be reliable, but which have not been independently verified by us and for this reason we do not represent that the information is accurate or complete. The information should not be viewed as tax, investment, legal or other advice nor is it to be relied on in making an investment or other decision. You should obtain relevant and specific professional advice before making any investment decision. Nothing relating to the material should be construed as a solicitation, offer or recommendation to acquire or dispose of any investment or to engage in any other transaction. SVB Analytics is a member of SVB Financial Group and a non-bank affiliate of Silicon Valley Bank. Products and services offered by SVB Analytics are not FDIC insured and are not deposits or other obligations of Silicon Valley Bank. SVB Analytics does not provide investment, tax, or legal advice. Please consult your investment, tax, or legal advisors for such guidance. ©2016 SVB Financial Group. All rights reserved. Silicon Valley Bank is a member of FDIC and Federal Reserve System. SVB>, SVB Financial Group, and Silicon Valley Bank are registered trademarks. 1016-258
About SVB Analytics SVB Analytics, a non-bank affiliate of Silicon Valley Bank, serves the strategic business needs of entrepreneurs, corporates and investors in the global innovation economy. For more than a decade, SVB Analytics has helped global business leaders make informed decisions by providing market intelligence, research, and consulting services. Powered by proprietary data, SVB Analytics has a unique view into the technology and life science sectors.