Embed Size (px)
Citation preview


Total Markets Table Developed Markets vs. EPRA Index
Commentary 1 Europe 15
Market Activity & Corporate Actions 2 Middle East & Africa 15
North America 16
Size of Developed Markets Asia-Pacific 16
Europe 3
Middle East & Africa 3 Emerging Markets vs. EPRA Index
North America 4 Europe 17
Asia-Pacific 4 Middle East & Africa 17
Americas 18
Size of Emerging Markets Asia-Pacific 18
Europe 5
Middle East & Africa 5 Economic Regions vs. EPRA Index
Americas 6 European Union 19
Asia-Pacific 6 Eurozone 20
Eurozone (EUR) 21
Economic Regions OECD 22
European Union 7
Eurozone 8 Global Markets Table vs. EPRA Index
Eurozone (EUR) 9 76 countries 24
OECD 10
Methodology 27
Global Markets Table
76 countries 12 Disclaimer 28
Tim Kesseler Ali Zaidi Inna Maslova David Moreno
Investor Outreach Continental Europe Director Research & Indices Analyst Research & Indices Analyst Research & Indices
[email protected] [email protected] [email protected] [email protected]
T +32 (0) 2739 1028 T +32 (0) 2739 1019 T +32 (0) 2739 1022 T +32 (0) 2739 1010
0
EPRA Research & Indices TeamEPRA Investor Outreach
Total Markets Table Q3-2017
Square de Meeus 23 ■ B-1000 Brussels, Belgium ■ T +32 2739 1010 ■ F +32 2739 1020 ■ E [email protected] ■ W www.epra.com
Contents

1
Total Markets Table Commentary Q3-2017
Square de Meeus 23 ■ B-1000 Brussels, Belgium ■ T +32 2739 1010 ■ F +32 2739 1020 ■ E [email protected] ■ W www.epra.com
EPRA Developed Markets
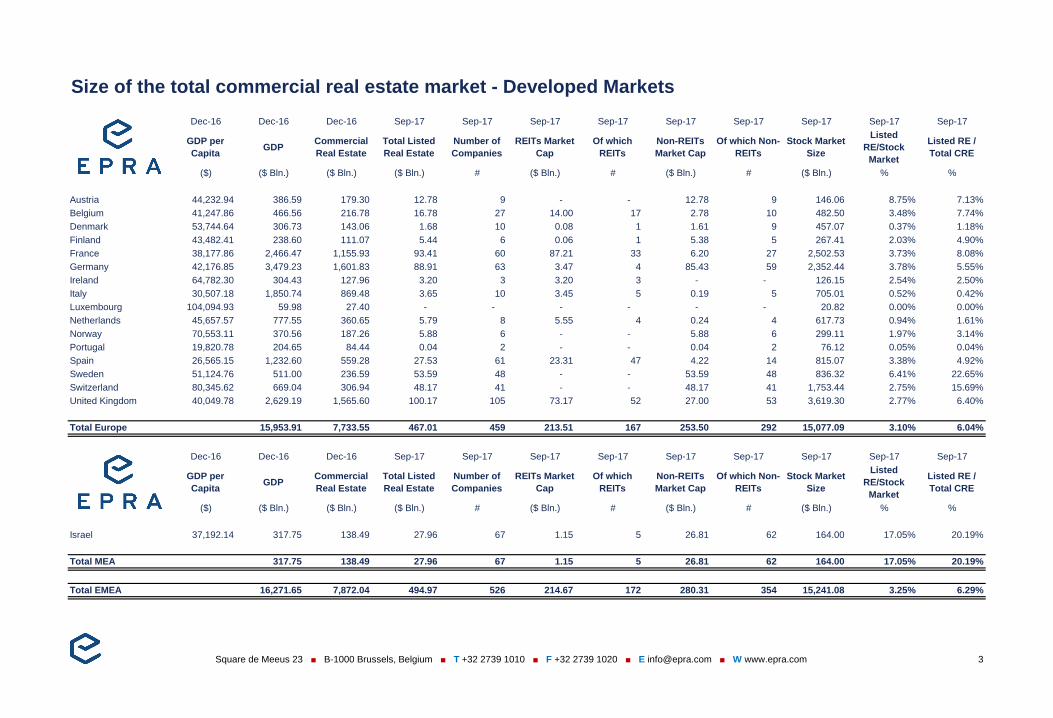
At the end of the third quarter of 2017 the value of the total listed real estate sector in Developed Europewas USD 467 billion. Largest markets are the United Kingdom (USD 100.17 billion), France (USD 93.41billion), and Germany (USD 88.91 billion). Of the USD 467 billion listed real estate sector 64.9% isrepresented in the FTSE EPRA/NAREIT Developed Europe Index. The estimated total Commercial RealEstate (CRE) value in Developed Europe is estimated at over USD 7.7 trillion on a total GDP of close toUSD 16 trillion. The listed real estate sector in Developed Europe represents 6.04% of the totalCommercial Real Estate Value. In North America the estimated value of the Commercial Real Estatesector is over USD 8.8 trillion and the value of the listed real estate sector is USD 1,163 billion. 73% ofthe listed real estate sector is represented in the FTSE EPRA/NAREIT North America Index. Theestimated value of the Commercial Real Estate sector in the Asia-Pacific region is close to USD 4 trillionand the total value of listed real estate in the region is USD 732.94 billion.
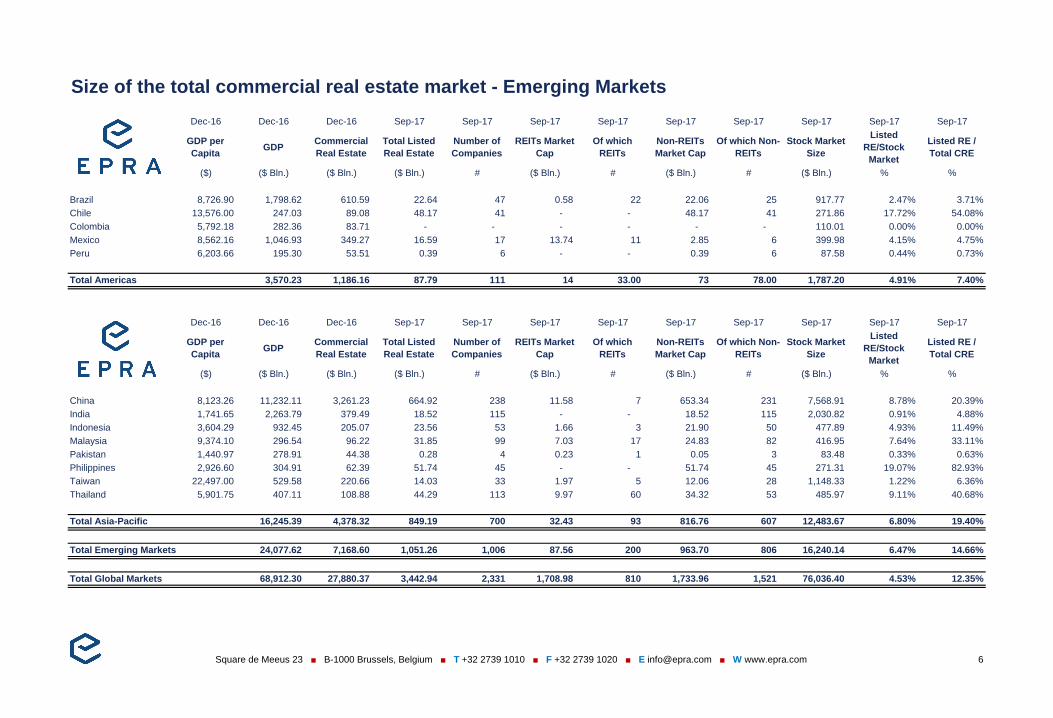
EPRA Emerging Markets
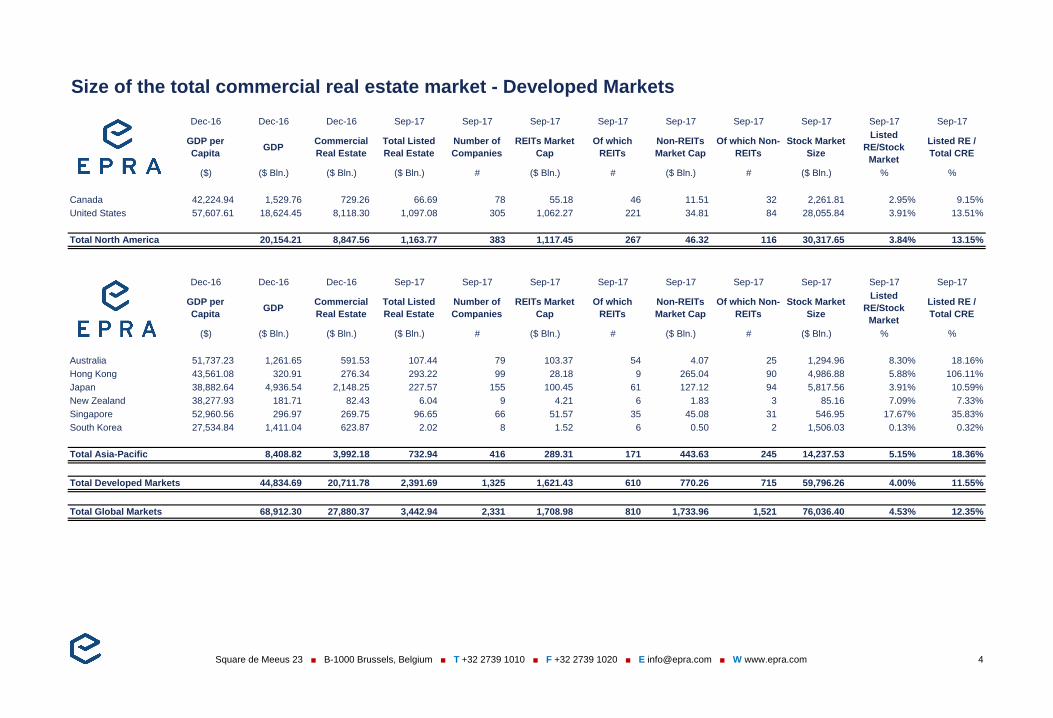
The emerging markets have a total estimated Commercial Real Estate value of just under USD 7.2trillion, covering 23 countries. The total listed real estate sector in the emerging market is USD 849.19billion. South Africa has the largest REIT market within the Emerging Markets with an estimated value ofclose to USD 30 billion.
EPRA Global Markets
Commercial Real Estate in the global markets covered by FTSE EPRA/NAREIT is estimated at USD27.88 trillion, with a total listed real estate sector valued at USD 3.26 trillion (11.69%). The full indexmarket cap at the end of Q3-2017 was USD 2.16 trillion, representing two thirds of the total market cap oflisted real estate across the globe.
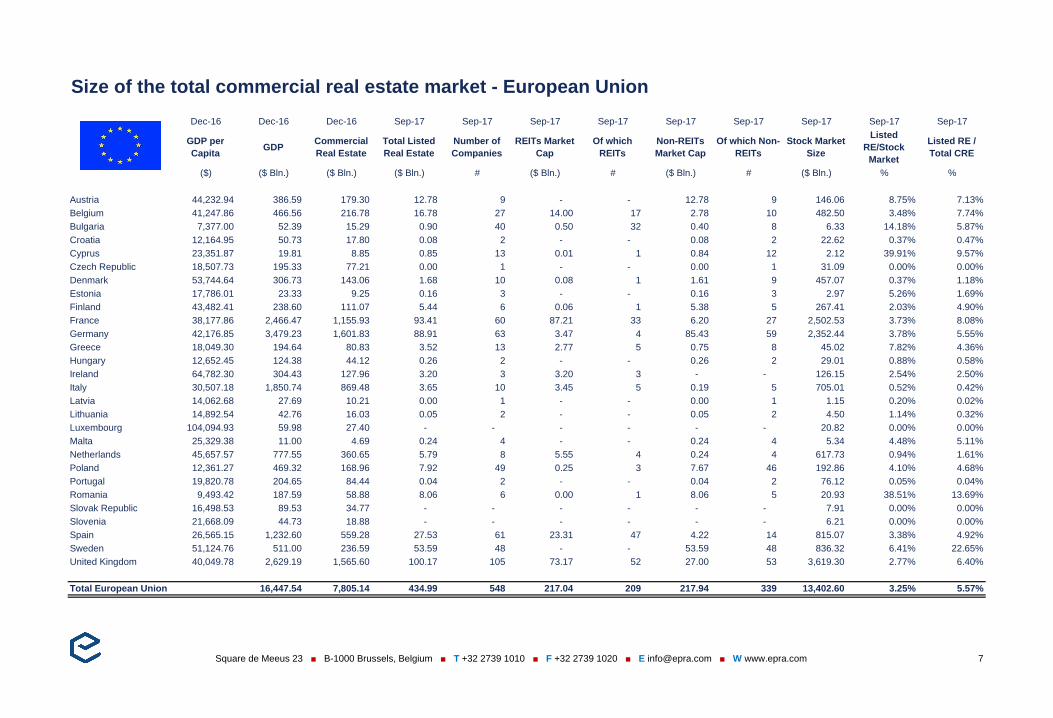
The European Union
The 28 member states of the European Union have a combined estimated Commerical Real Estatemarket value of over USD 7.8 trillion on a combined GDP of close to USD 16.5 trillion. The value of thelisted real estate sector is USD 435 billion, represented in the FTSE EPRA/NAREIT Global Real EstateIndex by USD 286.61 billion (or 5.57% of the total CRE value). Within the listed sector in the EU thereare currently over 200 REIT's with a combined market cap of over USD 217 billion. There are over 330Non-REIT's with a market cap of close to USD 218 billion.
Global estimated value of the Commercial Real Estate sector
All 76 covered countries in this Total Markets Table report represent an estimated Commercial RealEstate Value ofover USD 29 trillion.

Table 1. Real Estate IPO's in Developed Europe
IPO Proceeds
IPO Date Company Name Country Listing (EUR Mln)
11-07-17 Nexus Infrastructure UK Main 39.83
12-07-17 Residential Secure Income plc UK Main 203.35
21-07-17 Supermarket Income REIT PLC UK SFM 113.48
08-08-17 Triple Point Social Housing REIT UK SFM 223.08
20-09-17 Warehouse REIT plc UK AIM 163.76
Q3 2017 Total Developed Europe 743.50
2
Market Activity & Corporate Actions Q3-2017
Square de Meeus 23 ■ B-1000 Brussels, Belgium ■ T +32 2739 1010 ■ F +32 2739 1020 ■ E [email protected] ■ W www.epra.com
Initial Public Offerings
Mergers & Acquisitions
Capital Raises
Index Corporate Actions
The third quarter of 2017 was dominated by IPO's in the United Kingdom. A total of fivecompanies within EPRA's scope entered the market and raised a combined amount ofalmost three quarters of a billion euro's. Four of the IPO's are REIT's or intend to qualify asa REIT within a short period of time. Both Supermarket Income REIT PLC and TriplePoint Social Housing REIT listed on the Specialist Fund Market (SFM) of the LondonStock Exchange and Warehouse REIT plc started trading on the Alternative InvestmentMarket of the LSE.In the first three quarters of 2017 the European market has seen 18 IPO's raising acombined amount of EUR 4.3 billion. Since 2013 the amount raised has passed the EUR20 billion mark. There are a IPO's in the pipeline for the last quarter of this year and forearly 2018.
Finnish constituent Sponda has been deleted from the indices following the succesfultakeover by Polar Bidco. In the US, JBG SMITH Properties has been added to the indicesafter a demerger from constituent Vornado Realty. Care Capital Properties has beendeleted from the indices after a merger with Sabra Health Care Properties, a USconstituent. Felcor Lodging Trust has also been deleted from the indices following amerger with index constituent RLJ Lodging Trust. The same applies to the deletion ofDuPont Fabros Technology, which merged with Digital Realty Trust. MonogramResidential Trust Inc has been acquired by Greystar Real Estate Partners and wassubsequently deleted from the indices.
In Q3 2017 the total of debt and equity raised by FTSE EPRA/NAREIT Developed EuropeIndex constituents is EUR 9.3 billion, divided into equity & rights issues (EUR 2.4 billion)and debt issues (EUR 6.9 billion). The capital raised in the first three quarters of 2017 forthe FTSE EPRA/NAREIT Developed Europe Index constituents totals over EUR 14.1billion. More detailed information regarding capital raises for the FTSE EPRA/NAREITDeveloped Europe Index can be found in the EPRA Monthlty LTV Monitor.
In July European index constituents Empiric Student Property and Gecina had a succesful 1-for-7rights issue. At the June quarterly review, three companies passed the criterion for entering theindex. Catena AB from Sweden, Carmila SA from France, and Xior Student Housing NV fromBelgium. The effective date of entering the index was September 18, 2017. Norwegian PropertyASA was deleted from the index based on the liquidity rule. Inmobiliaria Colonial was reclassifiedfrom Non-REIT to REIT and Helical PLC from Diversified to Industrial/Office. Both Citycon (Finland)and Landsec (UK) had a capital repayment at the end of September.
US constituent Colony Starwood Homes changed its name to Starwood Waypoint Homes andHong Kong constituent Cheung Kong Property Holdings changed its name to CK AssetHoldings. Vukile Property Fund (SA) has been reclassified from Diversified to Retail.
Following the June index review five companies have been added and five companies have beendeleted from the Emerging Index. Construtora Tenda SA (Brazil), SP Setia (Malaysia), Sentul City(Indonesia), Origin Property (Thailand), and Liu Chong Hing Investment (China) have beenadded. DoubleDragon Properties (Philippines), Property Perfect (Thailand), Ascendas IndiaTrust (India), PDG Realty S/A Empreendimentos e Participacoes Ord (Brazil), and Sino-OceanGroup Holding (China) have been deleted from the index.
Dec-16 Dec-16 Dec-16 Sep-17 Sep-17 Sep-17 Sep-17 Sep-17 Sep-17 Sep-17 Sep-17 Sep-17
GDP per
CapitaGDP
Commercial
Real Estate
Total Listed
Real Estate
Number of
Companies
REITs Market
Cap
Of which
REITs
Non-REITs
Market Cap
Of which Non-
REITs
Stock Market
Size
Listed
RE/Stock
Market
Listed RE /
Total CRE
($) ($ Bln.) ($ Bln.) ($ Bln.) # ($ Bln.) # ($ Bln.) # ($ Bln.) % %
Austria 44,232.94 386.59 179.30 12.78 9 - - 12.78 9 146.06 8.75% 7.13%
Belgium 41,247.86 466.56 216.78 16.78 27 14.00 17 2.78 10 482.50 3.48% 7.74%
Denmark 53,744.64 306.73 143.06 1.68 10 0.08 1 1.61 9 457.07 0.37% 1.18%
Finland 43,482.41 238.60 111.07 5.44 6 0.06 1 5.38 5 267.41 2.03% 4.90%
France 38,177.86 2,466.47 1,155.93 93.41 60 87.21 33 6.20 27 2,502.53 3.73% 8.08%
Germany 42,176.85 3,479.23 1,601.83 88.91 63 3.47 4 85.43 59 2,352.44 3.78% 5.55%
Ireland 64,782.30 304.43 127.96 3.20 3 3.20 3 - - 126.15 2.54% 2.50%
Italy 30,507.18 1,850.74 869.48 3.65 10 3.45 5 0.19 5 705.01 0.52% 0.42%
Luxembourg 104,094.93 59.98 27.40 - - - - - - 20.82 0.00% 0.00%
Netherlands 45,657.57 777.55 360.65 5.79 8 5.55 4 0.24 4 617.73 0.94% 1.61%
Norway 70,553.11 370.56 187.26 5.88 6 - - 5.88 6 299.11 1.97% 3.14%
Portugal 19,820.78 204.65 84.44 0.04 2 - - 0.04 2 76.12 0.05% 0.04%
Spain 26,565.15 1,232.60 559.28 27.53 61 23.31 47 4.22 14 815.07 3.38% 4.92%
Sweden 51,124.76 511.00 236.59 53.59 48 - - 53.59 48 836.32 6.41% 22.65%
Switzerland 80,345.62 669.04 306.94 48.17 41 - - 48.17 41 1,753.44 2.75% 15.69%
United Kingdom 40,049.78 2,629.19 1,565.60 100.17 105 73.17 52 27.00 53 3,619.30 2.77% 6.40%
Total Europe 15,953.91 7,733.55 467.01 459 213.51 167 253.50 292 15,077.09 3.10% 6.04%
Dec-16 Dec-16 Dec-16 Sep-17 Sep-17 Sep-17 Sep-17 Sep-17 Sep-17 Sep-17 Sep-17 Sep-17
GDP per
CapitaGDP
Commercial
Real Estate
Total Listed
Real Estate
Number of
Companies
REITs Market
Cap
Of which
REITs
Non-REITs
Market Cap
Of which Non-
REITs
Stock Market
Size
Listed
RE/Stock
Market
Listed RE /
Total CRE
($) ($ Bln.) ($ Bln.) ($ Bln.) # ($ Bln.) # ($ Bln.) # ($ Bln.) % %
Israel 37,192.14 317.75 138.49 27.96 67 1.15 5 26.81 62 164.00 17.05% 20.19%
Total MEA 317.75 138.49 27.96 67 1.15 5 26.81 62 164.00 17.05% 20.19%
Total EMEA 16,271.65 7,872.04 494.97 526 214.67 172 280.31 354 15,241.08 3.25% 6.29%
3
Size of the total commercial real estate market - Developed Markets
Square de Meeus 23 ■ B-1000 Brussels, Belgium ■ T +32 2739 1010 ■ F +32 2739 1020 ■ E [email protected] ■ W www.epra.com
Dec-16 Dec-16 Dec-16 Sep-17 Sep-17 Sep-17 Sep-17 Sep-17 Sep-17 Sep-17 Sep-17 Sep-17
GDP per
CapitaGDP
Commercial
Real Estate
Total Listed
Real Estate
Number of
Companies
REITs Market
Cap
Of which
REITs
Non-REITs
Market Cap
Of which Non-
REITs
Stock Market
Size
Listed
RE/Stock
Market
Listed RE /
Total CRE
($) ($ Bln.) ($ Bln.) ($ Bln.) # ($ Bln.) # ($ Bln.) # ($ Bln.) % %
Canada 42,224.94 1,529.76 729.26 66.69 78 55.18 46 11.51 32 2,261.81 2.95% 9.15%
United States 57,607.61 18,624.45 8,118.30 1,097.08 305 1,062.27 221 34.81 84 28,055.84 3.91% 13.51%
Total North America 20,154.21 8,847.56 1,163.77 383 1,117.45 267 46.32 116 30,317.65 3.84% 13.15%
Dec-16 Dec-16 Dec-16 Sep-17 Sep-17 Sep-17 Sep-17 Sep-17 Sep-17 Sep-17 Sep-17 Sep-17
GDP per
CapitaGDP
Commercial
Real Estate
Total Listed
Real Estate
Number of
Companies
REITs Market
Cap
Of which
REITs
Non-REITs
Market Cap
Of which Non-
REITs
Stock Market
Size
Listed
RE/Stock
Market
Listed RE /
Total CRE
($) ($ Bln.) ($ Bln.) ($ Bln.) # ($ Bln.) # ($ Bln.) # ($ Bln.) % %
Australia 51,737.23 1,261.65 591.53 107.44 79 103.37 54 4.07 25 1,294.96 8.30% 18.16%
Hong Kong 43,561.08 320.91 276.34 293.22 99 28.18 9 265.04 90 4,986.88 5.88% 106.11%
Japan 38,882.64 4,936.54 2,148.25 227.57 155 100.45 61 127.12 94 5,817.56 3.91% 10.59%
New Zealand 38,277.93 181.71 82.43 6.04 9 4.21 6 1.83 3 85.16 7.09% 7.33%
Singapore 52,960.56 296.97 269.75 96.65 66 51.57 35 45.08 31 546.95 17.67% 35.83%
South Korea 27,534.84 1,411.04 623.87 2.02 8 1.52 6 0.50 2 1,506.03 0.13% 0.32%
Total Asia-Pacific 8,408.82 3,992.18 732.94 416 289.31 171 443.63 245 14,237.53 5.15% 18.36%
Total Developed Markets 44,834.69 20,711.78 2,391.69 1,325 1,621.43 610 770.26 715 59,796.26 4.00% 11.55%
Total Global Markets 68,912.30 27,880.37 3,442.94 2,331 1,708.98 810 1,733.96 1,521 76,036.40 4.53% 12.35%
4
Size of the total commercial real estate market - Developed Markets
Square de Meeus 23 ■ B-1000 Brussels, Belgium ■ T +32 2739 1010 ■ F +32 2739 1020 ■ E [email protected] ■ W www.epra.com
Dec-16 Dec-16 Dec-16 Sep-17 Sep-17 Sep-17 Sep-17 Sep-17 Sep-17 Sep-17 Sep-17 Sep-17
GDP per
CapitaGDP
Commercial
Real Estate
Total Listed
Real Estate
Number of
Companies
REITs Market
Cap
Of which
REITs
Non-REITs
Market Cap
Of which Non-
REITs
Stock Market
Size
Listed
RE/Stock
Market
Listed RE /
Total CRE
($) ($ Bln.) ($ Bln.) ($ Bln.) # ($ Bln.) # ($ Bln.) # ($ Bln.) % %
Czech Republic 18,507.73 195.33 77.21 0.00 1 - - 0.00 1 31.09 0.00% 0.00%
Greece 18,049.30 194.64 80.83 3.52 13 2.77 5 0.75 8 45.02 7.82% 4.36%
Hungary 12,652.45 124.38 44.12 0.26 2 - - 0.26 2 29.01 0.88% 0.58%
Poland 12,361.27 469.32 168.96 7.92 49 0.25 3 7.67 46 192.86 4.10% 4.68%
Russian Federation 8,945.64 1,283.16 482.31 6.18 10 - - 6.18 10 586.07 1.05% 1.28%
Total Europe 2,266.83 853.44 17.87 75 3.02 8 14.85 67.00 884.04 2.02% 2.09%
Dec-16 Dec-16 Dec-16 Sep-17 Sep-17 Sep-17 Sep-17 Sep-17 Sep-17 Sep-17 Sep-17 Sep-17
GDP per
CapitaGDP
Commercial
Real Estate
Total Listed
Real Estate
Number of
Companies
REITs Market
Cap
Of which
REITs
Non-REITs
Market Cap
Of which Non-
REITs
Stock Market
Size
Listed
RE/Stock
Market
Listed RE /
Total CRE
($) ($ Bln.) ($ Bln.) ($ Bln.) # ($ Bln.) # ($ Bln.) # ($ Bln.) % %
Egypt 3,684.57 332.35 73.92 4.97 29 - - 4.97 29 44.24 11.24% 6.73%
Qatar 59,513.91 155.79 97.21 12.58 4 - - 12.58 4 122.51 10.27% 12.94%
South Africa 5,302.04 294.90 82.85 31.77 40 29.41 29 2.35 11 470.07 6.76% 38.34%
Turkey 10,817.41 863.39 290.50 7.47 34 7.47 34 - - 215.94 3.46% 2.57%
United Arab Emirates 35,383.92 348.74 206.19 39.62 13 0.91 3 38.71 10 232.47 17.04% 19.21%
Total MEA 1,995.17 750.67 96.40 120 37.79 66 58.62 54 1,085.23 8.88% 12.84%
Total EMEA 4,262.00 1,604.11 114.27 195 40.80 74 73.47 121 1,969.27 5.80% 7.12%
`
5
Size of the total commercial real estate market - Emerging Markets
Square de Meeus 23 ■ B-1000 Brussels, Belgium ■ T +32 2739 1010 ■ F +32 2739 1020 ■ E [email protected] ■ W www.epra.com
Dec-16 Dec-16 Dec-16 Sep-17 Sep-17 Sep-17 Sep-17 Sep-17 Sep-17 Sep-17 Sep-17 Sep-17
GDP per
CapitaGDP
Commercial
Real Estate
Total Listed
Real Estate
Number of
Companies
REITs Market
Cap
Of which
REITs
Non-REITs
Market Cap
Of which Non-
REITs
Stock Market
Size
Listed
RE/Stock
Market
Listed RE /
Total CRE
($) ($ Bln.) ($ Bln.) ($ Bln.) # ($ Bln.) # ($ Bln.) # ($ Bln.) % %
Brazil 8,726.90 1,798.62 610.59 22.64 47 0.58 22 22.06 25 917.77 2.47% 3.71%
Chile 13,576.00 247.03 89.08 48.17 41 - - 48.17 41 271.86 17.72% 54.08%
Colombia 5,792.18 282.36 83.71 - - - - - - 110.01 0.00% 0.00%
Mexico 8,562.16 1,046.93 349.27 16.59 17 13.74 11 2.85 6 399.98 4.15% 4.75%
Peru 6,203.66 195.30 53.51 0.39 6 - - 0.39 6 87.58 0.44% 0.73%
Total Americas 3,570.23 1,186.16 87.79 111 14 33.00 73 78.00 1,787.20 4.91% 7.40%
Dec-16 Dec-16 Dec-16 Sep-17 Sep-17 Sep-17 Sep-17 Sep-17 Sep-17 Sep-17 Sep-17 Sep-17
GDP per
CapitaGDP
Commercial
Real Estate
Total Listed
Real Estate
Number of
Companies
REITs Market
Cap
Of which
REITs
Non-REITs
Market Cap
Of which Non-
REITs
Stock Market
Size
Listed
RE/Stock
Market
Listed RE /
Total CRE
($) ($ Bln.) ($ Bln.) ($ Bln.) # ($ Bln.) # ($ Bln.) # ($ Bln.) % %
China 8,123.26 11,232.11 3,261.23 664.92 238 11.58 7 653.34 231 7,568.91 8.78% 20.39%
India 1,741.65 2,263.79 379.49 18.52 115 - - 18.52 115 2,030.82 0.91% 4.88%
Indonesia 3,604.29 932.45 205.07 23.56 53 1.66 3 21.90 50 477.89 4.93% 11.49%
Malaysia 9,374.10 296.54 96.22 31.85 99 7.03 17 24.83 82 416.95 7.64% 33.11%
Pakistan 1,440.97 278.91 44.38 0.28 4 0.23 1 0.05 3 83.48 0.33% 0.63%
Philippines 2,926.60 304.91 62.39 51.74 45 - - 51.74 45 271.31 19.07% 82.93%
Taiwan 22,497.00 529.58 220.66 14.03 33 1.97 5 12.06 28 1,148.33 1.22% 6.36%
Thailand 5,901.75 407.11 108.88 44.29 113 9.97 60 34.32 53 485.97 9.11% 40.68%
Total Asia-Pacific 16,245.39 4,378.32 849.19 700 32.43 93 816.76 607 12,483.67 6.80% 19.40%
Total Emerging Markets 24,077.62 7,168.60 1,051.26 1,006 87.56 200 963.70 806 16,240.14 6.47% 14.66%
Total Global Markets 68,912.30 27,880.37 3,442.94 2,331 1,708.98 810 1,733.96 1,521 76,036.40 4.53% 12.35%
6
Size of the total commercial real estate market - Emerging Markets
Square de Meeus 23 ■ B-1000 Brussels, Belgium ■ T +32 2739 1010 ■ F +32 2739 1020 ■ E [email protected] ■ W www.epra.com
Dec-16 Dec-16 Dec-16 Sep-17 Sep-17 Sep-17 Sep-17 Sep-17 Sep-17 Sep-17 Sep-17 Sep-17
GDP per
CapitaGDP
Commercial
Real Estate
Total Listed
Real Estate
Number of
Companies
REITs Market
Cap
Of which
REITs
Non-REITs
Market Cap
Of which Non-
REITs
Stock Market
Size
Listed
RE/Stock
Market
Listed RE /
Total CRE
($) ($ Bln.) ($ Bln.) ($ Bln.) # ($ Bln.) # ($ Bln.) # ($ Bln.) % %
Austria 44,232.94 386.59 179.30 12.78 9 - - 12.78 9 146.06 8.75% 7.13%
Belgium 41,247.86 466.56 216.78 16.78 27 14.00 17 2.78 10 482.50 3.48% 7.74%
Bulgaria 7,377.00 52.39 15.29 0.90 40 0.50 32 0.40 8 6.33 14.18% 5.87%
Croatia 12,164.95 50.73 17.80 0.08 2 - - 0.08 2 22.62 0.37% 0.47%
Cyprus 23,351.87 19.81 8.85 0.85 13 0.01 1 0.84 12 2.12 39.91% 9.57%
Czech Republic 18,507.73 195.33 77.21 0.00 1 - - 0.00 1 31.09 0.00% 0.00%
Denmark 53,744.64 306.73 143.06 1.68 10 0.08 1 1.61 9 457.07 0.37% 1.18%
Estonia 17,786.01 23.33 9.25 0.16 3 - - 0.16 3 2.97 5.26% 1.69%
Finland 43,482.41 238.60 111.07 5.44 6 0.06 1 5.38 5 267.41 2.03% 4.90%
France 38,177.86 2,466.47 1,155.93 93.41 60 87.21 33 6.20 27 2,502.53 3.73% 8.08%
Germany 42,176.85 3,479.23 1,601.83 88.91 63 3.47 4 85.43 59 2,352.44 3.78% 5.55%
Greece 18,049.30 194.64 80.83 3.52 13 2.77 5 0.75 8 45.02 7.82% 4.36%
Hungary 12,652.45 124.38 44.12 0.26 2 - - 0.26 2 29.01 0.88% 0.58%
Ireland 64,782.30 304.43 127.96 3.20 3 3.20 3 - - 126.15 2.54% 2.50%
Italy 30,507.18 1,850.74 869.48 3.65 10 3.45 5 0.19 5 705.01 0.52% 0.42%
Latvia 14,062.68 27.69 10.21 0.00 1 - - 0.00 1 1.15 0.20% 0.02%
Lithuania 14,892.54 42.76 16.03 0.05 2 - - 0.05 2 4.50 1.14% 0.32%
Luxembourg 104,094.93 59.98 27.40 - - - - - - 20.82 0.00% 0.00%
Malta 25,329.38 11.00 4.69 0.24 4 - - 0.24 4 5.34 4.48% 5.11%
Netherlands 45,657.57 777.55 360.65 5.79 8 5.55 4 0.24 4 617.73 0.94% 1.61%
Poland 12,361.27 469.32 168.96 7.92 49 0.25 3 7.67 46 192.86 4.10% 4.68%
Portugal 19,820.78 204.65 84.44 0.04 2 - - 0.04 2 76.12 0.05% 0.04%
Romania 9,493.42 187.59 58.88 8.06 6 0.00 1 8.06 5 20.93 38.51% 13.69%
Slovak Republic 16,498.53 89.53 34.77 - - - - - - 7.91 0.00% 0.00%
Slovenia 21,668.09 44.73 18.88 - - - - - - 6.21 0.00% 0.00%
Spain 26,565.15 1,232.60 559.28 27.53 61 23.31 47 4.22 14 815.07 3.38% 4.92%
Sweden 51,124.76 511.00 236.59 53.59 48 - - 53.59 48 836.32 6.41% 22.65%
United Kingdom 40,049.78 2,629.19 1,565.60 100.17 105 73.17 52 27.00 53 3,619.30 2.77% 6.40%
Total European Union 16,447.54 7,805.14 434.99 548 217.04 209 217.94 339 13,402.60 3.25% 5.57%
7
Size of the total commercial real estate market - European Union
Square de Meeus 23 ■ B-1000 Brussels, Belgium ■ T +32 2739 1010 ■ F +32 2739 1020 ■ E [email protected] ■ W www.epra.com

Dec-16 Dec-16 Dec-16 Sep-17 Sep-17 Sep-17 Sep-17 Sep-17 Sep-17 Sep-17 Sep-17 Sep-17
GDP per
CapitaGDP
Commercial
Real Estate
Total Listed
Real Estate
Number of
Companies
REITs Market
Cap
Of which
REITs
Non-REITs
Market Cap
Of which Non-
REITs
Stock Market
Size
Listed
RE/Stock
Market
Listed RE /
Total CRE
($) ($ Bln.) ($ Bln.) ($ Bln.) # ($ Bln.) # ($ Bln.) # ($ Bln.) % %
Austria 44,232.94 386.59 179.30 12.78 9 - - 12.78 9 146.06 8.75% 7.13%
Belgium 41,247.86 466.56 216.78 16.78 27 14.00 17 2.78 10 482.50 3.48% 7.74%
Cyprus 23,351.87 19.81 8.85 0.85 13 0.01 1 0.84 12 2.12 39.91% 9.57%
Estonia 17,786.01 23.33 9.25 0.16 3 - - 0.16 3 2.97 5.26% 1.69%
Finland 43,482.41 238.60 111.07 5.44 6 0.06 1 5.38 5 267.41 2.03% 4.90%
France 38,177.86 2,466.47 1,155.93 93.41 60 87.21 33 6.20 27 2,502.53 3.73% 8.08%
Germany 42,176.85 3,479.23 1,601.83 88.91 63 3.47 4 85.43 59 2,352.44 3.78% 5.55%
Greece 18,049.30 194.64 80.83 3.52 13 2.77 5 0.75 8 45.02 7.82% 4.36%
Ireland 64,782.30 304.43 127.96 3.20 3 3.20 3 - - 126.15 2.54% 2.50%
Italy 30,507.18 1,850.74 869.48 3.65 10 3.45 5 0.19 5 705.01 0.52% 0.42%
Latvia 14,062.68 27.69 10.21 0.00 1 - - 0.00 1 1.15 0.20% 0.02%
Lithuania 14,892.54 42.76 16.03 0.05 2 - - 0.05 2 4.50 1.14% 0.32%
Luxembourg 104,094.93 59.98 27.40 - - - - - - 20.82 0.00% 0.00%
Malta 25,329.38 11.00 4.69 0.24 4 - - 0.24 4 5.34 4.48% 5.11%
Netherlands 45,657.57 777.55 360.65 5.79 8 5.55 4 0.24 4 617.73 0.94% 1.61%
Portugal 19,820.78 204.65 84.44 0.04 2 - - 0.04 2 76.12 0.05% 0.04%
Slovak Republic 16,498.53 89.53 34.77 - - - - - - 7.91 0.00% 0.00%
Slovenia 21,668.09 44.73 18.88 - - - - - - 6.21 0.00% 0.00%
Spain 26,565.15 1,232.60 559.28 27.53 61 23.31 47 4.22 14 815.07 3.38% 4.92%
Total Eurozone 652,384.24 11,920.87 5,477.62 262.33 285 143.05 120 119.28 165 8,187.09 3.20% 4.79%
8
Size of the total commercial real estate market - Eurozone
Square de Meeus 23 ■ B-1000 Brussels, Belgium ■ T +32 2739 1010 ■ F +32 2739 1020 ■ E [email protected] ■ W www.epra.com
Dec-16 Dec-16 Dec-16 Sep-17 Sep-17 Sep-17 Sep-17 Sep-17 Sep-17 Sep-17 Sep-17 Sep-17
GDP per
CapitaGDP
Commercial
Real Estate
Total Listed
Real Estate
Number of
Companies
REITs Market
Cap
Of which
REITs
Non-REITs
Market Cap
Of which Non-
REITs
Stock Market
Size
Listed
RE/Stock
Market
Listed RE /
Total CRE
(€) (€ Bln.) (€ Bln.) (€ Bln.) # (€ Bln.) # (€ Bln.) # (€ Bln.) % %
Austria 37,415.78 327.01 151.66 10.81 9 - - 10.81 9 123.55 8.75% 7.13%
Belgium 34,890.76 394.65 183.37 14.19 27 11.84 17 2.35 10 408.14 3.48% 7.74%
Cyprus 19,752.90 16.76 7.49 0.72 13 0.01 1 0.71 12 1.80 39.91% 9.57%
Estonia 15,044.84 19.74 7.82 0.13 3 - - 0.13 3 2.51 5.26% 1.69%
Finland 36,780.92 201.83 93.95 4.60 6 0.05 1 4.55 5 226.20 2.03% 4.90%
France 32,293.91 2,086.34 977.78 79.01 60 73.77 33 5.24 27 2,116.84 3.73% 8.08%
Germany 35,676.58 2,943.01 1,354.95 75.21 63 2.94 4 72.27 59 1,989.89 3.78% 5.55%
Greece 15,267.55 164.64 68.37 2.98 13 2.34 5 0.63 8 38.08 7.82% 4.36%
Ireland 54,798.09 257.51 108.24 2.71 3 2.71 3 - - 106.71 2.54% 2.50%
Italy 25,805.43 1,565.50 735.48 3.08 10 2.92 5 0.16 5 596.36 0.52% 0.42%
Latvia 11,895.35 23.42 8.63 0.00 1 - - 0.00 1 0.97 0.20% 0.02%
Lithuania 12,597.31 36.17 13.56 0.04 2 - - 0.04 2 3.81 1.14% 0.32%
Luxembourg 88,051.88 50.74 23.17 - - - - - - 17.61 0.00% 0.00%
Malta 21,425.63 9.31 3.96 0.20 4 - - 0.20 4 4.52 4.48% 5.11%
Netherlands 38,620.85 657.71 305.06 4.90 8 4.70 4 0.20 4 522.53 0.94% 1.61%
Portugal 16,766.02 173.11 71.42 0.03 2 - - 0.03 2 64.39 0.05% 0.04%
Slovak Republic 13,955.79 75.73 29.41 - - - - - - 6.69 0.00% 0.00%
Slovenia 18,328.61 37.83 15.97 - - - - - - 5.26 0.00% 0.00%
Spain 22,470.94 1,042.63 473.08 23.29 61 19.72 47 3.57 14 689.45 3.38% 4.92%
Total Eurozone 10,083.63 4,633.41 221.90 285 121.00 120 100.90 165 6,925.30 3.20% 4.79%
9
Size of the total commercial real estate market - Eurozone
Square de Meeus 23 ■ B-1000 Brussels, Belgium ■ T +32 2739 1010 ■ F +32 2739 1020 ■ E [email protected] ■ W www.epra.com
Dec-16 Dec-16 Dec-16 Sep-17 Sep-17 Sep-17 Sep-17 Sep-17 Sep-17 Sep-17 Sep-17 Sep-17
GDP per
CapitaGDP
Commercial
Real Estate
Total Listed
Real Estate
Number of
Companies
REITs Market
Cap
Of which
REITs
Non-REITs
Market Cap
Of which Non-
REITs
Stock Market
Size
Listed
RE/Stock
Market
Listed RE /
Total CRE
($) ($ Bln.) ($ Bln.) ($ Bln.) # ($ Bln.) # ($ Bln.) # ($ Bln.) % %
Australia 51,737.23 1,261.65 591.53 107.44 79 103.37 54 4.07 25 1,294.96 8.30% 18.16%
Austria 44,232.94 386.59 179.30 12.78 9 - - 12.78 9 146.06 8.75% 7.13%
Belgium 41,247.86 466.56 216.78 16.78 27 14.00 17 2.78 10 482.50 3.48% 7.74%
Canada 42,224.94 1,529.76 729.26 66.69 78 55.18 46 11.51 32 2,261.81 2.95% 9.15%
Chile 13,576.00 247.03 89.08 48.17 41 - - 48.17 41 271.86 17.72% 54.08%
Czech Republic 18,507.73 195.33 77.21 0.00 1 - - 0.00 1 31.09 0.00% 0.00%
Denmark 53,744.64 306.73 143.06 1.68 10 0.08 1 1.61 9 457.07 0.37% 1.18%
Estonia 17,786.01 23.33 9.25 0.16 3 - - 0.16 3 2.97 5.26% 1.69%
Finland 43,482.41 238.60 111.07 5.44 6 0.06 1 5.38 5 267.41 2.03% 4.90%
France 38,177.86 2,466.47 1,155.93 93.41 60 87.21 33 6.20 27 2,502.53 3.73% 8.08%
Germany 42,176.85 3,479.23 1,601.83 88.91 63 3.47 4 85.43 59 2,352.44 3.78% 5.55%
Greece 18,049.30 194.64 80.83 3.52 13 2.77 5 0.75 8 45.02 7.82% 4.36%
Hungary 12,652.45 124.38 44.12 0.26 2 - - 0.26 2 29.01 0.88% 0.58%
Iceland 59,629.05 20.05 8.12 1.24 3 - - 1.24 3 9.49 13.11% 15.32%
Ireland 64,782.30 304.43 127.96 3.20 3 3.20 3 - - 126.15 2.54% 2.50%
Israel 37,192.14 317.75 138.49 27.96 67 1.15 5 26.81 62 164.00 17.05% 20.19%
Italy 30,507.18 1,850.74 869.48 3.65 10 3.45 5 0.19 5 705.01 0.52% 0.42%
Japan 38,882.64 4,936.54 2,148.25 227.57 155 100.45 61 127.12 94 5,817.56 3.91% 10.59%
South Korea 27,534.84 1,411.04 623.87 2.02 8 1.52 6 0.50 2 1,506.03 0.13% 0.32%
Latvia 14,062.68 27.69 10.21 0.00 1 - - 0.00 1 1.15 0.20% 0.02%
Luxembourg 104,094.93 59.98 27.40 - - - - - - 20.82 0.00% 0.00%
Mexico 8,562.16 1,046.93 349.27 16.59 17 13.74 11 2.85 6 399.98 4.15% 4.75%
Netherlands 45,657.57 777.55 360.65 5.79 8 5.55 4 0.24 4 617.73 0.94% 1.61%
New Zealand 38,277.93 181.71 82.43 6.04 9 4.21 6 1.83 3 85.16 7.09% 7.33%
Norway 70,553.11 370.56 187.26 5.88 6 - - 5.88 6 299.11 1.97% 3.14%
Poland 12,361.27 469.32 168.96 7.92 49 0.25 3 7.67 46 192.86 4.10% 4.68%
Portugal 19,820.78 204.65 84.44 0.04 2 - - 0.04 2 76.12 0.05% 0.04%
Slovak Republic 16,498.53 89.53 34.77 - - - - - - 7.91 0.00% 0.00%
Slovenia 21,668.09 44.73 18.88 - - - - - - 6.21 0.00% 0.00%
Spain 26,565.15 1,232.60 559.28 27.53 61 23.31 47 4.22 14 815.07 3.38% 4.92%
1,074,246.57 24,266.07 10,828.97 780.66 791.00 423.00 312.00 357.67 479.00 20,995.09
Continued >>
10
Size of the total commercial real estate market - OECD
Square de Meeus 23 ■ B-1000 Brussels, Belgium ■ T +32 2739 1010 ■ F +32 2739 1020 ■ E [email protected] ■ W www.epra.com
Dec-16 Dec-16 Dec-16 Sep-17 Sep-17 Sep-17 Sep-17 Sep-17 Sep-17 Sep-17 Sep-17 Sep-17
GDP per
CapitaGDP
Commercial
Real Estate
Total Listed
Real Estate
Number of
Companies
REITs Market
Cap
Of which
REITs
Non-REITs
Market Cap
Of which Non-
REITs
Stock Market
Size
Listed
RE/Stock
Market
Listed RE /
Total CRE
($) ($ Bln.) ($ Bln.) ($ Bln.) # ($ Bln.) # ($ Bln.) # ($ Bln.) % %
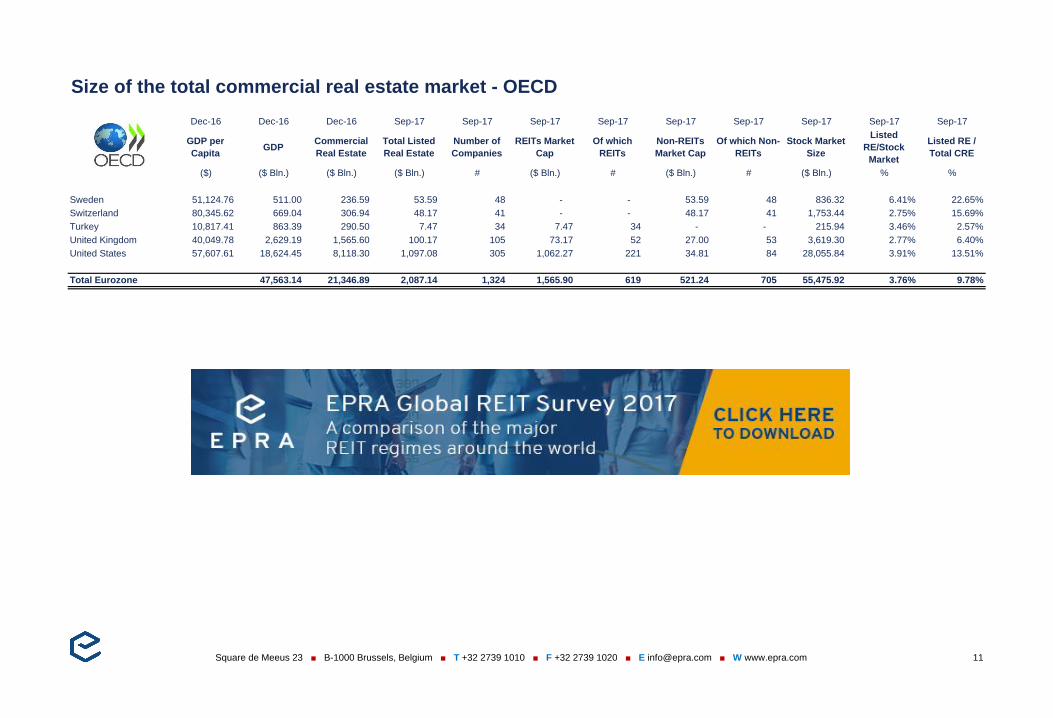
Sweden 51,124.76 511.00 236.59 53.59 48 - - 53.59 48 836.32 6.41% 22.65%
Switzerland 80,345.62 669.04 306.94 48.17 41 - - 48.17 41 1,753.44 2.75% 15.69%
Turkey 10,817.41 863.39 290.50 7.47 34 7.47 34 - - 215.94 3.46% 2.57%
United Kingdom 40,049.78 2,629.19 1,565.60 100.17 105 73.17 52 27.00 53 3,619.30 2.77% 6.40%
United States 57,607.61 18,624.45 8,118.30 1,097.08 305 1,062.27 221 34.81 84 28,055.84 3.91% 13.51%
239,945.18 23,297.07 10,517.92 1,306.48 533.00 1,142.90 307.00 163.58 226.00 34,480.84
Total Eurozone 47,563.14 21,346.89 2,087.14 1,324 1,565.90 619 521.24 705 55,475.92 3.76% 9.78%
11
Size of the total commercial real estate market - OECD
Square de Meeus 23 ■ B-1000 Brussels, Belgium ■ T +32 2739 1010 ■ F +32 2739 1020 ■ E [email protected] ■ W www.epra.com

Dec-16 Dec-16 Dec-16 Sep-17 Sep-17 Sep-17 Sep-17 Sep-17 Sep-17 Sep-17 Sep-17 Sep-17
GDP per
CapitaGDP
Commercial
Real Estate
Total Listed
Real Estate
Number of
Companies
REITs Market
Cap
Of which
REITs
Non-REITs
Market Cap
Of which Non-
REITs
Stock Market
Size
Listed
RE/Stock
Market
Listed RE /
Total CRE
($) ($ Bln.) ($ Bln.) ($ Bln.) # ($ Bln.) # ($ Bln.) # ($ Bln.) % %
Argentina 12,493.91 544.74 200.17 4.32 7 - - 4.32 7 96.64 4.47% 2.16%
Australia 51,737.23 1,261.65 591.53 107.44 79 103.37 54 4.07 25 1,294.96 8.30% 18.16%
Austria 44,232.94 386.59 179.30 12.78 9 - - 12.78 9 146.06 8.75% 7.13%
Bahrain 24,146.16 31.86 17.17 0.46 3 0.05 1 0.41 2 19.27 2.39% 2.69%
Belgium 41,247.86 466.56 216.78 16.78 27 14.00 17 2.78 10 482.50 3.48% 7.74%
Brazil 8,726.90 1,798.62 610.59 22.64 47 0.58 22 22.06 25 917.77 2.47% 3.71%
Bulgaria 7,377.00 52.39 15.29 0.90 40 0.50 32 0.40 8 6.33 14.18% 5.87%
Canada 42,224.94 1,529.76 729.26 66.69 78 55.18 46 11.51 32 2,261.81 2.95% 9.15%
Chile 13,576.00 247.03 89.08 48.17 41 - - 48.17 41 271.86 17.72% 54.08%
China 8,123.26 11,232.11 3,261.23 664.92 238 11.58 7 653.34 231 7,568.91 8.78% 20.39%
Colombia 5,792.18 282.36 83.71 - - - - - - 110.01 0.00% 0.00%
Croatia 12,164.95 50.73 17.80 0.08 2 - - 0.08 2 22.62 0.37% 0.47%
Cyprus 23,351.87 19.81 8.85 0.85 13 0.01 1 0.84 12 2.12 39.91% 9.57%
Czech Republic 18,507.73 195.33 77.21 0.00 1 - - 0.00 1 31.09 0.00% 0.00%
Denmark 53,744.64 306.73 143.06 1.68 10 0.08 1 1.61 9 457.07 0.37% 1.18%
Egypt, Arab Rep. 3,684.57 332.35 73.92 4.97 29 - - 4.97 29 44.24 11.24% 6.73%
Estonia 17,786.01 23.33 9.25 0.16 3 - - 0.16 3 2.97 5.26% 1.69%
Finland 43,482.41 238.60 111.07 5.44 6 0.06 1 5.38 5 267.41 2.03% 4.90%
France 38,177.86 2,466.47 1,155.93 93.41 60 87.21 33 6.20 27 2,502.53 3.73% 8.08%
Germany 42,176.85 3,479.23 1,601.83 88.91 63 3.47 4 85.43 59 2,352.44 3.78% 5.55%
Greece 18,049.30 194.64 80.83 3.52 13 2.77 5 0.75 8 45.02 7.82% 4.36%
Hong Kong SAR, China 43,561.08 320.91 276.34 293.22 99 28.18 9 265.04 90 4,986.88 5.88% 106.11%
Hungary 12,652.45 124.38 44.12 0.26 2 - - 0.26 2 29.01 0.88% 0.58%
Iceland 59,629.05 20.05 8.12 1.24 3 - - 1.24 3 9.49 13.11% 15.32%
India 1,741.65 2,263.79 379.49 18.52 115 - - 18.52 115 2,030.82 0.91% 4.88%
Indonesia 3,604.29 932.45 205.07 23.56 53 1.66 3 21.90 50 477.89 4.93% 11.49%
651,993.09 28,802.45 10,187.02 1,480.92 1,041.00 308.72 236.00 1,172.20 805.00 26,437.72 1.74 3.12
Continued >>
12
Size of the total commercial real estate market - Around the Globe
Square de Meeus 23 ■ B-1000 Brussels, Belgium ■ T +32 2739 1010 ■ F +32 2739 1020 ■ E [email protected] ■ W www.epra.com
Dec-16 Dec-16 Dec-16 Sep-17 Sep-17 Sep-17 Sep-17 Sep-17 Sep-17 Sep-17 Sep-17 Sep-17
GDP per
CapitaGDP
Commercial
Real Estate
Total Listed
Real Estate
Number of
Companies
REITs Market
Cap
Of which
REITs
Non-REITs
Market Cap
Of which Non-
REITs
Stock Market
Size
Listed
RE/Stock
Market
Listed RE /
Total CRE
($) ($ Bln.) ($ Bln.) ($ Bln.) # ($ Bln.) # ($ Bln.) # ($ Bln.) % %
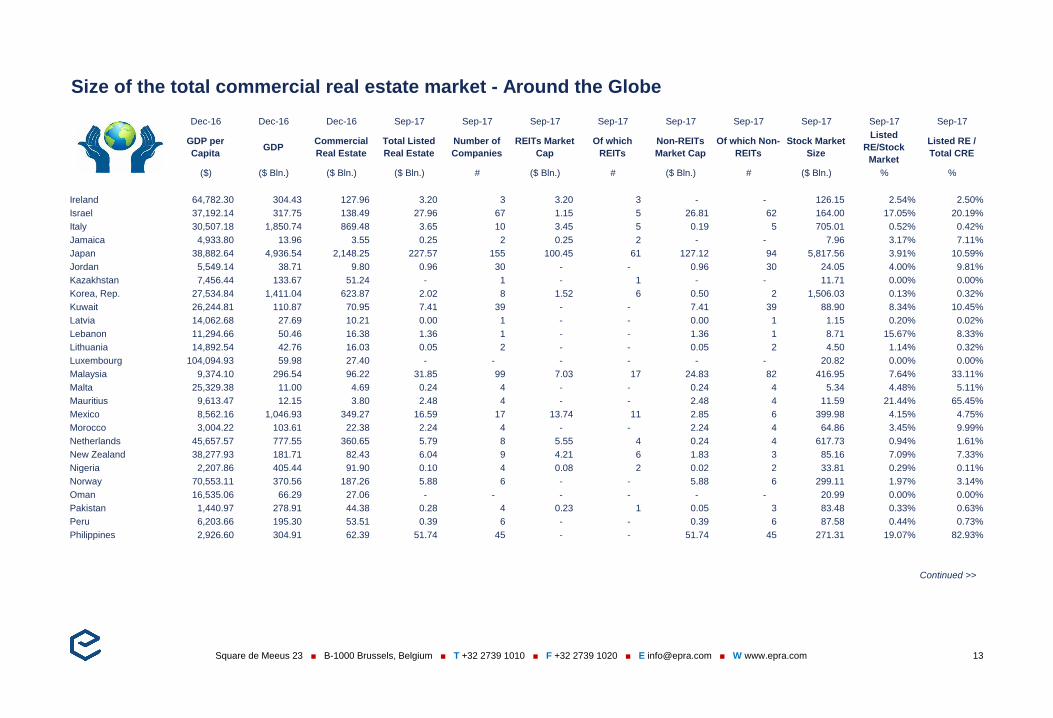
Ireland 64,782.30 304.43 127.96 3.20 3 3.20 3 - - 126.15 2.54% 2.50%
Israel 37,192.14 317.75 138.49 27.96 67 1.15 5 26.81 62 164.00 17.05% 20.19%
Italy 30,507.18 1,850.74 869.48 3.65 10 3.45 5 0.19 5 705.01 0.52% 0.42%
Jamaica 4,933.80 13.96 3.55 0.25 2 0.25 2 - - 7.96 3.17% 7.11%
Japan 38,882.64 4,936.54 2,148.25 227.57 155 100.45 61 127.12 94 5,817.56 3.91% 10.59%
Jordan 5,549.14 38.71 9.80 0.96 30 - - 0.96 30 24.05 4.00% 9.81%
Kazakhstan 7,456.44 133.67 51.24 - 1 - 1 - - 11.71 0.00% 0.00%
Korea, Rep. 27,534.84 1,411.04 623.87 2.02 8 1.52 6 0.50 2 1,506.03 0.13% 0.32%
Kuwait 26,244.81 110.87 70.95 7.41 39 - - 7.41 39 88.90 8.34% 10.45%
Latvia 14,062.68 27.69 10.21 0.00 1 - - 0.00 1 1.15 0.20% 0.02%
Lebanon 11,294.66 50.46 16.38 1.36 1 - - 1.36 1 8.71 15.67% 8.33%
Lithuania 14,892.54 42.76 16.03 0.05 2 - - 0.05 2 4.50 1.14% 0.32%
Luxembourg 104,094.93 59.98 27.40 - - - - - - 20.82 0.00% 0.00%
Malaysia 9,374.10 296.54 96.22 31.85 99 7.03 17 24.83 82 416.95 7.64% 33.11%
Malta 25,329.38 11.00 4.69 0.24 4 - - 0.24 4 5.34 4.48% 5.11%
Mauritius 9,613.47 12.15 3.80 2.48 4 - - 2.48 4 11.59 21.44% 65.45%
Mexico 8,562.16 1,046.93 349.27 16.59 17 13.74 11 2.85 6 399.98 4.15% 4.75%
Morocco 3,004.22 103.61 22.38 2.24 4 - - 2.24 4 64.86 3.45% 9.99%
Netherlands 45,657.57 777.55 360.65 5.79 8 5.55 4 0.24 4 617.73 0.94% 1.61%
New Zealand 38,277.93 181.71 82.43 6.04 9 4.21 6 1.83 3 85.16 7.09% 7.33%
Nigeria 2,207.86 405.44 91.90 0.10 4 0.08 2 0.02 2 33.81 0.29% 0.11%
Norway 70,553.11 370.56 187.26 5.88 6 - - 5.88 6 299.11 1.97% 3.14%
Oman 16,535.06 66.29 27.06 - - - - - - 20.99 0.00% 0.00%
Pakistan 1,440.97 278.91 44.38 0.28 4 0.23 1 0.05 3 83.48 0.33% 0.63%
Peru 6,203.66 195.30 53.51 0.39 6 - - 0.39 6 87.58 0.44% 0.73%
Philippines 2,926.60 304.91 62.39 51.74 45 - - 51.74 45 271.31 19.07% 82.93%
627,114.19 13,349.48 5,499.54 398.07 529.00 140.88 124.00 257.19 405.00 10,884.44
Continued >>
13
Size of the total commercial real estate market - Around the Globe
Square de Meeus 23 ■ B-1000 Brussels, Belgium ■ T +32 2739 1010 ■ F +32 2739 1020 ■ E [email protected] ■ W www.epra.com
Dec-16 Dec-16 Dec-16 Sep-17 Sep-17 Sep-17 Sep-17 Sep-17 Sep-17 Sep-17 Sep-17 Sep-17
GDP per
CapitaGDP
Commercial
Real Estate
Total Listed
Real Estate
Number of
Companies
REITs Market
Cap
Of which
REITs
Non-REITs
Market Cap
Of which Non-
REITs
Stock Market
Size
Listed
RE/Stock
Market
Listed RE /
Total CRE
($) ($ Bln.) ($ Bln.) ($ Bln.) # ($ Bln.) # ($ Bln.) # ($ Bln.) % %
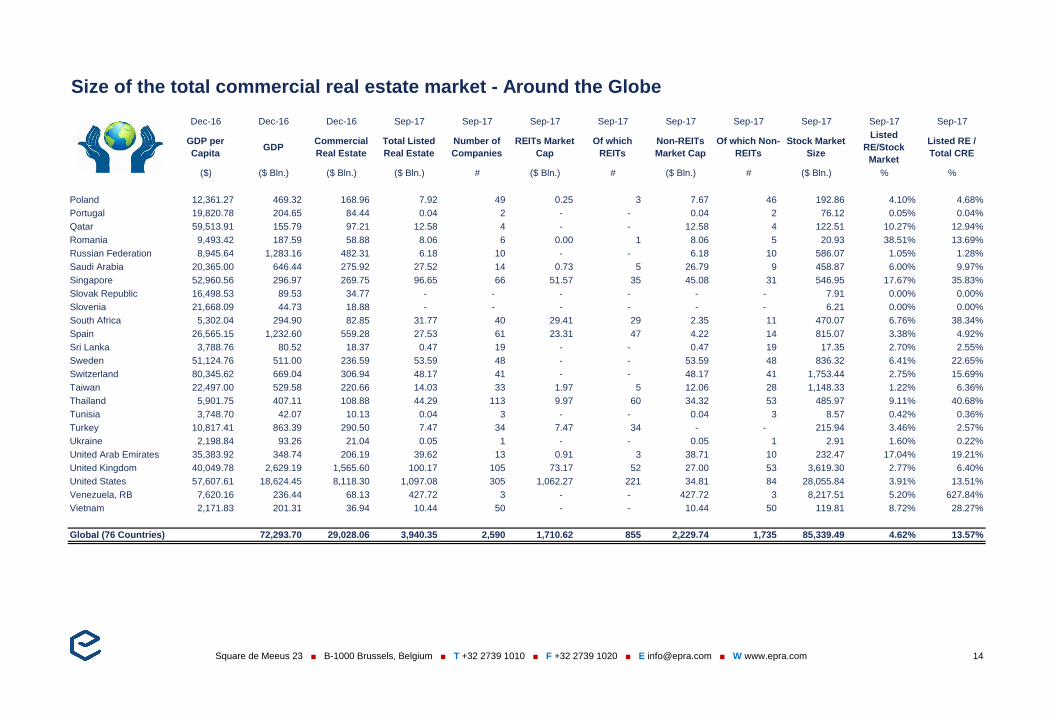
Poland 12,361.27 469.32 168.96 7.92 49 0.25 3 7.67 46 192.86 4.10% 4.68%
Portugal 19,820.78 204.65 84.44 0.04 2 - - 0.04 2 76.12 0.05% 0.04%
Qatar 59,513.91 155.79 97.21 12.58 4 - - 12.58 4 122.51 10.27% 12.94%
Romania 9,493.42 187.59 58.88 8.06 6 0.00 1 8.06 5 20.93 38.51% 13.69%
Russian Federation 8,945.64 1,283.16 482.31 6.18 10 - - 6.18 10 586.07 1.05% 1.28%
Saudi Arabia 20,365.00 646.44 275.92 27.52 14 0.73 5 26.79 9 458.87 6.00% 9.97%
Singapore 52,960.56 296.97 269.75 96.65 66 51.57 35 45.08 31 546.95 17.67% 35.83%
Slovak Republic 16,498.53 89.53 34.77 - - - - - - 7.91 0.00% 0.00%
Slovenia 21,668.09 44.73 18.88 - - - - - - 6.21 0.00% 0.00%
South Africa 5,302.04 294.90 82.85 31.77 40 29.41 29 2.35 11 470.07 6.76% 38.34%
Spain 26,565.15 1,232.60 559.28 27.53 61 23.31 47 4.22 14 815.07 3.38% 4.92%
Sri Lanka 3,788.76 80.52 18.37 0.47 19 - - 0.47 19 17.35 2.70% 2.55%
Sweden 51,124.76 511.00 236.59 53.59 48 - - 53.59 48 836.32 6.41% 22.65%
Switzerland 80,345.62 669.04 306.94 48.17 41 - - 48.17 41 1,753.44 2.75% 15.69%
Taiwan 22,497.00 529.58 220.66 14.03 33 1.97 5 12.06 28 1,148.33 1.22% 6.36%
Thailand 5,901.75 407.11 108.88 44.29 113 9.97 60 34.32 53 485.97 9.11% 40.68%
Tunisia 3,748.70 42.07 10.13 0.04 3 - - 0.04 3 8.57 0.42% 0.36%
Turkey 10,817.41 863.39 290.50 7.47 34 7.47 34 - - 215.94 3.46% 2.57%
Ukraine 2,198.84 93.26 21.04 0.05 1 - - 0.05 1 2.91 1.60% 0.22%
United Arab Emirates 35,383.92 348.74 206.19 39.62 13 0.91 3 38.71 10 232.47 17.04% 19.21%
United Kingdom 40,049.78 2,629.19 1,565.60 100.17 105 73.17 52 27.00 53 3,619.30 2.77% 6.40%
United States 57,607.61 18,624.45 8,118.30 1,097.08 305 1,062.27 221 34.81 84 28,055.84 3.91% 13.51%
Venezuela, RB 7,620.16 236.44 68.13 427.72 3 - - 427.72 3 8,217.51 5.20% 627.84%
Vietnam 2,171.83 201.31 36.94 10.44 50 - - 10.44 50 119.81 8.72% 28.27%
576,750.52 30,141.77 13,341.50 2,061.36 1,020.00 1,261.02 495.00 800.34 525.00 48,017.34
Global (76 Countries) 72,293.70 29,028.06 3,940.35 2,590 1,710.62 855 2,229.74 1,735 85,339.49 4.62% 13.57%
1,153,501.05 132,577.23 55,711.05 8,063.07 4,630.00 4,232.66 1,845.00 3,830.41 2,785.00 181,374.17
14
Size of the total commercial real estate market - Around the Globe
Square de Meeus 23 ■ B-1000 Brussels, Belgium ■ T +32 2739 1010 ■ F +32 2739 1020 ■ E [email protected] ■ W www.epra.com
Dec-16 Dec-16 Sep-17 Sep-17 Sep-17 Sep-17 Sep-17 Sep-17 Sep-17 Sep-17 Sep-17 Sep-17
GDPCommercial
Real Estate
Total Listed
Real Estate
Index Full
Market Cap
No. of Index
Cons.
Index REITs
Market CapIndex REITs
Index Non-
REITs Market
Cap
Index Non-
REITs
Stock Market
Size
Index/Stock
Market
Index/Total
CRE
($ Bln.) ($ Bln.) ($ Bln.) ($ Bln.) # ($ Bln.) # ($ Bln.) # ($ Bln.) % %
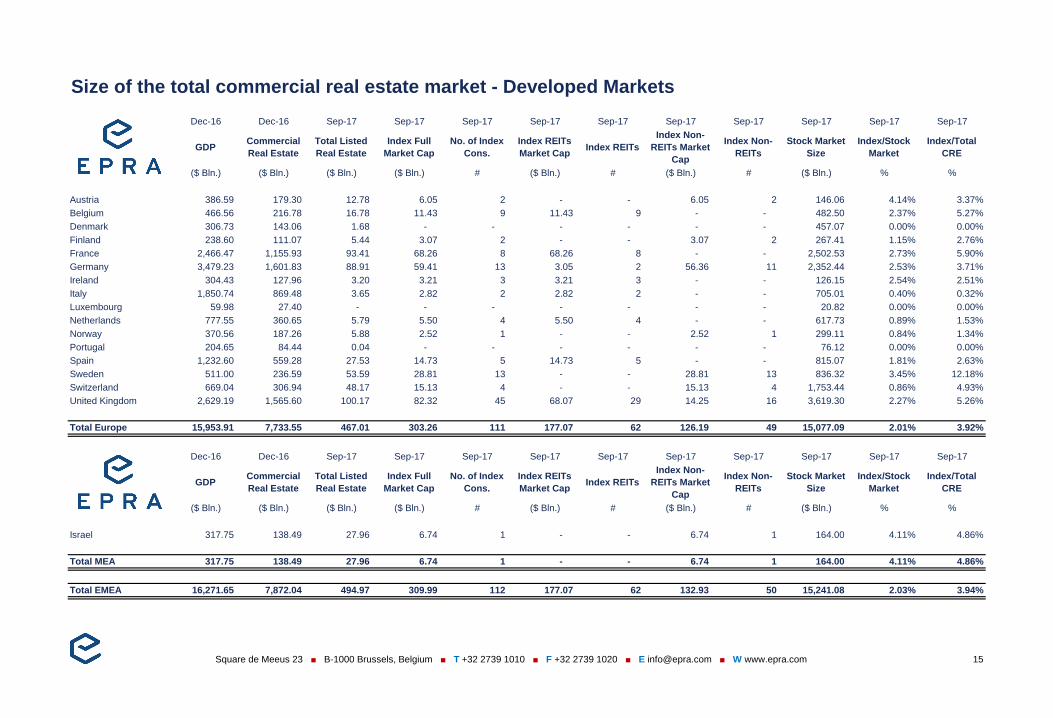
Austria 386.59 179.30 12.78 6.05 2 - - 6.05 2 146.06 4.14% 3.37%
Belgium 466.56 216.78 16.78 11.43 9 11.43 9 - - 482.50 2.37% 5.27%
Denmark 306.73 143.06 1.68 - - - - - - 457.07 0.00% 0.00%
Finland 238.60 111.07 5.44 3.07 2 - - 3.07 2 267.41 1.15% 2.76%
France 2,466.47 1,155.93 93.41 68.26 8 68.26 8 - - 2,502.53 2.73% 5.90%
Germany 3,479.23 1,601.83 88.91 59.41 13 3.05 2 56.36 11 2,352.44 2.53% 3.71%
Ireland 304.43 127.96 3.20 3.21 3 3.21 3 - - 126.15 2.54% 2.51%
Italy 1,850.74 869.48 3.65 2.82 2 2.82 2 - - 705.01 0.40% 0.32%
Luxembourg 59.98 27.40 - - - - - - - 20.82 0.00% 0.00%
Netherlands 777.55 360.65 5.79 5.50 4 5.50 4 - - 617.73 0.89% 1.53%
Norway 370.56 187.26 5.88 2.52 1 - - 2.52 1 299.11 0.84% 1.34%
Portugal 204.65 84.44 0.04 - - - - - - 76.12 0.00% 0.00%
Spain 1,232.60 559.28 27.53 14.73 5 14.73 5 - - 815.07 1.81% 2.63%
Sweden 511.00 236.59 53.59 28.81 13 - - 28.81 13 836.32 3.45% 12.18%
Switzerland 669.04 306.94 48.17 15.13 4 - - 15.13 4 1,753.44 0.86% 4.93%
United Kingdom 2,629.19 1,565.60 100.17 82.32 45 68.07 29 14.25 16 3,619.30 2.27% 5.26%
Total Europe 15,953.91 7,733.55 467.01 303.26 111 177.07 62 126.19 49 15,077.09 2.01% 3.92%
Dec-16 Dec-16 Sep-17 Sep-17 Sep-17 Sep-17 Sep-17 Sep-17 Sep-17 Sep-17 Sep-17 Sep-17
GDPCommercial
Real Estate
Total Listed
Real Estate
Index Full
Market Cap
No. of Index
Cons.
Index REITs
Market CapIndex REITs
Index Non-
REITs Market
Cap
Index Non-
REITs
Stock Market
Size
Index/Stock
Market
Index/Total
CRE
($ Bln.) ($ Bln.) ($ Bln.) ($ Bln.) # ($ Bln.) # ($ Bln.) # ($ Bln.) % %
Israel 317.75 138.49 27.96 6.74 1 - - 6.74 1 164.00 4.11% 4.86%
Total MEA 317.75 138.49 27.96 6.74 1 - - 6.74 1 164.00 4.11% 4.86%
Total EMEA 16,271.65 7,872.04 494.97 309.99 112 177.07 62 132.93 50 15,241.08 2.03% 3.94%
15
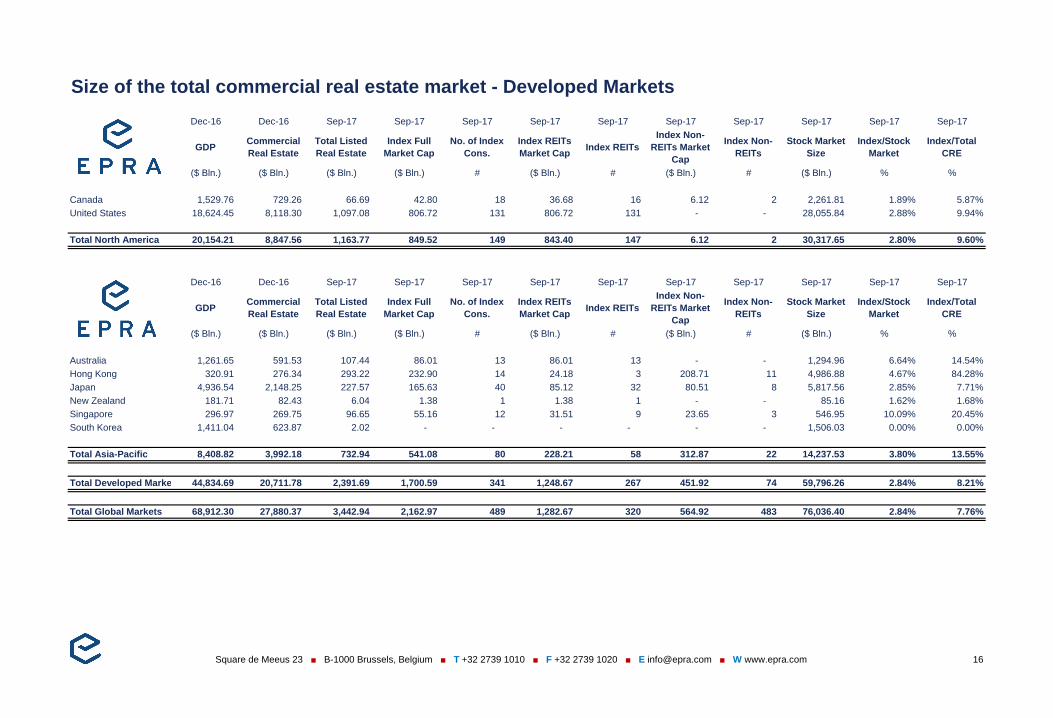
Size of the total commercial real estate market - Developed Markets
Square de Meeus 23 ■ B-1000 Brussels, Belgium ■ T +32 2739 1010 ■ F +32 2739 1020 ■ E [email protected] ■ W www.epra.com
Dec-16 Dec-16 Sep-17 Sep-17 Sep-17 Sep-17 Sep-17 Sep-17 Sep-17 Sep-17 Sep-17 Sep-17
GDPCommercial
Real Estate
Total Listed
Real Estate
Index Full
Market Cap
No. of Index
Cons.
Index REITs
Market CapIndex REITs
Index Non-
REITs Market
Cap
Index Non-
REITs
Stock Market
Size
Index/Stock
Market
Index/Total
CRE
($ Bln.) ($ Bln.) ($ Bln.) ($ Bln.) # ($ Bln.) # ($ Bln.) # ($ Bln.) % %
Canada 1,529.76 729.26 66.69 42.80 18 36.68 16 6.12 2 2,261.81 1.89% 5.87%
United States 18,624.45 8,118.30 1,097.08 806.72 131 806.72 131 - - 28,055.84 2.88% 9.94%
Total North America 20,154.21 8,847.56 1,163.77 849.52 149 843.40 147 6.12 2 30,317.65 2.80% 9.60%
Dec-16 Dec-16 Sep-17 Sep-17 Sep-17 Sep-17 Sep-17 Sep-17 Sep-17 Sep-17 Sep-17 Sep-17
GDPCommercial
Real Estate
Total Listed
Real Estate
Index Full
Market Cap
No. of Index
Cons.
Index REITs
Market CapIndex REITs
Index Non-
REITs Market
Cap
Index Non-
REITs
Stock Market
Size
Index/Stock
Market
Index/Total
CRE
($ Bln.) ($ Bln.) ($ Bln.) ($ Bln.) # ($ Bln.) # ($ Bln.) # ($ Bln.) % %
Australia 1,261.65 591.53 107.44 86.01 13 86.01 13 - - 1,294.96 6.64% 14.54%
Hong Kong 320.91 276.34 293.22 232.90 14 24.18 3 208.71 11 4,986.88 4.67% 84.28%
Japan 4,936.54 2,148.25 227.57 165.63 40 85.12 32 80.51 8 5,817.56 2.85% 7.71%
New Zealand 181.71 82.43 6.04 1.38 1 1.38 1 - - 85.16 1.62% 1.68%
Singapore 296.97 269.75 96.65 55.16 12 31.51 9 23.65 3 546.95 10.09% 20.45%
South Korea 1,411.04 623.87 2.02 - - - - - - 1,506.03 0.00% 0.00%
Total Asia-Pacific 8,408.82 3,992.18 732.94 541.08 80 228.21 58 312.87 22 14,237.53 3.80% 13.55%
Total Developed Markets 44,834.69 20,711.78 2,391.69 1,700.59 341 1,248.67 267 451.92 74 59,796.26 2.84% 8.21%
Total Global Markets 68,912.30 27,880.37 3,442.94 2,162.97 489 1,282.67 320 564.92 483 76,036.40 2.84% 7.76%
16
Size of the total commercial real estate market - Developed Markets
Square de Meeus 23 ■ B-1000 Brussels, Belgium ■ T +32 2739 1010 ■ F +32 2739 1020 ■ E [email protected] ■ W www.epra.com
Dec-16 Dec-16 Sep-17 Sep-17 Sep-17 Sep-17 Sep-17 Sep-17 Sep-17 Sep-17 Sep-17 Sep-17
GDPCommercial
Real Estate
Total Listed
Real Estate
Index Full
Market Cap
No. of Index
Cons.
Index REITs
Market CapIndex REITs
Index Non-
REITs Market
Cap
Index Non-
REITs
Stock Market
Size
Index/Stock
Market
Index/Total
CRE
($ Bln.) ($ Bln.) ($ Bln.) ($ Bln.) # ($ Bln.) # ($ Bln.) # ($ Bln.) % %
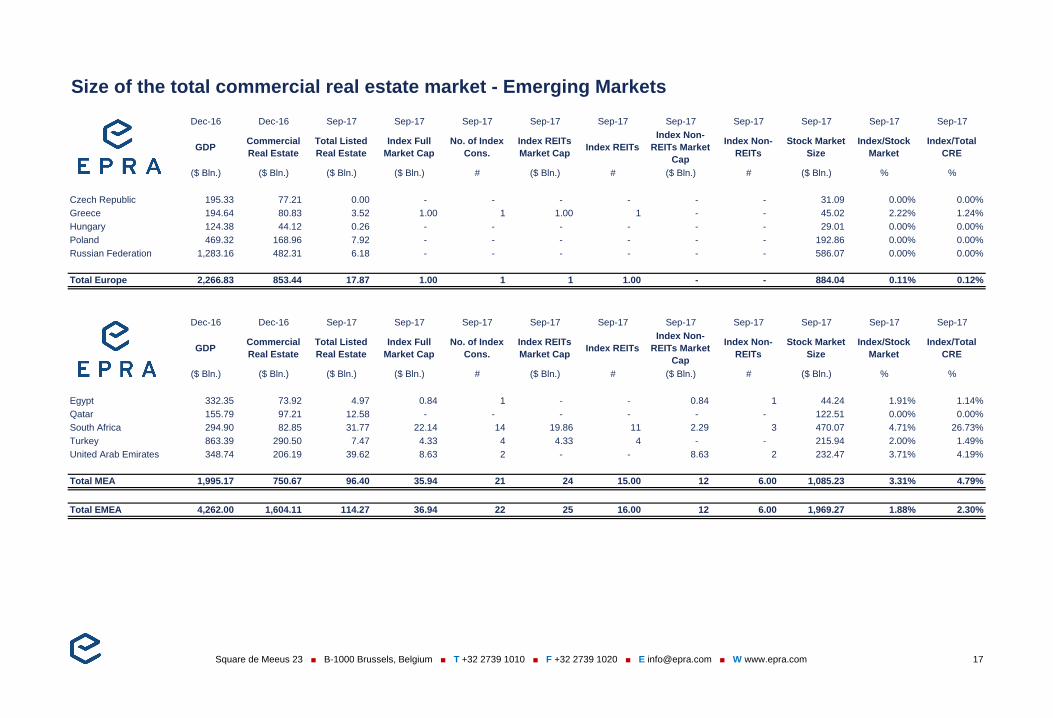
Czech Republic 195.33 77.21 0.00 - - - - - - 31.09 0.00% 0.00%
Greece 194.64 80.83 3.52 1.00 1 1.00 1 - - 45.02 2.22% 1.24%
Hungary 124.38 44.12 0.26 - - - - - - 29.01 0.00% 0.00%
Poland 469.32 168.96 7.92 - - - - - - 192.86 0.00% 0.00%
Russian Federation 1,283.16 482.31 6.18 - - - - - - 586.07 0.00% 0.00%
Total Europe 2,266.83 853.44 17.87 1.00 1 1 1.00 - - 884.04 0.11% 0.12%
Dec-16 Dec-16 Sep-17 Sep-17 Sep-17 Sep-17 Sep-17 Sep-17 Sep-17 Sep-17 Sep-17 Sep-17
GDPCommercial
Real Estate
Total Listed
Real Estate
Index Full
Market Cap
No. of Index
Cons.
Index REITs
Market CapIndex REITs
Index Non-
REITs Market
Cap
Index Non-
REITs
Stock Market
Size
Index/Stock
Market
Index/Total
CRE
($ Bln.) ($ Bln.) ($ Bln.) ($ Bln.) # ($ Bln.) # ($ Bln.) # ($ Bln.) % %
Egypt 332.35 73.92 4.97 0.84 1 - - 0.84 1 44.24 1.91% 1.14%
Qatar 155.79 97.21 12.58 - - - - - - 122.51 0.00% 0.00%
South Africa 294.90 82.85 31.77 22.14 14 19.86 11 2.29 3 470.07 4.71% 26.73%
Turkey 863.39 290.50 7.47 4.33 4 4.33 4 - - 215.94 2.00% 1.49%
United Arab Emirates 348.74 206.19 39.62 8.63 2 - - 8.63 2 232.47 3.71% 4.19%
Total MEA 1,995.17 750.67 96.40 35.94 21 24 15.00 12 6.00 1,085.23 3.31% 4.79%
Total EMEA 4,262.00 1,604.11 114.27 36.94 22 25 16.00 12 6.00 1,969.27 1.88% 2.30%
17
Size of the total commercial real estate market - Emerging Markets
Square de Meeus 23 ■ B-1000 Brussels, Belgium ■ T +32 2739 1010 ■ F +32 2739 1020 ■ E [email protected] ■ W www.epra.com
Dec-16 Dec-16 Sep-17 Sep-17 Sep-17 Sep-17 Sep-17 Sep-17 Sep-17 Sep-17 Sep-17 Sep-17
GDPCommercial
Real Estate
Total Listed
Real Estate
Index Full
Market Cap
No. of Index
Cons.
Index REITs
Market CapIndex REITs
Index Non-
REITs Market
Cap
Index Non-
REITs
Stock Market
Size
Index/Stock
Market
Index/Total
CRE
($ Bln.) ($ Bln.) ($ Bln.) ($ Bln.) # ($ Bln.) # ($ Bln.) # ($ Bln.) % %
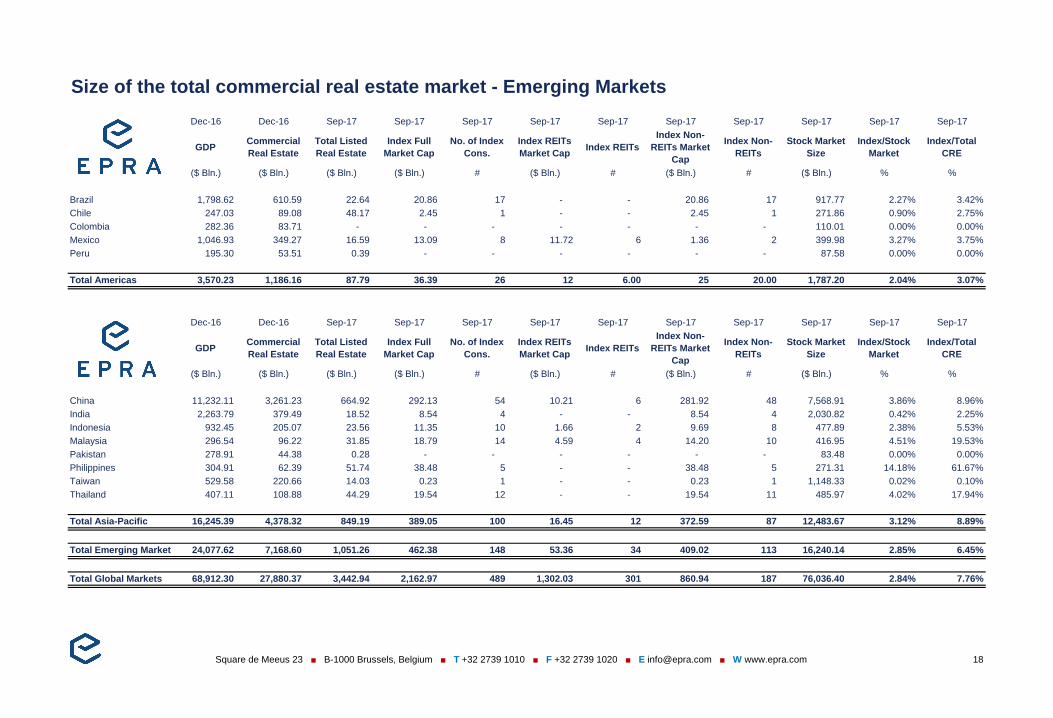
Brazil 1,798.62 610.59 22.64 20.86 17 - - 20.86 17 917.77 2.27% 3.42%
Chile 247.03 89.08 48.17 2.45 1 - - 2.45 1 271.86 0.90% 2.75%
Colombia 282.36 83.71 - - - - - - - 110.01 0.00% 0.00%
Mexico 1,046.93 349.27 16.59 13.09 8 11.72 6 1.36 2 399.98 3.27% 3.75%
Peru 195.30 53.51 0.39 - - - - - - 87.58 0.00% 0.00%
Total Americas 3,570.23 1,186.16 87.79 36.39 26 12 6.00 25 20.00 1,787.20 2.04% 3.07%
Dec-16 Dec-16 Sep-17 Sep-17 Sep-17 Sep-17 Sep-17 Sep-17 Sep-17 Sep-17 Sep-17 Sep-17
GDPCommercial
Real Estate
Total Listed
Real Estate
Index Full
Market Cap
No. of Index
Cons.
Index REITs
Market CapIndex REITs
Index Non-
REITs Market
Cap
Index Non-
REITs
Stock Market
Size
Index/Stock
Market
Index/Total
CRE
($ Bln.) ($ Bln.) ($ Bln.) ($ Bln.) # ($ Bln.) # ($ Bln.) # ($ Bln.) % %
China 11,232.11 3,261.23 664.92 292.13 54 10.21 6 281.92 48 7,568.91 3.86% 8.96%
India 2,263.79 379.49 18.52 8.54 4 - - 8.54 4 2,030.82 0.42% 2.25%
Indonesia 932.45 205.07 23.56 11.35 10 1.66 2 9.69 8 477.89 2.38% 5.53%
Malaysia 296.54 96.22 31.85 18.79 14 4.59 4 14.20 10 416.95 4.51% 19.53%
Pakistan 278.91 44.38 0.28 - - - - - - 83.48 0.00% 0.00%
Philippines 304.91 62.39 51.74 38.48 5 - - 38.48 5 271.31 14.18% 61.67%
Taiwan 529.58 220.66 14.03 0.23 1 - - 0.23 1 1,148.33 0.02% 0.10%
Thailand 407.11 108.88 44.29 19.54 12 - - 19.54 11 485.97 4.02% 17.94%
Total Asia-Pacific 16,245.39 4,378.32 849.19 389.05 100 16.45 12 372.59 87 12,483.67 3.12% 8.89%
Total Emerging Markets 24,077.62 7,168.60 1,051.26 462.38 148 53.36 34 409.02 113 16,240.14 2.85% 6.45%
Total Global Markets 68,912.30 27,880.37 3,442.94 2,162.97 489 1,302.03 301 860.94 187 76,036.40 2.84% 7.76%
18
Size of the total commercial real estate market - Emerging Markets
Square de Meeus 23 ■ B-1000 Brussels, Belgium ■ T +32 2739 1010 ■ F +32 2739 1020 ■ E [email protected] ■ W www.epra.com
Dec-16 Dec-16 Sep-17 Sep-17 Sep-17 Sep-17 Sep-17 Sep-17 Sep-17 Sep-17 Sep-17 Sep-17
GDPCommercial
Real Estate
Total Listed
Real Estate
Index Full
Market Cap
No. of Index
Cons.
Index REITs
Market CapIndex REITs
Index Non-
REITs Market
Cap
Index Non-
REITs
Stock Market
Size
Index/Stock
Market
Index/Total
CRE
($ Bln.) ($ Bln.) ($ Bln.) ($ Bln.) # ($ Bln.) # ($ Bln.) # ($ Bln.) % %
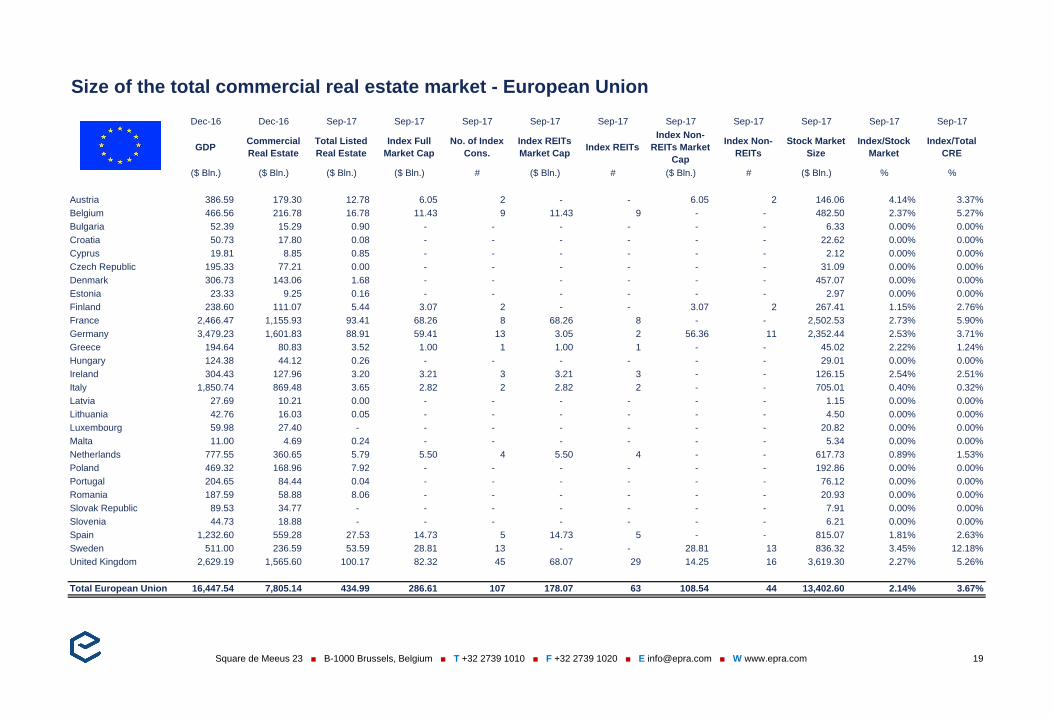
Austria 386.59 179.30 12.78 6.05 2 - - 6.05 2 146.06 4.14% 3.37%
Belgium 466.56 216.78 16.78 11.43 9 11.43 9 - - 482.50 2.37% 5.27%
Bulgaria 52.39 15.29 0.90 - - - - - - 6.33 0.00% 0.00%
Croatia 50.73 17.80 0.08 - - - - - - 22.62 0.00% 0.00%
Cyprus 19.81 8.85 0.85 - - - - - - 2.12 0.00% 0.00%
Czech Republic 195.33 77.21 0.00 - - - - - - 31.09 0.00% 0.00%
Denmark 306.73 143.06 1.68 - - - - - - 457.07 0.00% 0.00%
Estonia 23.33 9.25 0.16 - - - - - - 2.97 0.00% 0.00%
Finland 238.60 111.07 5.44 3.07 2 - - 3.07 2 267.41 1.15% 2.76%
France 2,466.47 1,155.93 93.41 68.26 8 68.26 8 - - 2,502.53 2.73% 5.90%
Germany 3,479.23 1,601.83 88.91 59.41 13 3.05 2 56.36 11 2,352.44 2.53% 3.71%
Greece 194.64 80.83 3.52 1.00 1 1.00 1 - - 45.02 2.22% 1.24%
Hungary 124.38 44.12 0.26 - - - - - - 29.01 0.00% 0.00%
Ireland 304.43 127.96 3.20 3.21 3 3.21 3 - - 126.15 2.54% 2.51%
Italy 1,850.74 869.48 3.65 2.82 2 2.82 2 - - 705.01 0.40% 0.32%
Latvia 27.69 10.21 0.00 - - - - - - 1.15 0.00% 0.00%
Lithuania 42.76 16.03 0.05 - - - - - - 4.50 0.00% 0.00%
Luxembourg 59.98 27.40 - - - - - - - 20.82 0.00% 0.00%
Malta 11.00 4.69 0.24 - - - - - - 5.34 0.00% 0.00%
Netherlands 777.55 360.65 5.79 5.50 4 5.50 4 - - 617.73 0.89% 1.53%
Poland 469.32 168.96 7.92 - - - - - - 192.86 0.00% 0.00%
Portugal 204.65 84.44 0.04 - - - - - - 76.12 0.00% 0.00%
Romania 187.59 58.88 8.06 - - - - - - 20.93 0.00% 0.00%
Slovak Republic 89.53 34.77 - - - - - - - 7.91 0.00% 0.00%
Slovenia 44.73 18.88 - - - - - - - 6.21 0.00% 0.00%
Spain 1,232.60 559.28 27.53 14.73 5 14.73 5 - - 815.07 1.81% 2.63%
Sweden 511.00 236.59 53.59 28.81 13 - - 28.81 13 836.32 3.45% 12.18%
United Kingdom 2,629.19 1,565.60 100.17 82.32 45 68.07 29 14.25 16 3,619.30 2.27% 5.26%
Total European Union 16,447.54 7,805.14 434.99 286.61 107 178.07 63 108.54 44 13,402.60 2.14% 3.67%
19
Size of the total commercial real estate market - European Union
Square de Meeus 23 ■ B-1000 Brussels, Belgium ■ T +32 2739 1010 ■ F +32 2739 1020 ■ E [email protected] ■ W www.epra.com
Dec-16 Dec-16 Jun-17 Jun-17 Jun-17 Jun-17 Jun-17 Jun-17 Jun-17 Jun-17 Jun-17 Jun-17
GDPCommercial
Real Estate
Total Listed
Real Estate
Index Full
Market Cap
No. of Index
Cons.
Index REITs
Market CapIndex REITs
Index Non-
REITs Market
Cap
Index Non-
REITs
Stock Market
Size
Index/Stock
Market
Index/Total
CRE
($ Bln.) ($ Bln.) ($ Bln.) ($ Bln.) # ($ Bln.) # ($ Bln.) # ($ Bln.) % %
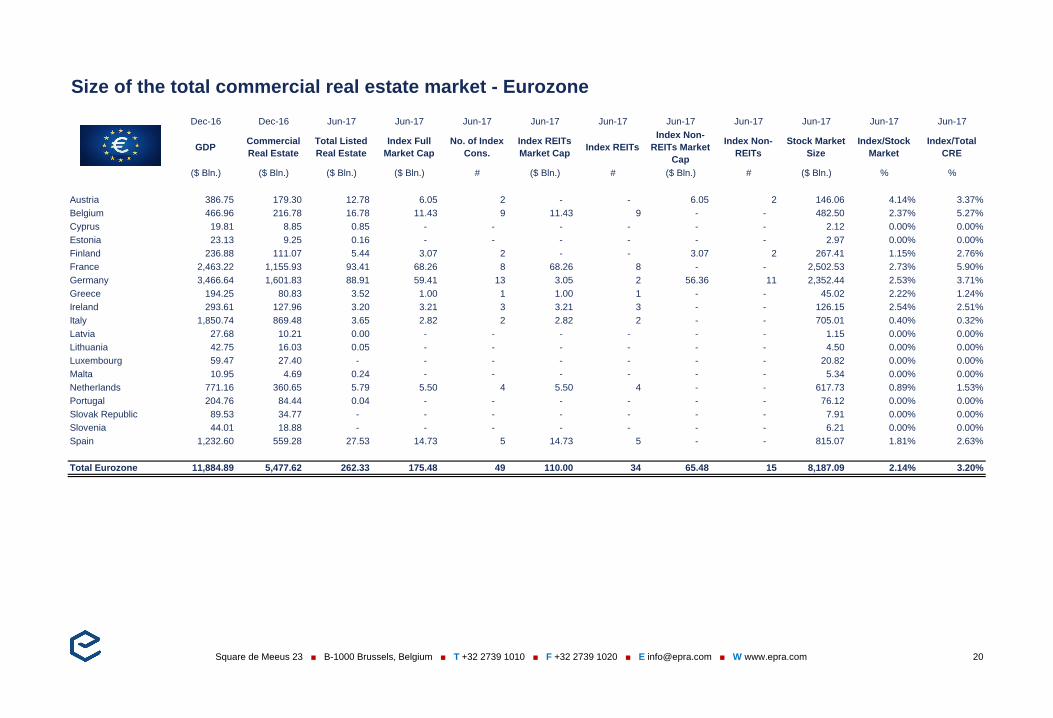
Austria 386.75 179.30 12.78 6.05 2 - - 6.05 2 146.06 4.14% 3.37%
Belgium 466.96 216.78 16.78 11.43 9 11.43 9 - - 482.50 2.37% 5.27%
Cyprus 19.81 8.85 0.85 - - - - - - 2.12 0.00% 0.00%
Estonia 23.13 9.25 0.16 - - - - - - 2.97 0.00% 0.00%
Finland 236.88 111.07 5.44 3.07 2 - - 3.07 2 267.41 1.15% 2.76%
France 2,463.22 1,155.93 93.41 68.26 8 68.26 8 - - 2,502.53 2.73% 5.90%
Germany 3,466.64 1,601.83 88.91 59.41 13 3.05 2 56.36 11 2,352.44 2.53% 3.71%
Greece 194.25 80.83 3.52 1.00 1 1.00 1 - - 45.02 2.22% 1.24%
Ireland 293.61 127.96 3.20 3.21 3 3.21 3 - - 126.15 2.54% 2.51%
Italy 1,850.74 869.48 3.65 2.82 2 2.82 2 - - 705.01 0.40% 0.32%
Latvia 27.68 10.21 0.00 - - - - - - 1.15 0.00% 0.00%
Lithuania 42.75 16.03 0.05 - - - - - - 4.50 0.00% 0.00%
Luxembourg 59.47 27.40 - - - - - - - 20.82 0.00% 0.00%
Malta 10.95 4.69 0.24 - - - - - - 5.34 0.00% 0.00%
Netherlands 771.16 360.65 5.79 5.50 4 5.50 4 - - 617.73 0.89% 1.53%
Portugal 204.76 84.44 0.04 - - - - - - 76.12 0.00% 0.00%
Slovak Republic 89.53 34.77 - - - - - - - 7.91 0.00% 0.00%
Slovenia 44.01 18.88 - - - - - - - 6.21 0.00% 0.00%
Spain 1,232.60 559.28 27.53 14.73 5 14.73 5 - - 815.07 1.81% 2.63%
Total Eurozone 11,884.89 5,477.62 262.33 175.48 49 110.00 34 65.48 15 8,187.09 2.14% 3.20%
20
Size of the total commercial real estate market - Eurozone
Square de Meeus 23 ■ B-1000 Brussels, Belgium ■ T +32 2739 1010 ■ F +32 2739 1020 ■ E [email protected] ■ W www.epra.com
Dec-16 Dec-16 Jun-17 Jun-17 Jun-17 Jun-17 Jun-17 Jun-17 Jun-17 Jun-17 Jun-17 Jun-17
GDPCommercial
Real Estate
Total Listed
Real Estate
Index Full
Market Cap
No. of Index
Cons.
Index REITs
Market CapIndex REITs
Index Non-
REITs Market
Cap
Index Non-
REITs
Stock Market
Size
Index/Stock
Market
Index/Total
CRE
(€ Bln.) (€ Bln.) (€ Bln.) (€ Bln.) # (€ Bln.) # (€ Bln.) # (€ Bln.) % %
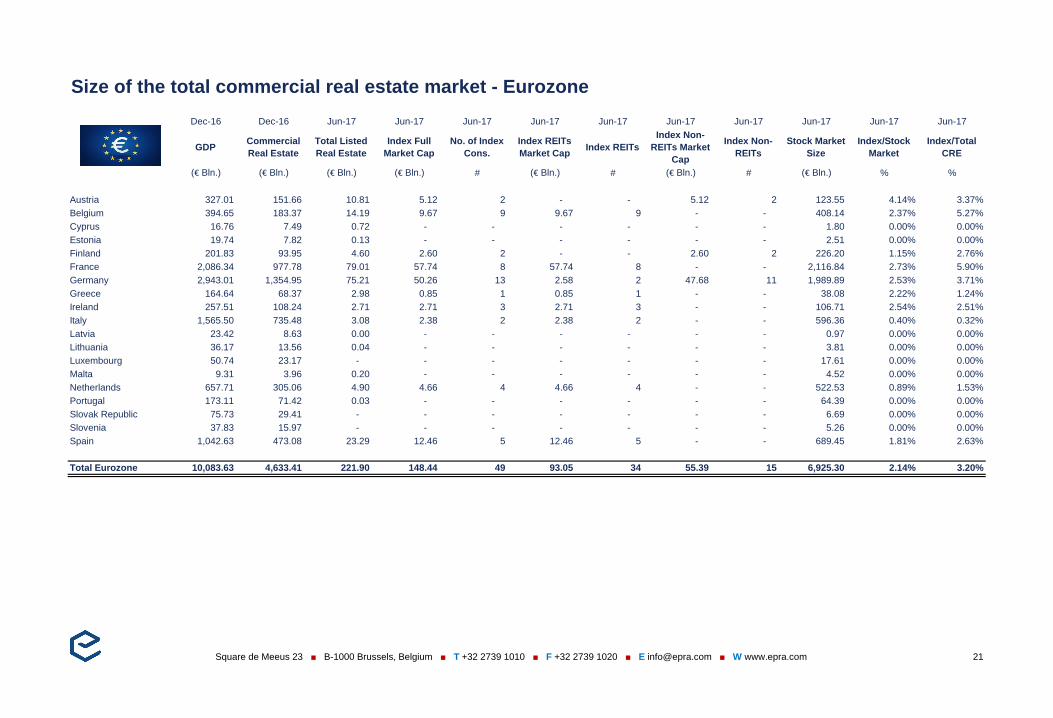
Austria 327.01 151.66 10.81 5.12 2 - - 5.12 2 123.55 4.14% 3.37%
Belgium 394.65 183.37 14.19 9.67 9 9.67 9 - - 408.14 2.37% 5.27%
Cyprus 16.76 7.49 0.72 - - - - - - 1.80 0.00% 0.00%
Estonia 19.74 7.82 0.13 - - - - - - 2.51 0.00% 0.00%
Finland 201.83 93.95 4.60 2.60 2 - - 2.60 2 226.20 1.15% 2.76%
France 2,086.34 977.78 79.01 57.74 8 57.74 8 - - 2,116.84 2.73% 5.90%
Germany 2,943.01 1,354.95 75.21 50.26 13 2.58 2 47.68 11 1,989.89 2.53% 3.71%
Greece 164.64 68.37 2.98 0.85 1 0.85 1 - - 38.08 2.22% 1.24%
Ireland 257.51 108.24 2.71 2.71 3 2.71 3 - - 106.71 2.54% 2.51%
Italy 1,565.50 735.48 3.08 2.38 2 2.38 2 - - 596.36 0.40% 0.32%
Latvia 23.42 8.63 0.00 - - - - - - 0.97 0.00% 0.00%
Lithuania 36.17 13.56 0.04 - - - - - - 3.81 0.00% 0.00%
Luxembourg 50.74 23.17 - - - - - - - 17.61 0.00% 0.00%
Malta 9.31 3.96 0.20 - - - - - - 4.52 0.00% 0.00%
Netherlands 657.71 305.06 4.90 4.66 4 4.66 4 - - 522.53 0.89% 1.53%
Portugal 173.11 71.42 0.03 - - - - - - 64.39 0.00% 0.00%
Slovak Republic 75.73 29.41 - - - - - - - 6.69 0.00% 0.00%
Slovenia 37.83 15.97 - - - - - - - 5.26 0.00% 0.00%
Spain 1,042.63 473.08 23.29 12.46 5 12.46 5 - - 689.45 1.81% 2.63%
Total Eurozone 10,083.63 4,633.41 221.90 148.44 49 93.05 34 55.39 15 6,925.30 2.14% 3.20%
21
Size of the total commercial real estate market - Eurozone
Square de Meeus 23 ■ B-1000 Brussels, Belgium ■ T +32 2739 1010 ■ F +32 2739 1020 ■ E [email protected] ■ W www.epra.com
Dec-16 Dec-16 Jun-17 Jun-17 Jun-17 Jun-17 Jun-17 Jun-17 Jun-17 Jun-17 Jun-17 Jun-17
GDPCommercial
Real Estate
Total Listed
Real Estate
Index Full
Market Cap
No. of Index
Cons.
Index REITs
Market CapIndex REITs
Index Non-
REITs Market
Cap
Index Non-
REITs
Stock Market
Size
Index/Stock
Market
Index/Total
CRE
($ Bln.) ($ Bln.) ($ Bln.) ($ Bln.) # ($ Bln.) # ($ Bln.) # ($ Bln.) % %
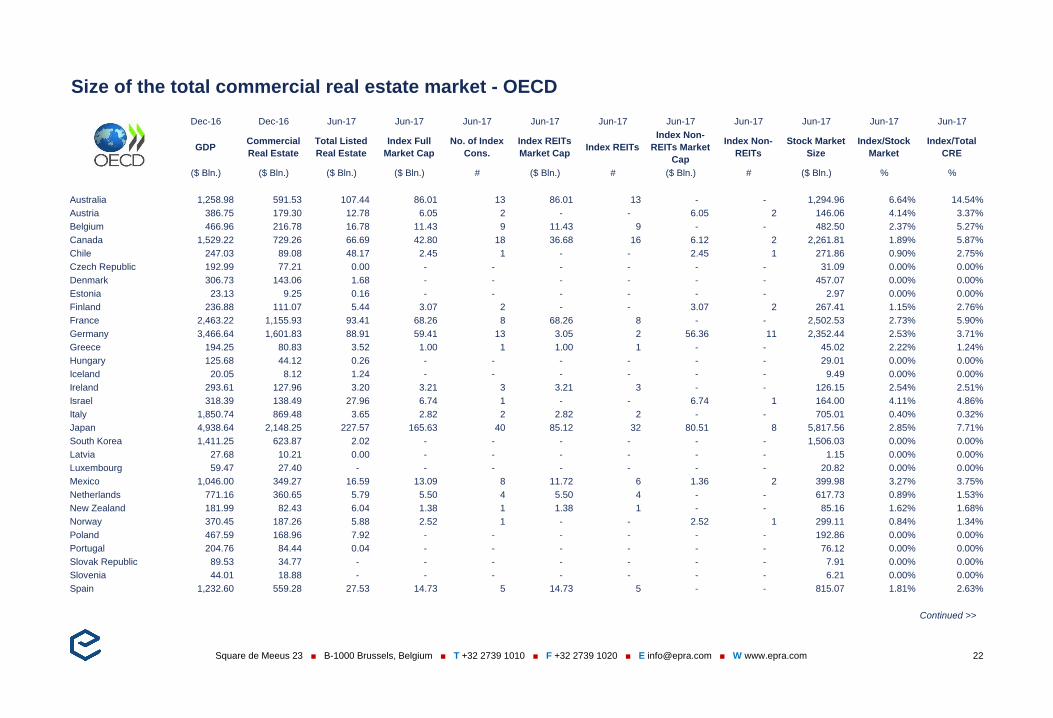
Australia 1,258.98 591.53 107.44 86.01 13 86.01 13 - - 1,294.96 6.64% 14.54%
Austria 386.75 179.30 12.78 6.05 2 - - 6.05 2 146.06 4.14% 3.37%
Belgium 466.96 216.78 16.78 11.43 9 11.43 9 - - 482.50 2.37% 5.27%
Canada 1,529.22 729.26 66.69 42.80 18 36.68 16 6.12 2 2,261.81 1.89% 5.87%
Chile 247.03 89.08 48.17 2.45 1 - - 2.45 1 271.86 0.90% 2.75%
Czech Republic 192.99 77.21 0.00 - - - - - - 31.09 0.00% 0.00%
Denmark 306.73 143.06 1.68 - - - - - - 457.07 0.00% 0.00%
Estonia 23.13 9.25 0.16 - - - - - - 2.97 0.00% 0.00%
Finland 236.88 111.07 5.44 3.07 2 - - 3.07 2 267.41 1.15% 2.76%
France 2,463.22 1,155.93 93.41 68.26 8 68.26 8 - - 2,502.53 2.73% 5.90%
Germany 3,466.64 1,601.83 88.91 59.41 13 3.05 2 56.36 11 2,352.44 2.53% 3.71%
Greece 194.25 80.83 3.52 1.00 1 1.00 1 - - 45.02 2.22% 1.24%
Hungary 125.68 44.12 0.26 - - - - - - 29.01 0.00% 0.00%
Iceland 20.05 8.12 1.24 - - - - - - 9.49 0.00% 0.00%
Ireland 293.61 127.96 3.20 3.21 3 3.21 3 - - 126.15 2.54% 2.51%
Israel 318.39 138.49 27.96 6.74 1 - - 6.74 1 164.00 4.11% 4.86%
Italy 1,850.74 869.48 3.65 2.82 2 2.82 2 - - 705.01 0.40% 0.32%
Japan 4,938.64 2,148.25 227.57 165.63 40 85.12 32 80.51 8 5,817.56 2.85% 7.71%
South Korea 1,411.25 623.87 2.02 - - - - - - 1,506.03 0.00% 0.00%
Latvia 27.68 10.21 0.00 - - - - - - 1.15 0.00% 0.00%
Luxembourg 59.47 27.40 - - - - - - - 20.82 0.00% 0.00%
Mexico 1,046.00 349.27 16.59 13.09 8 11.72 6 1.36 2 399.98 3.27% 3.75%
Netherlands 771.16 360.65 5.79 5.50 4 5.50 4 - - 617.73 0.89% 1.53%
New Zealand 181.99 82.43 6.04 1.38 1 1.38 1 - - 85.16 1.62% 1.68%
Norway 370.45 187.26 5.88 2.52 1 - - 2.52 1 299.11 0.84% 1.34%
Poland 467.59 168.96 7.92 - - - - - - 192.86 0.00% 0.00%
Portugal 204.76 84.44 0.04 - - - - - - 76.12 0.00% 0.00%
Slovak Republic 89.53 34.77 - - - - - - - 7.91 0.00% 0.00%
Slovenia 44.01 18.88 - - - - - - - 6.21 0.00% 0.00%
Spain 1,232.60 559.28 27.53 14.73 5 14.73 5 - - 815.07 1.81% 2.63%
24,226.36 10,828.97 780.66 496.09 132.00 330.91 102.00 165.18 30.00 20,995.09
Continued >>
22
Size of the total commercial real estate market - OECD
Square de Meeus 23 ■ B-1000 Brussels, Belgium ■ T +32 2739 1010 ■ F +32 2739 1020 ■ E [email protected] ■ W www.epra.com
Dec-16 Dec-16 Jun-17 Jun-17 Jun-17 Jun-17 Jun-17 Jun-17 Jun-17 Jun-17 Jun-17 Jun-17
GDPCommercial
Real Estate
Total Listed
Real Estate
Index Full
Market Cap
No. of Index
Cons.
Index REITs
Market CapIndex REITs
Index Non-
REITs Market
Cap
Index Non-
REITs
Stock Market
Size
Index/Stock
Market
Index/Total
CRE
($ Bln.) ($ Bln.) ($ Bln.) ($ Bln.) # ($ Bln.) # ($ Bln.) # ($ Bln.) % %
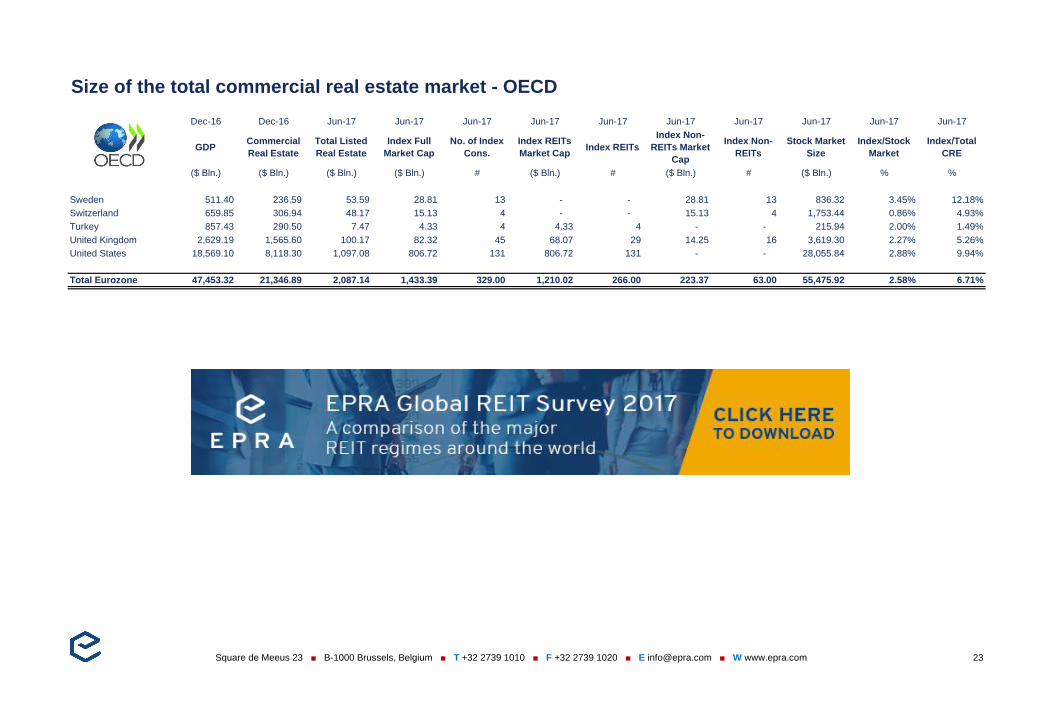
Sweden 511.40 236.59 53.59 28.81 13 - - 28.81 13 836.32 3.45% 12.18%
Switzerland 659.85 306.94 48.17 15.13 4 - - 15.13 4 1,753.44 0.86% 4.93%
Turkey 857.43 290.50 7.47 4.33 4 4.33 4 - - 215.94 2.00% 1.49%
United Kingdom 2,629.19 1,565.60 100.17 82.32 45 68.07 29 14.25 16 3,619.30 2.27% 5.26%
United States 18,569.10 8,118.30 1,097.08 806.72 131 806.72 131 - - 28,055.84 2.88% 9.94%
23,226.96 10,517.92 1,306.48 937.30 197.00 879.11 164.00 58.19 33.00 34,480.84
Total Eurozone 47,453.32 21,346.89 2,087.14 1,433.39 329.00 1,210.02 266.00 223.37 63.00 55,475.92 2.58% 6.71%
23
Size of the total commercial real estate market - OECD
Square de Meeus 23 ■ B-1000 Brussels, Belgium ■ T +32 2739 1010 ■ F +32 2739 1020 ■ E [email protected] ■ W www.epra.com
Dec-16 Dec-16 Jun-17 Jun-17 Jun-17 Jun-17 Jun-17 Jun-17 Jun-17 Jun-17 Jun-17 Jun-17
GDPCommercial
Real Estate
Total Listed
Real Estate
Index Full
Market Cap
No. of Index
Cons.
Index REITs
Market CapIndex REITs
Index Non-
REITs Market
Cap
Index Non-
REITs
Stock Market
Size
Index/Stock
Market
Index/Total
CRE
($ Bln.) ($ Bln.) ($ Bln.) ($ Bln.) # ($ Bln.) # ($ Bln.) # ($ Bln.) % %
Argentina 544.74 200.17 4.32 - - - - - - 96.64 0.00% 0.00%
Australia 1,261.65 591.53 107.44 86.01 13 86.01 13 - - 1,294.96 6.64% 14.54%
Austria 386.59 179.30 12.78 6.05 2 - - 6.05 2 146.06 4.14% 3.37%
Bahrain 31.86 17.17 0.46 - - - - - - 19.27 0.00% 0.00%
Belgium 466.56 216.78 16.78 11.43 9 11.43 9 - - 482.50 2.37% 5.27%
Brazil 1,798.62 610.59 22.64 20.86 17 - - 20.86 17 917.77 2.27% 3.42%
Bulgaria 52.39 15.29 0.90 - - - - - - 6.33 0.00% 0.00%
Canada 1,529.76 729.26 66.69 42.80 18 36.68 16 6.12 2 2,261.81 1.89% 5.87%
Chile 247.03 89.08 48.17 2.45 1 - - 2.45 1 271.86 0.90% 2.75%
China 11,232.11 3,261.23 664.92 292.13 54 10.21 6 281.92 48 7,568.91 3.86% 8.96%
Colombia 282.36 83.71 - - - - - - - 110.01 0.00% 0.00%
Croatia 50.73 17.80 0.08 - - - - - - 22.62 0.00% 0.00%
Cyprus 19.81 8.85 0.85 - - - - - - 2.12 0.00% 0.00%
Czech Republic 195.33 77.21 0.00 - - - - - - 31.09 0.00% 0.00%
Denmark 306.73 143.06 1.68 - - - - - - 457.07 0.00% 0.00%
Egypt, Arab Rep. 332.35 73.92 4.97 0.84 1 - - 0.84 1 44.24 1.91% 1.14%
Estonia 23.33 9.25 0.16 - - - - - - 2.97 0.00% 0.00%
Finland 238.60 111.07 5.44 3.07 2 - - 3.07 2 267.41 1.15% 2.76%
France 2,466.47 1,155.93 93.41 68.26 8 68.26 8 - - 2,502.53 2.73% 5.90%
Germany 3,479.23 1,601.83 88.91 59.41 13 3.05 2 56.36 11 2,352.44 2.53% 3.71%
Greece 194.64 80.83 3.52 1.00 1 1.00 1 - - 45.02 2.22% 1.24%
Hong Kong SAR, China 320.91 276.34 293.22 232.90 14 24.18 3 208.71 11 4,986.88 4.67% 84.28%
Hungary 124.38 44.12 0.26 - - - - - - 29.01 0.00% 0.00%
Iceland 20.05 8.12 1.24 - - - - - - 9.49 0.00% 0.00%
India 2,263.79 379.49 18.52 8.54 4 - - 8.54 4 2,030.82 0.42% 2.25%
Indonesia 932.45 205.07 23.56 11.35 10 1.66 2 9.69 8 477.89 2.38% 5.53%
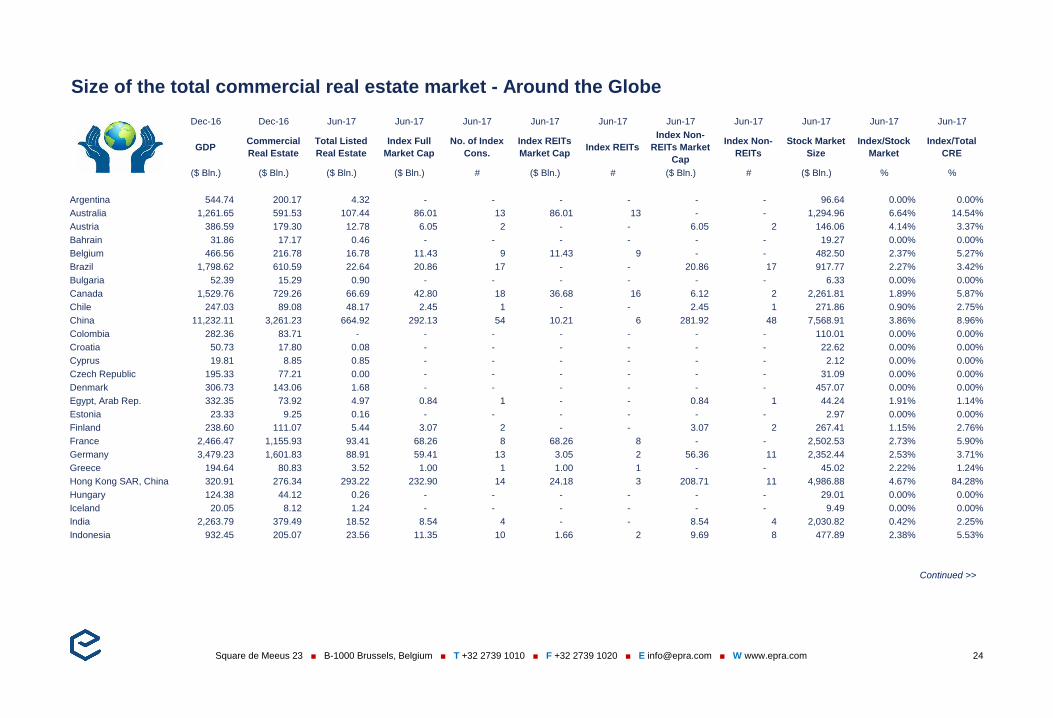
28,802.45 10,187.02 1,480.92 847.09 167.00 242.48 60.00 604.61 107.00 26,437.72 0.40 1.51
Continued >>
24
Size of the total commercial real estate market - Around the Globe
Square de Meeus 23 ■ B-1000 Brussels, Belgium ■ T +32 2739 1010 ■ F +32 2739 1020 ■ E [email protected] ■ W www.epra.com
Dec-16 Dec-16 Jun-17 Jun-17 Jun-17 Jun-17 Jun-17 Jun-17 Jun-17 Jun-17 Jun-17 Jun-17
GDPCommercial
Real Estate
Total Listed
Real Estate
Index Full
Market Cap
No. of Index
Cons.
Index REITs
Market CapIndex REITs
Index Non-
REITs Market
Cap
Index Non-
REITs
Stock Market
Size
Index/Stock
Market
Index/Total
CRE
($ Bln.) ($ Bln.) ($ Bln.) ($ Bln.) # ($ Bln.) # ($ Bln.) # ($ Bln.) % %
Ireland 304.43 127.96 3.20 3.21 3 3.21 3 - - 126.15 2.54% 2.51%
Israel 317.75 138.49 27.96 6.74 1 - - 6.74 1 164.00 4.11% 4.86%
Italy 1,850.74 869.48 3.65 2.82 2 2.82 2 - - 705.01 0.40% 0.32%
Jamaica 13.96 3.55 0.25 - - - - - - 7.96 0.00% 0.00%
Japan 4,936.54 2,148.25 227.57 165.63 40 85.12 32 80.51 8 5,817.56 2.85% 7.71%
Jordan 38.71 9.80 0.96 - - - - - - 24.05 0.00% 0.00%
Kazakhstan 133.67 51.24 - - - - - - - 11.71 0.00% 0.00%
Korea, Rep. 1,411.04 623.87 2.02 - - - - - - 1,506.03 0.00% 0.00%
Kuwait 110.87 70.95 7.41 - - - - - - 88.90 0.00% 0.00%
Latvia 27.69 10.21 0.00 - - - - - - 1.15 0.00% 0.00%
Lebanon 50.46 16.38 1.36 - - - - - - 8.71 0.00% 0.00%
Lithuania 42.76 16.03 0.05 - - - - - - 4.50 0.00% 0.00%
Luxembourg 59.98 27.40 - - - - - - - 20.82 0.00% 0.00%
Malaysia 296.54 96.22 31.85 18.79 14 4.59 4 14.20 10 416.95 4.51% 19.53%
Malta 11.00 4.69 0.24 - - - - - - 5.34 0.00% 0.00%
Mauritius 12.15 3.80 2.48 - - - - - - 11.59 0.00% 0.00%
Mexico 1,046.93 349.27 16.59 13.09 8 11.72 6 1.36 2 399.98 3.27% 3.75%
Morocco 103.61 22.38 2.24 - - - - - - 64.86 0.00% 0.00%
Netherlands 777.55 360.65 5.79 5.50 4 5.50 4 - - 617.73 0.89% 1.53%
New Zealand 181.71 82.43 6.04 1.38 1 1.38 1 - - 85.16 1.62% 1.68%
Nigeria 405.44 91.90 0.10 - - - - - - 33.81 0.00% 0.00%
Norway 370.56 187.26 5.88 2.52 1 - - 2.52 1 299.11 0.84% 1.34%
Oman 66.29 27.06 - - - - - - - 20.99 0.00% 0.00%
Pakistan 278.91 44.38 0.28 - - - - - - 83.48 0.00% 0.00%
Peru 195.30 53.51 0.39 - - - - - - 87.58 0.00% 0.00%
Philippines 304.91 62.39 51.74 38.48 5 - - 38.48 5 271.31 14.18% 61.67%
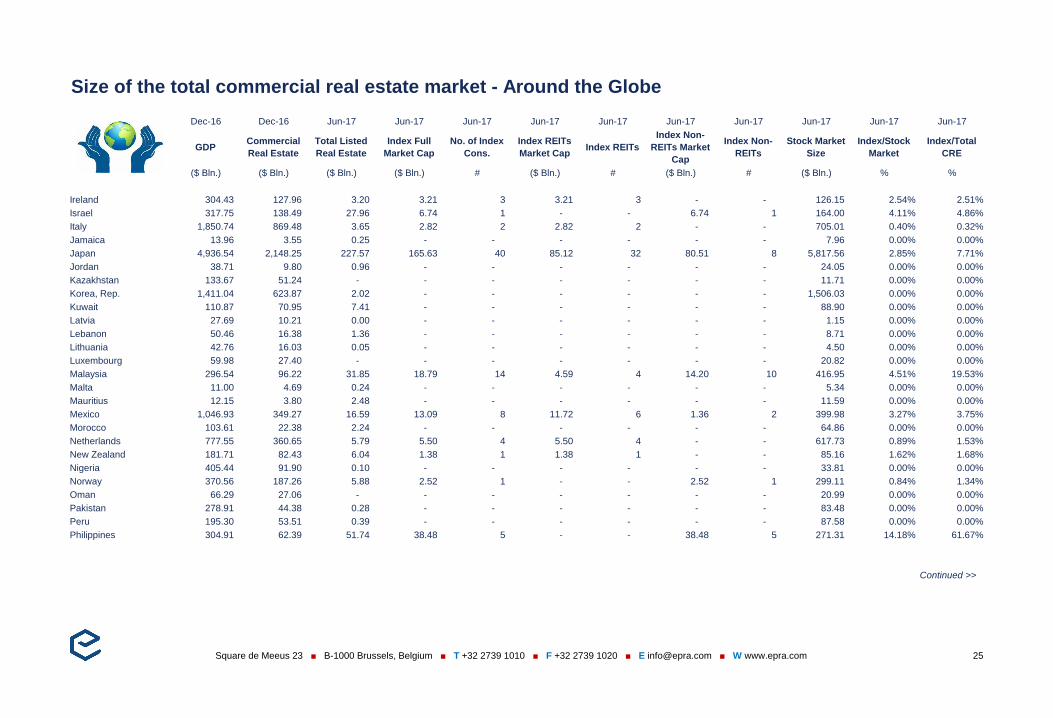
13,349.48 5,499.54 398.07 258.14 79.00 114.34 52.00 143.80 27.00 10,884.44
Continued >>
25
Size of the total commercial real estate market - Around the Globe
Square de Meeus 23 ■ B-1000 Brussels, Belgium ■ T +32 2739 1010 ■ F +32 2739 1020 ■ E [email protected] ■ W www.epra.com
Dec-16 Dec-16 Jun-17 Jun-17 Jun-17 Jun-17 Jun-17 Jun-17 Jun-17 Jun-17 Jun-17 Jun-17
GDPCommercial
Real Estate
Total Listed
Real Estate
Index Full
Market Cap
No. of Index
Cons.
Index REITs
Market CapIndex REITs
Index Non-
REITs Market
Cap
Index Non-
REITs
Stock Market
Size
Index/Stock
Market
Index/Total
CRE
($ Bln.) ($ Bln.) ($ Bln.) ($ Bln.) # ($ Bln.) # ($ Bln.) # ($ Bln.) % %
Poland 469.32 168.96 7.92 - - - - - - 192.86 0.00% 0.00%
Portugal 204.65 84.44 0.04 - - - - - - 76.12 0.00% 0.00%
Qatar 155.79 97.21 12.58 - - - - - - 122.51 0.00% 0.00%
Romania 187.59 58.88 8.06 - - - - - - 20.93 0.00% 0.00%
Russian Federation 1,283.16 482.31 6.18 - - - - - - 586.07 0.00% 0.00%
Saudi Arabia 646.44 275.92 27.52 - - - - - - 458.87 0.00% 0.00%
Singapore 296.97 269.75 96.65 55.16 12 31.51 9 23.65 3 546.95 10.09% 20.45%
Slovak Republic 89.53 34.77 - - - - - - - 7.91 0.00% 0.00%
Slovenia 44.73 18.88 - - - - - - - 6.21 0.00% 0.00%
South Africa 294.90 82.85 31.77 22.14 14 19.86 11 2.29 3 470.07 4.71% 26.73%
Spain 1,232.60 559.28 27.53 14.73 5 14.73 5 - - 815.07 1.81% 2.63%
Sri Lanka 80.52 18.37 0.47 - - - - - - 17.35 0.00% 0.00%
Sweden 511.00 236.59 53.59 28.81 13 - - 28.81 13 836.32 3.45% 12.18%
Switzerland 669.04 306.94 48.17 15.13 4 - - 15.13 4 1,753.44 0.86% 4.93%
Taiwan 529.58 220.66 14.03 0.23 1 - - 0.23 1 1,148.33 0.02% 0.10%
Thailand 407.11 108.88 44.29 19.54 12 - - 19.54 11 485.97 4.02% 17.94%
Tunisia 42.07 10.13 0.04 - - - - - - 8.57 0.00% 0.00%
Turkey 863.39 290.50 7.47 4.33 4 4.33 4 - - 215.94 2.00% 1.49%
Ukraine 93.26 21.04 0.05 - - - - - - 2.91 0.00% 0.00%
United Arab Emirates 348.74 206.19 39.62 8.63 2 - - 8.63 2 232.47 3.71% 4.19%
United Kingdom 2,629.19 1,565.60 100.17 82.32 45 68.07 29 14.25 16 3,619.30 2.27% 5.26%
United States 18,624.45 8,118.30 1,097.08 806.72 131 806.72 131 - - 28,055.84 2.88% 9.94%
Venezuela, RB 236.44 68.13 427.72 - - - - - - 8,217.51 0.00% 0.00%
Vietnam 201.31 36.94 10.44 - - - - - - 119.81 0.00% 0.00%
30,141.77 13,341.50 2,061.36 1,057.74 243.00 945.21 189.00 112.53 53.00 48,017.34
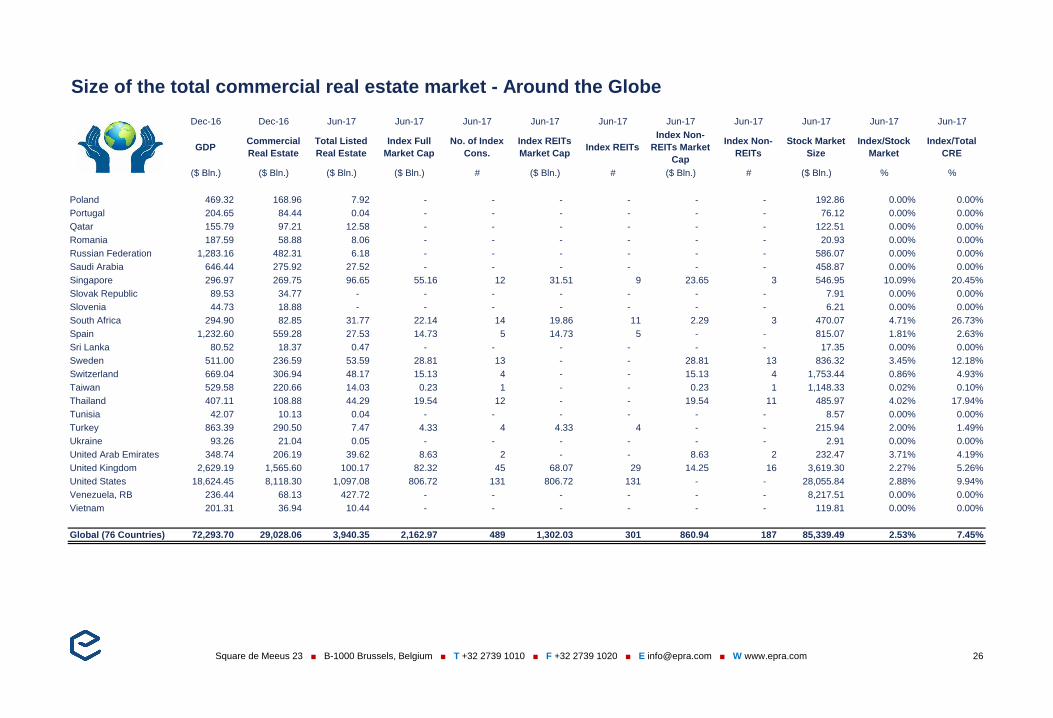
Global (76 Countries) 72,293.70 29,028.06 3,940.35 2,162.97 489 1,302.03 301 860.94 187 85,339.49 2.53% 7.45%
132,577.23 55,711.05 8,063.07 4,278.44 975.00 3,192.45 679.00 1,085.99 293.00 181,374.17
26
Size of the total commercial real estate market - Around the Globe
Square de Meeus 23 ■ B-1000 Brussels, Belgium ■ T +32 2739 1010 ■ F +32 2739 1020 ■ E [email protected] ■ W www.epra.com
27
Size of the total commercial real estate market - Methodology
Square de Meeus 23 ■ B-1000 Brussels, Belgium ■ T +32 2739 1010 ■ F +32 2739 1020 ■ E [email protected] ■ W www.epra.com
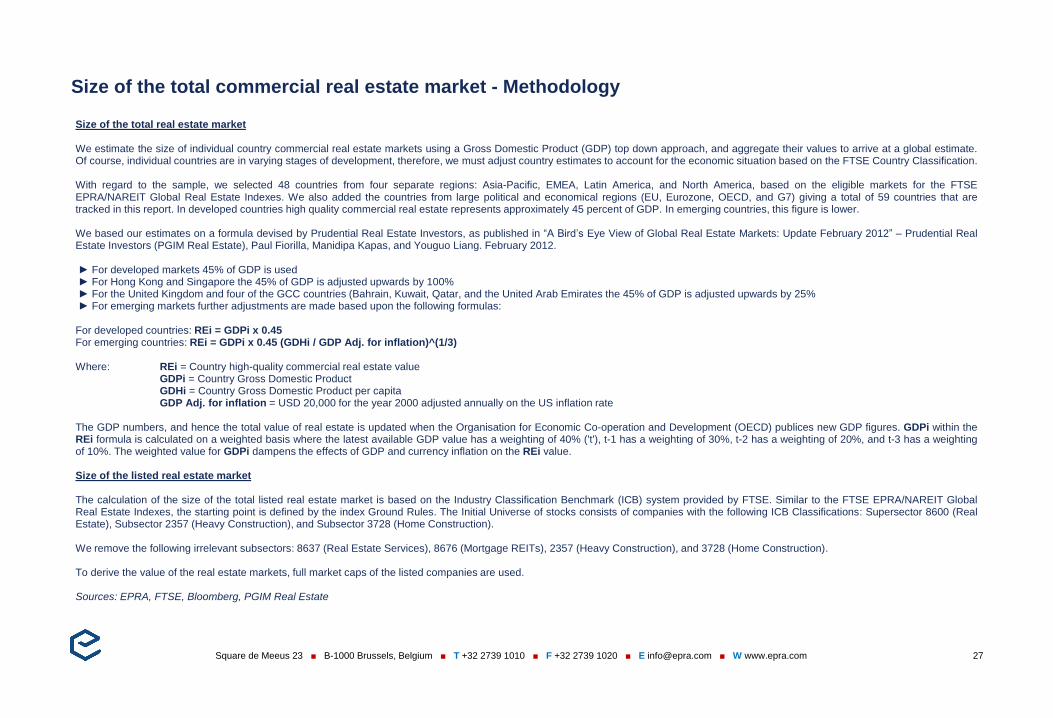
Size of the total real estate market
We estimate the size of individual country commercial real estate markets using a Gross Domestic Product (GDP) top down approach, and aggregate their values to arrive at a global estimate.Of course, individual countries are in varying stages of development, therefore, we must adjust country estimates to account for the economic situation based on the FTSE Country Classification.
With regard to the sample, we selected 48 countries from four separate regions: Asia-Pacific, EMEA, Latin America, and North America, based on the eligible markets for the FTSEEPRA/NAREIT Global Real Estate Indexes. We also added the countries from large political and economical regions (EU, Eurozone, OECD, and G7) giving a total of 59 countries that aretracked in this report. In developed countries high quality commercial real estate represents approximately 45 percent of GDP. In emerging countries, this figure is lower.
We based our estimates on a formula devised by Prudential Real Estate Investors, as published in “A Bird’s Eye View of Global Real Estate Markets: Update February 2012” – Prudential RealEstate Investors (PGIM Real Estate), Paul Fiorilla, Manidipa Kapas, and Youguo Liang. February 2012.
► For developed markets 45% of GDP is used► For Hong Kong and Singapore the 45% of GDP is adjusted upwards by 100%► For the United Kingdom and four of the GCC countries (Bahrain, Kuwait, Qatar, and the United Arab Emirates the 45% of GDP is adjusted upwards by 25%► For emerging markets further adjustments are made based upon the following formulas:
For developed countries: REi = GDPi x 0.45For emerging countries: REi = GDPi x 0.45 (GDHi / GDP Adj. for inflation)^(1/3)
Where: REi = Country high-quality commercial real estate valueGDPi = Country Gross Domestic ProductGDHi = Country Gross Domestic Product per capitaGDP Adj. for inflation = USD 20,000 for the year 2000 adjusted annually on the US inflation rate
The GDP numbers, and hence the total value of real estate is updated when the Organisation for Economic Co-operation and Development (OECD) publices new GDP figures. GDPi within theREi formula is calculated on a weighted basis where the latest available GDP value has a weighting of 40% ('t'), t-1 has a weighting of 30%, t-2 has a weighting of 20%, and t-3 has a weightingof 10%. The weighted value for GDPi dampens the effects of GDP and currency inflation on the REi value.
Size of the listed real estate market
The calculation of the size of the total listed real estate market is based on the Industry Classification Benchmark (ICB) system provided by FTSE. Similar to the FTSE EPRA/NAREIT GlobalReal Estate Indexes, the starting point is defined by the index Ground Rules. The Initial Universe of stocks consists of companies with the following ICB Classifications: Supersector 8600 (RealEstate), Subsector 2357 (Heavy Construction), and Subsector 3728 (Home Construction).
We remove the following irrelevant subsectors: 8637 (Real Estate Services), 8676 (Mortgage REITs), 2357 (Heavy Construction), and 3728 (Home Construction).
To derive the value of the real estate markets, full market caps of the listed companies are used.
Sources: EPRA, FTSE, Bloomberg, PGIM Real Estate
28
Size of the total commercial real estate market - EPRA Disclaimer
Square de Meeus 23 ■ B-1000 Brussels, Belgium ■ T +32 2739 1010 ■ F +32 2739 1020 ■ E [email protected] ■ W www.epra.com
The European Public Real Estate Association ("EPRA") is a not-for-profit association registered in Belgium with registered number 0811738560 and VAT registration number BE 0811.738.560.Our registered office is at Square De Meeus 23, 1000 Brussels, Belgium. This message is intended solely for the addressee and may contain confidential information. If you have received thismessage in error, please send it back to us, and immediately and permanently delete it. Do not use, copy or disclose the information contained in this message or in any attachment. Users ofinformation in this email do so at their own risk and must still comply with their responsibilities to their regulatory authority or shareholders. We are not liable for incorrect use or interpretation ofour published research, policies or guidance. We accept no liability for damage suffered as a consequence of our published research, policies or guidance being used to mislead a third party.Responsibility for emails related to the business of EPRA lies with EPRA and not the individual sender. Where this email is unrelated to the business of EPRA the opinions expressed within thisemail are the opinions of the sender and do not necessarily constitute those of EPRA.
EPRA does not intend this presentation to be a solicitation related to any particular company, nor does it intend to provide investment, legal or tax advice. Investors should consult with their owninvestment, legal or tax advisers regarding the appropriateness of investing in any of the securities or investment strategies discussed in this presentation. Nothing herein should be construed tobe an endorsement by EPRA of any specific company or products or as an offer to sell or a solicitation to buy any security or other financial instrument or to participate in any trading strategy.EPRA expressly disclaims any liability for the accuracy, timeliness or completeness of data in this presentation. Unless otherwise indicated, all data are derived from, and apply only to, publiclytraded securities. Any investment returns or performance data (past, hypothetical or otherwise) are not necessarily indicative of future returns or performance.