Embed Size (px)
Citation preview
Field DevelopmentField DevelopmentSvalex 2007 August 2007
Longyearbyen, Svalbard, No
AgendaAgenda
ScheduleOverview of Field DevelopmentSimulation conceptLearning PointsCH1 Reservoir characterizationCH2 Design BasisCH3 Offshore StructuresCH4 Execution planSimulation login details
ScheduleSchedule
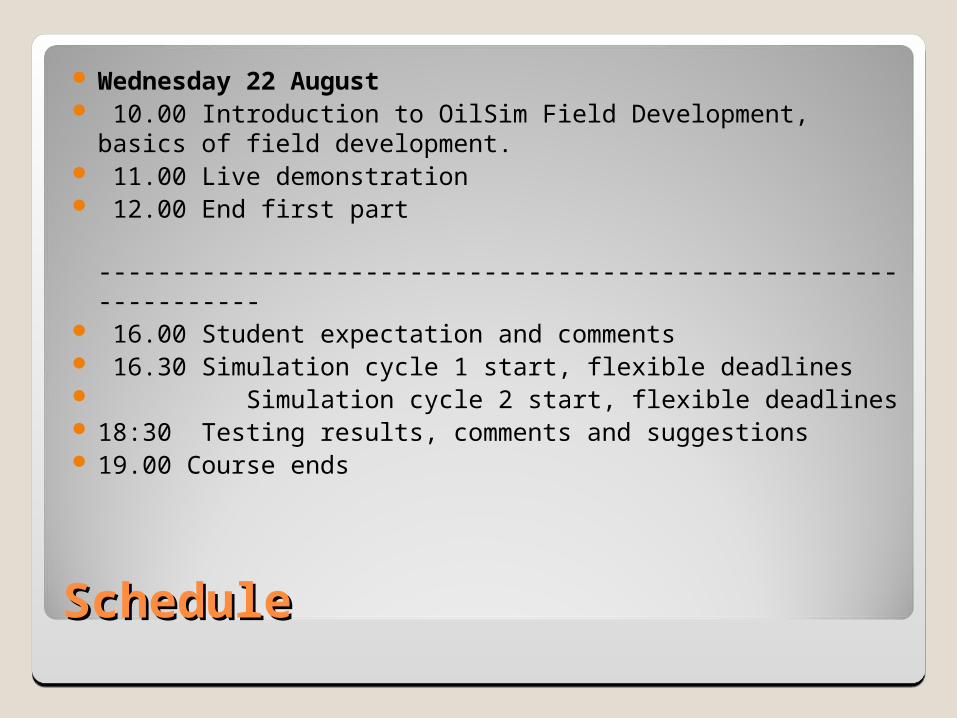
Wednesday 22 August 10.00 Introduction to OilSim Field Development, basics of
field development. 11.00 Live demonstration 12.00 End first part ----------------------------------------------------------------- 16.00 Student expectation and comments 16.30 Simulation cycle 1 start, flexible deadlines Simulation cycle 2 start, flexible deadlines 18:30 Testing results, comments and suggestions 19.00 Course ends
OverviewOverview
Enhance your overall understanding of hydrocarbon field development
Common scenario to work onMultidisciplinary challengeYou are a multidisciplinary team in charge of submitting
the best technical and economic proposal for a hydrocarbon field development.
Your task is to find the proposals with the best net present value and the highest Knowledge points.
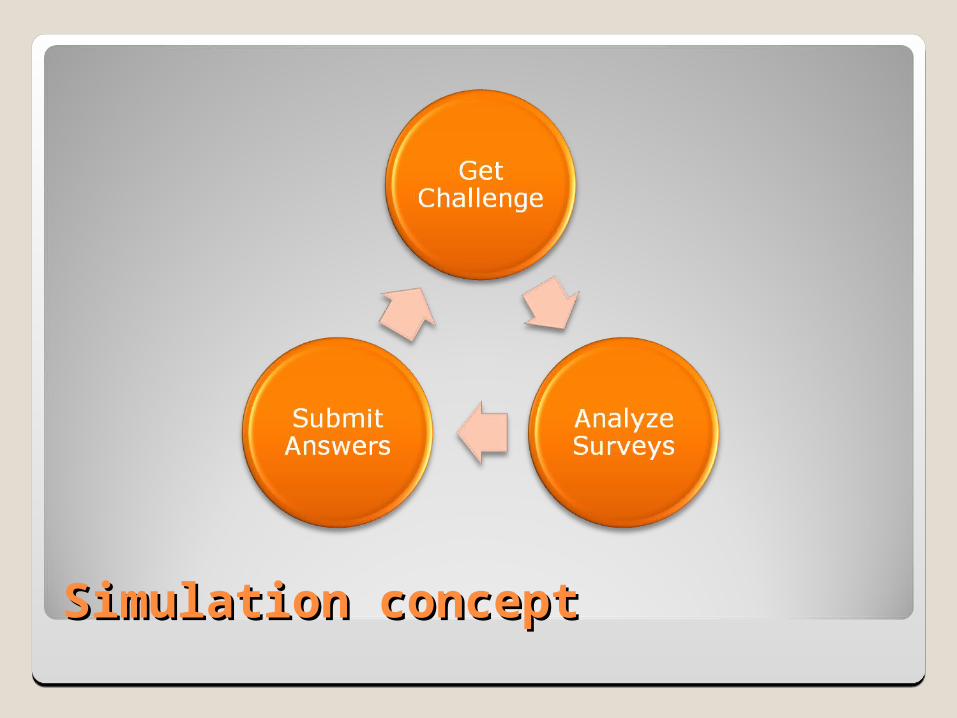
Simulation ConceptSimulation Concept
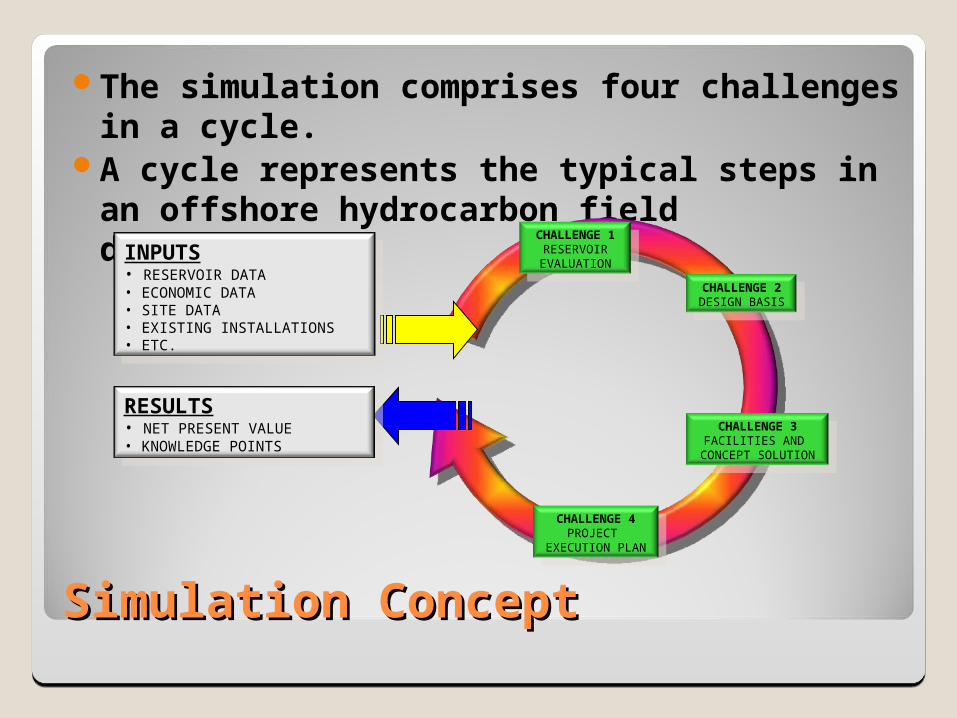
The simulation comprises four challenges in a cycle.A cycle represents the typical steps in an
offshore hydrocarbon field development
CHALLENGE 1RESERVOIR
EVALUATIONINPUTS• RESERVOIR DATA• ECONOMIC DATA• SITE DATA• EXISTING INSTALLATIONS• ETC.
CHALLENGE 2DESIGN BASIS
CHALLENGE 4PROJECT
EXECUTION PLAN
CHALLENGE 3FACILITIES AND
CONCEPT SOLUTION
RESULTS• NET PRESENT VALUE• KNOWLEDGE POINTS
Simulation conceptSimulation concept
Simulation conceptSimulation concept
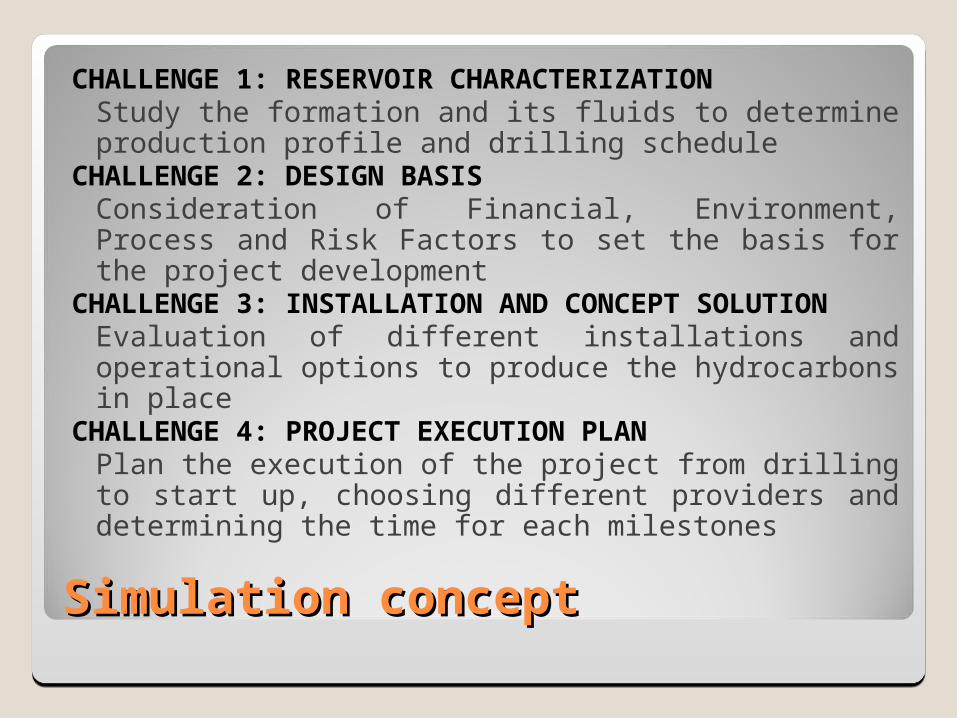
CHALLENGE 1: RESERVOIR CHARACTERIZATIONStudy the formation and its fluids to determine production profile and drilling schedule
CHALLENGE 2: DESIGN BASISConsideration of Financial, Environment, Process and Risk Factors to set the basis for the project development
CHALLENGE 3: INSTALLATION AND CONCEPT SOLUTIONEvaluation of different installations and operational options to produce the hydrocarbons in place
CHALLENGE 4: PROJECT EXECUTION PLANPlan the execution of the project from drilling to start up, choosing different providers and determining the time for each milestones
Simulation conceptSimulation concept
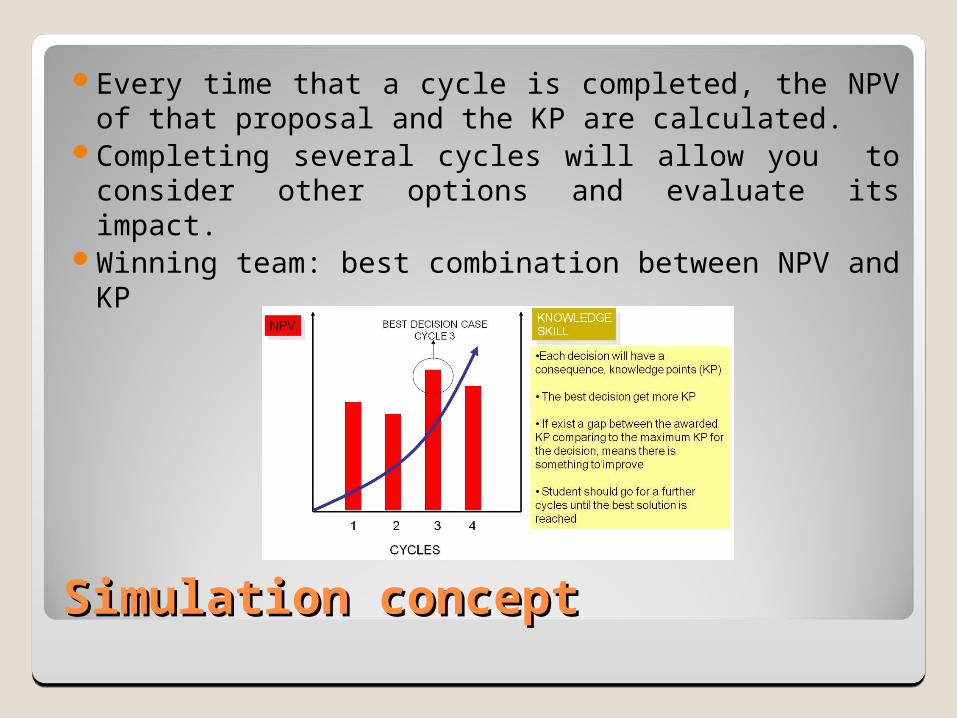
Every time that a cycle is completed, the NPV of that proposal and the KP are calculated.
Completing several cycles will allow you to consider other options and evaluate its impact.
Winning team: best combination between NPV and KP
Learning pointsLearning points
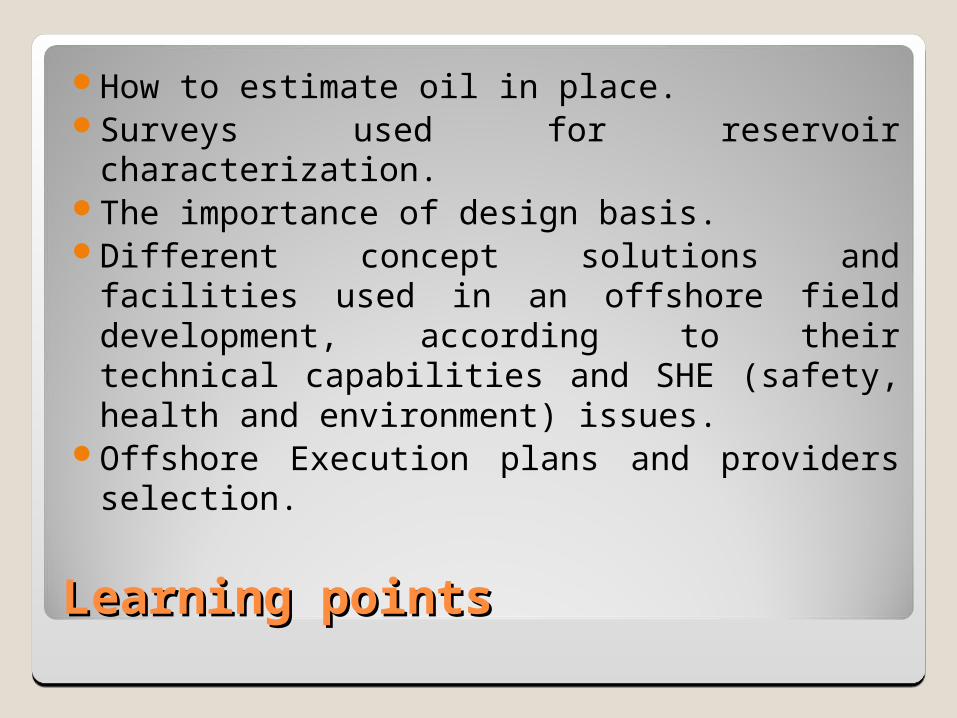
How to estimate oil in place.Surveys used for reservoir characterization.The importance of design basis.Different concept solutions and facilities used in an
offshore field development, according to their technical capabilities and SHE (safety, health and environment) issues.
Offshore Execution plans and providers selection.
StructureStructure
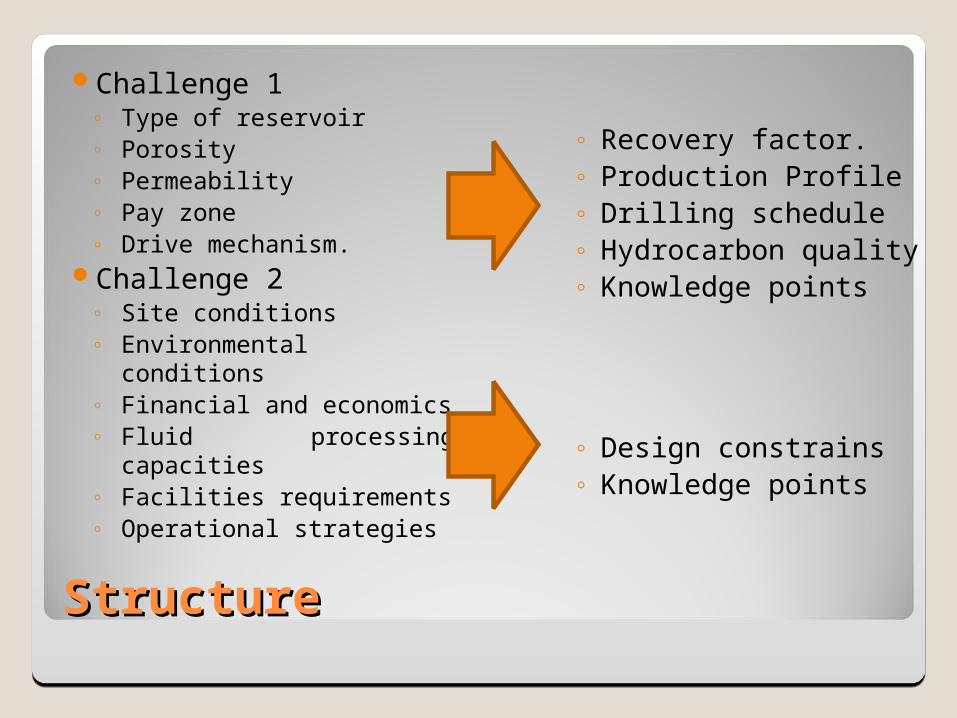
Challenge 1◦ Type of reservoir◦ Porosity◦ Permeability◦ Pay zone◦ Drive mechanism.
Challenge 2◦ Site conditions◦ Environmental conditions◦ Financial and economics◦ Fluid processing capacities◦ Facilities requirements◦ Operational strategies
◦ Recovery factor.◦ Production Profile◦ Drilling schedule◦ Hydrocarbon quality◦ Knowledge points
◦ Design constrains ◦ Knowledge points
StructureStructure
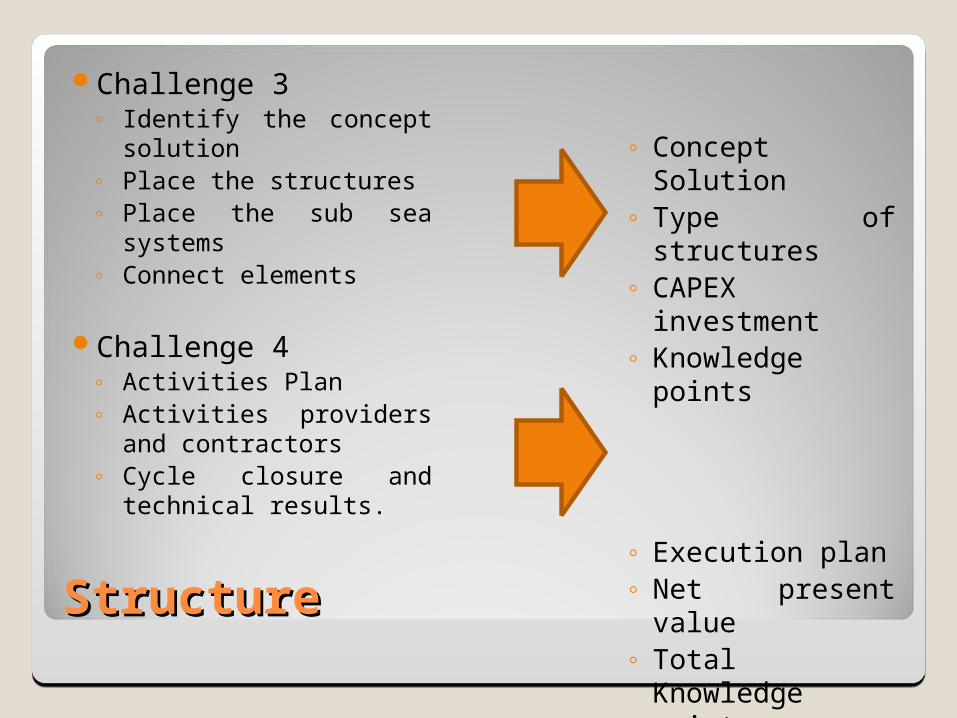
Challenge 3◦ Identify the concept
solution◦ Place the structures◦ Place the sub sea systems◦ Connect elements
Challenge 4◦ Activities Plan ◦ Activities providers and
contractors◦ Cycle closure and
technical results.
◦ Concept Solution◦ Type of structures◦ CAPEX investment◦ Knowledge points
◦ Execution plan◦ Net present value◦ Total Knowledge
points
Challenge 1 Reservoir CharacterizationChallenge 1 Reservoir Characterization
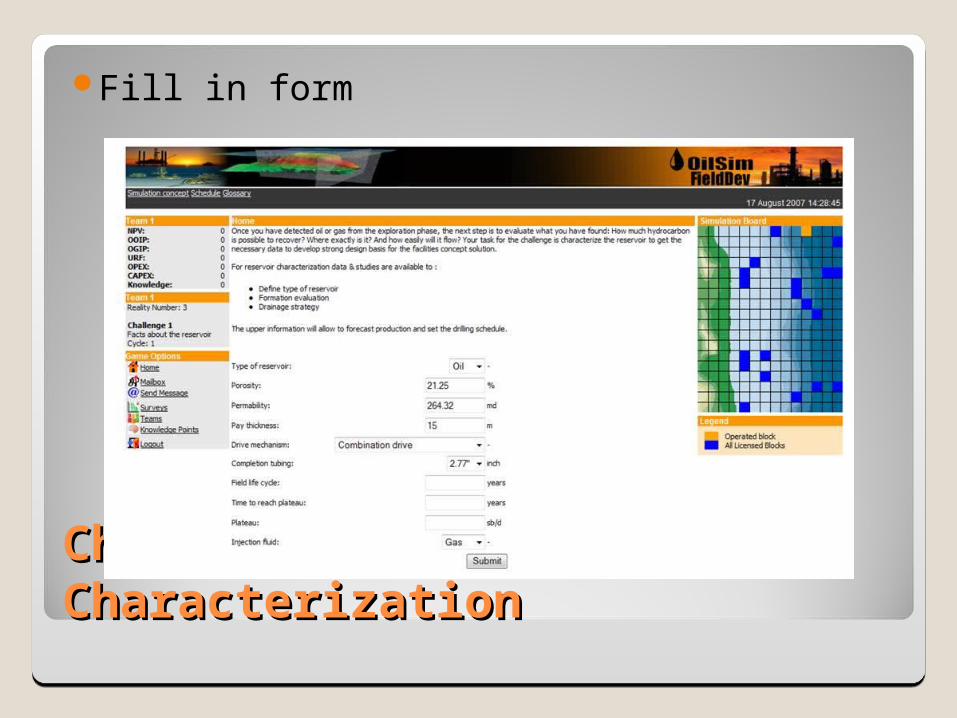
Fill in form
Challenge 1 Reservoir CharacterizationChallenge 1 Reservoir Characterization
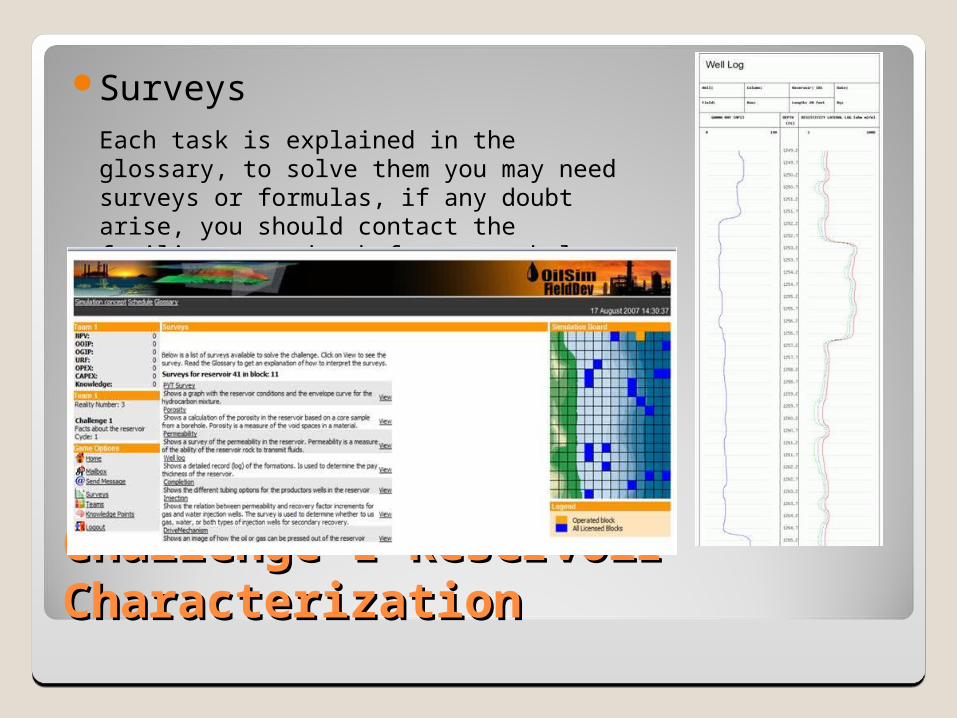
SurveysEach task is explained in the glossary, to solve them you may need surveys or formulas, if any doubt arise, you should contact the facilitator and ask for extra help.

Challenge 1 Reservoir CharacterizationChallenge 1 Reservoir Characterization
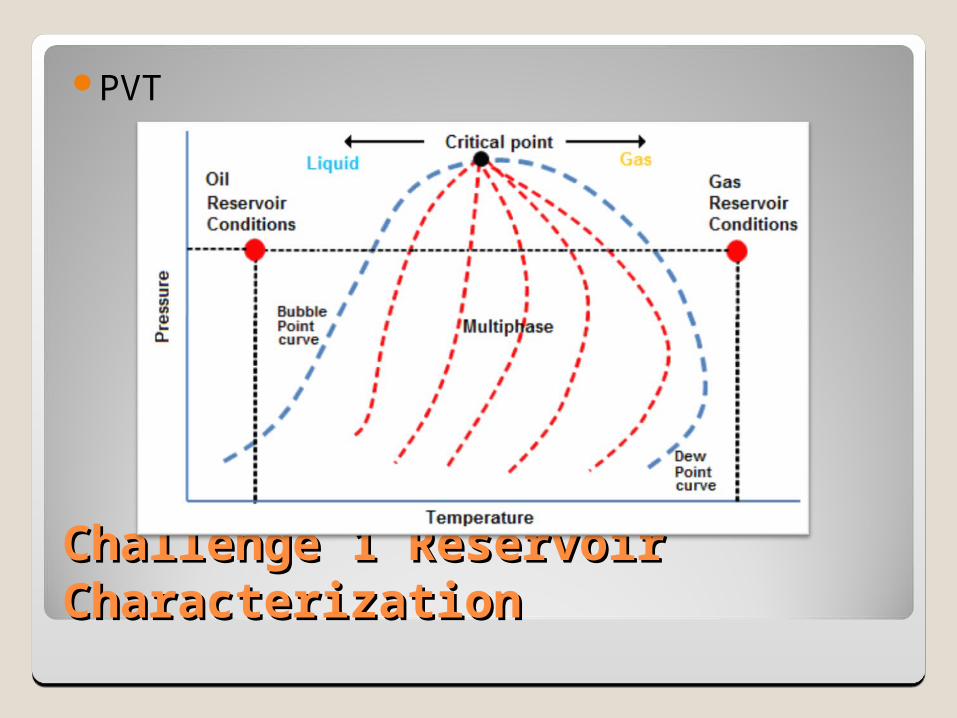
PVT◦Pressure-Volume-Temperature (PVT) that describe the physical property and phase behaviour of a hydrocarbon mixture.
Description of phase behaviour Identification of potential solids problems Measurement of viscosity for fluid mobility GOR, compressibility and shrinkage data for reservoir Recovery estimates Input for EOS and reservoir modelling
Challenge 1 Reservoir CharacterizationChallenge 1 Reservoir Characterization
PVT
Challenge 1 Reservoir CharacterizationChallenge 1 Reservoir Characterization
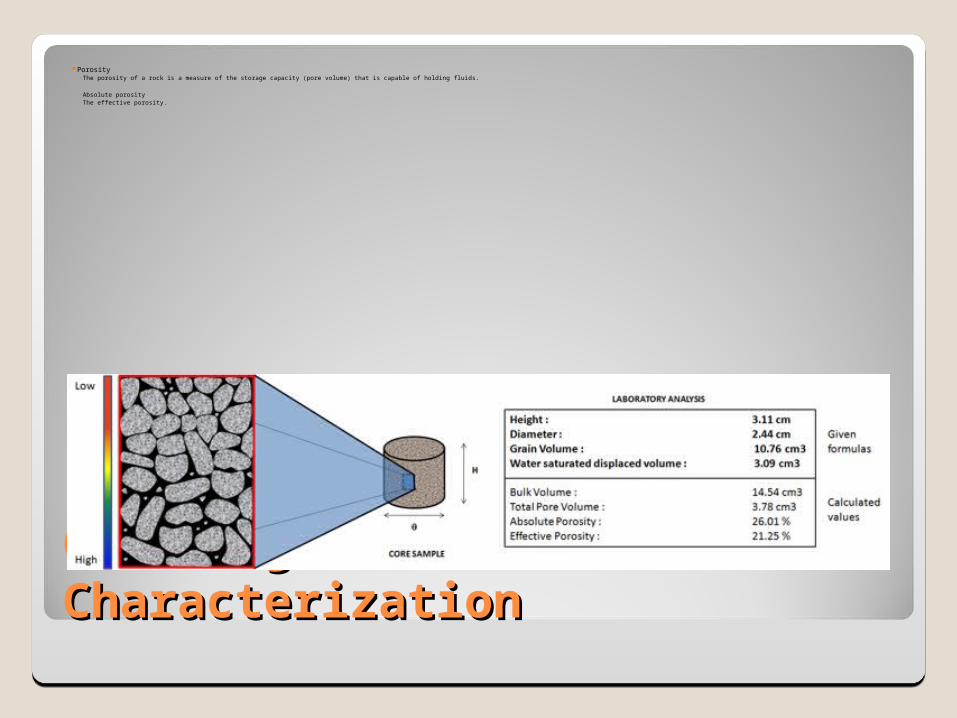
Porosity◦The porosity of a rock is a measure of the storage capacity (pore volume) that is capable of holding fluids.
◦Absolute porosity◦The effective porosity.

Challenge 1 Reservoir CharacterizationChallenge 1 Reservoir Characterization
Porosity
Porosity value Classification [%]◦0–5 insignificant◦5–10 poor◦10–15 fair◦15–20 good◦> 20 excellent
Challenge 1 Reservoir CharacterizationChallenge 1 Reservoir Characterization
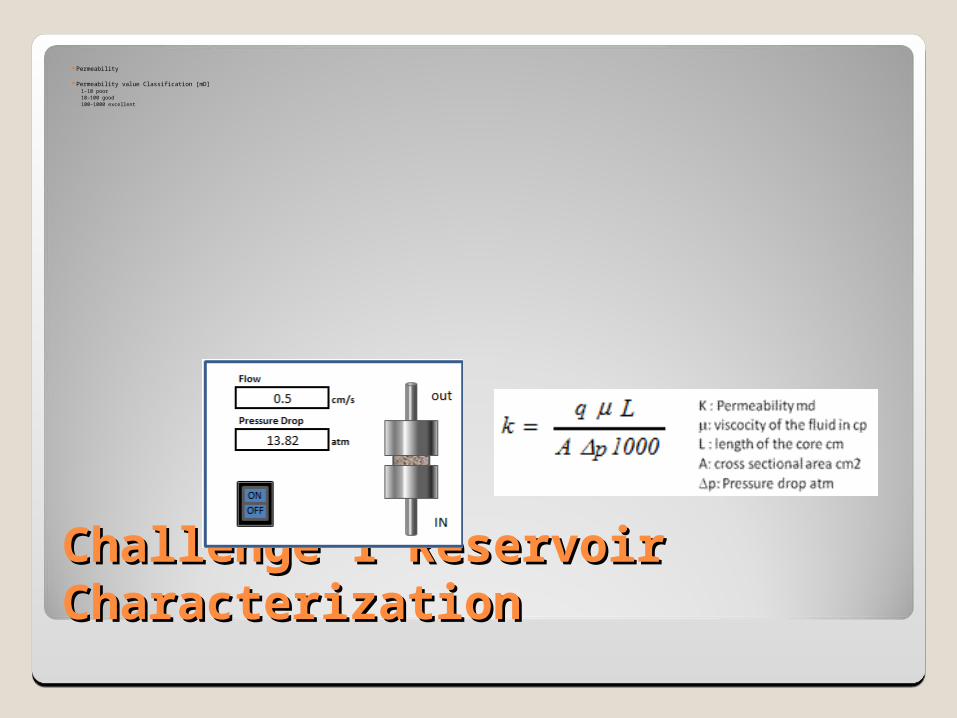
Permeability◦ The permeability is a property that expresses the capacity of the porous medium to transmit fluids.◦ It is a dynamic variable ◦ Measured in millidarcy ◦ The symbol is k. ◦ Greater permeability, in general, corresponds to greater porosity, but this not an absolute rule◦ Permeability is not necessarily the same in different directions. ◦ In general, the horizontal permeability is greater than vertical
Challenge 1 Reservoir CharacterizationChallenge 1 Reservoir Characterization
Permeability
Permeability value Classification [mD]◦1–10 poor◦10–100 good◦100–1000 excellent
Challenge 1 Reservoir CharacterizationChallenge 1 Reservoir Characterization
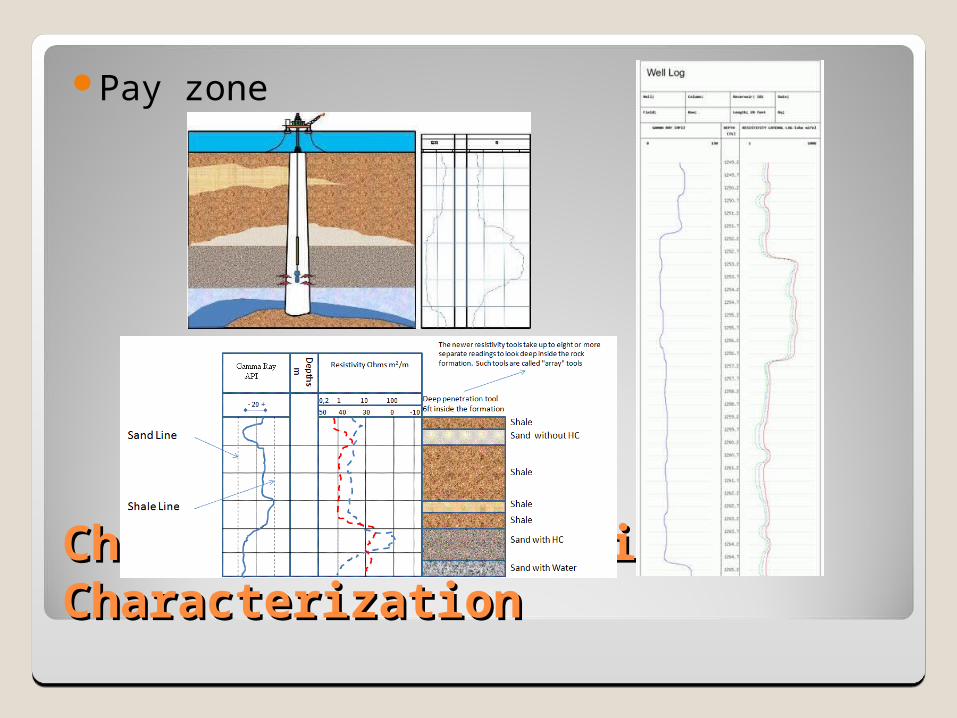
Pay zone◦The pay thickness is a portion of a reservoir that contains economically producible hydrocarbons.
To determine the height of the pay sand, well log are performed with instruments (called sondes) which are lowered down the borehole on armored electrical cable (called a wireline). With different tools to determine several paramenters in OilSim, Gammaray and Resistivity log are the ones to be used
Challenge 1 Reservoir CharacterizationChallenge 1 Reservoir Characterization
Pay zone
Challenge 1 Reservoir CharacterizationChallenge 1 Reservoir Characterization
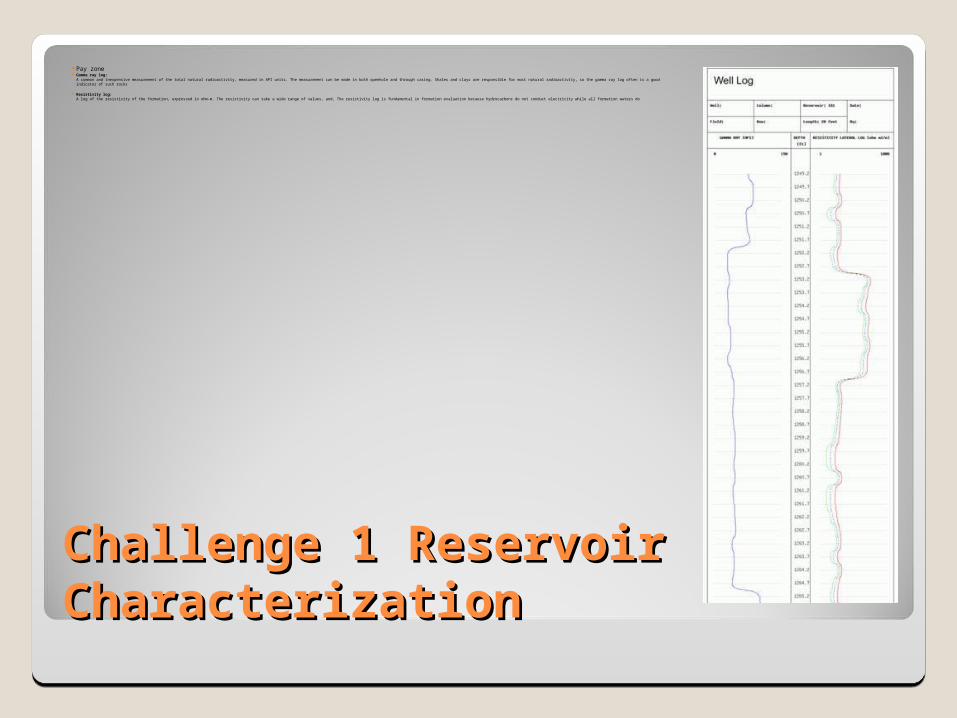
Pay zone Gamma ray log:
A common and inexpensive measurement of the total natural radioactivity, measured in API units. The measurement can be made in both openhole and through casing. Shales and clays are responsible for most natural radioactivity, so the gamma ray log often is a good indicator of such rocks
Resistivity log:A log of the resistivity of the formation, expressed in ohm-m. The resistivity can take a wide range of values, and, The resistivity log is fundamental in formation evaluation because hydrocarbons do not conduct electricity while all formation waters do
Challenge 1 Reservoir CharacterizationChallenge 1 Reservoir Characterization
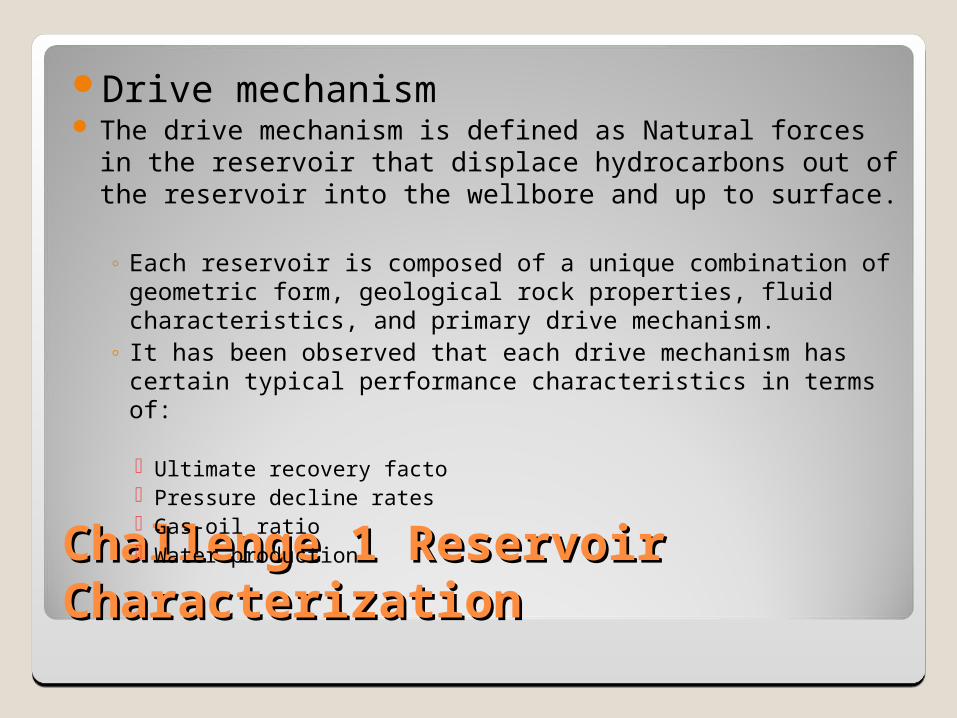
Drive mechanism The drive mechanism is defined as Natural forces in the
reservoir that displace hydrocarbons out of the reservoir into the wellbore and up to surface.
◦ Each reservoir is composed of a unique combination of geometric form, geological rock properties, fluid characteristics, and primary drive mechanism.
◦ It has been observed that each drive mechanism has certain typical performance characteristics in terms of:
Ultimate recovery facto Pressure decline rates Gas-oil ratio Water production
Challenge 1 Reservoir CharacterizationChallenge 1 Reservoir Characterization
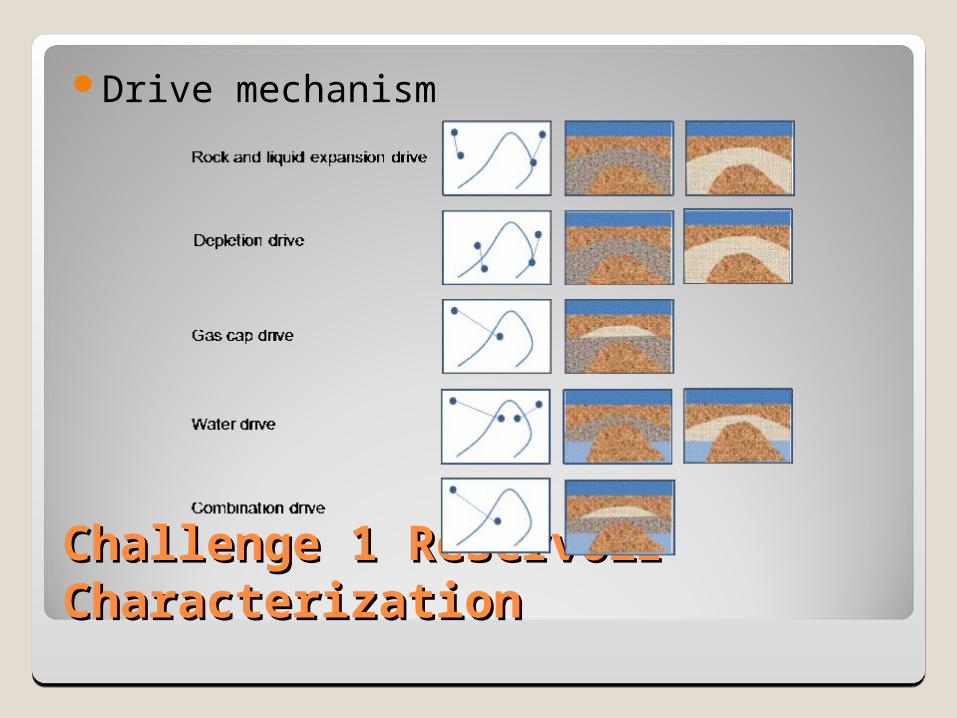
Drive mechanism
Challenge 1 Reservoir CharacterizationChallenge 1 Reservoir Characterization
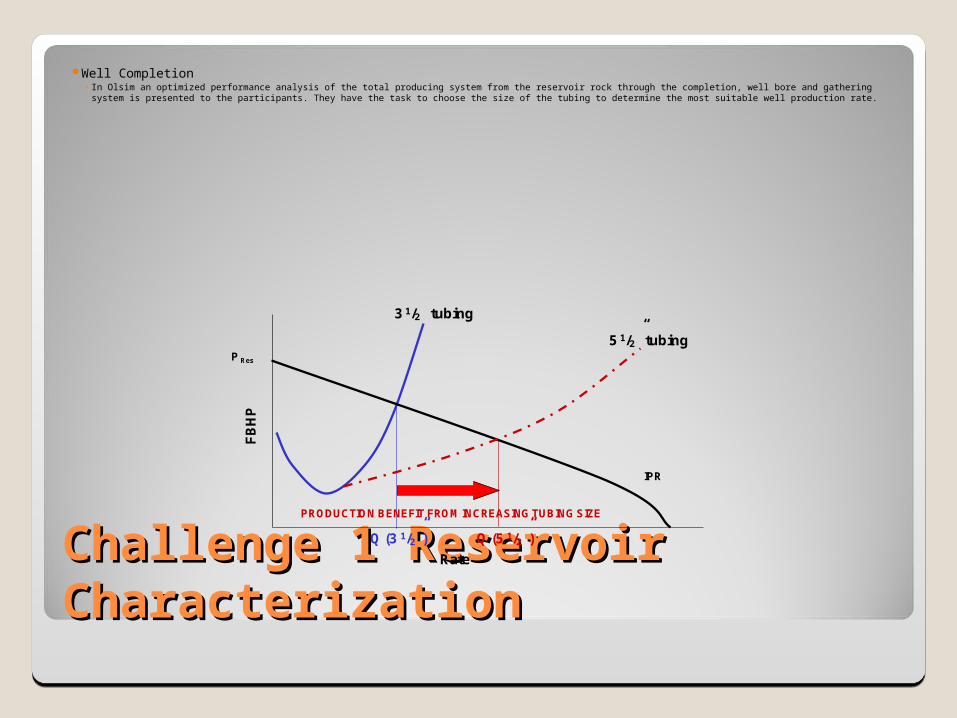
Well Completion◦ In Olsim an optimized performance analysis of the total producing system from the reservoir rock through the completion, well bore and gathering system is
presented to the participants. They have the task to choose the size of the tubing to determine the most suitable well production rate.
3 1/2” tubing
IPR
P Res
PRODUCTION BENEFIT FROM INCREASING TUBING SIZE
5 1/2” tubing
Q (3 1/2”) Q (5 1/2”)
Rate
FB
HP
Challenge 1 Reservoir CharacterizationChallenge 1 Reservoir Characterization
Well Completion
◦ The tubing size will affect the following among others:
Less or more production
Well intervention due to sand production
Excessive pressure drops can generate tubing failures
Challenge 1 Reservoir CharacterizationChallenge 1 Reservoir Characterization
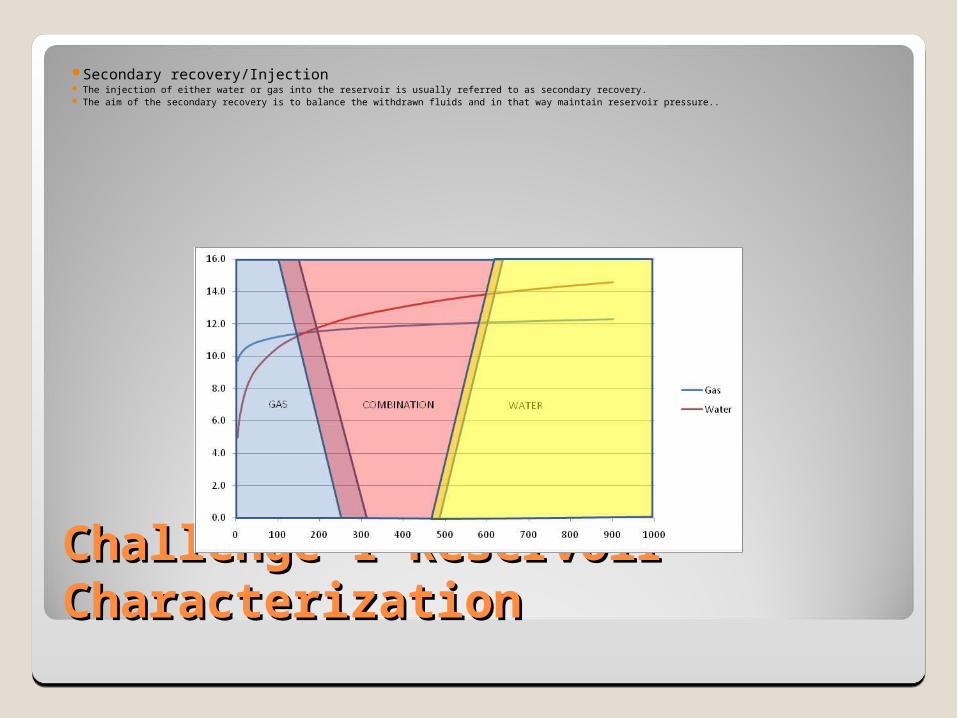
Secondary recovery/Injection The injection of either water or gas into the reservoir is usually referred to as secondary recovery. The aim of the secondary recovery is to balance the withdrawn fluids and in that way maintain reservoir pressure..

Challenge 1 Reservoir CharacterizationChallenge 1 Reservoir Characterization
Secondary recovery/Injection◦ In general water flooding generates an increment in the recovery factor greater than gas injection.
◦ If the formation’s permeability is low water injection rate will be low as well, so gas injection is preferred
◦ If brine has to be disposed water injection will become useful to reinject it.
◦ Availability and marketability of the gas have to be considered if this fluid is worth to be use in a reservoir maintenance program.
◦ Gas Injector wells are usually less in quantity comparing to water injectors, but water pumping systems are cheaper than gas compression systems.
Challenge 1 Reservoir CharacterizationChallenge 1 Reservoir Characterization
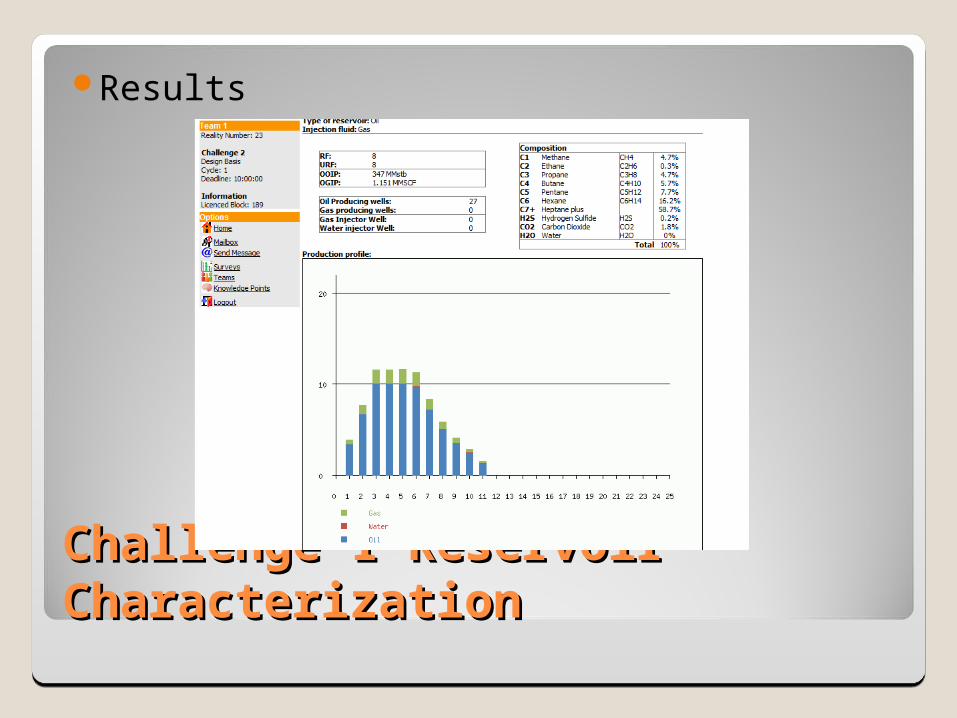
Results
Challenge 1 Reservoir CharacterizationChallenge 1 Reservoir Characterization
Results
Challenge 1 Reservoir CharacterizationChallenge 1 Reservoir Characterization
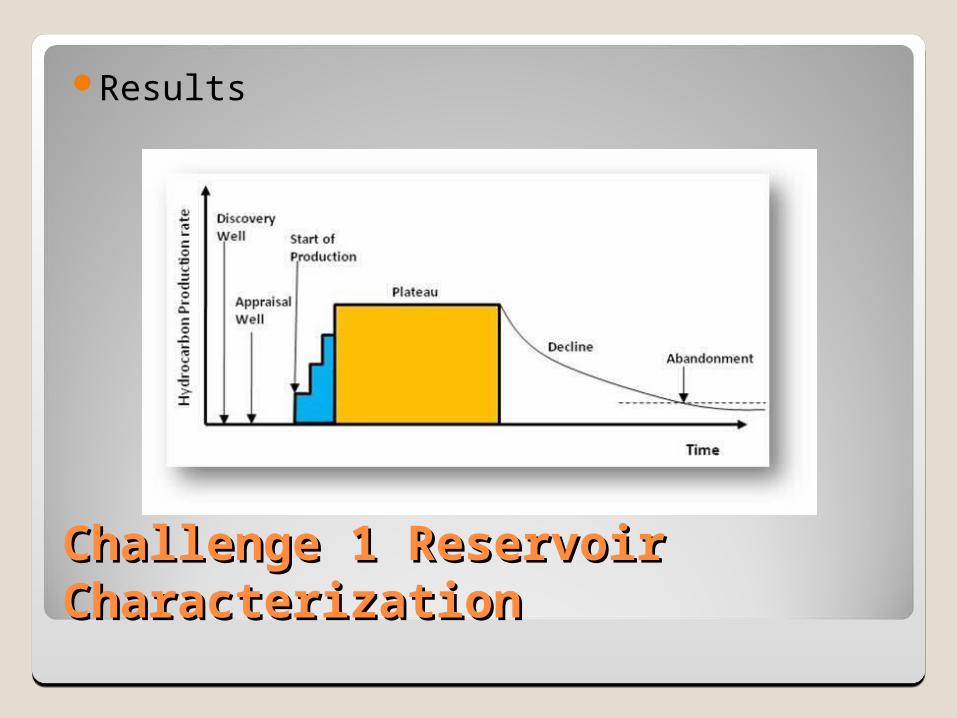
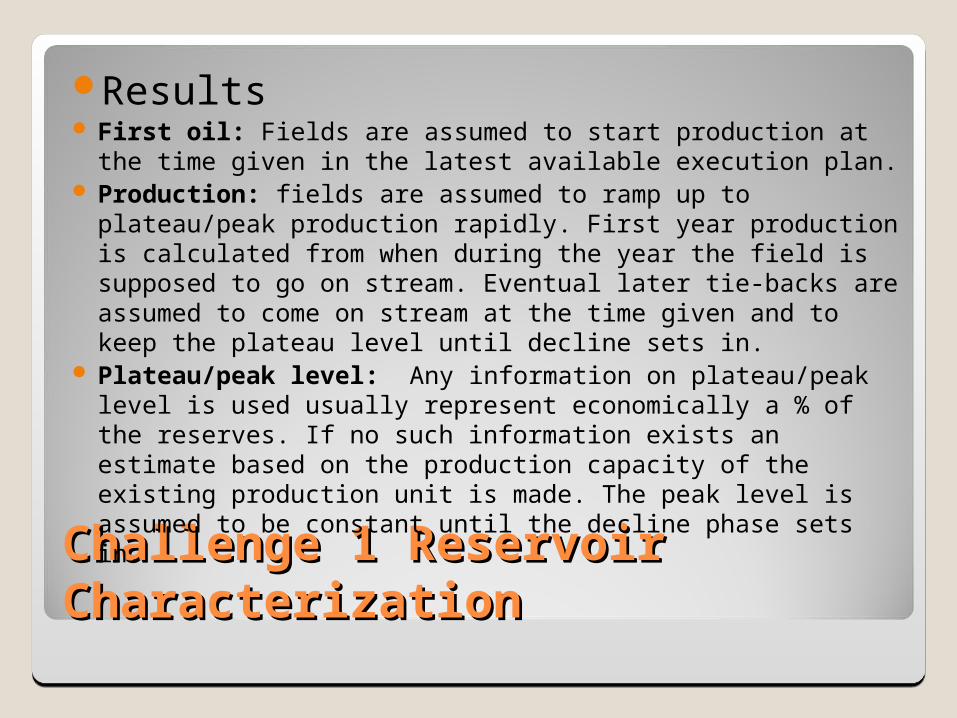
Results First oil: Fields are assumed to start production at the
time given in the latest available execution plan. Production: fields are assumed to ramp up to
plateau/peak production rapidly. First year production is calculated from when during the year the field is supposed to go on stream. Eventual later tie-backs are assumed to come on stream at the time given and to keep the plateau level until decline sets in.
Plateau/peak level: Any information on plateau/peak level is used usually represent economically a % of the reserves. If no such information exists an estimate based on the production capacity of the existing production unit is made. The peak level is assumed to be constant until the decline phase sets in.
Challenge 1 Reservoir CharacterizationChallenge 1 Reservoir Characterization
Results Decline: The decline phase sets in when prior production
plus production during decline exceeds the best reserve estimate with 10 per cent. The decline is assumed to be about 20 per cent annually, and this illustrates the operators will to keep the fields at plateau levels as long as possible.
Reserves : Numbers on proven plus probable reserves are used whenever the information is available. If information on oil in place is given, the most optimistic estimate of the recovery factor from the operator is used. Eventual upsides on reserves are included.
Challenge 2 Design basisChallenge 2 Design basis
Challenge 2 Design basisChallenge 2 Design basis
The design basis is one of the most important document in an engineer design.
It will provide all necessary information to avoid misunderstanding between the technical departments involved.
It will provide all the technical boundaries and capabilities for the installation design.
Challenge 2 Design basisChallenge 2 Design basis
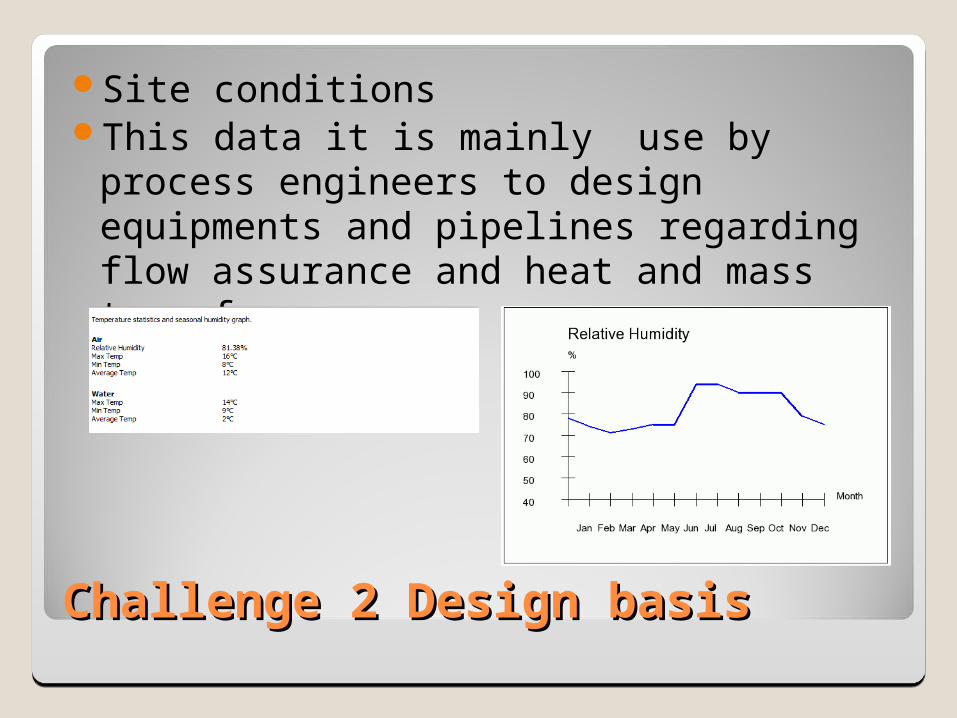
Site conditionsThis data it is mainly use by process
engineers to design equipments and pipelines regarding flow assurance and heat and mass transfer.
Challenge 2 Design basisChallenge 2 Design basis
Environmental conditionsTo define the environmental condition of the
place were the development will take place, in order to choose the most suitable installation to face potential hurricane, earthquakes risk, among other factors.
Challenge 2 Design basisChallenge 2 Design basis
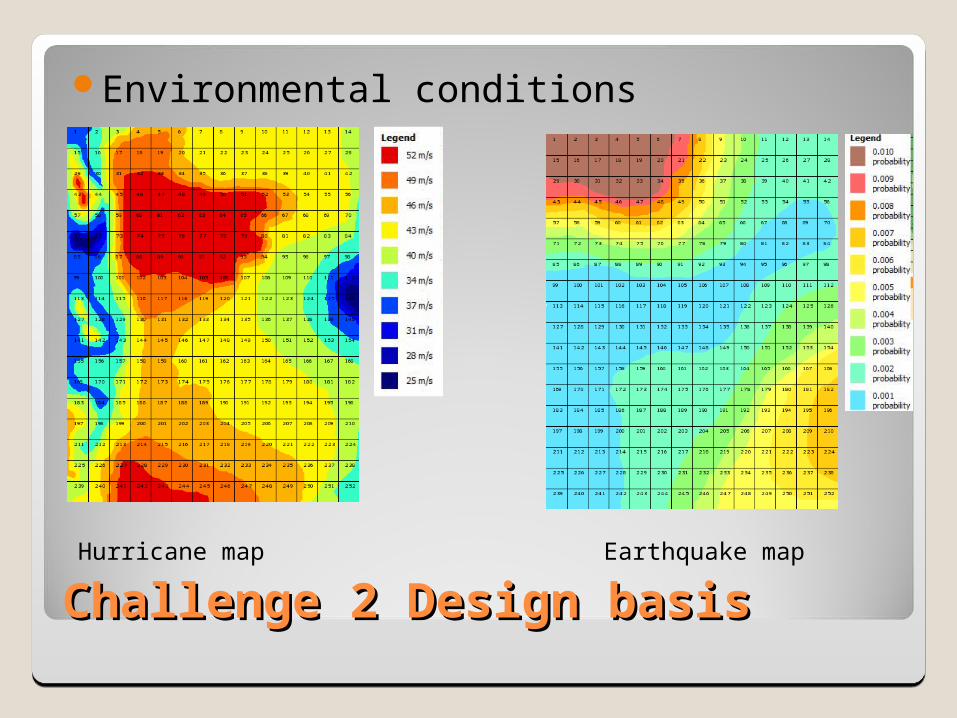
Environmental conditions
Hurricane map Earthquake map
Challenge 2 Design basisChallenge 2 Design basis
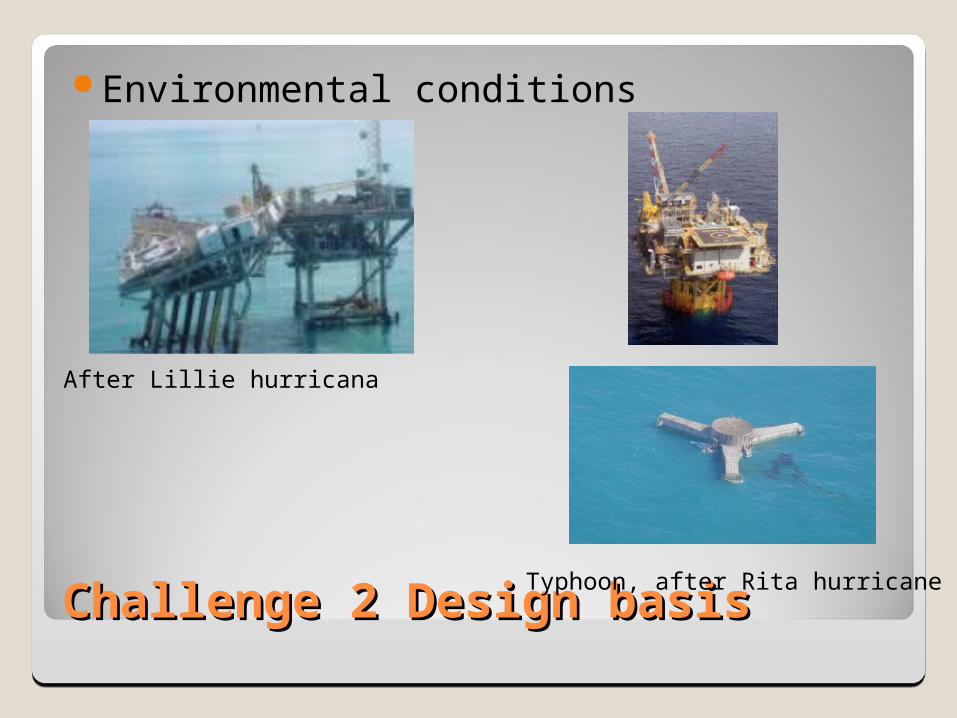
Environmental conditions
Typhoon, after Rita hurricane
After Lillie hurricana

Challenge 2 Design basisChallenge 2 Design basis
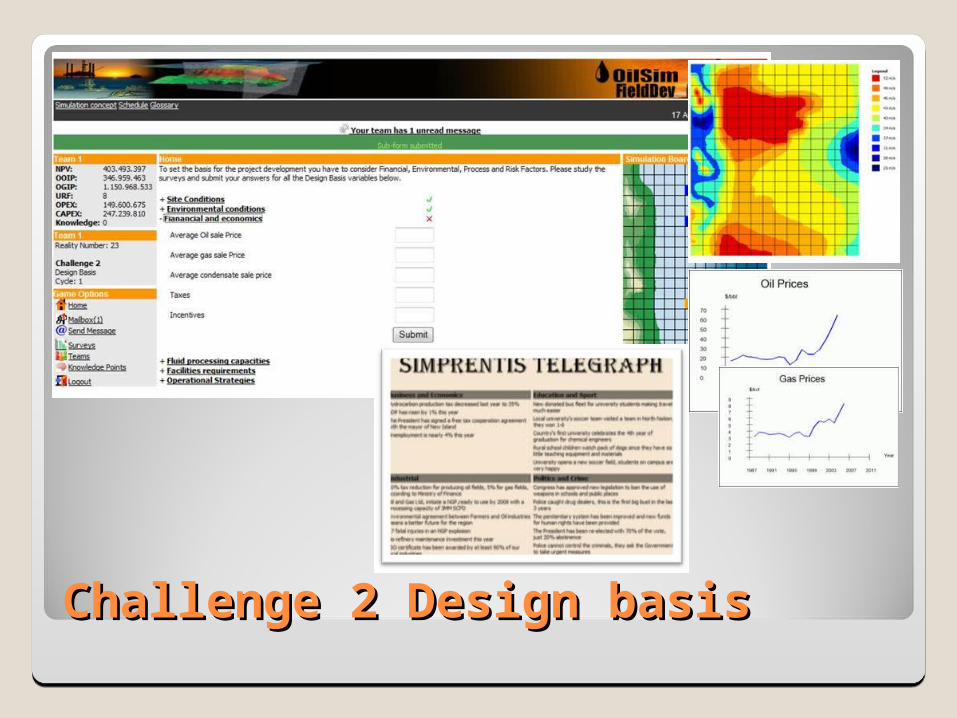
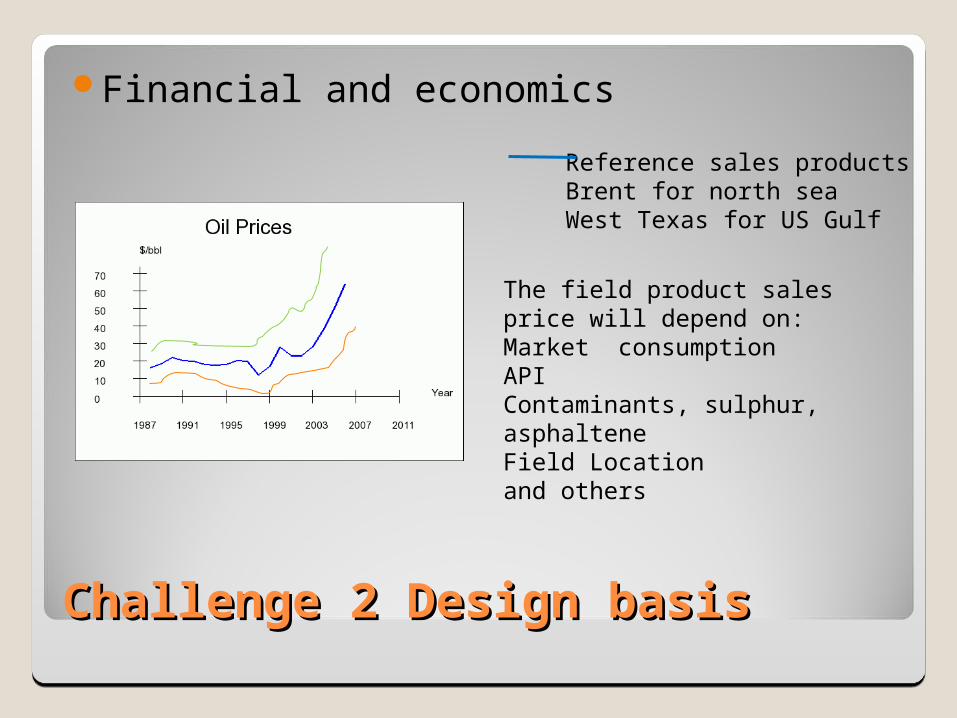
Financial and economicsIn this part it will be established all the premises to
perform an economical evaluation of the development proposals.◦ Product for sale◦ Sales prices◦ Taxes◦ Investment incentives
The surveys to be used are named Market statistics, and then you should read the newspaper from time to time to find out more data
Challenge 2 Design basisChallenge 2 Design basis
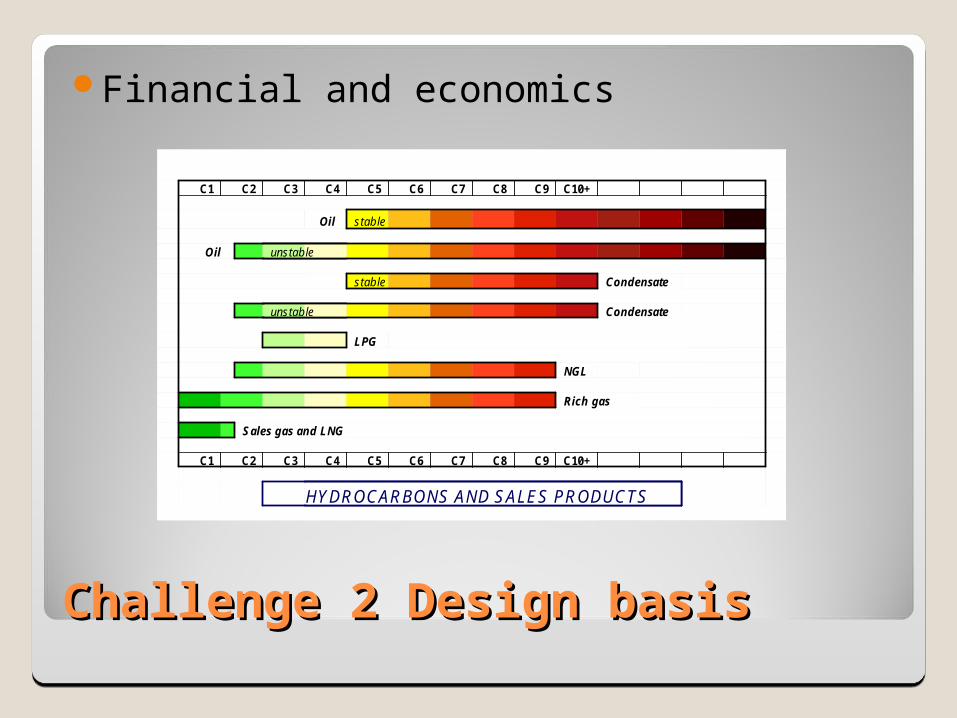
Financial and economics
C1 C2 C3 C4 C5 C6 C7 C8 C9 C10+
Oil stable
Oil unstable
stable Condensate
unstable Condensate
LPG
NGL
Rich gas
Sales gas and LNG
C1 C2 C3 C4 C5 C6 C7 C8 C9 C10+
HYDROCARBONS AND SALES PRODUCTS
Challenge 2 Design basisChallenge 2 Design basis
Financial and economics
Reference sales productsBrent for north seaWest Texas for US Gulf
The field product sales price will depend on:Market consumptionAPIContaminants, sulphur, asphalteneField Locationand others
Challenge 2 Design basisChallenge 2 Design basis
Fluid processing capacities and facilities
Will determine the process equipment to process and conditioning the hydrocarbons.
You should look at the result in ch1, and existing facilities surveys
Challenge 2 Design basisChallenge 2 Design basis
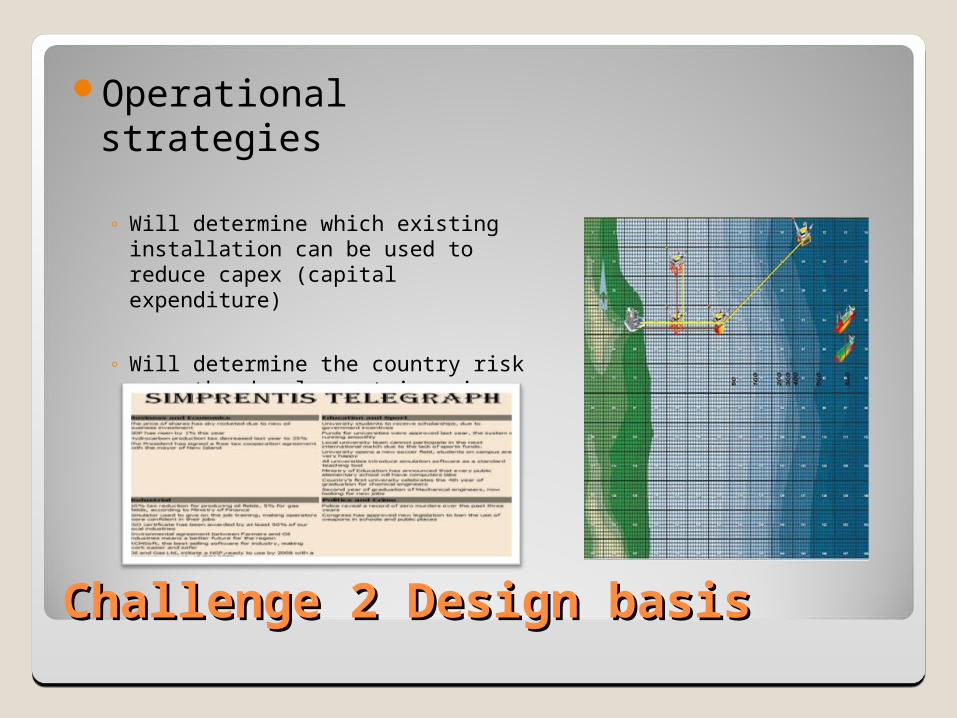
Operational strategies
◦ Will determine which existing installation can be used to reduce capex (capital expenditure)
◦ Will determine the country risk were the development is going to be
carried out.
Challenge 3 Concept solutionChallenge 3 Concept solution
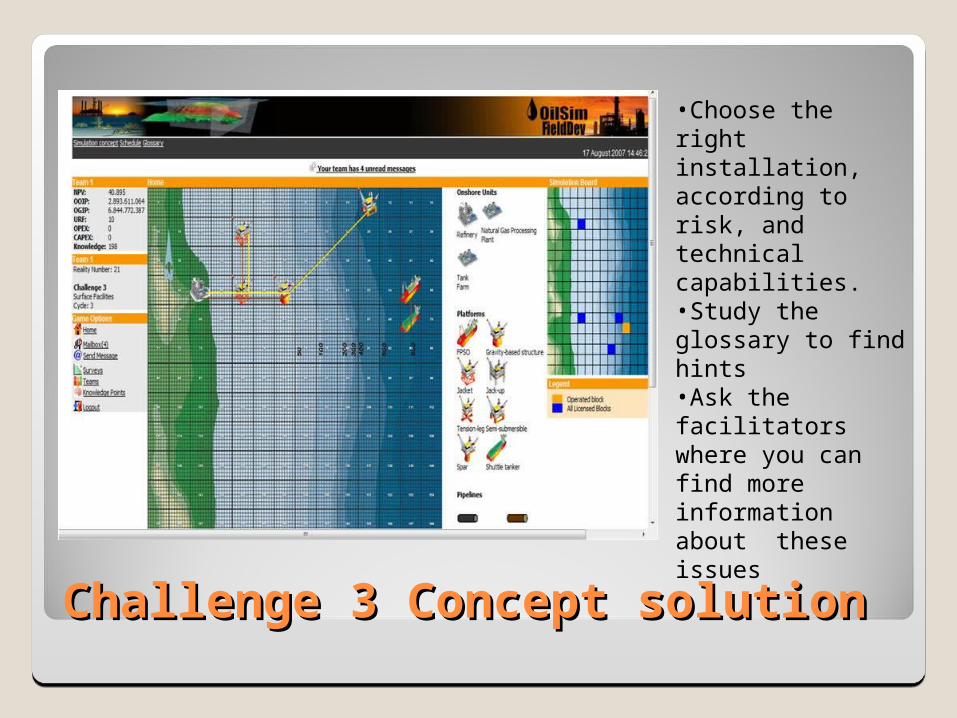
•Choose the right installation, according to risk, and technical capabilities.•Study the glossary to find hints•Ask the facilitators where you can find more information about these issues
Challenge 3 Concept solutionChallenge 3 Concept solution
The concept solution will depend on many factors:
Environmental conditions Operational criteria Limited availability of construction sites. Subjective preference of an owner/operator under
certain circumstance like country risk and operational experience.
Challenge 3 Concept solutionChallenge 3 Concept solution
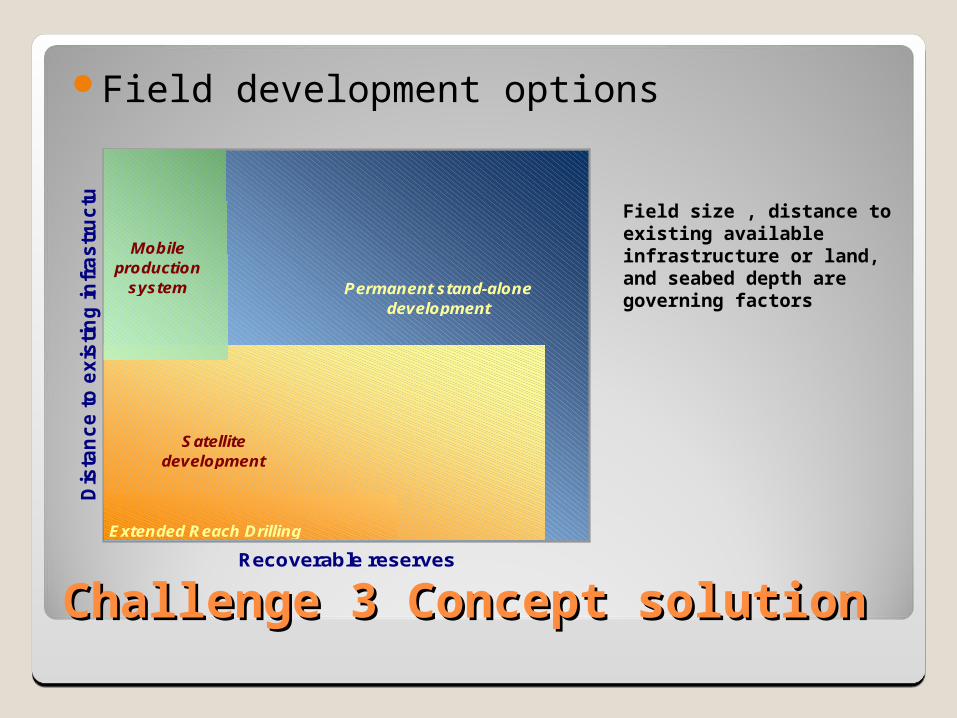
Field development options
Recoverable reserves
Dis
tan
ce
to
ex
isti
ng
in
fra
str
uc
ture
Permanent stand-alonedevelopment
Mobile production
system
Satellitedevelopment
Extended Reach Drilling
Field size , distance to existing available infrastructure or land, and seabed depth are governing factors
Challenge 3 Concept solutionChallenge 3 Concept solution
In a field development, the structure for use offshore are constructed as a drilling platform and will also be used as a production platform.
The structure will act as a stabilizer and conditioning for the well production above the ocean floor.
Flowline risers, helicopter landing pads, and mooring facilities for crew boats and supply boats are necessities that must be supported by the structure.
Challenge 3 Concept solutionChallenge 3 Concept solution
Fixed Platforms: ◦ Sit on the sea floor.◦ They are held in place either by the total weight of the
structure or by steel piles driven into the seabed and attached to the structure.
◦ The group include: jackets, jackups, gravity based structures, compliant towers and its variations.
Challenge 3 Concept solutionChallenge 3 Concept solution
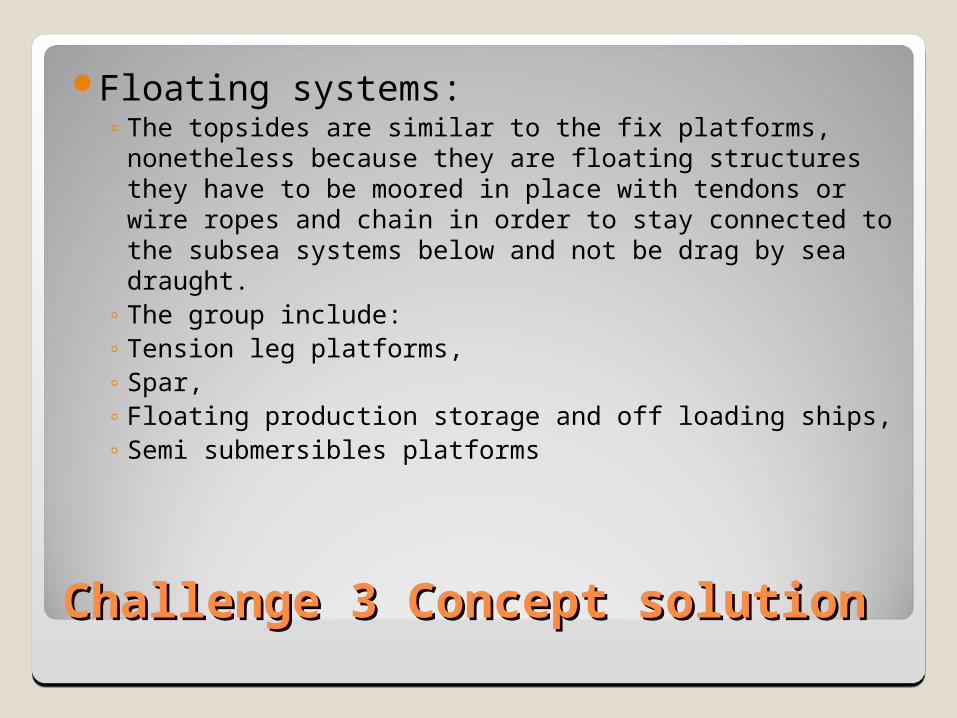
Floating systems: ◦ The topsides are similar to the fix platforms, nonetheless
because they are floating structures they have to be moored in place with tendons or wire ropes and chain in order to stay connected to the subsea systems below and not be drag by sea draught.
◦ The group include: ◦ Tension leg platforms, ◦ Spar, ◦ Floating production storage and off loading ships, ◦ Semi submersibles platforms
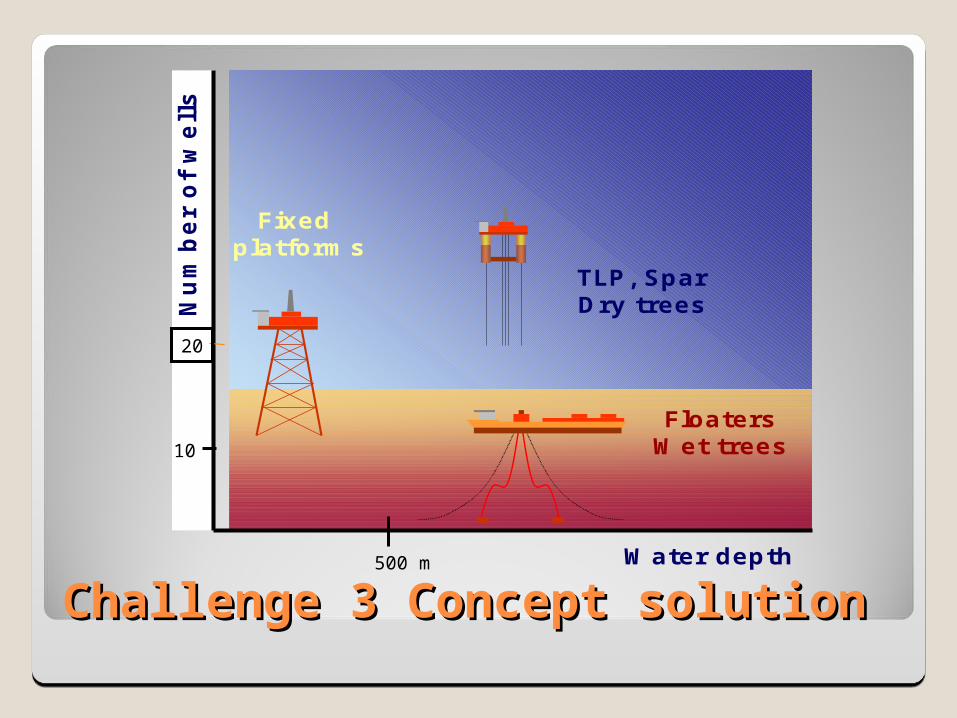
Challenge 3 Concept solutionChallenge 3 Concept solutionWater depth
Nu
mb
er
of
wells
Fixed platforms
FloatersWet trees
TLP, SparDry trees
10
20
500 m
Challenge 3 Concept solutionChallenge 3 Concept solution
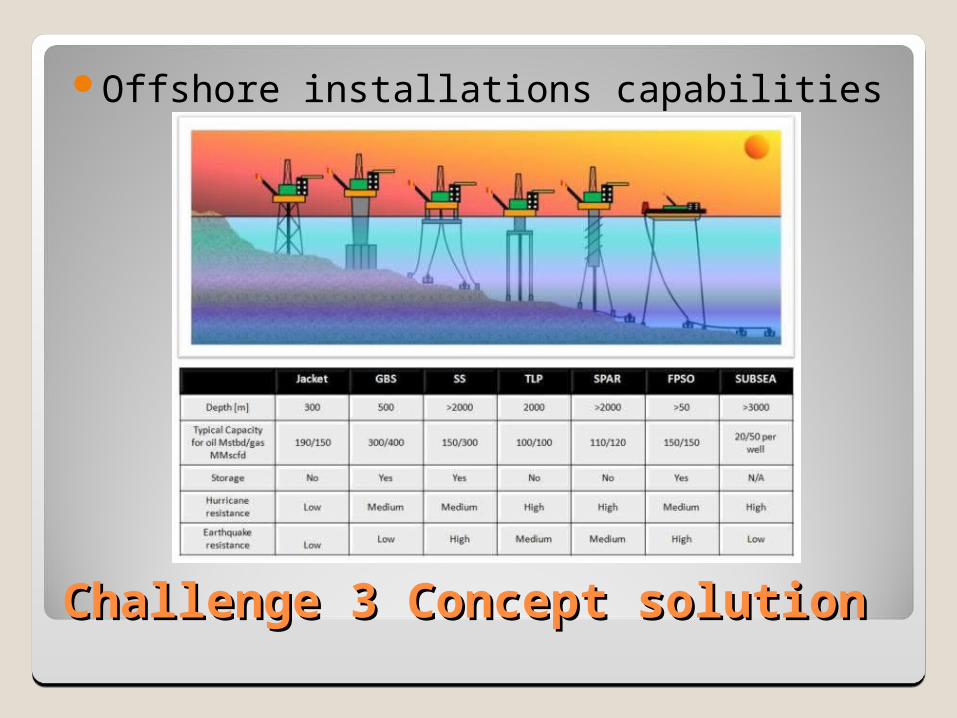
Offshore installations capabilities
Challenge 3 Concept solutionChallenge 3 Concept solution
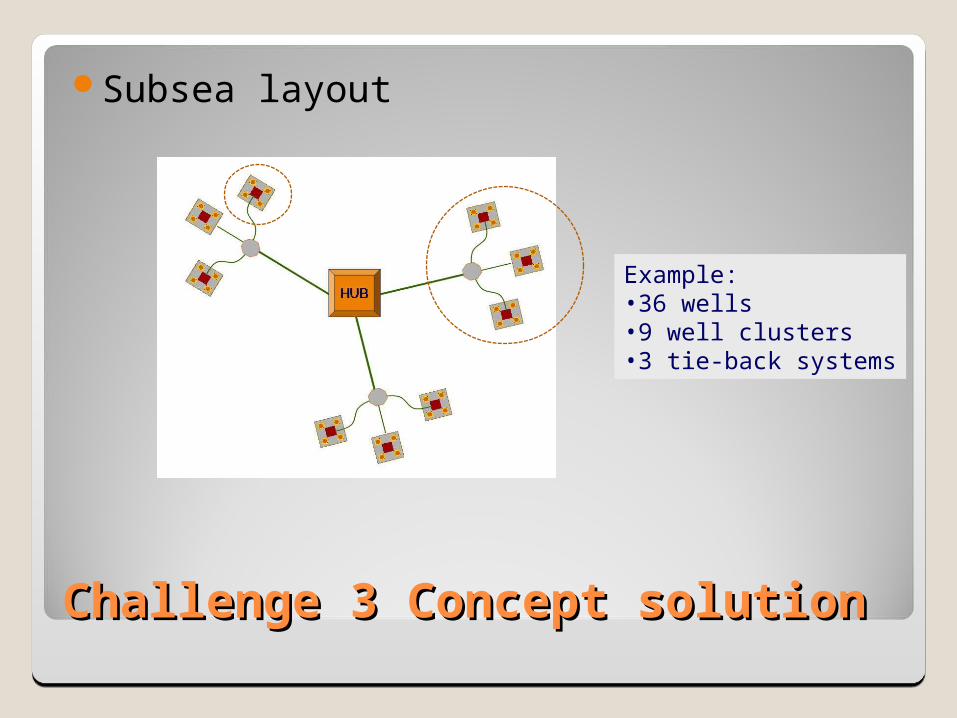
Subsea layout
Example:•36 wells•9 well clusters•3 tie-back systems
Challenge 3 Concept solutionChallenge 3 Concept solution
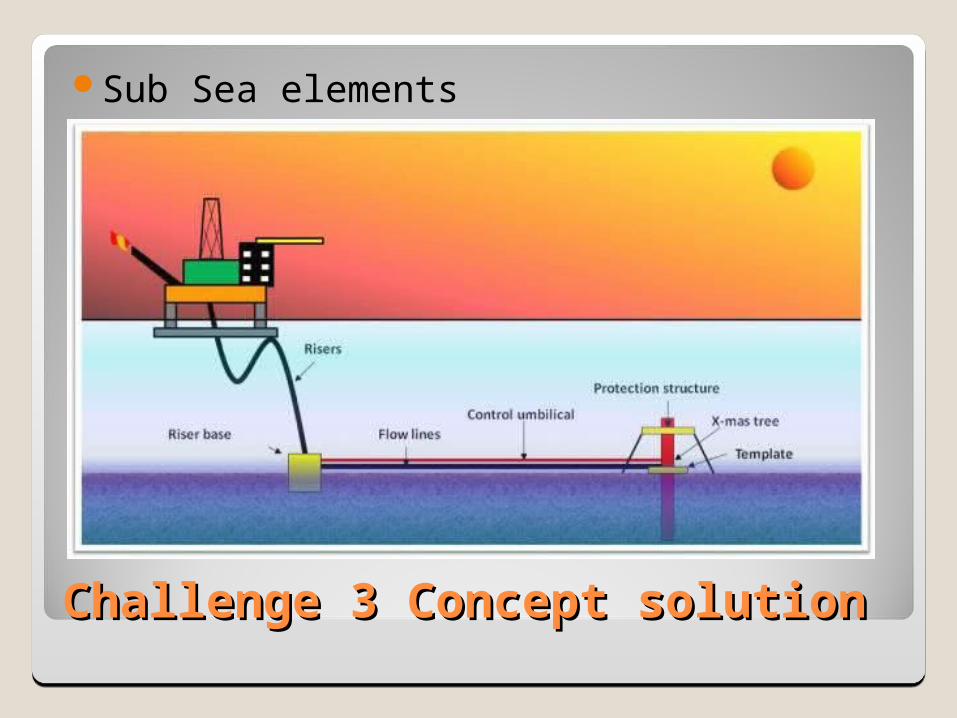
Sub Sea elements
Challenge 3 Concept solutionChallenge 3 Concept solution
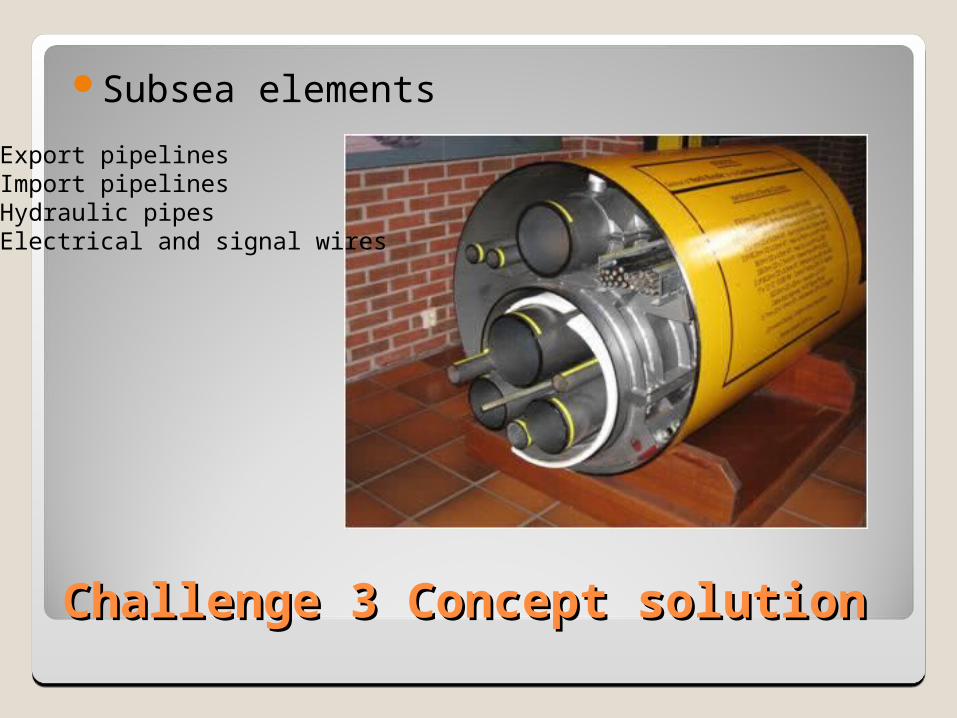
Subsea elements
Export pipelinesImport pipelinesHydraulic pipesElectrical and signal wires
Challenge 3 Concept solutionChallenge 3 Concept solution
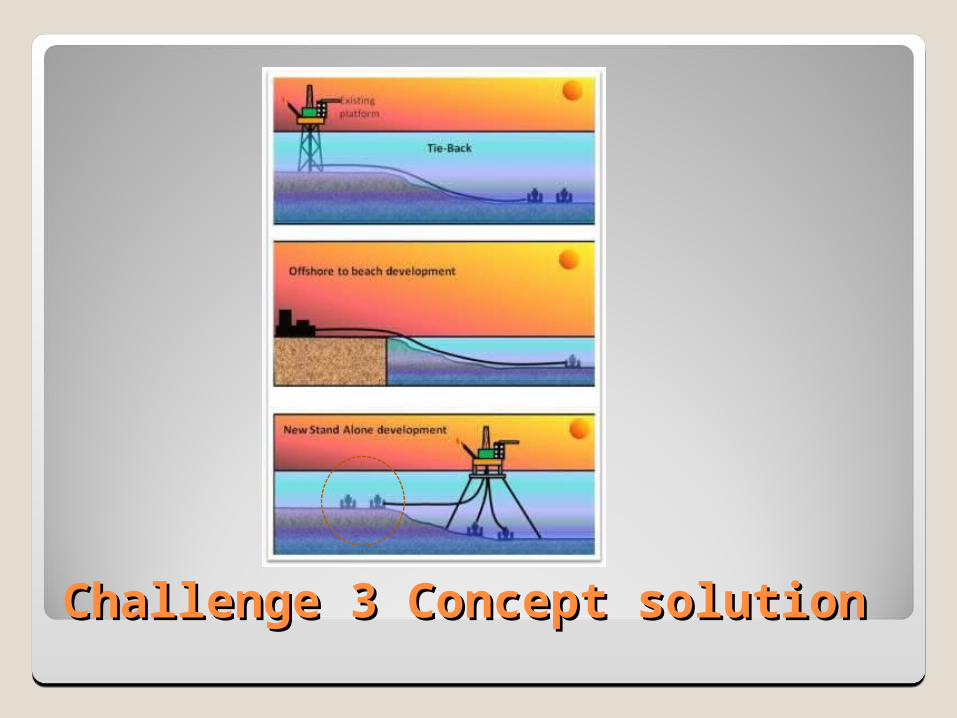
Development option Tie Back to an existing platform:
The investment is reduced using the spare capacity in the existing platform. It is a very suitable option for small developments.
Offshore to beach development:In this case onshore facilities are available, multiphase
production can be transported to the shore to process it. It is a good option to reduce capex when distances to shore are short. New Stand alone development:
When there are no existing installation and the recoverable reserves are large or the distance to shore is too far, New stand alone development can be considered using the platform that is most suitable for the surrounding conditions.
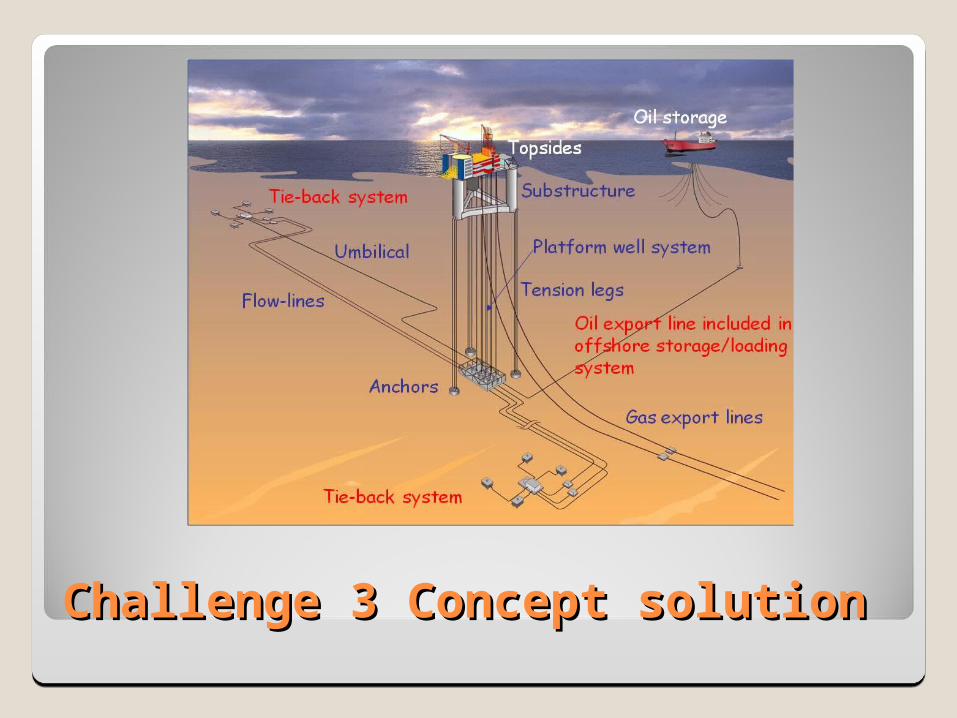
Challenge 3 Concept solutionChallenge 3 Concept solution
Challenge 3 Concept solutionChallenge 3 Concept solution
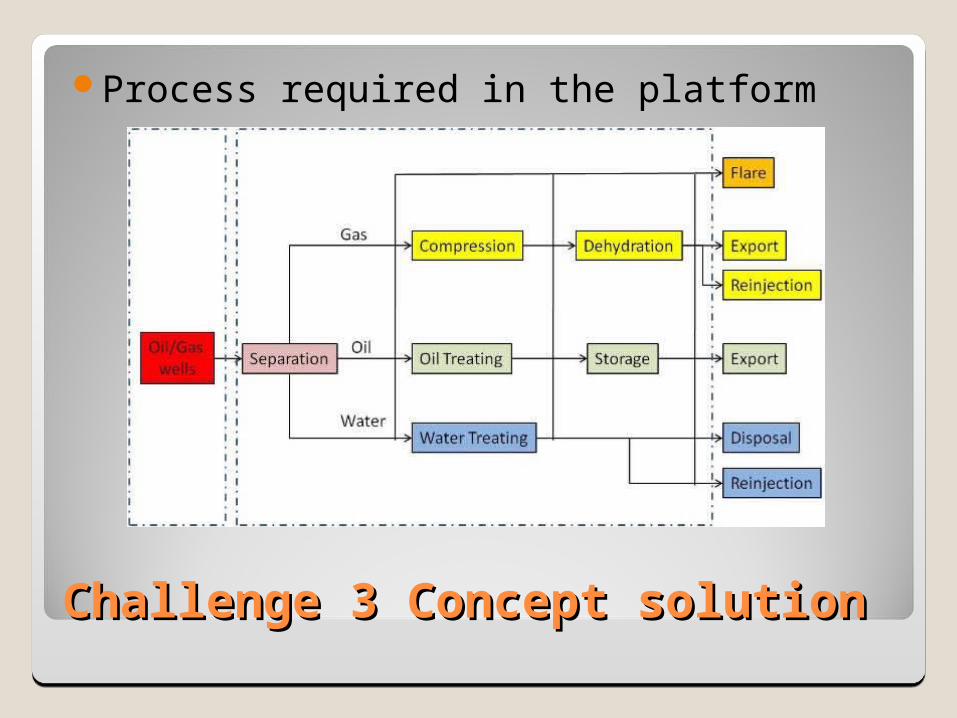
Process required in the platform
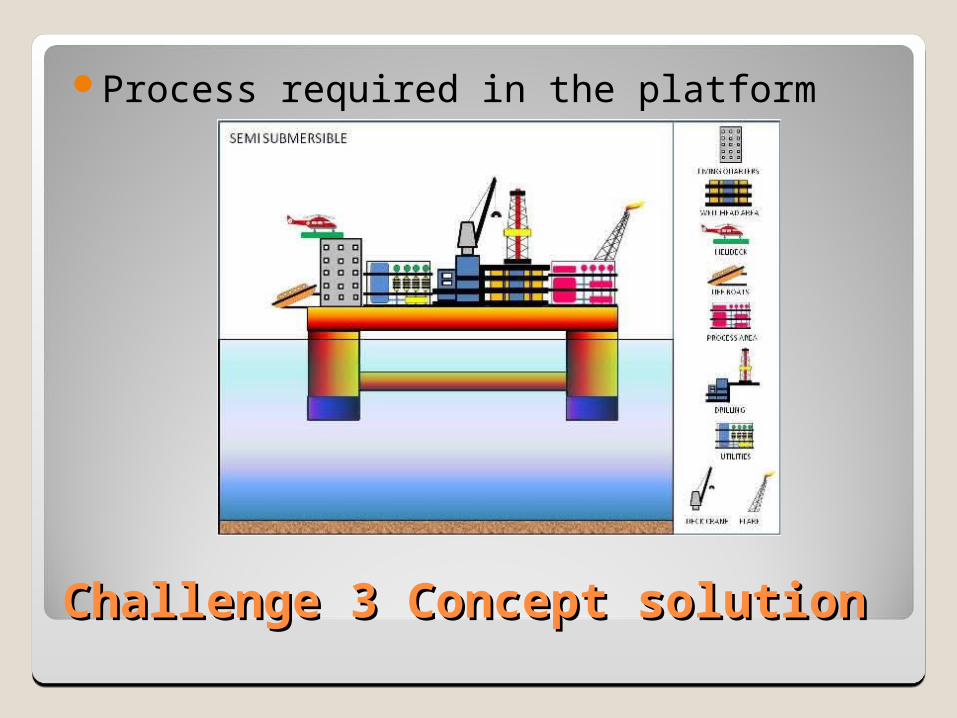
Challenge 3 Concept solutionChallenge 3 Concept solution
Process required in the platform
Challenge 3 Concept solutionChallenge 3 Concept solution
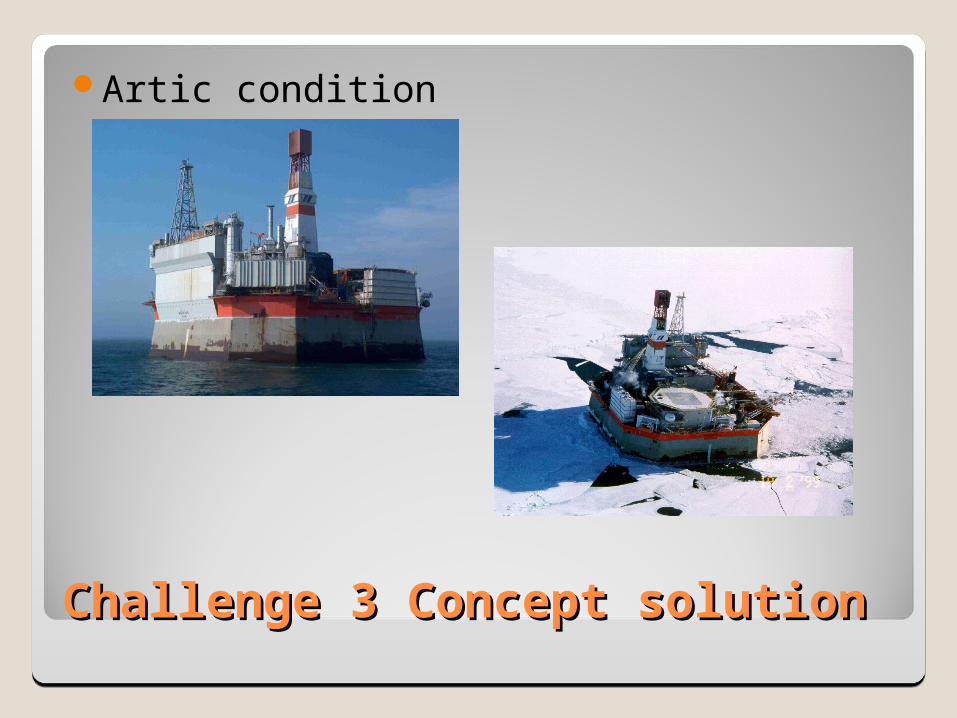
Challenge 3 Concept solutionChallenge 3 Concept solution
Artic condition
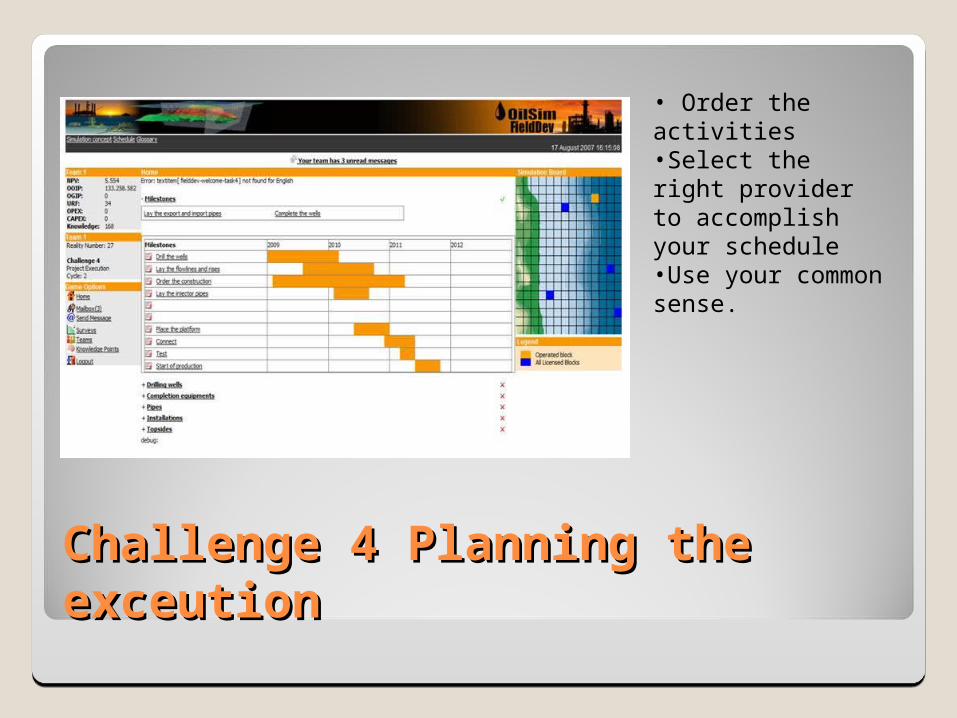
Challenge 4 Planning the exceutionChallenge 4 Planning the exceution
• Order the activities•Select the right provider to accomplish your schedule•Use your common sense.
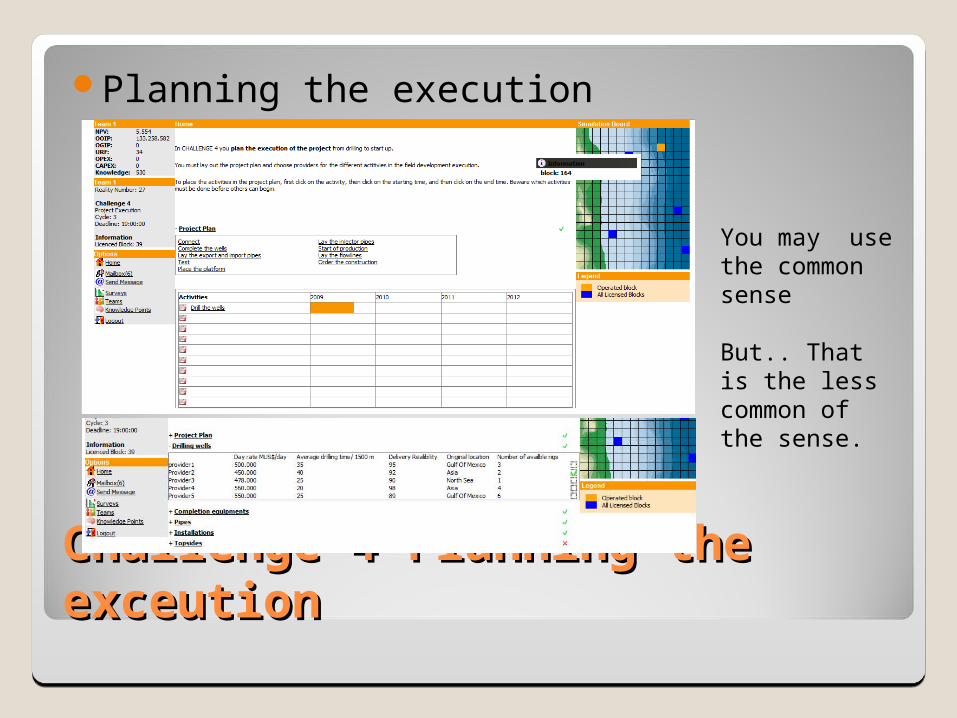
Challenge 4 Planning the exceutionChallenge 4 Planning the exceution
Planning the execution
You may use the common sense
But.. That is the less common of the sense.
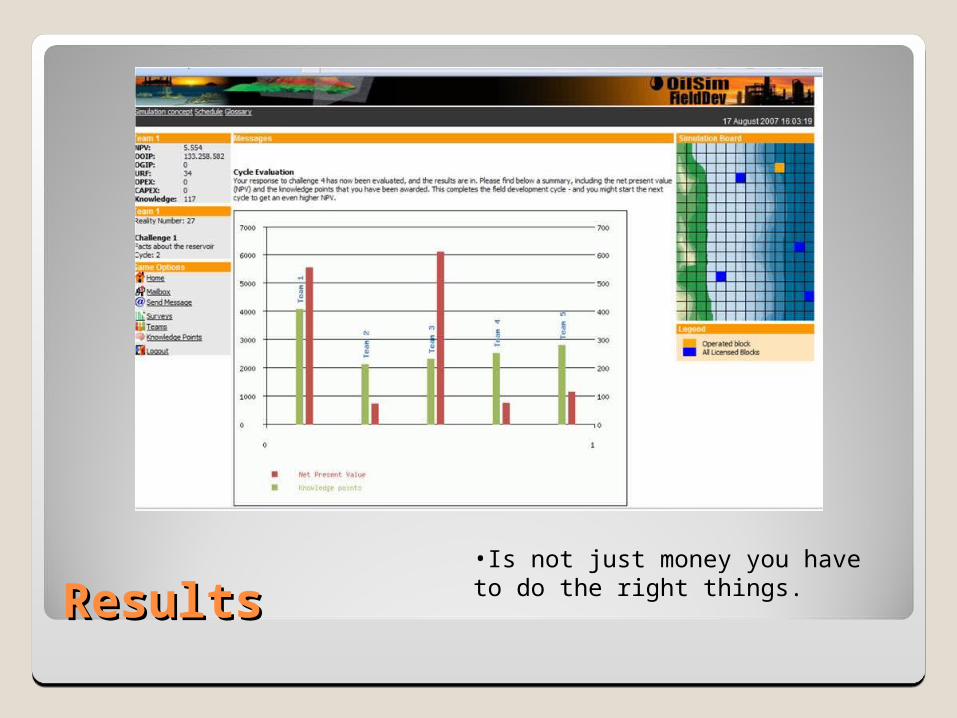
ResultsResults•Is not just money you have to do the right things.
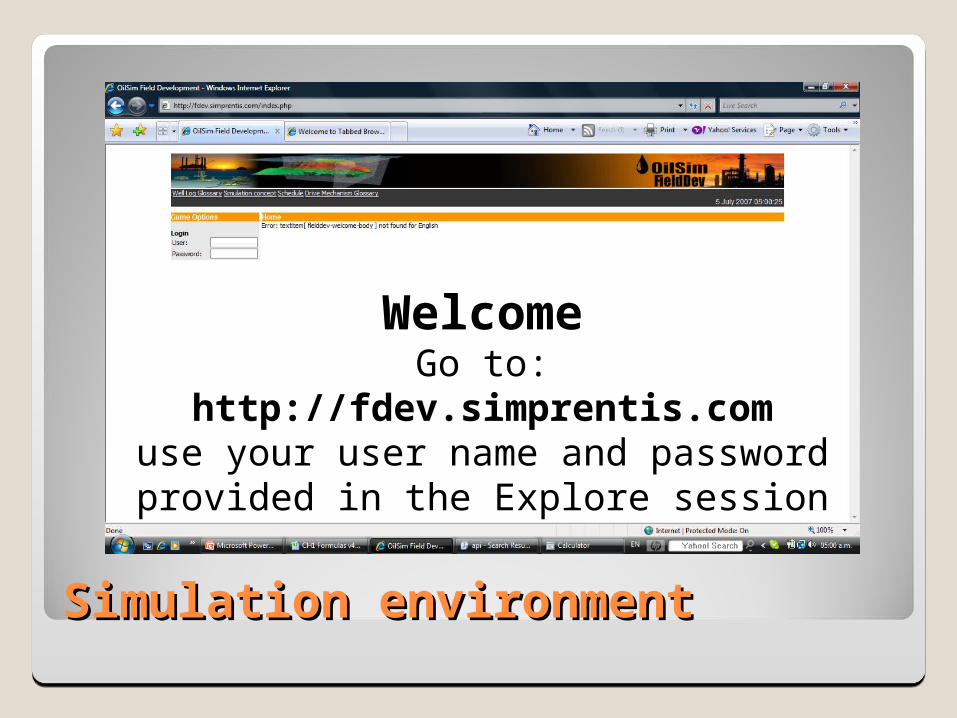
Simulation environmentSimulation environment
WelcomeGo to: http://fdev.simprentis.comuse your user name and password
provided in the Explore session

![STATUS AND Highlights KHO 2017kho.unis.no/doc/KHO_2017.pdf · [STATUS AND HIGHLIGHTS KHO 2017] February 28, 2018 UNIVERSITY CENTRE IN SVALBARD UNIS BOX 156 9171 LONGYEARBYEN NORWAY](https://img.pdfslide.us/doc/110x75/5e2c091c3ddbeb0fbe7eda53/status-and-highlights-kho-status-and-highlights-kho-2017-february-28-2018-university.jpg)