Embed Size (px)
Citation preview

Creation and Destruction
Sustaining corporate growth in Australia
Edited by David White
Port Jackson Partners Limited

Published by
Port Jackson Partners LimitedLevel 29amp Centre50 Bridge StreetSydney nsw 2000Australia
t +61 (0)2 9221 2222f +61 (0)2 9221 2219www.pjpl.com.au
PRODUCED BY CYAN COMMUNICATIONS / HAPPYDANCE
Contents
5 Preface
Part 1 Impermanence
8 Creative destruction amongst Australia’s top 100 companiesPhilip Stern and David White, with Laura Eadie
18 Research note: Creative destruction in the small business sectorDavid White
Part 2 Growth
20 Growth expectations for Australia’s top 100 companies Byron Pirola and David White, with Laura Eadie
28 Understanding growth expectations: The three horizons of growthDavid White and Mehrdad Baghai
Part 3 Australia’s future
34 Australia’s growth horizons in the new millenniumDavid White, Mehrdad Baghai and Belinda Everingham
44 About the authors
46 Acknowledgements


Preface
‘The problem that is usually being visualised is how capitalism administersexisting structure whereas the relevant problem is how it creates anddestroys them.’ So wrote the great economist Joseph Schumpeter.
This collection of five short essays examines the process of ‘creation anddestruction’ amongst Australia’s top 100 companies. The lead essay waspresented as a speech to the agm of the Business Council of Australia on22 October 2002.
In Part 1, we show that corporations have surprisingly short lifespans. Of all the companies that were listed on the original Dow JonesIndustrial Average stock index of 1896, only one survives today. And theturnover of companies on Australia’s top 100 list since 1990 has beennothing short of astounding. Yet the magnitude, and implications, ofthis change are not well understood in Australia. Part 1 is a contributionto answering such key questions as:
§ How many companies have survived from the top 100 of 1990?§ Which companies have disappeared? Why did they fail to survive?§ Which companies climbed into the top 100? Why did they succeed?§ What has been the relative profit and share price performance of
the newcomers versus the long-term survivors?§ How does the radical change in the mix of the top 100 reflect
fundamental shifts in the Australian economy? § Why does the new mix give cause for optimism about
Australia’s future?
In Part 2, we note that while all individual businesses eventuallymature, not all corporations must do the same. Enduring corporationsfind new horizons for growth as old businesses mature and decline. Byexamining the growth expectations implicit in the share prices of the top100 companies, we address such questions as:
§ Which companies have growth expectations accounting for morethan half of their stock prices?
§ For which companies does the market have negative long-termgrowth expectations?
5
See Joseph A.Schumpeter,Business Cycles:A theoretical,historical andstatistical analysisof the capitalisticprocess (McGraw-Hill,New York, 1939)
§ What is the relationship between past performance and futuregrowth expectations?
§ How has the growth premium changed since the peak of the boomat the end of 1999?
§ How are stock market growth expectations influenced by a company’s growth strategy?
§ How can the health of a company’s growth strategy be diagnosed using the three horizon framework?
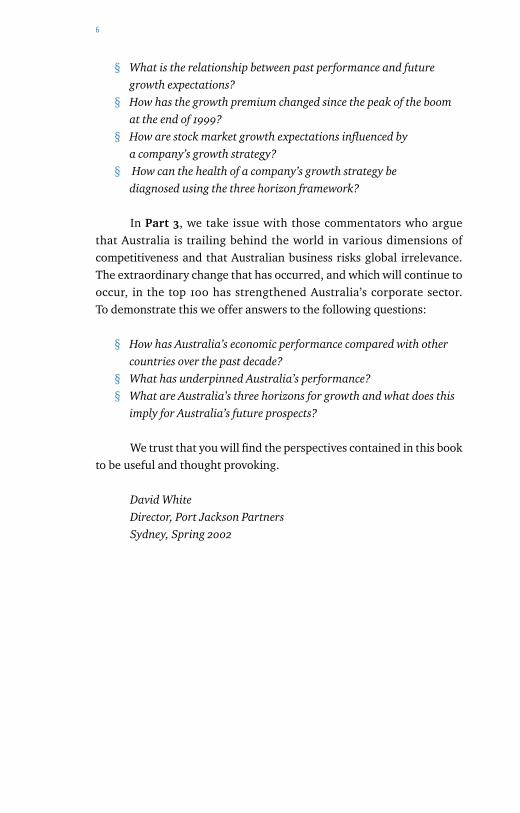
In Part 3, we take issue with those commentators who argue that Australia is trailing behind the world in various dimensions ofcompetitiveness and that Australian business risks global irrelevance.The extraordinary change that has occurred, and which will continue tooccur, in the top 100 has strengthened Australia’s corporate sector. To demonstrate this we offer answers to the following questions:
§ How has Australia’s economic performance compared with othercountries over the past decade?
§ What has underpinned Australia’s performance?§ What are Australia’s three horizons for growth and what does this
imply for Australia’s future prospects?
We trust that you will find the perspectives contained in this bookto be useful and thought provoking.
David WhiteDirector, Port Jackson PartnersSydney, Spring 2002
6

Part 1Impermanence

Creative destruction amongst Australia’s top 100 companies
Philip Stern and David White, with Laura Eadie
This article is adapted from a speech given at the AGM of the Business
Council of Australia on 22 October 2002.
Impermanence is a fundamental fact of nature. Living things will die.Matter will change form. No surprise then that the corporations that areimportant to our lives as providers of products and services, and asproviders of employment and income, are also impermanent.
Unlike religious and educational institutions, there are very fewexamples of important corporate institutions that have survived formultiple centuries. Three of the oldest companies are: Stora, a Swedishpulp and paper manufacturer which began its life as a copper mine incentral Sweden more than 700 years ago; Sumitomo Group, which hasits origins in a copper casting shop founded in Japan in 1590; and SaintGobain, which was founded in 1665 in France and built the Hall ofMirrors at the Palace of Versailles. But corporations that manage tosurvive and prosper for even 100 years are relatively rare.
The rarity of long-term corporate survival is apparent fromexamining the changes in the composition of leading us stock indices. In1896, Charles Dow first published the famous Dow Jones IndustrialAverage stock index. Only one company, General Electric, survives fromthe original list. Similarly only 18 of the original Forbes 100 list from 1917made it on to the list that was published 70 years later in 1987.
The same conclusion emerges from an examination of the moremodern, and widely representative, index of us companies, the s&p 500.Of the 500 companies that constituted this list in 1957, only 74 remainedon the list 40 years later in 1997.
Impermanence in Australia’s top 100
Corporate impermanence is not only a feature of the us economy. OfAustralia’s top 100 companies (measured by market capitalisation) in1990, only 39 were still in the top 100 list in March 2002 (Exhibit 1).
It is astonishing that almost two-thirds of the top 100 companiesfrom 1990 have disappeared. Why have they disappeared? What lessonscan be learned by investors and managers?
8 CREATION AND DESTRUCTION: SUSTAINING CORPORATE GROW TH IN AUSTRALIA
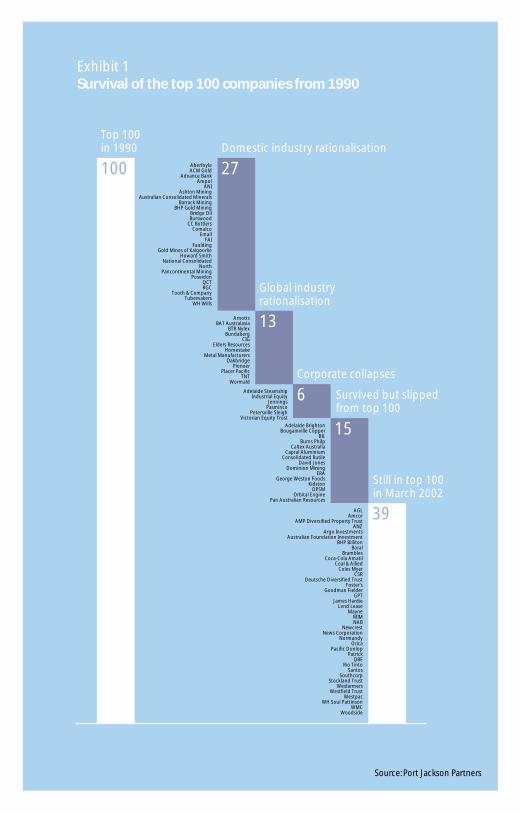
27100
13
6
15
39
Domestic industry rationalisationTop 100 in 1990
Global industry rationalisation
Corporate collapses
Survived but slipped from top 100
Still in top 100 in March 2002
AberfoyleACM Gold
Advance BankAmpol
ANIAshton Mining
Australian Consolidated MineralsBarrack Mining
BHP Gold MiningBridge OilBurswood
CC BottlersComalco
EmailFAI
FauldingGold Mines of Kalgoorlie
Howard SmithNational Consolidated
NorthPancontinental Mining
PoseidonQCTRGC
Tooth & CompanyTubemakers
WH Wills
ArnottsBAT Australasia
BTR NylexBundaberg
CIGElders Resources
HomestakeMetal Manufacturers
OakbridgePioneer
Placer PacificTNT
Wormald
Adelaide SteamshipIndustrial Equity
JenningsPasminco
Petersville SleighVictorian Equity Trust
Adelaide BrightonBougainville Copper
BIL Burns Philp
Caltex AustraliaCapral Aluminium
Consolidated RutileDavid Jones
Dominion MiningERA
George Weston FoodsKidston
OPSMOrbital Engine
Pan Australian Resources
AGLAmcor
AMP Diversified Property TrustANZ
Argo InvestmentsAustralian Foundation Investment
BHP BillitonBoral
BramblesCoca-Cola Amatil
Coal & AlliedColes Myer
CSRDeutsche Diversified Trust
Foster’sGoodman Fielder
GPTJames Hardie
Lend LeaseMayne
MIMNAB
NewcrestNews Corporation
NormandyOrica
Pacific DunlopPatrick
QBE Rio Tinto
SantosSouthcorp
Stockland TrustWesfarmers
Westfield TrustWestpac
WH Soul PattinsonWMC
Woodside
Exhibit 1Survival of the top 100 companies from 1990
Source: Port Jackson Partners

Twenty-seven companies were acquired in domestic industryrationalisations. Many of these rationalisations were executed to takeadvantage of economies of scale and scope. Ampol’s merger with CaltexAustralia and Advance Bank’s with St.George, for example, releasedsubstantial value through cost and asset rationalisation. Small naturalresource companies were particularly vulnerable, with more than adozen mining and oil companies falling victim to stronger competitorsover the past decade.
The opportunity to improve operational performance, added tothe synergies available from scale, drove mergers such as the Wesfarmerstakeover of Howard Smith. Industry restructuring to acquire attractivedownstream assets characterised other rationalisations, including bhp’sbuy-out of the minorities in Tubemakers and Smorgon Steel’s takeoversof Email and ani.
Thirteen companies were acquired in global industry rational-isation plays driven by foreign companies – feeding the fear felt by somecommentators that Australia may become a branch office economy.Foreign-owned parent companies bought out the minorities in Arnotts,btr Nylex and cig. Other companies fell to industry specialists seekingto build global presence and scale. For example, Bundaberg wasacquired by Belgian group Finasucre, tnt merged with Dutch postalgroup tpg, Pioneer was bought by Hanson in the United Kingdom and, at the March 2002 cut-off date, Normandy was about to be absorbed by us-based Newmont Mining.
Some might argue that the mergers of bhp with Billiton,Brambles with gkn and cra with rtz were global takeovers, but we havetreated these companies as Australian top 100 survivors.
A further six companies disappeared due to corporate collapses.Petersville Sleigh, Adelaide Steamship and iel were the last of therestructurings resulting from the failed entrepreneurial conglomeratesin the 1980s. Pasminco is a more recent casualty of over ambitiousacquisition and currency hedging transactions.
Finally, there are 15 companies who have survived but slipped fromthe top 100. These companies have failed to keep pace with their peers dueto the constraints imposed by low growth industries (eg, Adelaide Brighton,George Weston Foods), lack of imagination, poor strategic decisions(eg, Burns Philp) or external events (eg, Bougainville Copper).
A number of these companies have remained doggedly focusedon narrowly defined industries and have condemned themselves todecline with their industry. Focus is not always a sensible strategy.
10 CREATION AND DESTRUCTION: SUSTAINING CORPORATE GROW TH IN AUSTRALIA
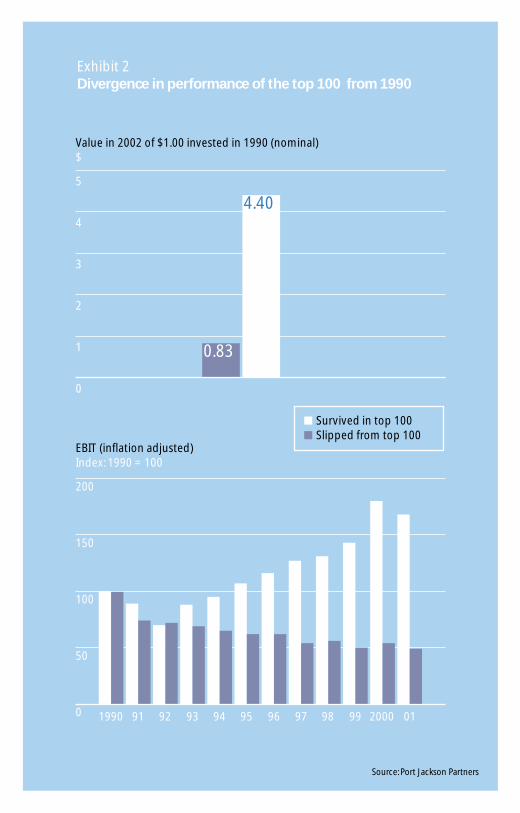
Exhibit 2Divergence in performance of the top 100 from 1990
Source: Port Jackson Partners
Value in 2002 of $1.00 invested in 1990 (nominal)$
5
4
3
2
1
0
EBIT (inflation adjusted)Index: 1990 = 100
200
150
100
50
0 1990 91 92 93 94 95 96 97 98 99 2000 01
Survived in top 100Slipped from top 100
4.40
0.83
The failure of these companies to retain their place in the top 100reflects not only poor performance, but also the reality that to earn andretain a place in the top 100 has become increasingly difficult. In 1990, a market capitalisation of only $333 million (in today’s dollars) wassufficient to earn a place in the top 100 (the average market cap was $2.1 billion). To earn a place in the top 100 today requires a market capof $1.0 billion (the average market cap of the top 100 is $6.5 billion) – athreefold increase in size.
Those companies that remained on the top 100 list since 1990 aredistinguished from the survivors who slipped from the top 100 by theirsuperior financial performance. On average, the 396 survivors in the top100 delivered returns to shareholders from dividends and capital gainsof 13 percent a year between 1990 and 2002, compared with negative 2 percent a year for those that slipped from the top 100. The cumulativeimpact of this difference is stark – if you were to have invested $1.00 in1990 in the top 100 survivor companies, it would be worth $4.40 todaycompared with $0.83 for those that slipped from the top 100 group.
This divergence in shareholder returns was driven by poor profitperformance. The survivors in the top 100 delivered cumulative growthin ebit of 68 percent over 12 years, while the ebit of those that slippedfrom the top 100 declined by 50 percent (see Exhibit 2).
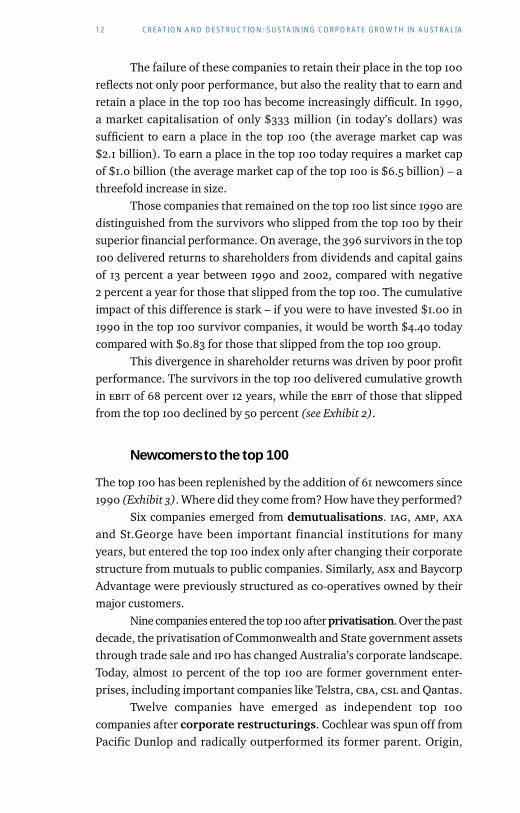
Newcomers to the top 100
The top 100 has been replenished by the addition of 61 newcomers since1990 (Exhibit 3). Where did they come from? How have they performed?
Six companies emerged from demutualisations. iag, amp, axaand St.George have been important financial institutions for manyyears, but entered the top 100 index only after changing their corporatestructure from mutuals to public companies. Similarly, asx and BaycorpAdvantage were previously structured as co-operatives owned by theirmajor customers.
Nine companies entered the top 100 after privatisation. Over the pastdecade, the privatisation of Commonwealth and State government assetsthrough trade sale and ipo has changed Australia’s corporate landscape.Today, almost 10 percent of the top 100 are former government enter-prises, including important companies like Telstra, cba, csl and Qantas.
Twelve companies have emerged as independent top 100companies after corporate restructurings. Cochlear was spun off fromPacific Dunlop and radically outperformed its former parent. Origin,
12 CREATION AND DESTRUCTION: SUSTAINING CORPORATE GROW TH IN AUSTRALIA
21
12
9
6
39
IPO of privatecompanies
Corporaterestructurings
Privatisations
Demutualisations
Still in top 100 from 1990
AristocratBillabongBRL HardyBT Office TrustComputershareDeutsche Office TrustFlight CentreFoodlandGandel Retail TrustHills MotorwayLihir GoldMacquarie BankMacquarie Goodman Industrial TrustMacquarie Infrastructure GroupMedical ImagingMetcashResMedSmorgon SteelToll HoldingsTransurbanWestfield America
13
Climbed from outside top 100
Top 100 in March 2002
AMP Office TrustAPNCFS Property TrustCochlearFairfaxInvesta Property GroupLion NathanOriginPaperlinXSeven NetworkWA NewsWoolworths
AWBBankWestCBACSLQantasSuncorp MetwayTAB LimitedTABCORPTelstra
AMPASXAXABaycorp AdvantageIAGSt.George
Exhibit 3Newcomers to the top 100 since 1990
Source: Port Jackson Partners
100AurionGoldCentro Property GroupFuturisHarvey NormanIluka ResourcesJupitersLeightonMirvac PBLPerpetualSonic HealthcareSons of GwaliaWestfield Holdings
AGLAmcorAMP Diversified Property TrustANZArgo InvestmentsAustralian Foundation InvestmentBHP BillitonBoralBramblesCoca-Cola AmatilCoal & AlliedColes MyerCSRDeutsche Diversified TrustFoster’sGoodman FielderGPTJames HardieLend LeaseMayneMIMNABNewcrestNews CorporationNormandyOricaPacific DunlopPatrickQBE Rio TintoSantosSouthcorpStockland TrustWesfarmersWestfield TrustWestpacWH Soul PattinsonWMCWoodside
Note: Excludes AMP Shopping Centre Trust, AWB, Billabong, Deutsche Office Trust, IAG, Lihir Gold, PaperlinX and Transurban for which five years data not available.
Exhibit 4EBIT and revenue growth of companies listed before 1990
Source: Port Jackson Partners
Revenue (inflation adjusted)Index: 1990 = 100
600
500
400
300
200
100
EBIT (inflation adjusted)Index: 1990 = 100
500
400
300
200
100
1990 91 92 93 94 95 96 97 98 99 2000 01
1990 91 92 93 94 95 96 97 98 99 2000 01
Climbed into top 100Survived in top 100Slipped from top 100
PaperlinX and three property trusts are other examples of spin-offs from listed parent companies. Fairfax, Seven Network, wa News andWoolworths were relisted after the collapse of entrepreneurial parentcompanies including Quintex, Bell and Adsteam.
Almost two dozen companies entered the top 100 after ipo of privatecompanies. Most of these ipos have been followed by strong growth inrevenue and profit. Many of these companies have been star performers.Macquarie Bank, Flight Centre, Toll Holdings, ResMed, brl Hardy andAristocrat, for example, have all dramatically expanded their busi-nesses, and provided shareholders with extraordinary returns since listing.
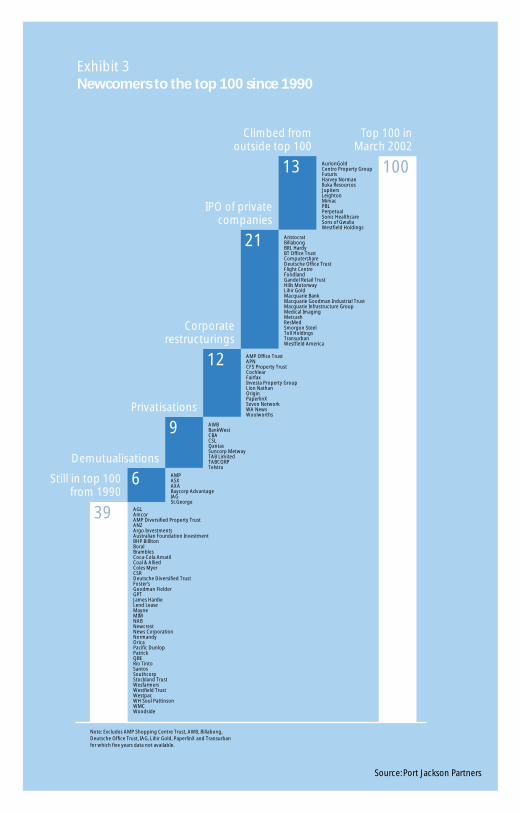
Thirteen companies climbed into the top 100 after beginningthe 1990s outside the top 100. Companies such as Leighton, WestfieldHoldings, Perpetual and Harvey Norman have demonstrated sustainedand substantial growth in revenues and profits for many years to earntheir well-deserved place in the top 100.
The superior financial performance of the 13 companies that werelisted prior to 1990 and which subsequently climbed into the top 100 isevident from the exceptional earnings and revenue growth shown inExhibit 4. As a result of this strong financial performance, $1.00 investedin the group of climbers in 1990 grew to $32.40 in 2002 – compared with$4.40 for top 100 survivors and $0.83 for those companies that survivedbut slipped from the top 100.
Newcomers have outperformed
It is not only the 13 companies who climbed into the top 100 that haveoutperformed. In fact, the group of 61 newcomers to the top 100(including demutualisations, privatisations, ipos, restructurings and‘climbers’) has dramatically outperformed the older public companies.
The group of newcomers as a whole has delivered returns toshareholders from dividend and capital gains of 29 percent a year overthe five years from 1997 to 2002. By comparison, companies thatsurvived in the top 100 from 1990 delivered only 14 percent a year overthe same five-year period. Even more disappointing is the negative 9 percent a year return from the group of companies who survived, but slipped from the top 100 since 1990 (Exhibit 5). These superiorshareholder returns by newcomers have been driven by strong growth inearnings of 13 percent per year, which in turn has been fuelled byoutstanding revenue growth of 15 percent per year.
The emergence of these high growth newcomers has dramatically
CREATIVE DESTRUCTION AMONGST AUSTRALIA’S TOP 100 COMPANIES 15
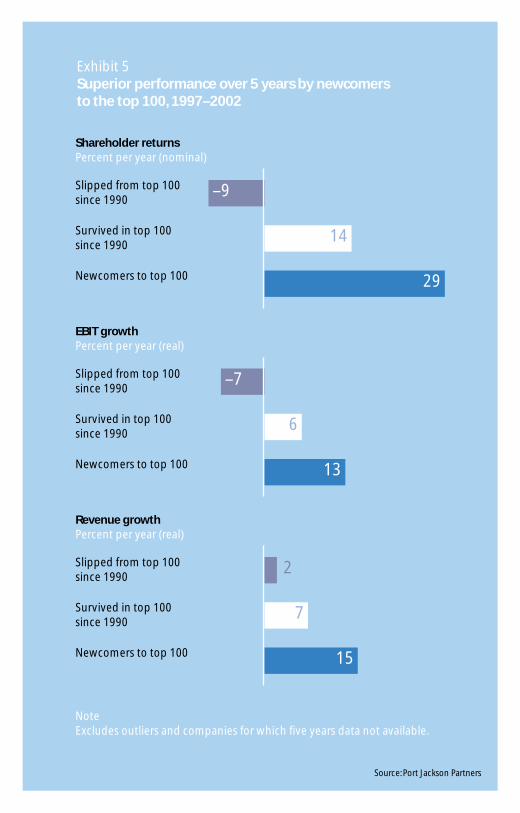
Exhibit 5Superior performance over 5 years by newcomers to the top 100, 1997–2002
–9
14
29
–7
6
13
2
7
15
Source: Port Jackson Partners
Shareholder returnsPercent per year (nominal)
Slipped from top 100 since 1990
Survived in top 100since 1990
Newcomers to top 100
EBIT growthPercent per year (real)
Slipped from top 100 since 1990
Survived in top 100since 1990
Newcomers to top 100
Revenue growthPercent per year (real)
Slipped from top 100 since 1990
Survived in top 100since 1990
Newcomers to top 100
NoteExcludes outliers and companies for which five years data not available.
reshaped the Australian corporate sector since 1990. Today’s top 100 isbetter balanced than the top 100 of 1990, since a greater proportion ofcompanies are operating in growth sectors and industries of the future.In 1990, 80 percent of the top 100 were operating in Australia’ssuccessful, but mature ‘horizon one’ – core industries such as miningand manufacturing. Only 20 percent were operating in the ‘horizon two’growth industries in the service sector (for example, financial services,health, communications) and in the knowledge-intensive ‘horizonthree’ industries of the future (such as medical devices and biotech). By 2002, more than half of the top 100 were operating in these highergrowth horizon 2 and 3 sectors.
Creative destruction in Australia’s economy
The corporate impermanence witnessed in Australia’s top 100 issystemic. The economist, Joseph Schumpeter wrote: ‘The process ofindustrial mutation… incessantly revolutionises the economic structurefrom within, incessantly destroying the old one, incessantly creating a newone. This process of creative destruction is the essential fact aboutcapitalism… The problem that is usually being visualised is how capitalismadministers existing structures whereas the relevant problem is how itcreates and destroys them.’
The ‘gales of creative destruction’, as Schumpeter called theprocess, are likely to continue in Australia. Despite stringent policingfrom the Australian Competition and Consumer Commission, there is nodoubt that domestic industry consolidation will continue at pace overthe coming decade. The growing strength of the anti-globalisation lobbyis unlikely to lower the growth ambitions of leading acquirers inglobalising industries. Unfortunately, corporate collapses will occur andceos who fail to rejuvenate and reinvent their organisations will seethem fall prey to higher performing competitors. These disappearingcompanies will continue to be replaced by innovators who climb into thetop 100, and by new ipos of high growth private enterprises.
The relentless process of creative destruction witnessed inAustralia over the 1990s has positioned Australia to enter the newmillennium with a much more robust top 100. More robust because thecompanies are three times as large in real terms. More robust because of the emergence of many internationally competitive and globalenterprises. And more robust because of the profoundly more attractivebalance of company types.
For anexplanation of the three horizonconcept, see‘Understandinggrowthexpectations:The threehorizons ofgrowth’ on pp. 28–32
See Joseph A.Schumpeter,Business Cycles:A theoretical,historical andstatistical analysisof the capitalisticprocess (McGraw-Hill,New York, 1939)
CREATIVE DESTRUCTION AMONGST AUSTRALIA’S TOP 100 COMPANIES 17

Creative destruction in the small business sectorDavid White
The creation and destruction of enterprises has profoundly reshaped thecomposition of Australia’s top 100 companies over the past decade.Yet bigbusiness represents only a portion of Australia’s economy.The question arises as to whether the astonishing change in the composition of the top 100 ismirrored in Australia’s economy as a whole.
The answer is yes. Data from a representative year (1997–98) shows that 463,000(or 45 percent) of all jobs created in Australia came from the starting up of newfirms; while 245,000 (or one-third) of job losses came from the closing down ofexiting firms (Exhibit 1).
Of the 463,000 jobs created by new firms, 69 percent were created by small ormedium-sized new firms. Conversely 210,000, or 86 percent of jobs lost in exitingfirms came from small and medium businesses (Exhibit 2).
There is no doubt that the waves of creative destruction seen amongst the top100 are also sweeping through the small and medium-sized enterprise sector.
463
549 1,012 407
245
360
Exhibit 1Job creation and destruction in Australia, 1997–98Thousands
New firms
Growingfirms
Total new jobscreated
Exitingfirms
Net newjobs
Decliningfirms
Source: Global Entrepreneurship Monitor, 2001, p. 19; based on ABS data
Exhibit 2Creation and destruction in small and medium-sized businesses, 1997–98Thousands
Jobs lost in existing firms100% = 245,000
224
96
143Small
Medium
Large Large
Medium
Small
35
60150
RESEARCH NOTE
Jobs created in new firms100% = 463,000

CREATIVE DESTRUCTION IN THE SMALL BUSINESS SECTOR 19
Part 2Growth

Growth expectations for Australia’s top 100 companies
Byron Pirola and David White, with Laura Eadie
This article is a reprint of ‘Great expectations set challenge for best of
teams’ first published in Australian Financial Review, 19 July 2002.
‘It was the best of times, it was the worst of times … it was the spring ofhope, it was the winter of despair.’ Dickens’ famous words, from theopening of A Tale of Two Cities published in 1859, might well be used todescribe the mood in Australian boardrooms today.
Some argue it is a time for caution. A time for cost cuts. After all,the Australian corporate landscape is littered with the carcasses ofcollapsed companies. Ansett has followed hih, Harris Scarfe, Traveland,Franklins, One.Tel, Pasminco and thousands of small businesses intoliquidation or receivership over the past year. September 11, Afghanistanand the threat of wars in the Middle East have damaged confidence. Theus corporate governance, accounting and ethical issues involvingEnron, Andersen, Worldcom, Tyco and Xerox have further eroded trust.Economic growth remains sluggish in the United States, Europe andJapan. Stock markets are down around the world. In the United States,the nasdaq index is down 73 percent from its peak and the s&p 500 by 38 percent. In Europe, the ftse Eurotop 300 index is down by 41 percent.In Japan, the Nikkei 225 index is stuck 72 percent off its record high. This isclearly a time to batten down the hatches and to manage conservatively,argue some.
Others argue it is a time for creation. A time to continue initiativesfor corporate expansion. Economic growth of 3.6 percent a year inAustralia over the past quarter is amongst the highest in the developedworld, and the Australian economy has outperformed the United Statesfor a decade. The Australian stock market is only 9 percent off its all-timehigh. A number of companies are announcing strong profit results.Consumer spending and confidence are sound. Interest rates, whilerising, are still low. This is clearly a time to take thoughtful actions tobuild a new corporate future, argue growth-oriented executives.
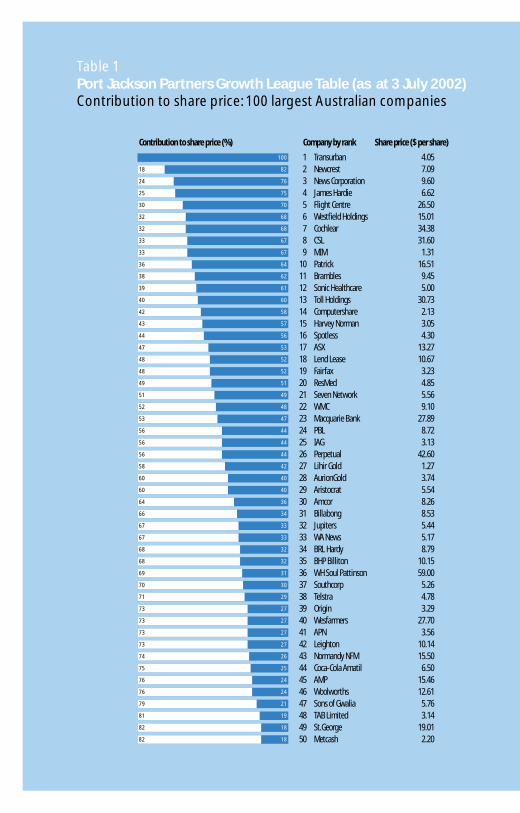
So who is right? The Port Jackson Partners Growth League Tableprovides useful insights (Table 1 on pp. 22–3). On average 18 percent ofthe market capitalisation of Australia’s top 100 local companies is
20 CREATION AND DESTRUCTION: SUSTAINING CORPORATE GROW TH IN AUSTRALIA

accounted for by expectations of long-term growth. To justify this growthpremium, top 100 companies need to deliver 4 percent a year earningsgrowth for a decade.
Not surprisingly, this valuation is more conservative than it wasin the days of the tech boom in August 1999, when growth expectationsaccounted for 31 percent of market capitalisation – a loss of over $95billion in market capitalisation if applied across the entire asx. While thedecline in growth expectations can easily be misinterpreted as a call for a strategic shift from growth to cost cutting, we argue that this is an incomplete view. Despite the global shift from boom to uncertainty,Australian stock market investors remain interested in growthcompanies, and are demonstrably less interested in companies withunclear prospects for long-term prosperity.
At the top of the 2002 growth league table are 20 companies withgrowth expectations representing more than half of the share price. Thisis only slightly fewer than in August 1999 when 23 companies werevalued as highly. For these companies, profit streams yet to be createdare perceived to be worth more than the present value of the profitstreams from existing business. High praise indeed. Looked at anotherway, earnings per share growth of 12 percent a year is needed over the
GROW TH EXPECTATIONS FOR AUSTRALIA’S TOP 100 COMPANIES 21
Growth league table definitions
The growth league table overleaf highlights the growthexpectations factored into the share prices of 100 of Australia’sbiggest domestically-owned companies.
The value of current performance, shown as the white column on the left-hand side, is based on the ‘consensus’ earnings per shareexpected by analysts for the financial year 2002 (for companies that have already reported, 2002 actual earnings were used).The value of current performance is calculated as the net presentvalue of these earnings in perpetuity, discounted at the relevantrisk-adjusted cost of capital, plus the present value of the futurestream of dividend franking credits.
The value of future growth expectation, or growth premium,is shown as the blue bar on the right-hand side. It measures thedifference between the share price on 3 July 2002 and the value ofcurrent performance.The higher the growth premium, the greater the market’s expectations for the earnings growth beyond 2002.
100
8218
7624
7525
7030
6832
6832
6733
6733
6436
6238
6139
6040
5842
5743
5644
5347
5248
5248
5149
4951
4852
4753
4456
4456
4456
4258
4060
4060
3664
3466
3367
3367
3268
3268
31
3070
2971
2773
2773
2773
2773
2674
2575
2476
2476
2179
1981
1882
1882
1 Transurban 4.052 Newcrest 7.093 News Corporation 9.604 James Hardie 6.625 Flight Centre 26.506 Westfield Holdings 15.017 Cochlear 34.388 CSL 31.609 MIM 1.31
10 Patrick 16.5111 Brambles 9.4512 Sonic Healthcare 5.0013 Toll Holdings 30.7314 Computershare 2.1315 Harvey Norman 3.0516 Spotless 4.3017 ASX 13.2718 Lend Lease 10.6719 Fairfax 3.2320 ResMed 4.8521 Seven Network 5.5622 WMC 9.1023 Macquarie Bank 27.8924 PBL 8.7225 IAG 3.1326 Perpetual 42.6027 Lihir Gold 1.2728 AurionGold 3.7429 Aristocrat 5.5430 Amcor 8.2631 Billabong 8.5332 Jupiters 5.4433 WA News 5.1734 BRL Hardy 8.7935 BHP Billiton 10.1536 WH Soul Pattinson 59.0037 Southcorp 5.2638 Telstra 4.7839 Origin 3.2940 Wesfarmers 27.7041 APN 3.5642 Leighton 10.1443 Normandy NFM 15.5044 Coca-Cola Amatil 6.5045 AMP 15.4646 Woolworths 12.6147 Sons of Gwalia 5.7648 TAB Limited 3.1449 St.George 19.0150 Metcash 2.20
Table 1 Port Jackson Partners Growth League Table (as at 3 July 2002)Contribution to share price: 100 largest Australian companies
Contribution to share price (%) Company by rank Share price ($ per share)
69

1684
15
1387
85
1288
793
793
595
595
98
98
98
99
100
102
102
102
104
104
105
105
106
107
108
109
109
109
109
110
110
111
111
112
112
114
115
115
117
118
118
118
121
122
123
126
127
127
135
139
139
159
51 Coles Myer 6.6352 CBA 31.6653 TABCORP 12.4854 Qantas 4.5555 Westpac 16.0356 PaperlinX 4.8957 Ansell 6.6158 ANZ 18.9059 Mayne 4.0260 Boral 3.6661 National Foods 3.6062 Suncorp Metway 12.0363 NAB 33.7064 Stockland Trust 4.4365 Westfield Trust 3.4566 BankWest 4.2667 Investa Property Group 2.1068 Foster's 4.6669 Westfield America 2.0370 Centro Property Group 3.6271 GPT 2.8472 Mirvac 4.1973 Foodland 18.3674 CSR 6.4075 Woodside 13.2976 Gandel Retail Trust 1.2277 AXA 2.6378 AMP Shopping Centre Trust 1.4079 Orica 9.5780 BT Office Trust 1.4981 Coal & Allied 26.5082 Smorgon Steel 1.1883 AMP Diversified Property Trust 2.6384 AMP Office Trust 1.2085 Deutsche Diversified Trust 1.1786 QBE 6.7287 Iluka Resources 5.0088 AGL 9.4989 Lion Nathan 4.7490 Deutsche Office Trust 1.2891 CFS Property Trust 2.2192 ING Office Trust 1.2393 ING Industrial Trust 1.6494 Santos 6.4595 Macquarie Office Trust 1.3296 Goodman Fielder 1.6997 AWB 3.7498 Macquarie Goodman Industrial Trust 1.4399 Macquarie Infrastructure Group 2.82
100 United Energy 2.15
Source:Thompson Financial Datastream, CommSec, Port Jackson Partners
2
2
2
1
Contribution to share price (%) Company by rank Share price ($ per share)
Value of current performanceGrowth expectations

next decade to justify a growth premium representing half of the currentshare price. Those companies with growth representing three-quartersof the current share price, will need to grow eps at around 23 percent ayear for a decade.
While a few companies in this group have a high growth premiumdue to expectations of a takeover or a cyclical turnaround, most arebeing rewarded for the strength of their growth horizons. Most candemonstrate good profitability in existing horizon 1 core businesses, aswell as rapidly emerging horizon 2 growth engines and a portfolio ofhorizon 3 growth options.
The most remarkable change since the peak of the boom is that,at the bottom of the table, the market is more severely penalising thosecompanies that are perceived to lack strong growth engines. Some 37companies have a negative growth premium, up from 11 companies in1999. For these companies the market’s judgement, right or wrong, is thatcurrent profit streams are unlikely to be maintained in the long term.
The management challenges presented by future expectations canbe better understood in the context of past performance. Table 2 dividesthe top 100 into six groups according to their track record of deliveringgrowth in share price and earnings over the past five years (verticalaxis), and the market’s expectation for future growth (horizontal axis).
The most impressive group is the high flyers in the top rightcorner of Table 2. Growth expectations for this group are very high,accounting for over half of the share price. Their historical track recordis also very strong. On average over the past five years, the companies in this group have delivered compound annual growth in eps of 33 percent a year, and returns to shareholders from share price gain anddividends of 44 percent a year.
These companies have not ignored the imperative to containcosts. But in addition, all have established strong horizon 2 growthmomentum through the replication and extension of successful businessmodels. They have not been slowed by the uncertain global environ-ment of the last year. For example, Patrick has raised over $660 millionof capital to position itself for bold initiatives in buying half the NationalRail, FreightCorp and Virgin Airlines assets. Flight Centre continued itsstrategy of growth through the international rollout of its highlyproductive airline ticket retailing formula, and raised $50 million lastyear to help fund its bid for the corporate travel specialist itg. WestfieldHoldings, through its affiliate Westfield America, raised an astonishing
24 CREATION AND DESTRUCTION: SUSTAINING CORPORATE GROW TH IN AUSTRALIA
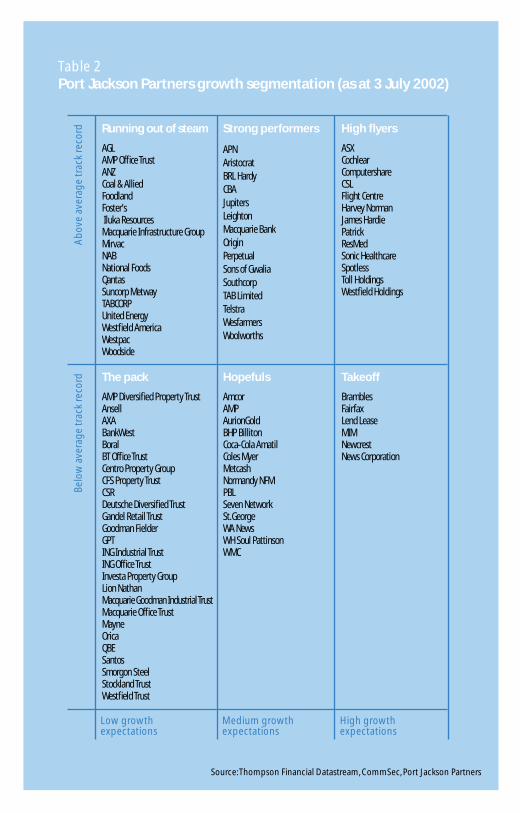
Table 2 Port Jackson Partners growth segmentation (as at 3 July 2002)
Source:Thompson Financial Datastream, CommSec, Port Jackson Partners
Ab
ove
aver
age
trac
k re
cord Running out of steam
AGLAMP Office TrustANZ Coal & AlliedFoodlandFoster'sIluka ResourcesMacquarie Infrastructure GroupMirvacNABNational FoodsQantas Suncorp MetwayTABCORPUnited EnergyWestfield America WestpacWoodside
Strong performers
APN Aristocrat BRL HardyCBAJupitersLeighton Macquarie BankOrigin PerpetualSons of GwaliaSouthcorpTAB LimitedTelstraWesfarmersWoolworths
High flyers
ASXCochlearComputershareCSLFlight CentreHarvey Norman James Hardie Patrick ResMedSonic HealthcareSpotless Toll HoldingsWestfield Holdings
Belo
w a
vera
ge
trac
k re
cord The pack
AMP Diversified Property TrustAnsellAXABankWestBoralBT Office TrustCentro Property GroupCFS Property TrustCSRDeutsche Diversified TrustGandel Retail TrustGoodman FielderGPTING Industrial TrustING Office TrustInvesta Property GroupLion NathanMacquarie Goodman Industrial TrustMacquarie Office TrustMayneOricaQBESantosSmorgon SteelStockland Trust Westfield Trust
Hopefuls
AmcorAMPAurionGoldBHP BillitonCoca-Cola AmatilColes MyerMetcashNormandy NFMPBLSeven NetworkSt.GeorgeWA NewsWH Soul PattinsonWMC
Takeoff
BramblesFairfax Lend Lease MIM Newcrest News Corporation
Low growthexpectations
Medium growthexpectations
High growthexpectations
$2.4 billion in January 2002 to fund its Rodamco North Americanshopping centre acquisition. csl, ResMed and Cochlear continued theirrapid global expansions and r&d investments. Harvey Norman iscontinuing its industry changing rollout of a ‘big box’ retail format.
The challenge for the high flyers is to sustain growth at a rate thatcontinues to justify the high growth premium built into their shareprices. These companies are on an expectation treadmill. To simply holdshare price steady at today’s levels they need to deliver on largeexpectations. The only way to lift share price is to surprise the marketwith better than expected results. And any deviation from the 12 to 25percent a year earnings growth expected by the market is immediatelypunished with a sharp fall in share price. Computershare and SonicHealthcare, for example, plummeted after disappointing analysts’expectations. Even companies with excellent records of strategicexecution (such as ResMed) have seen major price falls as the marketwinds back their pe ratios. While all management teams aspire to berecognised as a member of the high-flyer group, having got there thechallenges do not get any easier.
The companies in the takeoff group also have growthexpectations of over half their share price, but lack the high flyers’ trackrecord over the past five years – delivering eps growth of 15 percent andshareholder returns of 7 percent a year. The group includes someturnaround stories such as mim, as well as companies expected to benefitfrom cyclical earnings upturns such as Fairfax. The challenge forcompanies in this group is to create an earnings trajectory to justify thehigh growth premium.
The strong performers and the hopefuls groups both showmoderate growth expectations between 15 and 50 percent of share price. The strong performers have a track record of above averageperformance over the past five years, delivering eps growth of 14 percentand shareholder returns of 25 percent a year. Companies such asWesfarmers are rightly perceived as reliable performers with plenty ofcontinuing momentum.
The hopefuls group, by contrast, has recorded below averagegrowth in eps of zero percent a year and in shareholder returns of 9 percent a year. The hopefuls group includes companies such as ColesMyer and Coca-Cola Amatil where the market is betting on newmanagement to lift performance. The prize for the hopefuls is to deliverperformance that lifts them into the solid performer category, andultimately to earn a re-rating into the high flyers group. The risk is that
26 CREATION AND DESTRUCTION: SUSTAINING CORPORATE GROW TH IN AUSTRALIA
they could fall back into the pack if the market is not soon convincedthat a sustainable lift in growth trajectory is emerging. Such has beenthe path for Mayne in the first half of 2002 as the market reassessedprospects for sustained turnaround after profit disappointments.
The top left corner of Table 2 lists the companies that are eitherrunning out of steam or undervalued. These companies have a lowgrowth premium of less than 15 percent of the share price, despite agood track record of growing eps at 14 percent a year and shareholderreturns at 18 percent a year over the past five years. The big banks, forexample, have all delivered well through disciplined cost reduction,substantial fee increases, and extension into faster growing segmentssuch as funds management. Others, such as tabcorp, Suncorp Metway,Foodland and Macquarie Infrastructure Group have been travellingwith strong tailwinds, which the market seems to believe are notsustainable. There are likely to be some undervalued stocks in thisgroup. The challenge for all companies in this group is to maintain theirhistoric momentum and demonstrate that they deserve a higher growthpremium than the market is currently willing to award them.
The remaining companies are collected into the pack in thebottom left corner. They are distinguished neither by high forward-looking growth premiums nor by strong historic track records. Onaverage, eps growth has been 1 percent and returns to shareholdershave been 9 percent a year. While some have strategy or managementdifficulties to work through, placement in this group does notnecessarily imply poor management. Many members of this group areproperty trusts, a special asset class designed to deliver stable dividendswith low risk. Other companies are constrained by low growthindustries like food, building materials and beer. Some are simplyundervalued. The challenge for companies in the pack is to overcomeinertia and create confidence in new growth initiatives.
Whatever a company’s position, two things are clear. Growth isimportant. And growth is difficult. Whether the challenge is to lift acompany out of the pack, or to justify the company’s position as a highflyer, management will need creativity, discipline and courage.
GROW TH EXPECTATIONS FOR AUSTRALIA’S TOP 100 COMPANIES 27

Understanding growth expectations: The three horizons of growth
David White and Mehrdad Baghai
This is an abridged version of an article,‘Plan your pot of gold over
horizon’ first published in Australian Financial Review, 13 August 1999.
Whether you like it or not, the stock market is valuing the growthpotential of your company every day. The share prices of someAustralian companies have a giant growth premium built into them. If they don’t fulfil these expectations, their shares are in for a tumble.Other companies on the stock market have small or negative growthexpectations. If these companies are to boost their stock prices, they willneed to prove to the market that they are developing new streams ofrevenue and profits. Australia’s companies must focus not only on costs,but also on sustained profitable growth and its primary source – newbusiness creation.
Some stocks have surprising results in the growth league table(see pp. 22–3) that may be explained by an overzealous or overcautiousmarket. But the market cannot be wrong all the time. What is it then thatcan adequately explain how one company can be expected by the marketto have a rosy future while a seemingly similar company does not?
The three horizons of growth
The answer – as explained in the book, The Alchemy of Growth – is that asa company’s businesses and revenue streams mature, it must haveothers ready to take their place. If continual growth is the goal, the paceof replenishment must be faster than the pace of decline. To sustaingrowth, there must be a continuous pipeline of new businesses thatrepresent new sources of profit.
What distinguishes the corporations that carry on growing istheir ability to create these businesses. They can innovate in their corebusinesses and build new ones at the same time. What they havemastered is the art of managing their pipeline so that fading sources ofgrowth are replenished at exactly the right moment.
Imagine a company that has had sustained profitable growth formore than a decade. Its core businesses are already out of the pipeline,
28 CREATION AND DESTRUCTION: SUSTAINING CORPORATE GROW TH IN AUSTRALIA
Editor’s noteThe three horizon
framework referredto in several places
in this book wasdeveloped by
McKinsey &Company and
published in TheAlchemy of Growth:
Kickstarting andsustaining growth in
your company byMehrdad Baghai,
Stephen Coley andDavid White (Orion
Business, 1999).
operating as fully developed profit generators. Inside the pipeline areyounger businesses that are showing substantial growth in revenue (andperhaps in profits too). Further back in the pipeline are businesses in anearlier stage of formation. The pipeline thus contains emerging andfuture businesses to supplement the company’s existing core businesses.
A healthy pipeline is a feature of all growth-sustaining companies.Unfortunately, companies boasting such a pipeline are the exception.Enterprises seeking to sustain growth cannot afford to leave gapsbetween the decline of one business and the ascent of another. Yet that is precisely what many companies do. Building and managing acontinuous pipeline of business creation is the central challenge ofsustained growth.
What makes this task harder is that the risks and managementchallenges involved change as a project progresses down the pipeline. Tosee how, it is helpful to break down the business creation process intothree stages. A three-stage pipeline is useful in that it allows us todistinguish between the embryonic, emergent and mature phases of abusiness’s life cycle. We refer to these stages as the three horizons ofgrowth. Each horizon represents a different stage in the creation anddevelopment of a business. And each calls for radically differentbusiness initiatives (see Exhibit 1 overleaf ).
Horizon 1 encompasses the businesses that are at the heart of anorganisation – those that customers and stock analysts most readilyidentify with the corporate name. In successful companies, thesebusinesses usually account for the lion’s share of profits and cash flow.Horizon 1 businesses are critical to near-term performance, and the cashthey generate and the skills they nurture provide resources for growth.They usually have some growth potential left, but will eventually flattenout and decline.
Management’s primary challenge in horizon 1 is to shore upcompetitive positions and capture what potential remains in the corebusinesses. Even when these are mature, continuing innovation canincrementally extend their growth and profitability. Traditional sales-force stimulation programs, product extensions and marketing changescan all contribute. Restructuring, productivity enhancement and cost-reduction measures will also help maintain healthy performance for as long as possible.
By the time a business matures into horizon 1, the initial strategicinsight will have been long recognised by competitors, and earlypositional advantages may well be eroding. Survival depends on
29UNDERSTANDING GROW TH EXPECTATIONS: THE THREE HORIZONS OF GROW TH
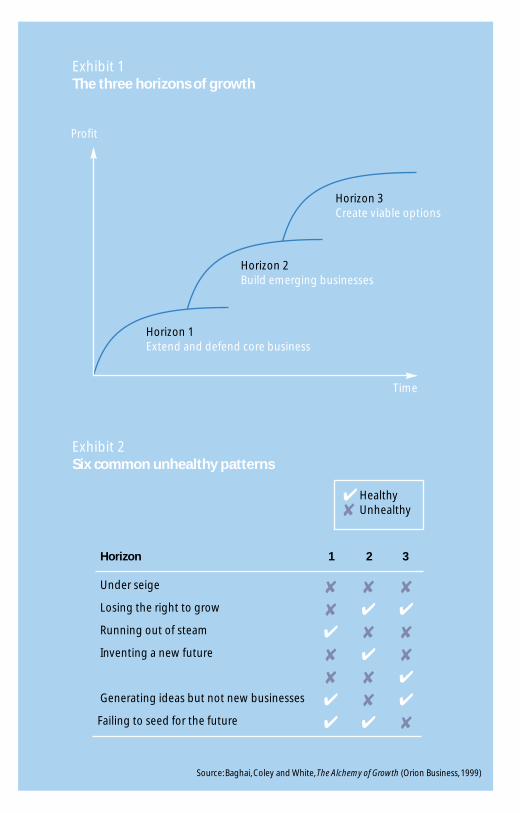
Exhibit 1The three horizons of growth
Exhibit 2Six common unhealthy patterns
Horizon
Under seige
1 2 3
Losing the right to grow
Running out of steam
Inventing a new future
Generating ideas but not new businesses
Failing to seed for the future
Time
Profit
Horizon 1Extend and defend core business
Horizon 2Build emerging businesses
Horizon 3Create viable options
Source: Baghai, Coley and White, The Alchemy of Growth (Orion Business, 1999)
✔ Healthy✘ Unhealthy
✘ ✘ ✘
✘ ✔ ✔
✔ ✘ ✘
✘ ✔ ✘
✘ ✘ ✔
✔ ✘ ✔
✔ ✔ ✘
superior execution. Great discipline is required in operations, planningand budgeting to increase profitability.
Horizon 2 comprises businesses on the rise: fast-moving,entrepreneurial ventures in which a concept is taking root or growth is accelerating.
The emerging stars of the company, these businesses are attractinginvestors’ attention. They could transform their company, but notwithout considerable investment. Though substantial profits may be fouror five years away, they have fast growing customer bases and revenues,and may already generate some profit. More importantly, they areexpected to become as profitable as horizon 1 businesses in time.
Horizon 2 initiatives are usually characterised by a single-mindeddrive to increase revenue and market share. They need continuinginvestment to finance rollouts or otherwise accelerate the expansion ofthe business. In a few years, horizon 2 initiatives should complement orreplace a company’s current core businesses.
The challenge is to take advantage of an insight beforecompetitors do. The focus shifts to building the business quickly andestablishing positional advantage. The pace becomes frenetic asincreased risk taking, rapid judgement calls and larger investmentsbecome necessary.
Horizon 3 contains the seeds of tomorrow’s businesses – optionson future opportunities. Although embryonic, horizon 3 options aremore than ideas – they are real activities and investments, howeversmall. They are the research projects, test-market pilots, alliances andminority stakes that mark the first steps toward actual businesses, eventhough they may not produce profits for a decade, if ever. Should theyprove successful, they will be expected to reach horizon 1 levels ofprofitability.
Building successful businesses means seeding numerous options. Some will fail for internal reasons; others will fall victim toshifting industry winds. Given these odds, a great deal of horizon 3activity is needed.
If we look at the bottom of the growth league table on pp. 22–3, we have many companies whose growth expectations are negative.What is the market’s judgement here? These companies will havedifficulty adding any value to the assets they control, and that the inevitable attrition of old businesses will proceed faster than thecreation of new businesses to replace them. Clearly, some of thesecompanies do have a set of initiatives to move ahead and some have
31UNDERSTANDING GROW TH EXPECTATIONS: THE THREE HORIZONS OF GROW TH
been harshly misjudged by the market. But few of them are as healthy asthose in the top quartile.
For a company to grow it must have three healthy horizons. Wesee six common patterns that can prevent sustained growth – two ofwhich we discuss below. These are shown in Exhibit 2 on p. 30.
The first and worst of the patterns is when a company is ‘under siege’.Here the core businesses of horizon 1 are underperforming, threatenedby competitors, or facing imminent decline. Little is happening in the pipe-line, so no new businesses are available to pick up the slack. Companiesunder siege suffer a double blow: not only will financial markets punishthem for earnings decline, but investors will also look unfavourably atthe capital investments they need to develop new businesses. Thepriority should be on survival and turnaround, not on growth.
While every unhealthy pattern is a concern for a company,perhaps most common in businesses globally is ‘running out of steam’.In this pattern, performance is not usually a problem – the company isoften a respected, high-performing organisation. The problem is that itis unclear where future growth will come from because improvementsto horizon 1 businesses are experiencing diminishing returns and thereare no new drivers of growth in horizons 2 or 3. What is needed is adedication to growth to equal the dedication to operating performance.There is no better time to resolve to grow than when the core is strong.
Changing trajectory
There is good news, though. It is possible to go from a bad situation to agood one – and this holds true even in the slower growing industries. Forexample, Foster’s turnaround from its 1992 nadir – a company in crisis ina single mature industry to a well-regarded and growing company – is astrong demonstration of the potential to create new horizons of growth.
Australia’s companies must do more to create growth. This isclear when one sees that a large number of the country’ s top 100companies have growth expectations of 10 percent or less. Developinghealthy horizons in small, medium and large companies will translate tofaster economic growth, more shareholder wealth for investors,including retirees and more jobs and greater prosperity for the country.It will help reduce our most pressing social problem – chronic youthunemployment and the disillusionment it spawns. By creating a sense ofpurpose, achievement and belonging, growth can create a moreenriching work environment for all Australians.
32 CREATION AND DESTRUCTION: SUSTAINING CORPORATE GROW TH IN AUSTRALIA

GROW TH 33
Part 3Australia’s future
Australia’s growth horizons in the new millennium
David White, Mehrdad Baghai and Belinda Everingham
This is an abridged version of an article,‘Enterprise creation is
imperative to success’ first published in Australian Financial Review,
20 August 1999.
Australians can rightfully take pride in the performance of theireconomy. The country’s gross domestic product growth rate this decadehas been higher than most other countries in the Organization forEconomic Development and Cooperation, including the United States(Exhibit 1).
Australia’s economy grew an astounding 49 percent between1985 and 1998 compared with the oecd average of 38 percent. And eventhough the perception is that the Australian labour market is not ashealthy as in the United States. Australia’s rate of job creation has in factbeen equivalent to that of the United States during the 1990s (Exhibit 2).
How has Australia achieved this surprising growth? Economistsattribute the success to ‘productivity improvements’ and ‘structuraladjustments’ encouraged by reductions in tariffs and quotas, exchangerate flotation, competition policy, privatisations and financial andlabour market deregulation. These government-led reforms offered theAustralian corporate sector the chance to become more productive, and many companies have worked hard to streamline and cut costs.Indeed the 1999 Productivity Commission report found that Australia’sproductivity growth has been a massive 2.4 percent annually for theprevious four years, compared with a long-term average of 1.4 percent.
But there is more to improving productivity than cutting costs inexisting businesses: the creation of new businesses employing superiortechnology or better business models can also make an economy moreproductive (Box a overleaf). Indeed, in recent years, the Australianeconomy has benefited from a big increase in revenues and employmentcoming from the creation of productive new businesses; many of themin newer sectors of the economy.
Yet many corporate executives in Australia still view cost cuttingas the main tool for improving financial performance. It surely is easierthan inventing new business models and creating new businesses. There
34 CREATION AND DESTRUCTION: SUSTAINING CORPORATE GROW TH IN AUSTRALIA

Exhibit 1Cumulative GDP growth in the OECD, 1985–98Percent
49.1
46.6
45.2
43.5
41.6
38.6
37.5
36.5
34.0
33.0
32.6
32.5
31.7
30.9
26.9
25.2
21.4
17.8
Australia
Spain
Norway
The Netherlands
United States
Austria
Japan
United Kingdom
Canada
Belgium
Germany
Finland
Denmark
France
Italy
New Zealand
Sweden
Switzerland
OECD average = 37.6
Source:WEFA
19981989
Source: OECD, McKinsey
Australia 115.47
United States 115.07
115
110
105
100
95
Exhibit 2Comparison of Australian and US growth in employmentIndex: Common base = 100

CREATION AND DESTRUCTION: SUSTAINING CORPORATE GROW TH IN AUSTRALIA36
always will be room for squeezing costs. But sustaining Australia’seconomic success will require entrepreneurs, the corporate sector andgovernment to take action now to encourage creation of enterprises.That means putting business creation at the top of the economic agenda.
To see where the Australian economy stands, we examined it theway we usually assess the health of a company. We broke down theeconomy into ‘horizons of growth’ (Box b).
Just as the three horizons approach explains the growth trajec-tory at a company, the concept can also be useful in assessing the healthof an economy – in effect, the sum of many businesses.
Box AThe link between GDP, productivity and business creation
In an economist’s definition, growth in GDP can be driven
by the application of additional inputs of labour and
capital or by an increase in output per unit of input
(ie, productivity).
Productivity increases in turn can occur equally through
the reduction in cost of the existing businesses, or through
the start-up of fundamentally superior new business
models.These new businesses are capable of meeting
consumer needs with fewer resources than existing
business because of application of superior technology or
business system design.
Creation of more productive new enterprises – through
new start-up companies and through the reinvention of
established companies – has been a key driver of our
superior economic performance over the past decade. And
new business creation will continue to be a vital driver of
Australia’s economy for the next decade
AUSTRALIA’S GROW TH HORIZONS IN THE NE W MILLENNIUM 37
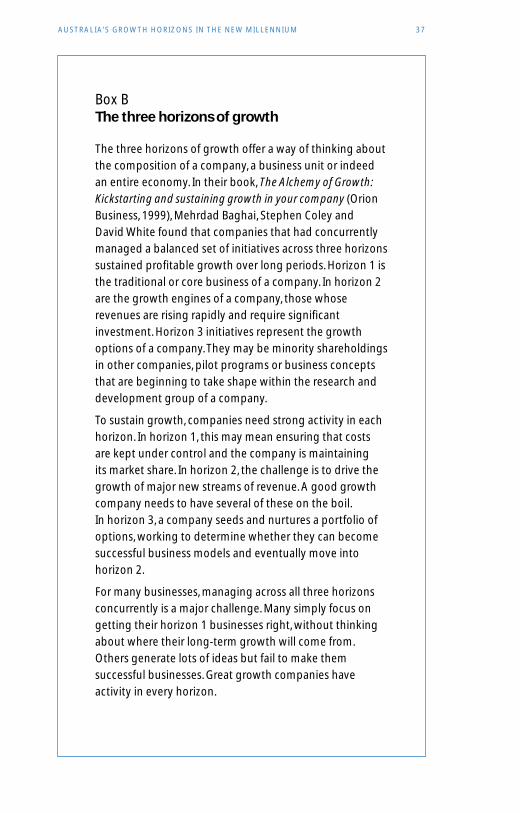
Box BThe three horizons of growth
The three horizons of growth offer a way of thinking about
the composition of a company, a business unit or indeed
an entire economy. In their book, The Alchemy of Growth:
Kickstarting and sustaining growth in your company (Orion
Business, 1999), Mehrdad Baghai, Stephen Coley and
David White found that companies that had concurrently
managed a balanced set of initiatives across three horizons
sustained profitable growth over long periods. Horizon 1 is
the traditional or core business of a company. In horizon 2
are the growth engines of a company, those whose
revenues are rising rapidly and require significant
investment. Horizon 3 initiatives represent the growth
options of a company.They may be minority shareholdings
in other companies, pilot programs or business concepts
that are beginning to take shape within the research and
development group of a company.
To sustain growth, companies need strong activity in each
horizon. In horizon 1, this may mean ensuring that costs
are kept under control and the company is maintaining
its market share. In horizon 2, the challenge is to drive the
growth of major new streams of revenue. A good growth
company needs to have several of these on the boil.
In horizon 3, a company seeds and nurtures a portfolio of
options, working to determine whether they can become
successful business models and eventually move into
horizon 2.
For many businesses, managing across all three horizons
concurrently is a major challenge. Many simply focus on
getting their horizon 1 businesses right, without thinking
about where their long-term growth will come from.
Others generate lots of ideas but fail to make them
successful businesses. Great growth companies have
activity in every horizon.
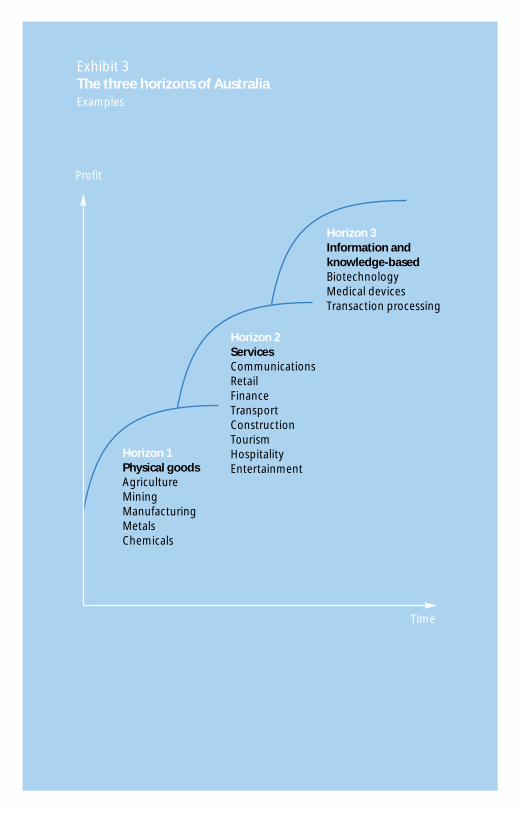
Time
Horizon 1Physical goods AgricultureMiningManufacturingMetalsChemicals
Horizon 2Services CommunicationsRetailFinanceTransportConstructionTourismHospitalityEntertainment
Horizon 3Information and knowledge-based BiotechnologyMedical devicesTransaction processing
Exhibit 3The three horizons of AustraliaExamples
Profit
Horizon 1: Australia’s foundation in the physical goods industries
In horizon 1 are Australia’s mature businesses (Exhibit 3). These includemuch of the resource and mining sector, most of the agricultural sector,many of the formerly tariff-protected manufacturing industries such astextiles, clothing, footwear and automobiles, and many other capital-intensive businesses such as oil refining and chemicals. Public sectorutilities might also be placed in horizon 1. Since the late 1800s,Australia’s economy and wealth grew predominantly through thedevelopment of these industries.
As important as they are, these industries are now in decline.Mining and agriculture have been declining in relative importance formany years and now represent just over 7 percent of total employment.Manufacturing accounts for only 16 percent of all jobs and is also inrelative decline.
Much has been done to create the right environment forimproved productivity in these industries. One result has been thousandsof job losses. Productivity improvements in traditional industries wouldnot alone have sustained Australia’s economic growth in the face ofreduced terms of trade and slow growth in these sectors. The robustnessof Australia’s growth through the last decade is to a large extent due to anumber of strongly emerging growth industries, which form Australia’shorizons 2 and 3.
Horizon 2: Profiting from the service economy
It is the service economy that has been driving much of Australia’s growth. Much greater stock market wealth has been createdin horizon 2 service industries than in horizon 1 physical goodsindustries, reflecting improved revenue and profit streams (Exhibit 4).The service sector – including communications, recreation, construction,health and education services, personal services, business services,hospitality, retail and wholesale trade, finance and insurance andtransport – now represents more than three-quarters of Australia’s jobs.In terms of employment, the service sector has grown a strong 4.6 percent a year between 1991–92 and 1996 –97.
But where has the growth in employment and shareholder wealthcome from? In horizon 2, Australia has seen the emergence of powerful newenterprises with attractive business models in high growth industries.
AUSTRALIA’S GROW TH HORIZONS IN THE NE W MILLENNIUM 39
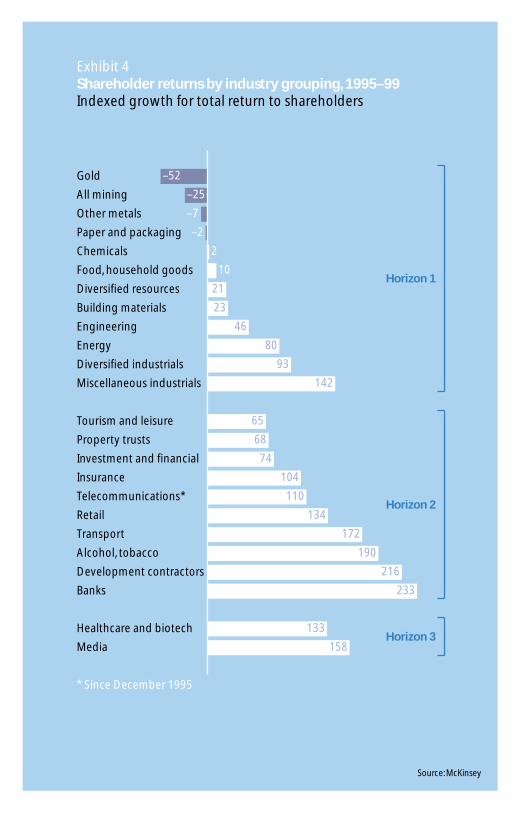
Exhibit 4Shareholder returns by industry grouping, 1995–99Indexed growth for total return to shareholders
–52
–25
21
23
46
80
93
142
65
68
74
104
110
134
172
190
216
233
133
158
Gold
All mining
Other metals
Paper and packaging
Chemicals
Food, household goods
Diversified resources
Building materials
Engineering
Energy
Diversified industrials
Miscellaneous industrials
Tourism and leisure
Property trusts
Investment and financial
Insurance
Telecommunications*
Retail
Transport
Alcohol, tobacco
Development contractors
Banks
Healthcare and biotech
Media
* Since December 1995
–2
2
10
–7
Horizon 1
Horizon 2
Horizon 3
Source: McKinsey
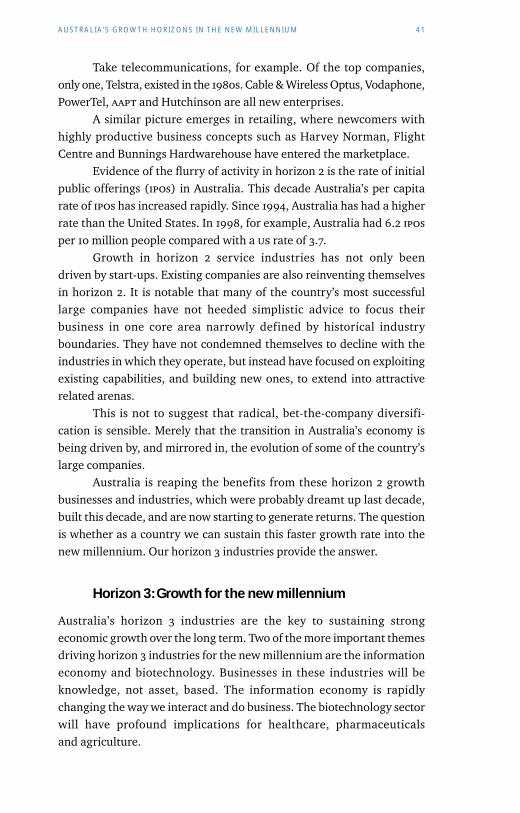
Take telecommunications, for example. Of the top companies,only one, Telstra, existed in the 1980s. Cable & Wireless Optus, Vodaphone,PowerTel, aapt and Hutchinson are all new enterprises.
A similar picture emerges in retailing, where newcomers withhighly productive business concepts such as Harvey Norman, FlightCentre and Bunnings Hardwarehouse have entered the marketplace.
Evidence of the flurry of activity in horizon 2 is the rate of initialpublic offerings (ipos) in Australia. This decade Australia’s per capitarate of ipos has increased rapidly. Since 1994, Australia has had a higherrate than the United States. In 1998, for example, Australia had 6.2 iposper 10 million people compared with a us rate of 3.7.
Growth in horizon 2 service industries has not only been driven by start-ups. Existing companies are also reinventing themselvesin horizon 2. It is notable that many of the country’s most successfullarge companies have not heeded simplistic advice to focus theirbusiness in one core area narrowly defined by historical industryboundaries. They have not condemned themselves to decline with theindustries in which they operate, but instead have focused on exploitingexisting capabilities, and building new ones, to extend into attractiverelated arenas.
This is not to suggest that radical, bet-the-company diversifi-cation is sensible. Merely that the transition in Australia’s economy isbeing driven by, and mirrored in, the evolution of some of the country’slarge companies.
Australia is reaping the benefits from these horizon 2 growthbusinesses and industries, which were probably dreamt up last decade,built this decade, and are now starting to generate returns. The questionis whether as a country we can sustain this faster growth rate into thenew millennium. Our horizon 3 industries provide the answer.
Horizon 3: Growth for the new millennium
Australia’s horizon 3 industries are the key to sustaining strongeconomic growth over the long term. Two of the more important themesdriving horizon 3 industries for the new millennium are the informationeconomy and biotechnology. Businesses in these industries will beknowledge, not asset, based. The information economy is rapidlychanging the way we interact and do business. The biotechnology sectorwill have profound implications for healthcare, pharmaceuticalsand agriculture.
AUSTRALIA’S GROW TH HORIZONS IN THE NE W MILLENNIUM 41

Growth theory economists such as Paul Romer talk of increasingreturns to innovation. Put simply, countries that innovate will grow faster than those that don’t. The world experienced this during the last century with the economic divergence of East and West.Through developing more horizon 3 businesses, Australia must be one of the innovative nations during this next industrial or rather,technological, revolution.
A call to action
The nation’s economic agenda for the next decade must continue to shiftfrom productivity increases through market reforms and cost cutting tothe creation of new business models and enterprises. Australia’s focusmust be on how the economy can encourage enterprise creation, bothfrom within existing businesses and through new businesses. Action isneeded from business, government and community leaders.
Business leaders, not government, have the principal respon-sibility for driving economic growth. Even companies in horizon 1industries cannot abdicate growth to the new industries. In the maturehorizon 1 resources sector, for example, exciting start-ups as well asambitious projects in existing mining and resources enterprises areproving that profitable growth is possible. In agriculture, in the face ofdecline, new growth sectors have emerged to create jobs and replacelost revenue streams. These include wine, cotton and rice.
Even though Australia’s manufacturing sector as a whole is facinggreater international competition there are a number of bright spots. A 1994 McKinsey & Company study of ‘emerging exporters’ found a vibrant group of small and medium-sized manufacturers that were growing successfully through exports to niche markets around the world.
While business must lead, government does have an importantrole, too. Governments at all levels need to create the right environmentfor new enterprise creation, and to encourage entrepreneurs. Forexample, government can help to address the problem that Australia’sbusiness creation industry is much less vibrant than in the United States.
The relatively poor availability of venture capital funding herehighlights how far Australia lags the United States. In Australia, there is$16 of venture capital funding per capita; in the United States, it isalmost eight times this amount. The government’s capital gains taxchanges should help. But we need more entrepreneurs too.
42 CREATION AND DESTRUCTION: SUSTAINING CORPORATE GROW TH IN AUSTRALIA

Australians must learn again to respect entrepreneurs. Indeed,today’s entrepreneurs are, for the most part, people of integrity andvision, pursuing dreams that are generating jobs and helping totransform the economy. In addition, existing corporations must fosterskills and ambition in their employees to encourage new enterprisecreation from within.
Australia is at a critical junction. While the country’s success in terms of gdp growth has surprised everyone, there is much that canbe done to ensure this success continues. To ensure that Australia’shorizon 3 is full and vibrant, the leaders of small, medium and largebusinesses need to act not only to steward the assets that they inherited,but to create businesses that they can leave as a legacy. Such a legacywill help create prosperity and jobs for Australia’s children.
AUSTRALIA’S GROW TH HORIZONS IN THE NE W MILLENNIUM 43
About the authors
Byron Pirola
Byron Pirola has been a Director of Port Jackson Partners since 1992.Previously he worked at McKinsey & Company for six years. He holds a PhDin Biochemistry from the Commonwealth Centre for Gene Technologyat Adelaide University and a Bachelor of Science from the University ofNew South Wales where he graduated with first-class honours.
Philip Stern
Philip Stern has been a Director of Port Jackson Partners since 1992.Previously he was with McKinsey & Company and Cresap. He holds an mba from Harvard University Graduate School of BusinessAdministration (with distinction) and a Bachelor of Science inMechanical Engineering from Rensselaer Polytechnic Institute in New York State.
David White
David White joined as a Director of Port Jackson Partners in 2002.Previously he was a Senior Partner and Director of McKinsey &Company where he worked for 16 years in the Australia, New York andToronto offices. From 1995 to 2000 David was worldwide co-leader ofMcKinsey’s Growth and Business Building Practice. He is the co-author(with Mehrdad Baghai and Stephen Coley) of the international businessbestseller, The Alchemy of Growth, which has been published in tenlanguages, as well as more than 20 journal articles and monographs onstrategy and finance topics. He holds a degree in Economics (first inyear) and an honours degree in Law from the University of Sydney.
Laura Eadie
Laura Eadie is a Business Analyst with Port Jackson Partners. She holdsa Bachelor of Science in Industrial Chemistry from the University of NewSouth Wales for which she was awarded a University Medal.
44

45
Mehrdad Baghai
Mehrdad Baghai is Executive Director, Business Development andCommercialisation at the csiro. Previously he was a Partner withMcKinsey & Company and ceo of a us healthcare technology firm. He isthe co-author (with Stephen Coley and David White) of the internationalbusiness bestseller, The Alchemy of Growth. He holds a degree inElectrical Engineering & Computer Science from Princeton University,an mpp from Harvard University’s Kennedy School of Government and ajd from Harvard Law School.
Belinda Everingham
Belinda Everingham is an independent consultant. Previously sheworked with McKinsey & Company. She has an mpa from Harvard’sKennedy School where she was awarded a Knox scholarship and aBachelor of Economics with Honours from Australian National University.

Acknowledgements
The editor wishes to thank:
§ Port Jackson Partners Limited for sponsoring the costs of research and publication.
§ The Australian Financial Review for its support of this series of essays and for permission to republish articles.
§ The Business Council of Australia for providing a forum for the lead article.
§ McKinsey & Company for sponsoring research for early essaysincluding the development of the three horizons concept.
46