Embed Size (px)
Citation preview
1
Sustainable Steel-Composite Bridges
Handbook
2
Sustainable Steel-Composite Bridges
Handbook
Institute of Structural Design, University of Stuttgart, Germany
Department of Civil Engineering, University of Coimbra, Portugal
AG der Dillinger Hüttenwerke, Germany
ArcelorMittal Belval and Differdange S.A., Luxembourg
French Institute of Science and Technology for Transport, Development and Networks (IFSTTAR), France
Rambøll Denmark, AS, Denmark
BRISA Engenharia e Gestão S. A., Portugal
Service d'études sur les transports, les routes et leurs aménagements, France
Fedreal Highway Research Institute (BASt), Germany
Sustainable Steel-Composite Bridges in Built Environment
Abstract Page 3
Abstract
In the worldwide infrastructure network especially bridges are of essential importance. The request for sus-tainable structures is urgent as for bridge lifecycle design it is intended to cover a lifespan of more than 100 years. Shifting from an initial cost-effective mode to a lifecycle cost-effective mode is demanding in regard of increasing importance of maintenance, rehabilitation and renewal of bridges also in view of the rapid growing traffic vol-ume on bridges.
Within the European funded research project “Sustaina-ble Steel-Composite Bridges in Built Environment” (SBRI) a holistic approach is applied by combining analyses of environmental, economic and functional qualities. The obtained results provide a basis for European recom-mendations for the design of sustainable bridges.
The present handbook describes a lifecycle model for a sustainable bridge design integrating environmental, economic and functional aspects. With Lifecycle Perfor-mance (LCP), Lifecycle Assessment (LCA) and Lifecycle Costs (LCC) the most relevant elements are introduced. The complete process is illustrated by a case study cov-ering the entire lifespan, from the construction to the demolition of three different types of bridges crossing a motorway.
Sustainable Steel-Composite Bridges in Built Environment
Contents Page 4
Contents
1 Introduction 5
2 Lifecycle Performance (LCP) and Maintenance Strategies 7
2.1 General 7 2.2 Construction 7 2.3 Operation 9 2.4 End-of-life 16
3 Lifecycle Assessment (LCA) 17 3.1 General framework 17 3.2 Goal and scope of the LCA 18 3.3 Methodology for impact assessment 20
4 Lifecycle Costs (LCC) 22 4.1 General 22 4.2 Economic evaluation method for LCC 24 4.3 From design to end-of-life costs 26 4.4 User costs 30
5 Case Study and Variations 33 5.1 General 33 5.2 Lifecycle Performance (LCP) 36 5.3 Lifecycle Analysis (LCA) 37 5.4 Lifecycle Costs (LCC) 45 5.5 Synopsis 50
6 Conclusions and Outlook 53
Sustainable Steel-Composite Bridges in Built Environment
Introduction Page 5
1 Introduction
The present handbook is an essential result of the Euro-pean funded research project SBRI “Sustainable Steel-Composite Bridges in Built Environment”. The focus is placed on the introduction of a fully integrated lifecycle model integrating environmental, economic and func-tional aspects and illustrated by a case study. The objec-tive of the handbook is to provide an overview about the most important relationships and to describe the com-plete process in essence. An overview is given in [1] and more detailed explanations including data compilation, background information and further case studies are published in the final report of the SBRI-project [2].
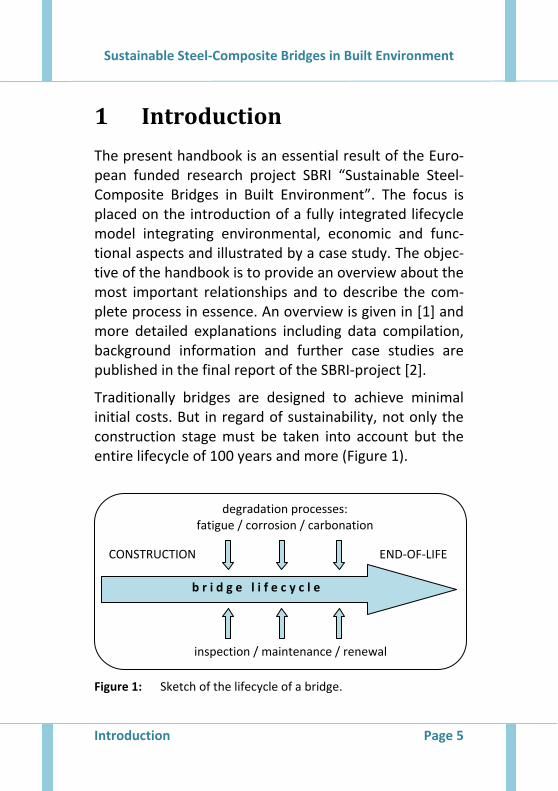
Traditionally bridges are designed to achieve minimal initial costs. But in regard of sustainability, not only the construction stage must be taken into account but the entire lifecycle of 100 years and more (Figure 1).
Figure 1: Sketch of the lifecycle of a bridge.
CONSTRUCTION END-OF-LIFE
b r i d g e l i f e c y c l e
degradation processes: fatigue / corrosion / carbonation
inspection / maintenance / renewal
Sustainable Steel-Composite Bridges in Built Environment
Introduction Page 6
Bridges are facing different degradation processes throughout the years. The structural function of the de-tails, and therefore the structure itself, can be preserved and improved by maintenance and/or renewal actions concerning defects discovered during inspections. The lifecycle of steel-composite bridges is analyzed from the construction over the operation of the bridge to the end-of-life.
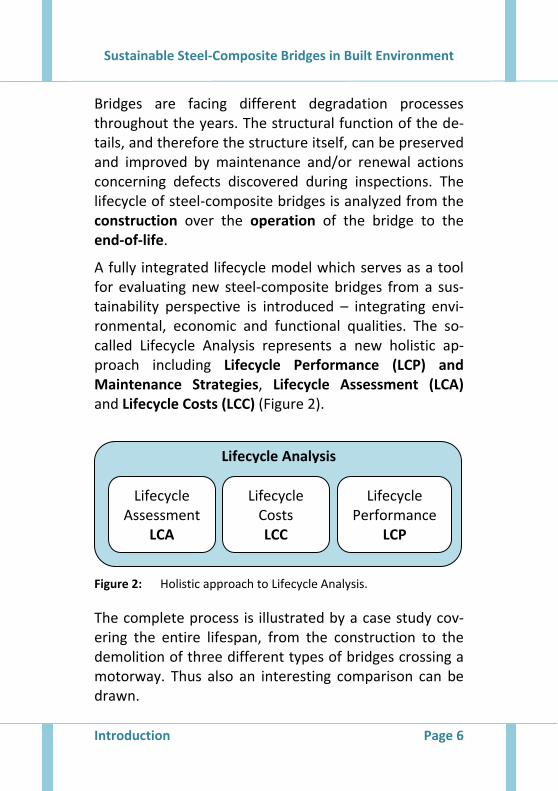
A fully integrated lifecycle model which serves as a tool for evaluating new steel-composite bridges from a sus-tainability perspective is introduced – integrating envi-ronmental, economic and functional qualities. The so-called Lifecycle Analysis represents a new holistic ap-proach including Lifecycle Performance (LCP) and Maintenance Strategies, Lifecycle Assessment (LCA) and Lifecycle Costs (LCC) (Figure 2).
Figure 2: Holistic approach to Lifecycle Analysis.
The complete process is illustrated by a case study cov-ering the entire lifespan, from the construction to the demolition of three different types of bridges crossing a motorway. Thus also an interesting comparison can be drawn.
Lifecycle Assessment
LCA
Lifecycle Costs LCC
Lifecycle Performance
LCP
Lifecycle Analysis
Sustainable Steel-Composite Bridges in Built Environment
Lifecycle Performance LCP Page 7
2 Lifecycle Performance (LCP) and Maintenance Strategies
2.1 General
The evaluation of lifecycle performance starts with the construction of the bridge including also material pro-duction. The operation phase starts when the bridge goes into service and this stage ends when the bridge reaches the end of its functionality – end-of-life.
Lifecycle Performance concerns both: a) various degra-dation processes such as carbonation, corrosion and fatigue and b) the corresponding inspection and mainte-nance intervals and methods.
2.2 Construction
The information regarding the construction includes data from the production of raw materials to the erec-tion of the bridge itself. To reflect realistic scenarios, this study uses real cases data which synthesize the actual experience of some partners involved in the manage-ment of their road infrastructure system, where bridges are a major asset. All information concerning the con-struction phase is based on the detailed design and structural solutions already tested and built. Therefore the timetables with detailed work plans with the chrono-logical allocation of resources considered are realistic.
Sustainable Steel-Composite Bridges in Built Environment
Lifecycle Performance LCP Page 8
As we are not dealing with motorways built from scratch but in a built environment, the construction processes of the composite decks are strongly conditioned by the need to reduce the duration of the work done over the motorway. Thus, the structural steel is normally assem-bled near the work site and lifted in few pieces for its final position. The deck, for the same reason, is often entirely prefabricated to avoid concreting works over motorway traffic.
The concrete structures used for establishing a bench-mark with the composite structures surveyed were built with traditional methods associated with this type of structures, always aiming to minimize the time gap in which the motorway service level will be reduced. Fol-lowing this purpose it was considered a solution fully concreted on site with conventional formwork and scaf-folding and another with precast beams.
Considering real data from built structures, means that the assumptions associated with each detailed design differ from each other. In order to address this particular feature, some assumptions were made for the benefit of this project, which allowed avoiding the contamination of the results with external factors that do not depend on the structural typology. As an example, it has been assumed that all structures are based over the same geotechnical horizon. Apart from the constructive as-pects themselves, information regarding the legal framework that contextualizes such interventions was provided, in order to allow the estimation of all costs not directly related with materials or workloads.
Sustainable Steel-Composite Bridges in Built Environment
Lifecycle Performance LCP Page 9
2.3 Operation
2.3.1 General
The operation phase includes all maintenance and reha-bilitation actions as well as the necessary regular bridge inspections that allow the monitoring of bridge condi-tion rating and eventual need for rehabilitations actions. Three types of maintenance and inspections strategies were considered:
Standard – a scenario with a 100-year service life, according to the normal service life of bridges, for which there will be enough money to undergo all the necessary inspections and maintenance/repair actions;
Lack of money – along the bridge lifecycle, there is not enough money to undergo the necessary maintenance/repair actions and the bridge will be critically deteriorated and with traffic restrictions on year 100. Inspection activity will have to be in-creased in the last years for the knowledge of the real bridge condition, and also maintenance actions are introduced to extend the service life of some el-ements;
Prolonged life – the decision of maintaining the bridge for an additional 30 years (130 years total and no more) is taken around year 80. After this year, inspection and maintenance actions are adapted to accomplish this service life extension.
In the following chapters the basic parameters for the three scenarios are condensed.
Sustainable Steel-Composite Bridges in Built Environment
Lifecycle Performance LCP Page 10
2.3.2 Standard scenario
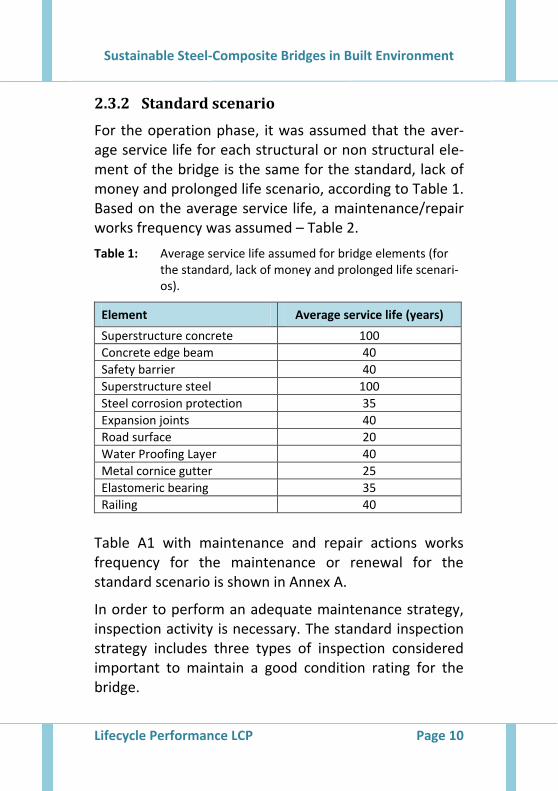
For the operation phase, it was assumed that the aver-age service life for each structural or non structural ele-ment of the bridge is the same for the standard, lack of money and prolonged life scenario, according to Table 1. Based on the average service life, a maintenance/repair works frequency was assumed – Table 2.
Table 1: Average service life assumed for bridge elements (for the standard, lack of money and prolonged life scenari-os).
Element Average service life (years)
Superstructure concrete 100
Concrete edge beam 40
Safety barrier 40
Superstructure steel 100
Steel corrosion protection 35
Expansion joints 40
Road surface 20
Water Proofing Layer 40
Metal cornice gutter 25
Elastomeric bearing 35
Railing 40
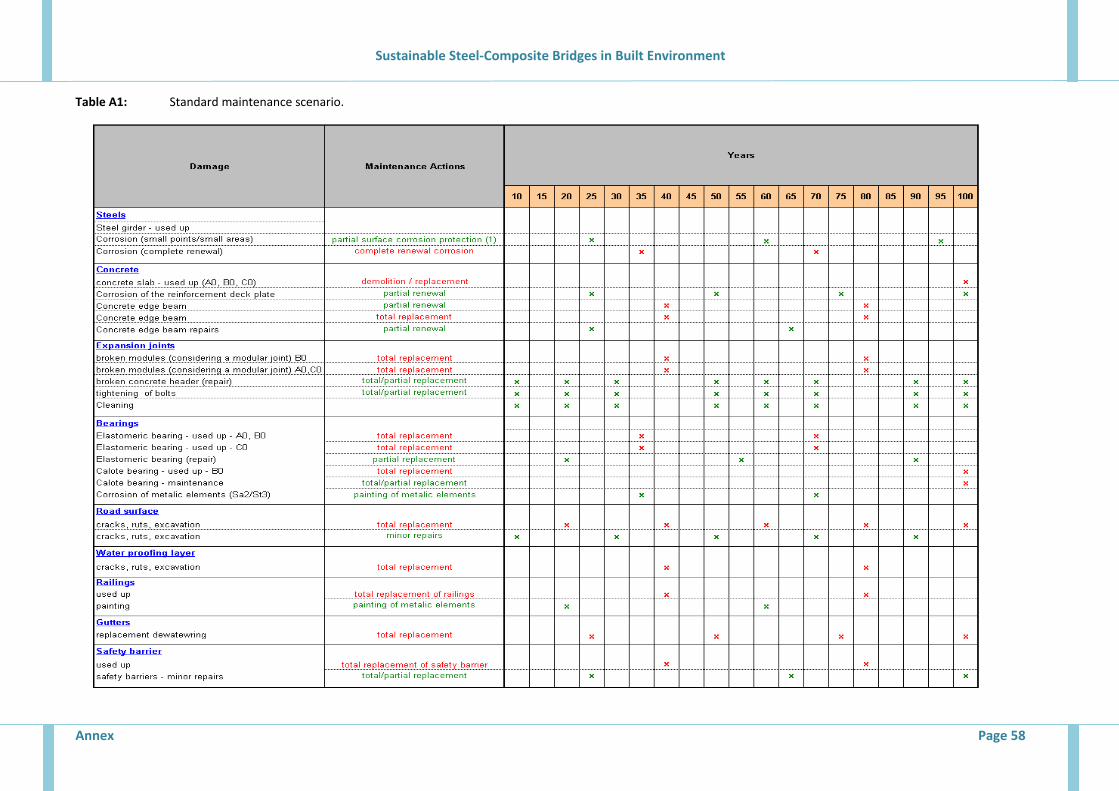
Table A1 with maintenance and repair actions works frequency for the maintenance or renewal for the standard scenario is shown in Annex A.
In order to perform an adequate maintenance strategy, inspection activity is necessary. The standard inspection strategy includes three types of inspection considered important to maintain a good condition rating for the bridge.
Sustainable Steel-Composite Bridges in Built Environment
Lifecycle Performance LCP Page 11
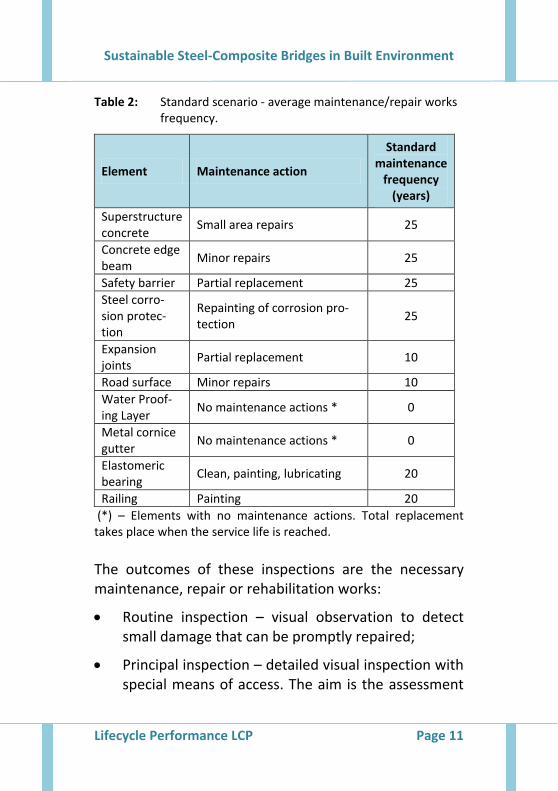
Table 2: Standard scenario - average maintenance/repair works frequency.
Element Maintenance action
Standard maintenance
frequency (years)
Superstructure concrete
Small area repairs 25
Concrete edge beam
Minor repairs 25
Safety barrier Partial replacement 25
Steel corro-sion protec-tion
Repainting of corrosion pro-tection
25
Expansion joints
Partial replacement 10
Road surface Minor repairs 10
Water Proof-ing Layer
No maintenance actions * 0
Metal cornice gutter
No maintenance actions * 0
Elastomeric bearing
Clean, painting, lubricating 20
Railing Painting 20
(*) – Elements with no maintenance actions. Total replacement takes place when the service life is reached.
The outcomes of these inspections are the necessary maintenance, repair or rehabilitation works:
Routine inspection – visual observation to detect small damage that can be promptly repaired;
Principal inspection – detailed visual inspection with special means of access. The aim is the assessment
Sustainable Steel-Composite Bridges in Built Environment
Lifecycle Performance LCP Page 12
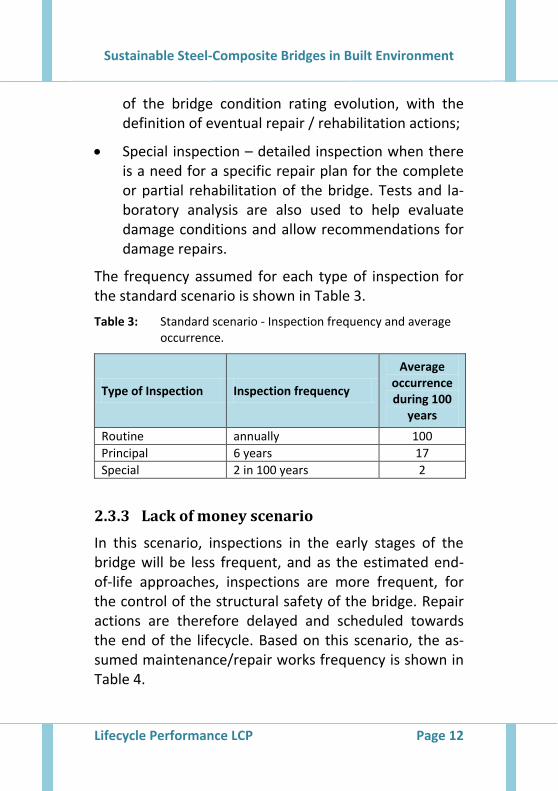
of the bridge condition rating evolution, with the definition of eventual repair / rehabilitation actions;
Special inspection – detailed inspection when there is a need for a specific repair plan for the complete or partial rehabilitation of the bridge. Tests and la-boratory analysis are also used to help evaluate damage conditions and allow recommendations for damage repairs.
The frequency assumed for each type of inspection for the standard scenario is shown in Table 3.
Table 3: Standard scenario - Inspection frequency and average occurrence.
Type of Inspection Inspection frequency
Average occurrence during 100
years
Routine annually 100
Principal 6 years 17
Special 2 in 100 years 2
2.3.3 Lack of money scenario
In this scenario, inspections in the early stages of the bridge will be less frequent, and as the estimated end-of-life approaches, inspections are more frequent, for the control of the structural safety of the bridge. Repair actions are therefore delayed and scheduled towards the end of the lifecycle. Based on this scenario, the as-sumed maintenance/repair works frequency is shown in Table 4.
Sustainable Steel-Composite Bridges in Built Environment
Lifecycle Performance LCP Page 13
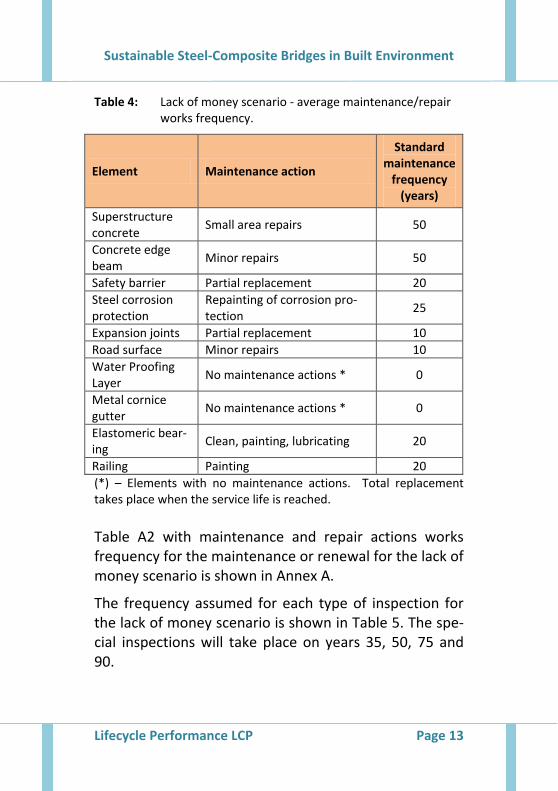
Table 4: Lack of money scenario - average maintenance/repair works frequency.
Element Maintenance action
Standard maintenance
frequency (years)
Superstructure concrete
Small area repairs 50
Concrete edge beam
Minor repairs 50
Safety barrier Partial replacement 20
Steel corrosion protection
Repainting of corrosion pro-tection
25
Expansion joints Partial replacement 10
Road surface Minor repairs 10
Water Proofing Layer
No maintenance actions * 0
Metal cornice gutter
No maintenance actions * 0
Elastomeric bear-ing
Clean, painting, lubricating 20
Railing Painting 20
(*) – Elements with no maintenance actions. Total replacement takes place when the service life is reached.
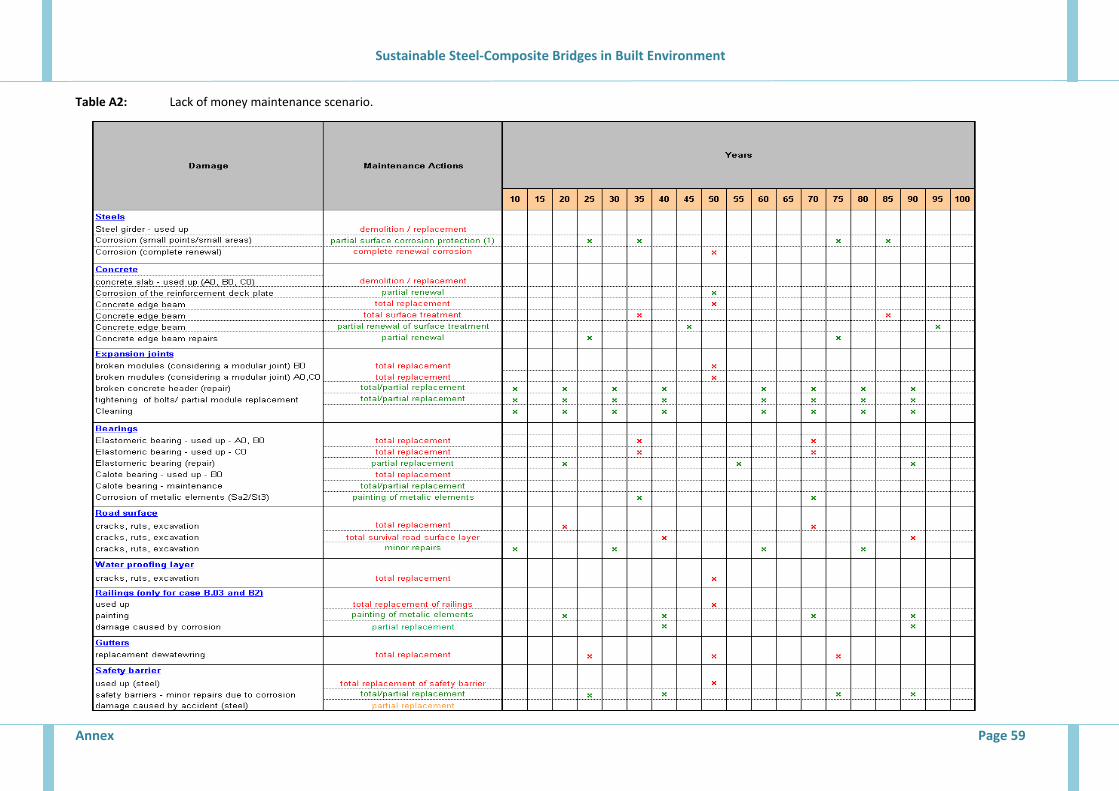
Table A2 with maintenance and repair actions works frequency for the maintenance or renewal for the lack of money scenario is shown in Annex A.
The frequency assumed for each type of inspection for the lack of money scenario is shown in Table 5. The spe-cial inspections will take place on years 35, 50, 75 and 90.
Sustainable Steel-Composite Bridges in Built Environment
Lifecycle Performance LCP Page 14
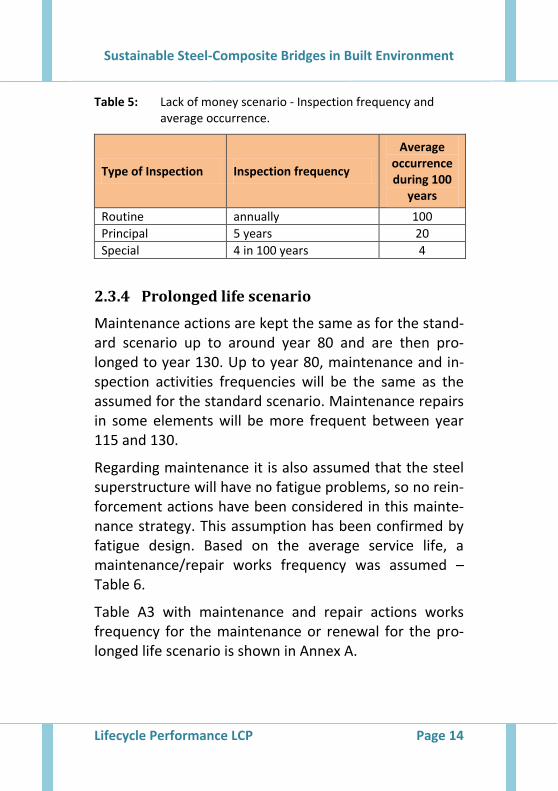
Table 5: Lack of money scenario - Inspection frequency and average occurrence.
Type of Inspection Inspection frequency
Average occurrence during 100
years
Routine annually 100
Principal 5 years 20
Special 4 in 100 years 4
2.3.4 Prolonged life scenario
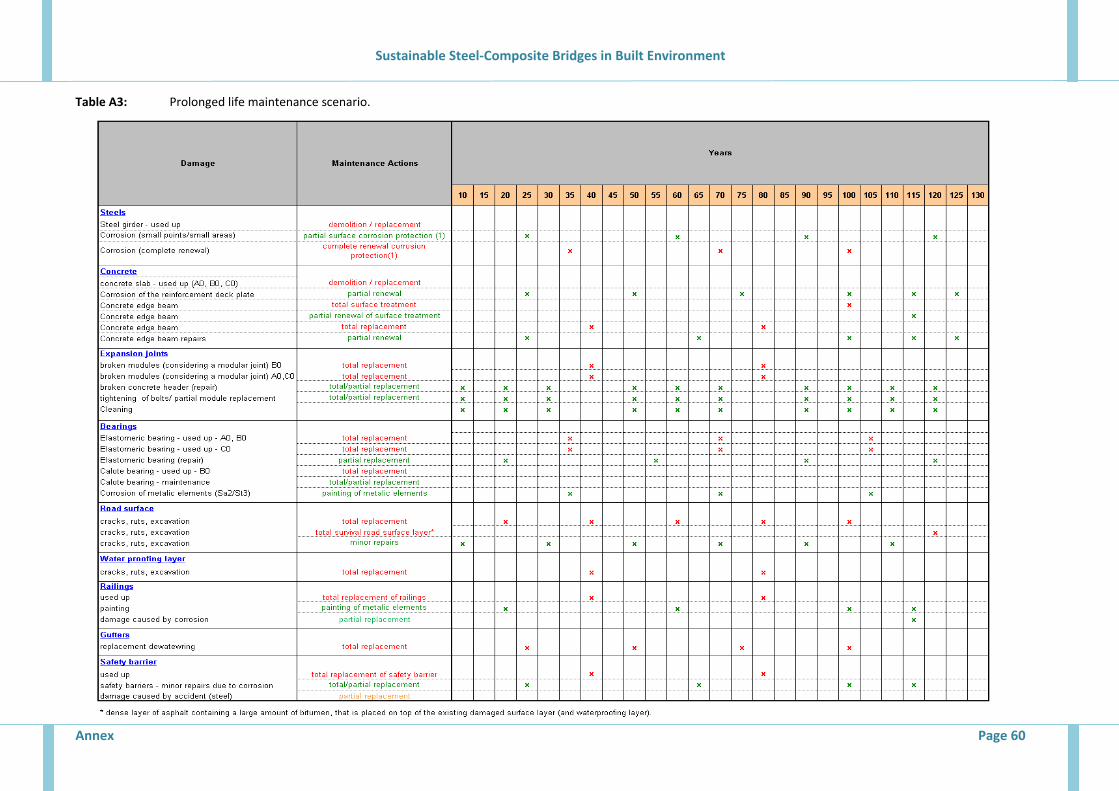
Maintenance actions are kept the same as for the stand-ard scenario up to around year 80 and are then pro-longed to year 130. Up to year 80, maintenance and in-spection activities frequencies will be the same as the assumed for the standard scenario. Maintenance repairs in some elements will be more frequent between year 115 and 130.
Regarding maintenance it is also assumed that the steel superstructure will have no fatigue problems, so no rein-forcement actions have been considered in this mainte-nance strategy. This assumption has been confirmed by fatigue design. Based on the average service life, a maintenance/repair works frequency was assumed – Table 6.
Table A3 with maintenance and repair actions works frequency for the maintenance or renewal for the pro-longed life scenario is shown in Annex A.
Sustainable Steel-Composite Bridges in Built Environment
Lifecycle Performance LCP Page 15
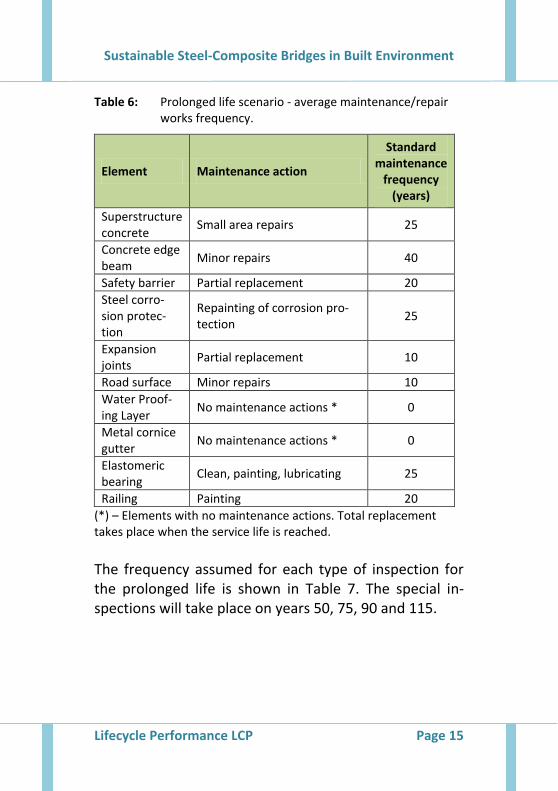
Table 6: Prolonged life scenario - average maintenance/repair works frequency.
Element Maintenance action
Standard maintenance
frequency (years)
Superstructure concrete
Small area repairs 25
Concrete edge beam
Minor repairs 40
Safety barrier Partial replacement 20
Steel corro-sion protec-tion
Repainting of corrosion pro-tection
25
Expansion joints
Partial replacement 10
Road surface Minor repairs 10
Water Proof-ing Layer
No maintenance actions * 0
Metal cornice gutter
No maintenance actions * 0
Elastomeric bearing
Clean, painting, lubricating 25
Railing Painting 20
(*) – Elements with no maintenance actions. Total replacement takes place when the service life is reached.
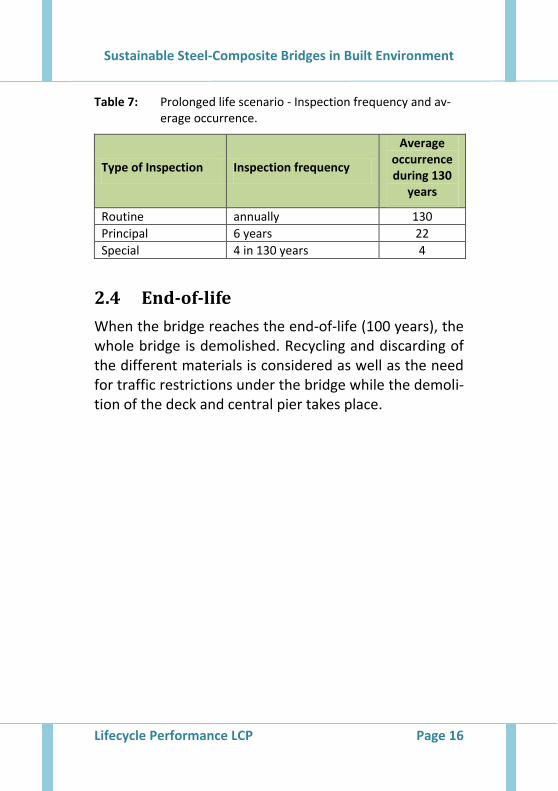
The frequency assumed for each type of inspection for the prolonged life is shown in Table 7. The special in-spections will take place on years 50, 75, 90 and 115.
Sustainable Steel-Composite Bridges in Built Environment
Lifecycle Performance LCP Page 16
Table 7: Prolonged life scenario - Inspection frequency and av-erage occurrence.
Type of Inspection Inspection frequency
Average occurrence during 130
years
Routine annually 130
Principal 6 years 22
Special 4 in 130 years 4
2.4 End-of-life
When the bridge reaches the end-of-life (100 years), the whole bridge is demolished. Recycling and discarding of the different materials is considered as well as the need for traffic restrictions under the bridge while the demoli-tion of the deck and central pier takes place.
Sustainable Steel-Composite Bridges in Built Environment
Lifecycle Assessment LCA Page 17
3 Lifecycle Assessment (LCA)
3.1 General framework
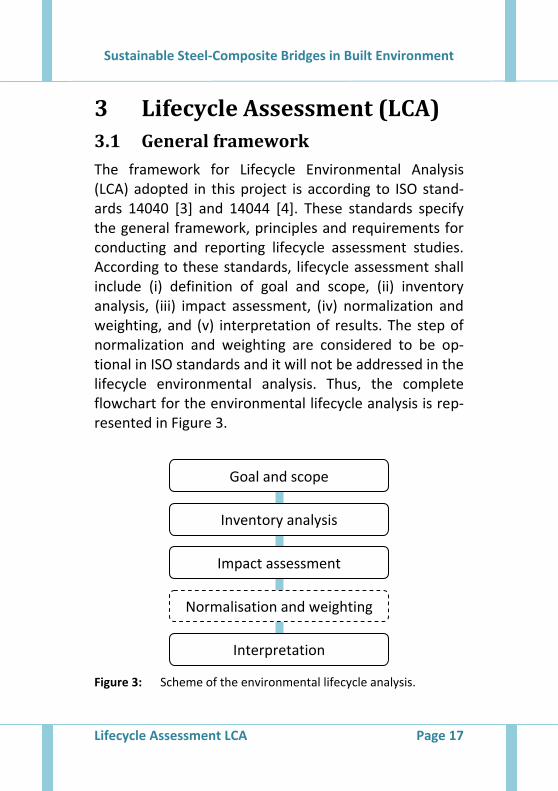
The framework for Lifecycle Environmental Analysis (LCA) adopted in this project is according to ISO stand-ards 14040 [3] and 14044 [4]. These standards specify the general framework, principles and requirements for conducting and reporting lifecycle assessment studies. According to these standards, lifecycle assessment shall include (i) definition of goal and scope, (ii) inventory analysis, (iii) impact assessment, (iv) normalization and weighting, and (v) interpretation of results. The step of normalization and weighting are considered to be op-tional in ISO standards and it will not be addressed in the lifecycle environmental analysis. Thus, the complete flowchart for the environmental lifecycle analysis is rep-resented in Figure 3.
Figure 3: Scheme of the environmental lifecycle analysis.
Goal and scope
Inventory analysis
Impact assessment
Normalisation and weighting
Interpretation
Sustainable Steel-Composite Bridges in Built Environment
Lifecycle Assessment LCA Page 18
3.2 Goal and scope of the LCA
3.2.2 Goal of the LCA
The general goal of the LCA is to evaluate the environ-mental performance of composite motorway bridges over their lifecycle. The period of analysis is assumed to be 100 years. The lifecycle analysis will highlight main advantages and disadvantages of this kind of structures and will allow to provide recommendations for further improvements.
3.2.2 Functional unit
In the aim of this project the general definition of the functional unit is a motorway bridge, designed for a ser-vice life of 100 years, to overpass a dual-carriageway. During the operation stage it is assumed that bridges are maintained according to the standard maintenance sce-nario described in the final report [2].
3.2.3 Scope of the LCA
The system boundaries determine which unit process shall be included within the LCA [3], [4]. Several factors determine the system boundaries, including the intend-ed application of the study, the assumptions made, cut-off criteria, data and cost constraints, and the intended audience.
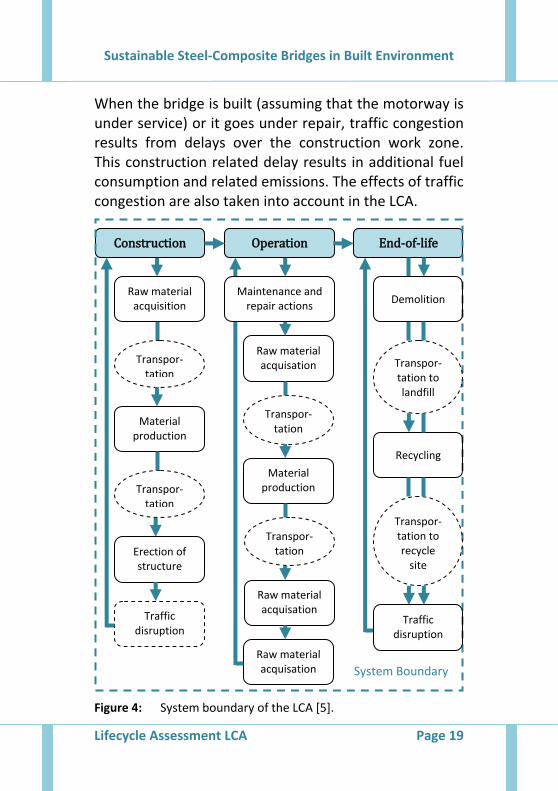
The system boundary adopted in this project is repre-sented in Figure 4. All stages over the complete lifecycle of the bridges, from raw material extraction until end-of-life procedures, are included. Furthermore, the trans-portation of materials and equipments should also be included in the system boundary.
Sustainable Steel-Composite Bridges in Built Environment
Lifecycle Assessment LCA Page 19
When the bridge is built (assuming that the motorway is under service) or it goes under repair, traffic congestion results from delays over the construction work zone. This construction related delay results in additional fuel consumption and related emissions. The effects of traffic congestion are also taken into account in the LCA.
Figure 4: System boundary of the LCA [5].
Construction End-of-life Operation
Raw material acquisition
Transpor-tation
Maintenance and repair actions
Raw material acquisation
Material production
Raw material acquisation
Transpor-tation
Transpor-tation
Raw material acquisation
Material production
Transpor-tation
Erection of structure
Traffic disruption
Demolition
Transpor-tation to landfill
Recycling
Transpor-tation to recycle
site
Traffic disruption
System Boundary
Sustainable Steel-Composite Bridges in Built Environment
Lifecycle Assessment LCA Page 20
3.3 Methodology for impact assessment
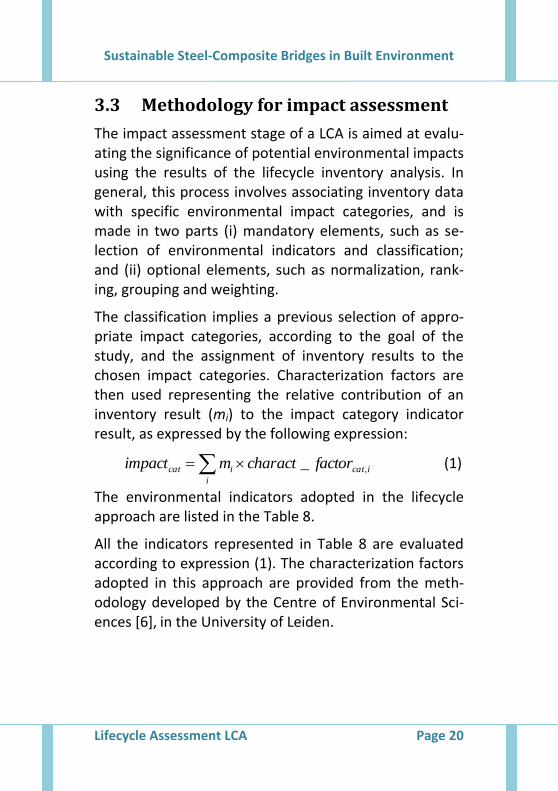
The impact assessment stage of a LCA is aimed at evalu-ating the significance of potential environmental impacts using the results of the lifecycle inventory analysis. In general, this process involves associating inventory data with specific environmental impact categories, and is made in two parts (i) mandatory elements, such as se-lection of environmental indicators and classification; and (ii) optional elements, such as normalization, rank-ing, grouping and weighting.
The classification implies a previous selection of appro-priate impact categories, according to the goal of the study, and the assignment of inventory results to the chosen impact categories. Characterization factors are then used representing the relative contribution of an inventory result (mi) to the impact category indicator result, as expressed by the following expression:
icat
i
icat factorcharactmimpact ,_ (1)
The environmental indicators adopted in the lifecycle approach are listed in the Table 8.
All the indicators represented in Table 8 are evaluated according to expression (1). The characterization factors adopted in this approach are provided from the meth-odology developed by the Centre of Environmental Sci-ences [6], in the University of Leiden.
Sustainable Steel-Composite Bridges in Built Environment
Lifecycle Assessment LCA Page 21
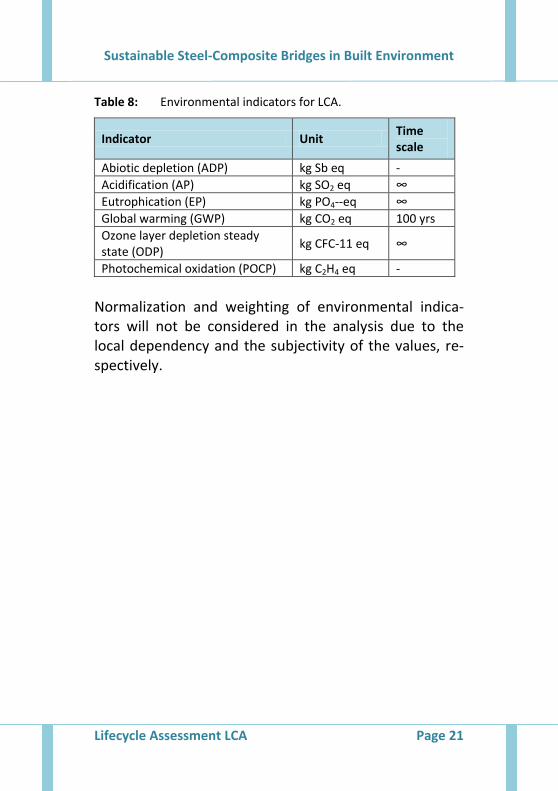
Table 8: Environmental indicators for LCA.
Indicator Unit Time scale
Abiotic depletion (ADP) kg Sb eq -
Acidification (AP) kg SO2 eq ∞
Eutrophication (EP) kg PO4--eq ∞
Global warming (GWP) kg CO2 eq 100 yrs
Ozone layer depletion steady state (ODP)
kg CFC-11 eq ∞
Photochemical oxidation (POCP) kg C2H4 eq -
Normalization and weighting of environmental indica-tors will not be considered in the analysis due to the local dependency and the subjectivity of the values, re-spectively.
Sustainable Steel-Composite Bridges in Built Environment
Lifecycle Costs LCC Page 22
4 Lifecycle Costs (LCC)
4.1 General
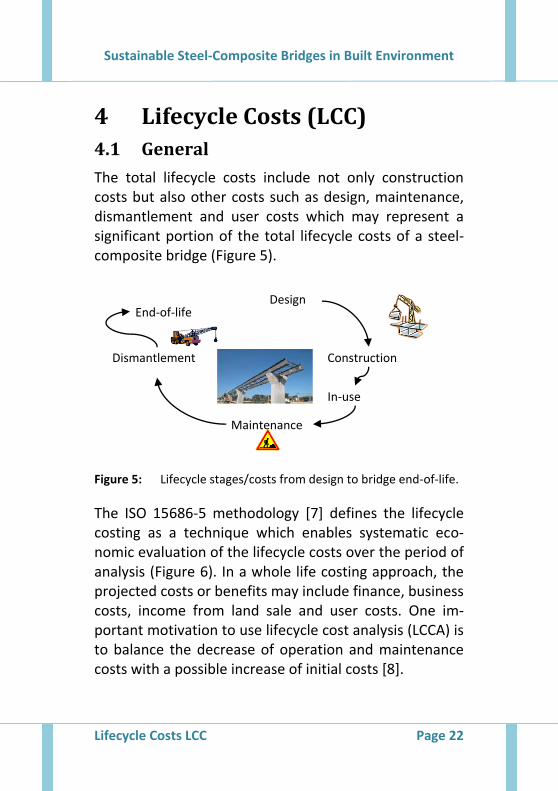
The total lifecycle costs include not only construction costs but also other costs such as design, maintenance, dismantlement and user costs which may represent a significant portion of the total lifecycle costs of a steel-composite bridge (Figure 5).
Figure 5: Lifecycle stages/costs from design to bridge end-of-life.
The ISO 15686-5 methodology [7] defines the lifecycle costing as a technique which enables systematic eco-nomic evaluation of the lifecycle costs over the period of analysis (Figure 6). In a whole life costing approach, the projected costs or benefits may include finance, business costs, income from land sale and user costs. One im-portant motivation to use lifecycle cost analysis (LCCA) is to balance the decrease of operation and maintenance costs with a possible increase of initial costs [8].
Design
Construction
In-use
Maintenance
Dismantlement
End-of-life
Sustainable Steel-Composite Bridges in Built Environment
Lifecycle Costs LCC Page 23
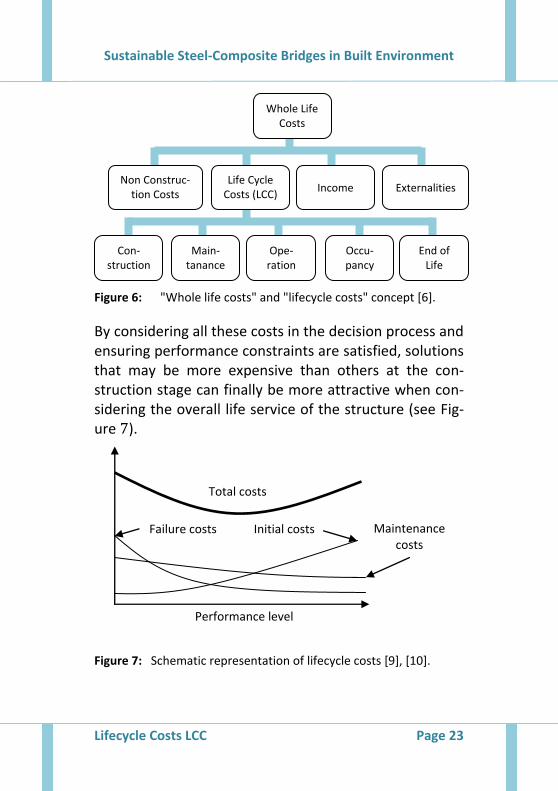
Figure 6: "Whole life costs" and "lifecycle costs" concept [6].
By considering all these costs in the decision process and ensuring performance constraints are satisfied, solutions that may be more expensive than others at the con-struction stage can finally be more attractive when con-sidering the overall life service of the structure (see Fig-ure 7).
Figure 7: Schematic representation of lifecycle costs [9], [10].
Failure costs Initial costs Maintenance costs
Total costs
Performance level
Whole Life Costs (WLC)
Life Cycle Costs (LCC)
Income Externalities
Ope-ration
End of Life
Main-tanance
Occu-pancy
Non Construc-tion Costs
Con-struction
Sustainable Steel-Composite Bridges in Built Environment
Lifecycle Costs LCC Page 24
4.2 Economic evaluation method for LCC
The costs included in a LCCA being incurred at varying points in time, there is a need to convert them into a value at a common point in time [11]. Several methods exist to lead to LCC among which:
the payback method, which determines the time required to return to the initial investment,
the equivalent annual costs, which express the costs per year of owning and operating an asset over its entire lifespan,
the internal rate of return, which is the discount rate at which the net present value of costs (nega-tive cash flows) of the investment equals the net present value of the benefits (positive cash flows) of the investments,
the net present value approach which directly ap-plies discount factors to each year projected cash flow.
The net present value approach mentioned above is one of the most used methods to compare past and future cash flows with those of today. To make costs time-equivalent, the approach discounts them to a common point in time, the discount rate of money reflecting the investor's opportunity costs of money over time. The net present value can be calculated as follows:
Sustainable Steel-Composite Bridges in Built Environment
Lifecycle Costs LCC Page 25
1 1
Nk
kk
CNPV
r
(2)
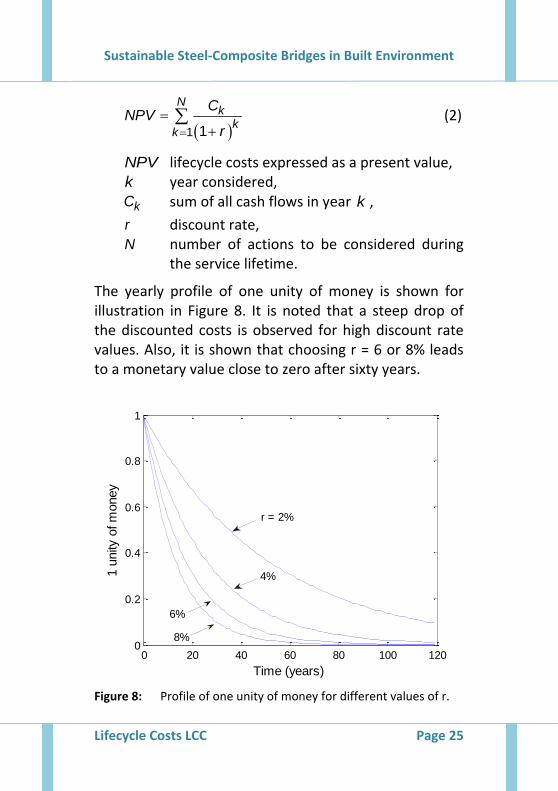
NPV lifecycle costs expressed as a present value, k year considered,
kC sum of all cash flows in year k ,
r discount rate, N number of actions to be considered during
the service lifetime.
The yearly profile of one unity of money is shown for illustration in Figure 8. It is noted that a steep drop of the discounted costs is observed for high discount rate values. Also, it is shown that choosing r = 6 or 8% leads to a monetary value close to zero after sixty years.
Figure 8: Profile of one unity of money for different values of r.
0 20 40 60 80 100 1200
0.2
0.4
0.6
0.8
1
Time (years)
1 u
nity
of m
oney
4%
6%
8%
r = 2%
Sustainable Steel-Composite Bridges in Built Environment
Lifecycle Costs LCC Page 26
The value of the yearly discount rate used is crucial since the current worth of money ( NPV ) is highly sensitive to this parameter. Indeed, the higher the discount rate, the more importance is given to the near-present. Choosing a high discount rate may then promote management strategies with low initial costs and a costly end-of-life. Therefore, the choice of the discount rate is delicate and has to be in agreement with the time horizon. It is noted that the discount rate is fixed at 2% in the LCCA per-formed in the SBRI-project for a 100-year service life.
4.3 From design to end-of-life costs
4.3.1 Lifecycle
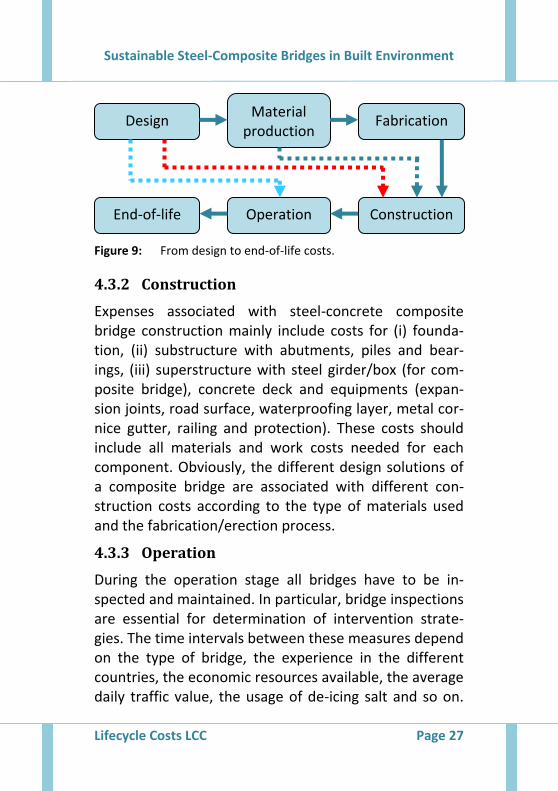
LCC extends the analysis over the whole life of the pro-ject, showing the real value of the investment. Such an analysis investigates the costs related to the entire life-cycle in combination with the assessment of structural performances over time. Initial costs (design, material production, fabrication), operation costs (inspection and repair costs) and end-of-life costs are then assessed (Figure 9).
It is mentioned that the costs of failure (which comprises costs associated with structural failure multiplied by their probability of occurrence) are not investigated in this project, which focuses only on standard operation scenarios during the service life. The application of LCC to steel-concrete composite bridges, according to the construction/operation/end-of-life-scheme is detailed in the following chapters.
Sustainable Steel-Composite Bridges in Built Environment
Lifecycle Costs LCC Page 27
Figure 9: From design to end-of-life costs.
4.3.2 Construction
Expenses associated with steel-concrete composite bridge construction mainly include costs for (i) founda-tion, (ii) substructure with abutments, piles and bear-ings, (iii) superstructure with steel girder/box (for com-posite bridge), concrete deck and equipments (expan-sion joints, road surface, waterproofing layer, metal cor-nice gutter, railing and protection). These costs should include all materials and work costs needed for each component. Obviously, the different design solutions of a composite bridge are associated with different con-struction costs according to the type of materials used and the fabrication/erection process.
4.3.3 Operation
During the operation stage all bridges have to be in-spected and maintained. In particular, bridge inspections are essential for determination of intervention strate-gies. The time intervals between these measures depend on the type of bridge, the experience in the different countries, the economic resources available, the average daily traffic value, the usage of de-icing salt and so on.
Design Material
production Fabrication
Construction End-of-life Operation
Sustainable Steel-Composite Bridges in Built Environment
Lifecycle Costs LCC Page 28
Also, inspection strategies (intensities and frequencies of inspections) may be different in each country based on climate conditions and prioritization strategies proper to each country [12].
The three basic types of inspection (routine, principle and special) and the three maintenance scenarios (stan-dard, lack of money, prolonged life), described in chap-ter 2.3.2 are here considered for the operation stage.
The objective is that the performance of the bridge (as-sociated with serviceability and safety concepts) always remains above a minimum threshold. This point corre-sponds to the end of the service life if no other rehabili-tation action is conducted.
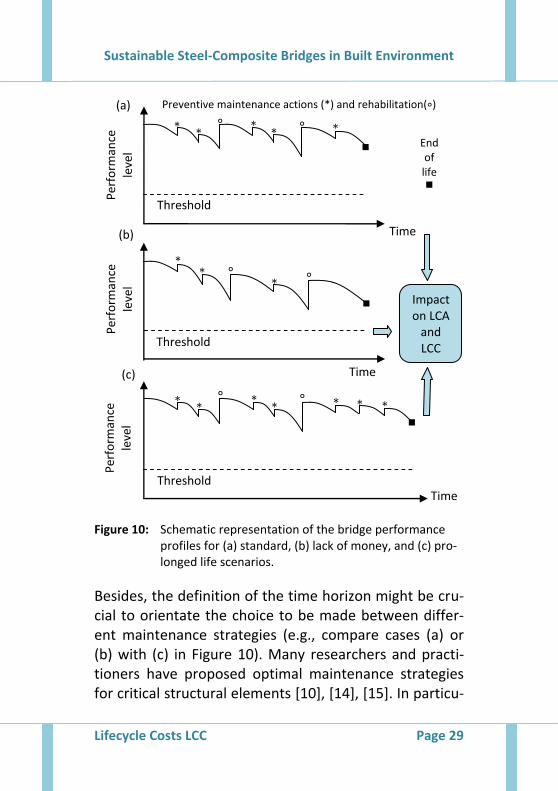
A regular interval between interventions is generally considered by highway agencies to assess the costs in the LCC analysis. For example, Irzik et al. [13] estimate future times at which maintenance ac-tions/rehabilitation will be performed, based on the av-erage service life of elements of the bridge. It is noted that intervals are updated in this model, based on the measures that are performed on the bridge. Figure 10 illustrates the link between the lifecycle performance and the lifecycle costs.
Depending on the minimum allowable performance threshold, preventive, essential and rehabilitation ac-tions might be decided in a different way (compare cases (a) and (b) in Figure 10).
Sustainable Steel-Composite Bridges in Built Environment
Lifecycle Costs LCC Page 29
Figure 10: Schematic representation of the bridge performance profiles for (a) standard, (b) lack of money, and (c) pro-longed life scenarios.
Besides, the definition of the time horizon might be cru-cial to orientate the choice to be made between differ-ent maintenance strategies (e.g., compare cases (a) or (b) with (c) in Figure 10). Many researchers and practi-tioners have proposed optimal maintenance strategies for critical structural elements [10], [14], [15]. In particu-
Preventive maintenance actions (*) and rehabilitation(∘)
*
Threshold
Threshold
Time
Time
End of life
(a)
(b)
Impact on LCA
and LCC
Per
form
ance
leve
l
Per
form
ance
leve
l
Per
form
ance
leve
l
Time (c)
Threshold
* *
* * ∘ ∘
* *
* ∘ ∘
* *
* * *
∘ ∘ * *
Sustainable Steel-Composite Bridges in Built Environment
Lifecycle Costs LCC Page 30
lar, Ferry and Flanagan [16] show that LCCA can be used as a management tool throughout the service life of the structure (for inspection, maintenance/rehabilitation and dismantlement) whenever different options are available to determine the lowest LCC.
4.3.4 End-of-life
In the end-of-life stage, it is assumed that the bridge is demolished and that the materials are sorted in the same place before being sent to their final destination. For steel-composite bridges, it is assumed that the steel structure is going to be reused. The remaining parts, which are generally concrete and bitumen materials, are cut down and transported to waste disposal areas. In this context, end-of-life costs should take into account the costs of bridge dismantlement (labour work, equip-ments, road warning signage), costs of transportation and costs for deposition of materials and/or revenue due to recycling of materials.
4.4 User costs
Contrary to the owner costs that are direct measurable costs, the user costs are indirect and hardly measurable. In the case of highway bridges, these costs are those incurred by the users due to maintenance operations of highway structure causing congestion or disruption of the normal traffic flow. These costs are not directly measurable but the traffic delays that lead to them can be measured. Traffic delay costs have, consequently, to be predicted on the basis of estimated delay and vehicle
Sustainable Steel-Composite Bridges in Built Environment
Lifecycle Costs LCC Page 31
operation costs which include additional costs of fuel plus additional costs of vehicle maintenance. These costs are briefly described below:
Traffic delay costs result from an increase in travel time through the work zone due to speed reduc-tions, congestion delays or increased distances as a result of detour. These costs are influenced by many factors such as current and future traffic, bridge ca-pacity, the timing, duration, and frequency of work-zone-induced capacity restrictions, and the unit costs for delay.
Vehicle operating costs are due to the level of ser-vice loss caused by the maintenance operations on highway structures. The disruption of normal traffic causes speed reductions, increase of fuel and oil consumptions, tire wear and vehicle maintenance. In particular, additional costs of fuel are due to the fact that its consumption is significantly higher in congested conditions. Besides, vehicle maintenance costs increase since these items need faster re-placement for vehicles travelling in congested con-ditions. Finally, the traffic disruption induced by maintenance works has a negative impact on road safety and consequently increases the accident rate on the road part affected by the works.
The current or future average daily traffic ( ADT ex-pressed in vehicles/day), based on the desired construc-tion year, should be obtained from the traffic monitoring section. Due to factors such as population growth and
Sustainable Steel-Composite Bridges in Built Environment
Lifecycle Costs LCC Page 32
economic prosperity, the volume of traffic on bridge may increase each year and can be estimated:
01
tyear year
t tgADT ADT r
(3)
tADT average daily traffic to be used in the analy-
sis at year t (vehicles/day),
tgr expected traffic growth rate,
yeart year in which the ADT is calculated, year0 year in which the ADT is measured.
Sustainable Steel-Composite Bridges in Built Environment
Case Study and Variations Page 33
5 Case Study and Variations
5.1 General
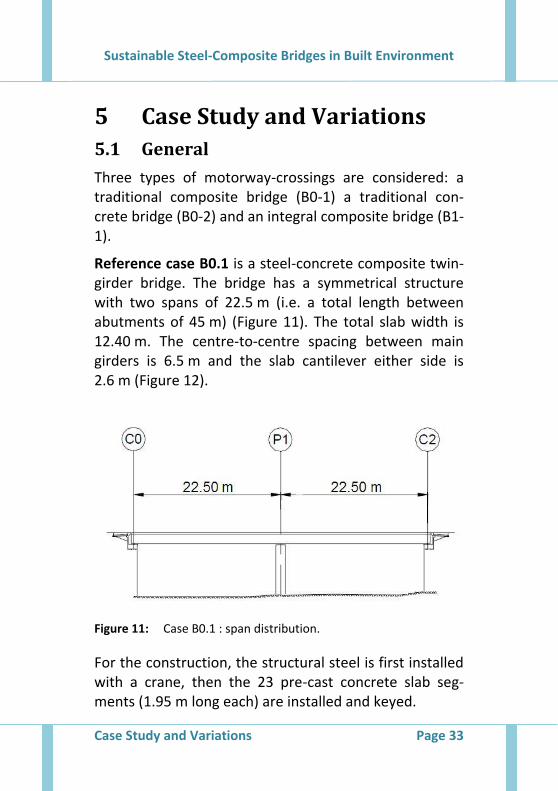
Three types of motorway-crossings are considered: a traditional composite bridge (B0-1) a traditional con-crete bridge (B0-2) and an integral composite bridge (B1-1).
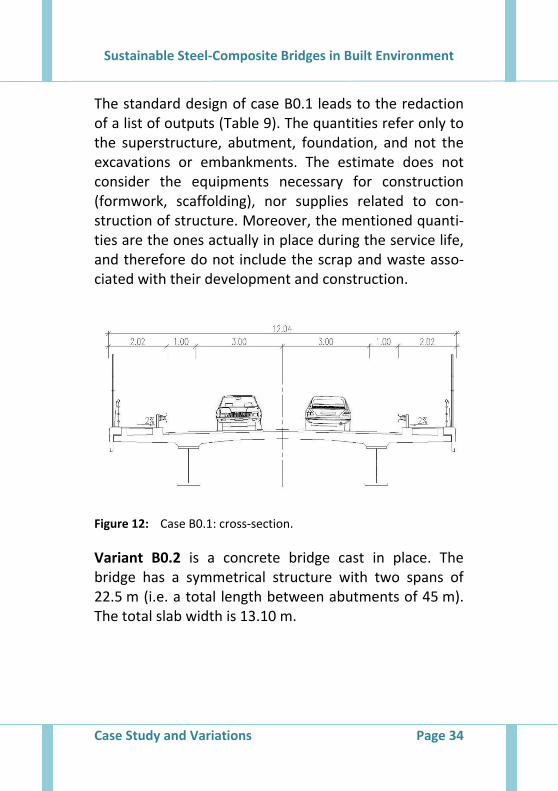
Reference case B0.1 is a steel-concrete composite twin-girder bridge. The bridge has a symmetrical structure with two spans of 22.5 m (i.e. a total length between abutments of 45 m) (Figure 11). The total slab width is 12.40 m. The centre-to-centre spacing between main girders is 6.5 m and the slab cantilever either side is 2.6 m (Figure 12).
Figure 11: Case B0.1 : span distribution.
For the construction, the structural steel is first installed with a crane, then the 23 pre-cast concrete slab seg-ments (1.95 m long each) are installed and keyed.
Sustainable Steel-Composite Bridges in Built Environment
Case Study and Variations Page 34
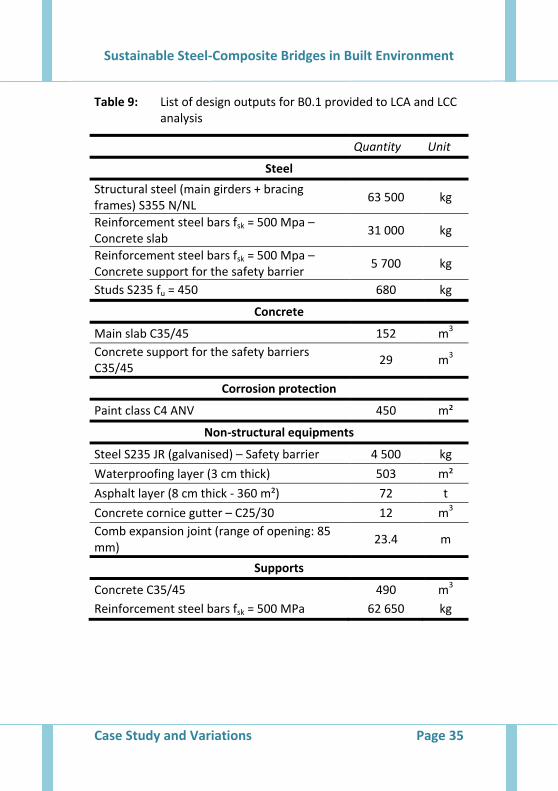
The standard design of case B0.1 leads to the redaction of a list of outputs (Table 9). The quantities refer only to the superstructure, abutment, foundation, and not the excavations or embankments. The estimate does not consider the equipments necessary for construction (formwork, scaffolding), nor supplies related to con-struction of structure. Moreover, the mentioned quanti-ties are the ones actually in place during the service life, and therefore do not include the scrap and waste asso-ciated with their development and construction.
Figure 12: Case B0.1: cross-section.
Variant B0.2 is a concrete bridge cast in place. The bridge has a symmetrical structure with two spans of 22.5 m (i.e. a total length between abutments of 45 m). The total slab width is 13.10 m.
Sustainable Steel-Composite Bridges in Built Environment
Case Study and Variations Page 35
Table 9: List of design outputs for B0.1 provided to LCA and LCC analysis
Quantity Unit
Steel
Structural steel (main girders + bracing frames) S355 N/NL
63 500 kg
Reinforcement steel bars fsk = 500 Mpa – Concrete slab
31 000 kg
Reinforcement steel bars fsk = 500 Mpa – Concrete support for the safety barrier
5 700 kg
Studs S235 fu = 450 680 kg
Concrete
Main slab C35/45 152 m3
Concrete support for the safety barriers C35/45
29 m3
Corrosion protection
Paint class C4 ANV 450 m²
Non-structural equipments
Steel S235 JR (galvanised) – Safety barrier 4 500 kg
Waterproofing layer (3 cm thick) 503 m²
Asphalt layer (8 cm thick - 360 m²) 72 t
Concrete cornice gutter – C25/30 12 m3
Comb expansion joint (range of opening: 85 mm)
23.4 m
Supports
Concrete C35/45 490 m3
Reinforcement steel bars fsk = 500 MPa 62 650 kg
Sustainable Steel-Composite Bridges in Built Environment
Case Study and Variations Page 36
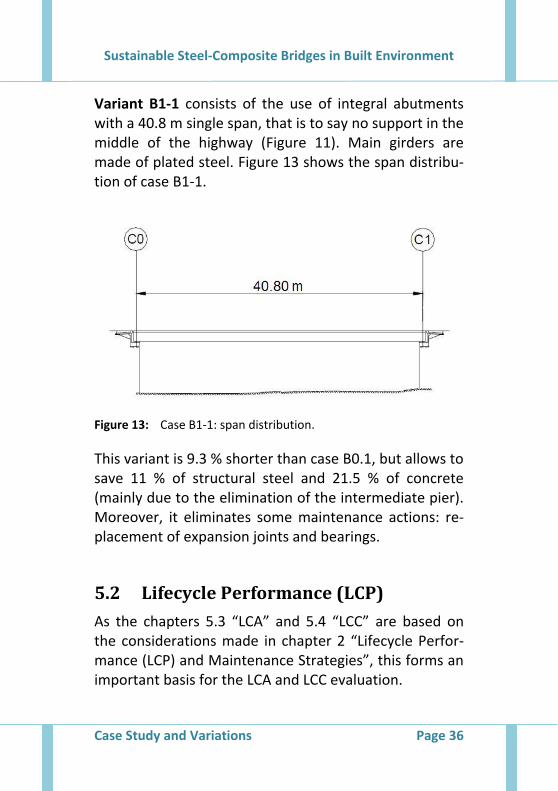
Variant B1-1 consists of the use of integral abutments with a 40.8 m single span, that is to say no support in the middle of the highway (Figure 11). Main girders are made of plated steel. Figure 13 shows the span distribu-tion of case B1-1.
Figure 13: Case B1-1: span distribution.
This variant is 9.3 % shorter than case B0.1, but allows to save 11 % of structural steel and 21.5 % of concrete (mainly due to the elimination of the intermediate pier). Moreover, it eliminates some maintenance actions: re-placement of expansion joints and bearings.
5.2 Lifecycle Performance (LCP)
As the chapters 5.3 “LCA” and 5.4 “LCC” are based on the considerations made in chapter 2 “Lifecycle Perfor-mance (LCP) and Maintenance Strategies”, this forms an important basis for the LCA and LCC evaluation.
Sustainable Steel-Composite Bridges in Built Environment
Case Study and Variations Page 37
5.3 Lifecycle Assessment (LCA)
5.3.1 General
This section describes the results of the LCA for case study B0-1. In addition, a comparative analysis is pro-vided with the results of case studies B0-2 and B1-1.
All case studies provide the same functional unit. How-ever, due to different geometric characteristics of the deck, it was decided to provide the results normalized by the area of each deck.
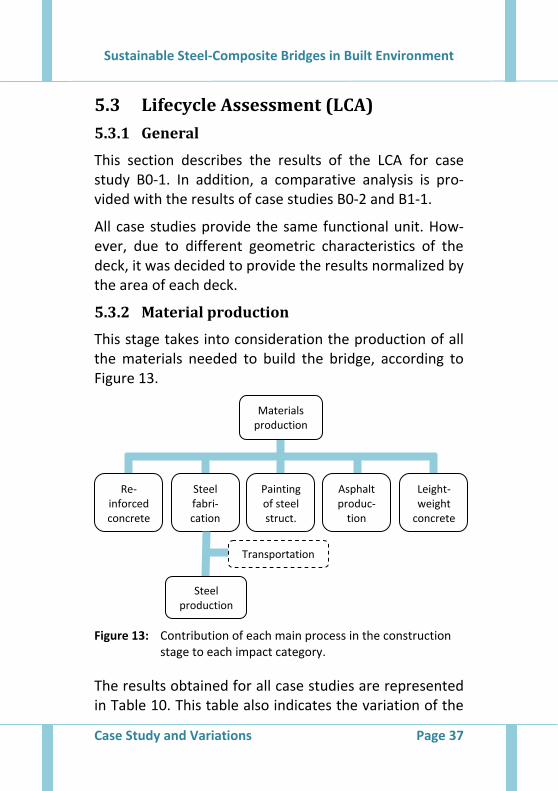
5.3.2 Material production
This stage takes into consideration the production of all the materials needed to build the bridge, according to Figure 13.
Figure 13: Contribution of each main process in the construction stage to each impact category.
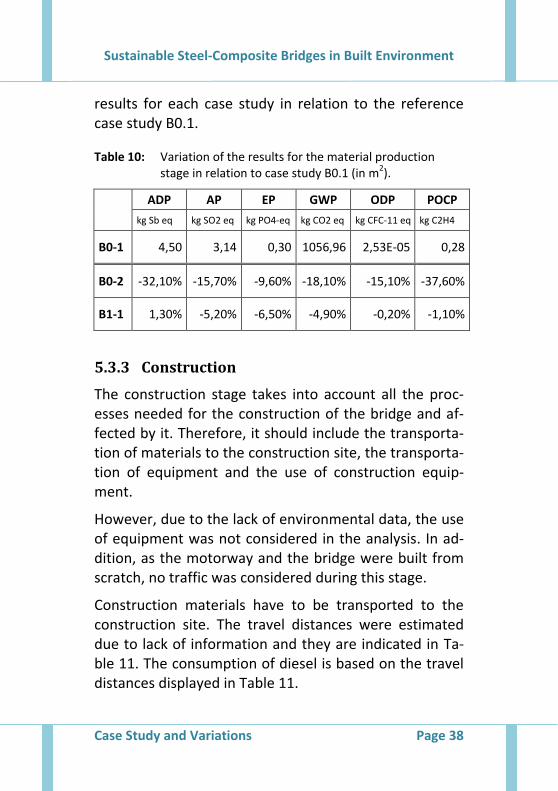
The results obtained for all case studies are represented in Table 10. This table also indicates the variation of the
Painting of steel struct.
Re-inforced concrete
Steel fabri-cation
Asphalt produc-
tion
Leight-weight
concrete
Materials production
Transportation
Steel production
Sustainable Steel-Composite Bridges in Built Environment
Case Study and Variations Page 38
results for each case study in relation to the reference case study B0.1.
Table 10: Variation of the results for the material production stage in relation to case study B0.1 (in m2).
ADP AP EP GWP ODP POCP
kg Sb eq kg SO2 eq kg PO4-eq kg CO2 eq kg CFC-11 eq kg C2H4
B0-1 4,50 3,14 0,30 1056,96 2,53E-05 0,28
B0-2 -32,10% -15,70% -9,60% -18,10% -15,10% -37,60%
B1-1 1,30% -5,20% -6,50% -4,90% -0,20% -1,10%
5.3.3 Construction
The construction stage takes into account all the proc-esses needed for the construction of the bridge and af-fected by it. Therefore, it should include the transporta-tion of materials to the construction site, the transporta-tion of equipment and the use of construction equip-ment.
However, due to the lack of environmental data, the use of equipment was not considered in the analysis. In ad-dition, as the motorway and the bridge were built from scratch, no traffic was considered during this stage.
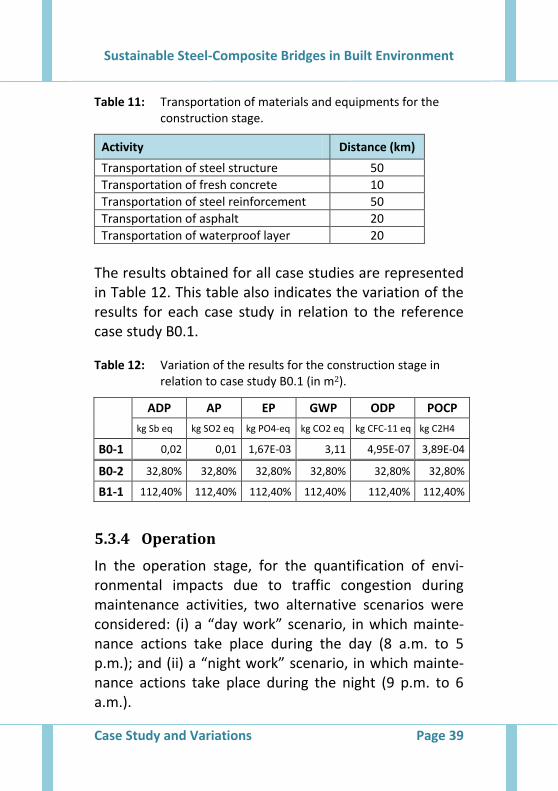
Construction materials have to be transported to the construction site. The travel distances were estimated due to lack of information and they are indicated in Ta-ble 11. The consumption of diesel is based on the travel distances displayed in Table 11.
Sustainable Steel-Composite Bridges in Built Environment
Case Study and Variations Page 39
Table 11: Transportation of materials and equipments for the construction stage.
Activity Distance (km)
Transportation of steel structure 50
Transportation of fresh concrete 10
Transportation of steel reinforcement 50
Transportation of asphalt 20
Transportation of waterproof layer 20
The results obtained for all case studies are represented in Table 12. This table also indicates the variation of the results for each case study in relation to the reference case study B0.1.
Table 12: Variation of the results for the construction stage in relation to case study B0.1 (in m2).
ADP AP EP GWP ODP POCP
kg Sb eq kg SO2 eq kg PO4-eq kg CO2 eq kg CFC-11 eq kg C2H4
B0-1 0,02 0,01 1,67E-03 3,11 4,95E-07 3,89E-04
B0-2 32,80% 32,80% 32,80% 32,80% 32,80% 32,80%
B1-1 112,40% 112,40% 112,40% 112,40% 112,40% 112,40%
5.3.4 Operation
In the operation stage, for the quantification of envi-ronmental impacts due to traffic congestion during maintenance activities, two alternative scenarios were considered: (i) a “day work” scenario, in which mainte-nance actions take place during the day (8 a.m. to 5 p.m.); and (ii) a “night work” scenario, in which mainte-nance actions take place during the night (9 p.m. to 6 a.m.).
Sustainable Steel-Composite Bridges in Built Environment
Case Study and Variations Page 40
However, the following maintenance actions required the closure of 1 lane all day (24h period):
replacement of the waterproofing layer;
replacement of the asphalt layer;
replacement of coating system;
maintenance of concrete deck.
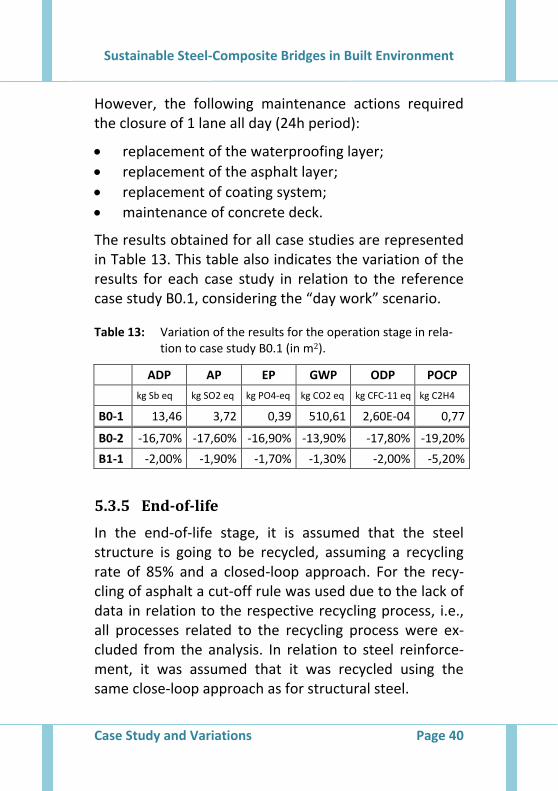
The results obtained for all case studies are represented in Table 13. This table also indicates the variation of the results for each case study in relation to the reference case study B0.1, considering the “day work” scenario.
Table 13: Variation of the results for the operation stage in rela-tion to case study B0.1 (in m2).
ADP AP EP GWP ODP POCP
kg Sb eq kg SO2 eq kg PO4-eq kg CO2 eq kg CFC-11 eq kg C2H4
B0-1 13,46 3,72 0,39 510,61 2,60E-04 0,77
B0-2 -16,70% -17,60% -16,90% -13,90% -17,80% -19,20%
B1-1 -2,00% -1,90% -1,70% -1,30% -2,00% -5,20%
5.3.5 End-of-life
In the end-of-life stage, it is assumed that the steel structure is going to be recycled, assuming a recycling rate of 85% and a closed-loop approach. For the recy-cling of asphalt a cut-off rule was used due to the lack of data in relation to the respective recycling process, i.e., all processes related to the recycling process were ex-cluded from the analysis. In relation to steel reinforce-ment, it was assumed that it was recycled using the same close-loop approach as for structural steel.
Sustainable Steel-Composite Bridges in Built Environment
Case Study and Variations Page 41
Due to the lack of environmental data, the use of equipment was not considered in the analysis. In addi-tion, it was considered that during the demolition of the bridge, traffic was diverted to another route and thus no traffic was considered in this stage.
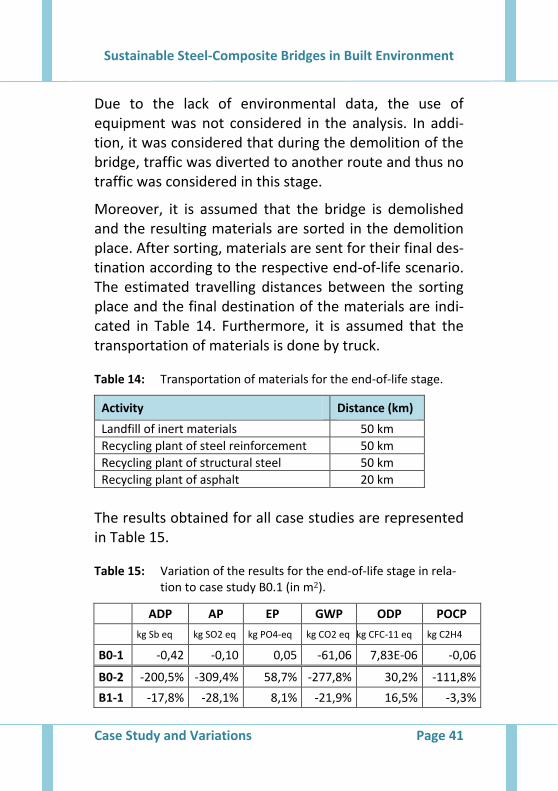
Moreover, it is assumed that the bridge is demolished and the resulting materials are sorted in the demolition place. After sorting, materials are sent for their final des-tination according to the respective end-of-life scenario. The estimated travelling distances between the sorting place and the final destination of the materials are indi-cated in Table 14. Furthermore, it is assumed that the transportation of materials is done by truck.
Table 14: Transportation of materials for the end-of-life stage.
Activity Distance (km)
Landfill of inert materials 50 km
Recycling plant of steel reinforcement 50 km
Recycling plant of structural steel 50 km
Recycling plant of asphalt 20 km
The results obtained for all case studies are represented in Table 15.
Table 15: Variation of the results for the end-of-life stage in rela-tion to case study B0.1 (in m2).
ADP AP EP GWP ODP POCP
kg Sb eq kg SO2 eq kg PO4-eq kg CO2 eq kg CFC-11 eq kg C2H4
B0-1 -0,42 -0,10 0,05 -61,06 7,83E-06 -0,06
B0-2 -200,5% -309,4% 58,7% -277,8% 30,2% -111,8%
B1-1 -17,8% -28,1% 8,1% -21,9% 16,5% -3,3%
Sustainable Steel-Composite Bridges in Built Environment
Case Study and Variations Page 42
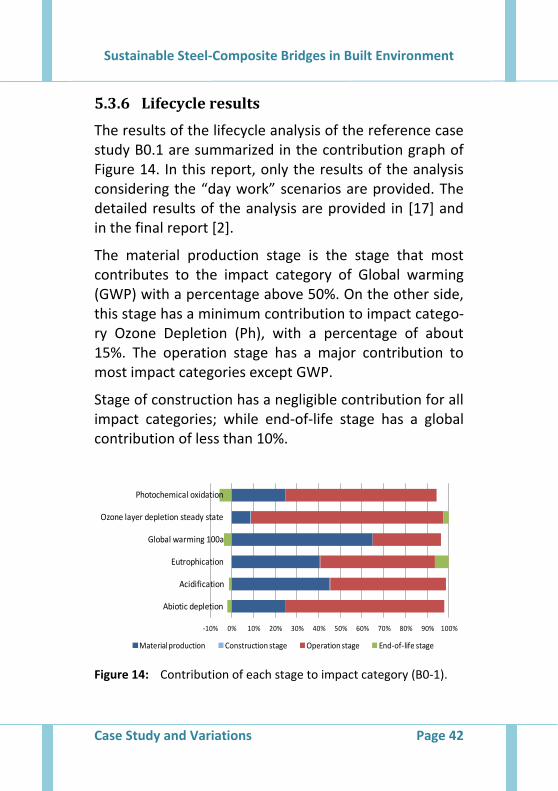
5.3.6 Lifecycle results
The results of the lifecycle analysis of the reference case study B0.1 are summarized in the contribution graph of Figure 14. In this report, only the results of the analysis considering the “day work” scenarios are provided. The detailed results of the analysis are provided in [17] and in the final report [2].
The material production stage is the stage that most contributes to the impact category of Global warming (GWP) with a percentage above 50%. On the other side, this stage has a minimum contribution to impact catego-ry Ozone Depletion (Ph), with a percentage of about 15%. The operation stage has a major contribution to most impact categories except GWP.
Stage of construction has a negligible contribution for all impact categories; while end-of-life stage has a global contribution of less than 10%.
Figure 14: Contribution of each stage to impact category (B0-1).
-10% 0% 10% 20% 30% 40% 50% 60% 70% 80% 90% 100%
Abiotic depletion
Acidification
Eutrophication
Global warming 100a
Ozone layer depletion steady state
Photochemical oxidation
Material production Construction stage Operation stage End-of-life stage
Sustainable Steel-Composite Bridges in Built Environment
Case Study and Variations Page 43
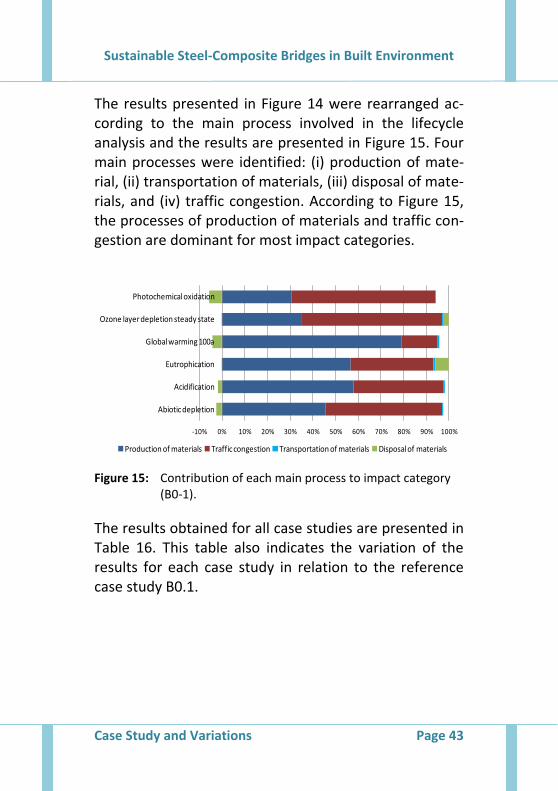
The results presented in Figure 14 were rearranged ac-cording to the main process involved in the lifecycle analysis and the results are presented in Figure 15. Four main processes were identified: (i) production of mate-rial, (ii) transportation of materials, (iii) disposal of mate-rials, and (iv) traffic congestion. According to Figure 15, the processes of production of materials and traffic con-gestion are dominant for most impact categories.
Figure 15: Contribution of each main process to impact category (B0-1).
The results obtained for all case studies are presented in Table 16. This table also indicates the variation of the results for each case study in relation to the reference case study B0.1.
-10% 0% 10% 20% 30% 40% 50% 60% 70% 80% 90% 100%
Abiotic depletion
Acidification
Eutrophication
Global warming 100a
Ozone layer depletion steady state
Photochemical oxidation
Production of materials Traffic congestion Transportation of materials Disposal of materials
Sustainable Steel-Composite Bridges in Built Environment
Case Study and Variations Page 44
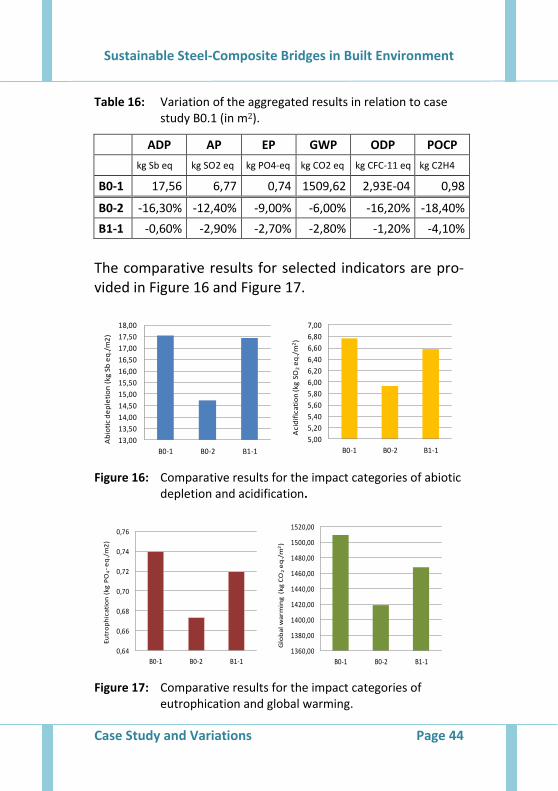
Table 16: Variation of the aggregated results in relation to case study B0.1 (in m2).
ADP AP EP GWP ODP POCP
kg Sb eq kg SO2 eq kg PO4-eq kg CO2 eq kg CFC-11 eq kg C2H4
B0-1 17,56 6,77 0,74 1509,62 2,93E-04 0,98
B0-2 -16,30% -12,40% -9,00% -6,00% -16,20% -18,40%
B1-1 -0,60% -2,90% -2,70% -2,80% -1,20% -4,10%
The comparative results for selected indicators are pro-vided in Figure 16 and Figure 17.
Figure 16: Comparative results for the impact categories of abiotic
depletion and acidification.
Figure 17: Comparative results for the impact categories of
eutrophication and global warming.
13,00
13,50
14,00
14,50
15,00
15,50
16,00
16,50
17,00
17,50
18,00
B0-1 B0-2 B1-1
Ab
ioti
c d
ep
leti
on
(kg
Sb
eq
./m
2)
5,00
5,20
5,40
5,60
5,80
6,00
6,20
6,40
6,60
6,80
7,00
B0-1 B0-2 B1-1
Aci
dif
icat
ion
(kg
SO2
eq
./m
2)
0,64
0,66
0,68
0,70
0,72
0,74
0,76
B0-1 B0-2 B1-1
Eu
tro
ph
ica
tio
n (
kg
PO
4-
eq
./m
2)
1360,00
1380,00
1400,00
1420,00
1440,00
1460,00
1480,00
1500,00
1520,00
B0-1 B0-2 B1-1
Glo
ba
l w
arm
ing
(k
g C
O2
eq
./m
2)
Sustainable Steel-Composite Bridges in Built Environment
Case Study and Variations Page 45
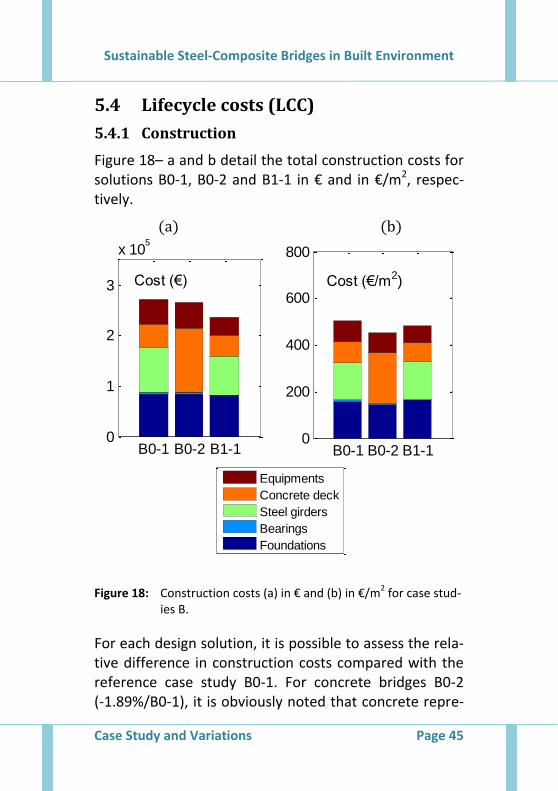
5.4 Lifecycle costs (LCC)
5.4.1 Construction
Figure 18– a and b detail the total construction costs for solutions B0-1, B0-2 and B1-1 in € and in €/m2, respec-tively.
(a) (b)
Figure 18: Construction costs (a) in € and (b) in €/m2 for case stud-ies B.
For each design solution, it is possible to assess the rela-tive difference in construction costs compared with the reference case study B0-1. For concrete bridges B0-2 (-1.89%/B0-1), it is obviously noted that concrete repre-
B0-1 B0-2 B1-10
1
2
3
x 105
Cost (€)
B0-1 B0-2 B1-10
200
400
600
800
Cost (€/m2)
[1 2 3 4 5] [6 7 8] [9 10]0
500
1000
Cost (€
/m2)
Equipments
Concrete deck
Steel girders
Bearings
Foundations
1, 2, 3, 4, 5 = B0-1, B0-2, B0-3, B0-4, B0-5
6, 7, 8 = B1-1, B1-2, B1-3
9, 10 = B2-1, B2-2
Sustainable Steel-Composite Bridges in Built Environment
Case Study and Variations Page 46
sents a significant part of the construction costs. The case study B1-1 (-13.35%/B0-1) appears as the less ex-pensive solution at the construction stage.
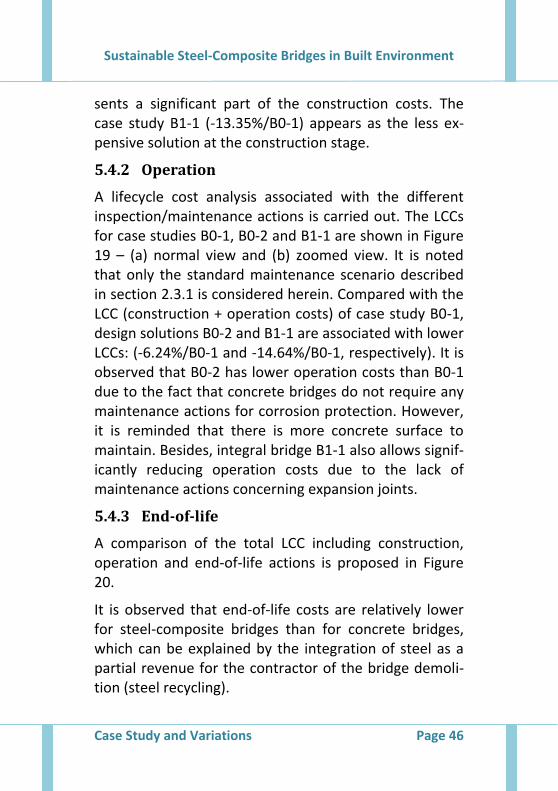
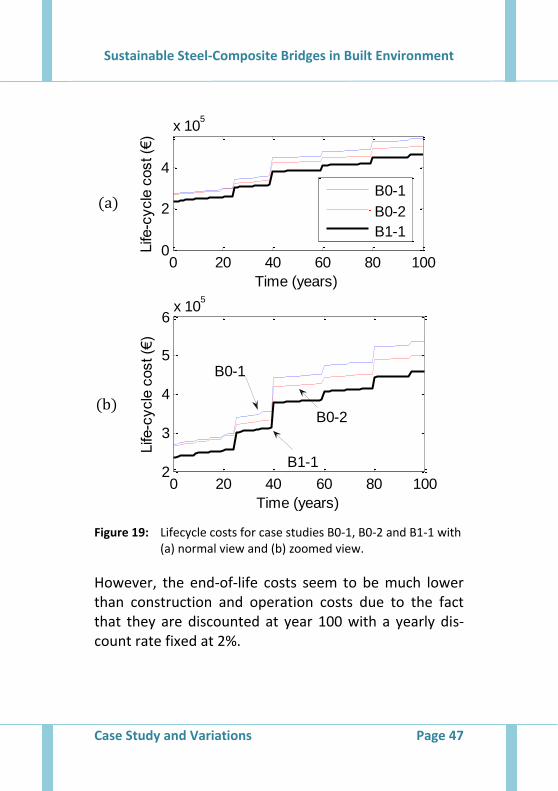
5.4.2 Operation
A lifecycle cost analysis associated with the different inspection/maintenance actions is carried out. The LCCs for case studies B0-1, B0-2 and B1-1 are shown in Figure 19 – (a) normal view and (b) zoomed view. It is noted that only the standard maintenance scenario described in section 2.3.1 is considered herein. Compared with the LCC (construction + operation costs) of case study B0-1, design solutions B0-2 and B1-1 are associated with lower LCCs: (-6.24%/B0-1 and -14.64%/B0-1, respectively). It is observed that B0-2 has lower operation costs than B0-1 due to the fact that concrete bridges do not require any maintenance actions for corrosion protection. However, it is reminded that there is more concrete surface to maintain. Besides, integral bridge B1-1 also allows signif-icantly reducing operation costs due to the lack of maintenance actions concerning expansion joints.
5.4.3 End-of-life
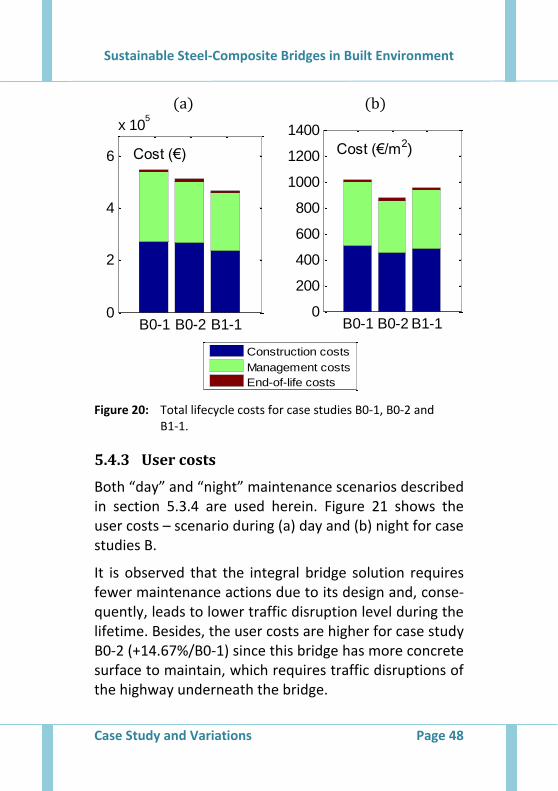
A comparison of the total LCC including construction, operation and end-of-life actions is proposed in Figure 20.
It is observed that end-of-life costs are relatively lower for steel-composite bridges than for concrete bridges, which can be explained by the integration of steel as a partial revenue for the contractor of the bridge demoli-tion (steel recycling).
Sustainable Steel-Composite Bridges in Built Environment
Case Study and Variations Page 47
(a)
(b)
Figure 19: Lifecycle costs for case studies B0-1, B0-2 and B1-1 with (a) normal view and (b) zoomed view.
However, the end-of-life costs seem to be much lower than construction and operation costs due to the fact that they are discounted at year 100 with a yearly dis-count rate fixed at 2%.
0 20 40 60 80 1000
2
4
x 105
Time (years)
Life
-cycle
cost (€
)
B0-1
B0-2
B1-1
0 20 40 60 80 1002
3
4
5
6x 10
5
Time (years)
Life
-cycle
cost (€
)
B0-1
B0-2
B1-1
Sustainable Steel-Composite Bridges in Built Environment
Case Study and Variations Page 48
(a) (b)
Figure 20: Total lifecycle costs for case studies B0-1, B0-2 and B1-1.
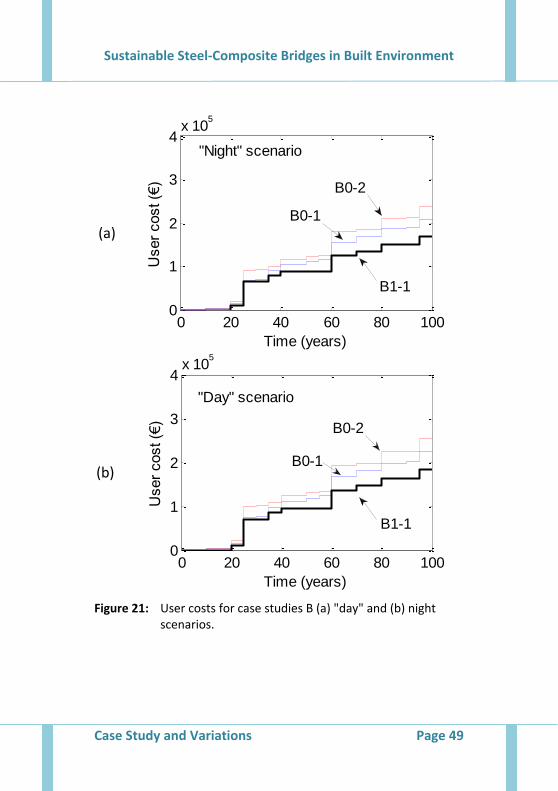
5.4.3 User costs
Both “day” and “night” maintenance scenarios described in section 5.3.4 are used herein. Figure 21 shows the user costs – scenario during (a) day and (b) night for case studies B.
It is observed that the integral bridge solution requires fewer maintenance actions due to its design and, conse-quently, leads to lower traffic disruption level during the lifetime. Besides, the user costs are higher for case study B0-2 (+14.67%/B0-1) since this bridge has more concrete surface to maintain, which requires traffic disruptions of the highway underneath the bridge.
B0-1 B0-2 B1-10
2
4
6
x 105
Cost (€)
B0-1 B0-2 B1-10
200
400
600
800
1000
1200
1400
Cost (€/m2)
B0-1B0-2B0-3B0-4B0-5 B20
1
2
3
4
5
6
7x 10
5
Construction costs
Management costs
End-of-life costs
Sustainable Steel-Composite Bridges in Built Environment
Case Study and Variations Page 49
(a)
(b)
Figure 21: User costs for case studies B (a) "day" and (b) night scenarios.
0 20 40 60 80 1000
1
2
3
4x 10
5
Time (years)
User
cost (€
)
"Night" scenario
B0-2
B0-1
B1-1
0 20 40 60 80 1000
1
2
3
4x 10
5
Time (years)
User
cost (€
)
"Day" scenario
B0-1
B0-2
B1-1
Sustainable Steel-Composite Bridges in Built Environment
Case Study and Variations Page 50
5.5 Synopsis
The application of LCA and LCC analysis to the selected case studies obviously shows the interest of such tools.
Indeed, following a traditional point of view, based on the construction costs (normalized by the area of the deck) would lead to prefer the concrete bridge (case B0.2). The other bridges are then sorted as follow: the integral steel-concrete composite bridge (case B1.1) comes second and the usual steel-concrete composite bridge (Case B0.1) comes third. For the selected case studies, it appears that taking into account the whole Lifecycle Costs return exactly the same order. It is also interesting to notice that the Lifecycle Analysis also con-firm this order.
Nevertheless, the consideration of user costs (for both "Day" and "Night" scenarios) completely changes the order. For this criteria the integral steel-concrete com-posite bridge (Case B1.1) comes first, the concrete bridge (Case B0.2) comes second and the usual steel-concrete composite bridge (Case B0.1) comes third.
To conclude, it appears that for such short spans, inte-gral abutments should be preferred to usual abutments (with bearings and expansion joints). Then the choice between a concrete bridge and a steel-concrete compo-site bridge will be governed by the importance given to user costs and therefore to the position of the bridge in the transport network.
Sustainable Steel-Composite Bridges in Built Environment
Case Study and Variations Page 51
The method adopted in this research project for the combination of different criteria is the Preference Rank-ing Organization Methodology of Enrichment Evaluation (PROMETHEE).
For the weighting of different criteria, there different scenarios were considered:
Scenario 1 considered equal importance for the three main criteria: environmental, economical and user costs (1/1/1);
Scenario 2 considered a higher importance to the environmental criterion in relation to economical and user costs (2/1/1);
Scenario 3 considered a higher importance to the economical criterion in relation to environmental and user costs (1/2/1);
Scenario 4 considered a higher importance to the user costs in relation to environmental and econom-ical criteria (1/1/2).
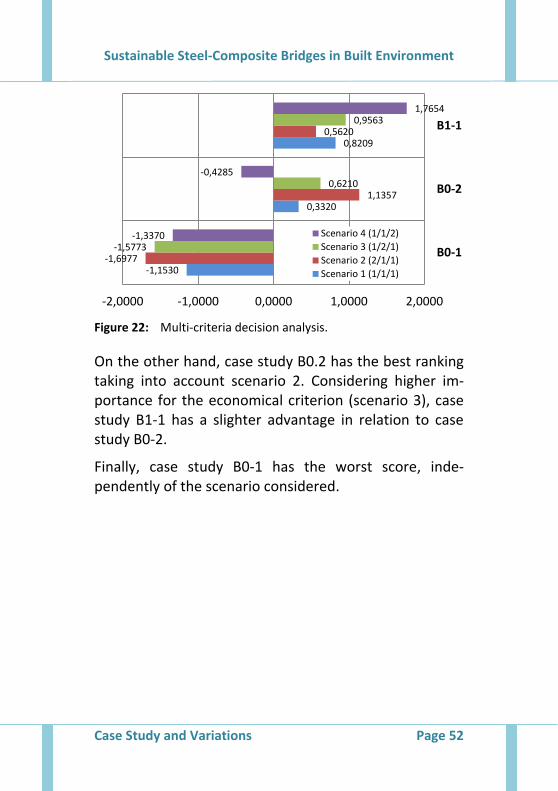
Therefore, the combination of different criteria is illus-trated in Figure 22, for the different weighting scenarios described above. Higher values correspond to higher rankings and thus better performance.
As observed from Figure 22, considering equal im-portance for the three main criteria (scenario 1), case study B1-1 has clearly the best rank. The same conclu-sion is taken in case of scenario 3.
Sustainable Steel-Composite Bridges in Built Environment
Case Study and Variations Page 52
Figure 22: Multi-criteria decision analysis.
On the other hand, case study B0.2 has the best ranking taking into account scenario 2. Considering higher im-portance for the economical criterion (scenario 3), case study B1-1 has a slighter advantage in relation to case study B0-2.
Finally, case study B0-1 has the worst score, inde-pendently of the scenario considered.
-1,1530
0,3320
0,8209
-1,6977
1,1357
0,5620
-1,5773
0,6210
0,9563
-1,3370
-0,4285
1,7654
-2,0000 -1,0000 0,0000 1,0000 2,0000
B0-1
B0-2
B1-1
Scenario 4 (1/1/2)
Scenario 3 (1/2/1)
Scenario 2 (2/1/1)
Scenario 1 (1/1/1)
Sustainable Steel-Composite Bridges in Built Environment
Conclusions and Outlook Page 53
6 Conclusions and Outlook
Sustainability in civil engineering is a fledging discipline in most European countries. As to the authors knowledge the SBRI-project represents the first ap-proach to perform a lifecycle analysis of road bridges at an international level.
In this handbook the complete process is described in a concise way with the necessary information about the lifecycle performance and maintenance strategies as well as the approach for lifecycle assessment and lifecy-cle costs.
In the case study the integral steel-composite bridge shows obviously the best performance in regard of sus-tainability although it does not manifest the lowest con-struction costs per m2. The investigations clearly showed the importance of the maintenance scenario for sustain-able bridges.
Providing internationally harmonized parameters – such as basic types of inspection- and maintenance-strategies or the average service life for bridge elements – the SBRI-project might turn out to be a milestone for the future development of rules and guidelines for sustaina-ble bridges in Europe.
The authors would highly appreciate if this handbook for sustainable steel-composite bridges would also contrib-ute towards cultivating the idea of sustainability being a quantifiable criterion beyond bridges in general.
Sustainable Steel-Composite Bridges in Built Environment
Literature Page 54
Literature
[1] Maier, P., Kuhlmann, U. Tardivel, Y., Robert, N., Raoul, J., Perdigão, V., Martins, N., Barros, P., Friedrich, H., Krieger, J.: Steel-composite bridges – holistic approach applied to European Case Studies; proceedings of the 6th International Conference on Bridge Maintenance, Safety and Management; Stresa, Italy; July 8-12, 2012.
[2] Sustainable Steel-Composite Bridges in Built Envi-ronment; Research Programme of the Research Fund for Coal and Steel RFSR-CT-2009-00020; 2009-2012.
[3] ISO 14040 Environmental management – lifecycle assessment – Principles and framework; Interna-tional Organization for Standardization; Geneva, Switzerland; 2006.
[4] ISO 14044 Environmental management – lifecycle assessment – Requirements and guidelines; In-ternational Organization for Standardization; Ge-neva, Switzerland; 2006.
[5] Gervásio, H.: Sustainable design and integral lifecycle analysis of bridges; PhD Thesis; Universi-ty of Coimbra, Portugal; 2010.
[6] Jeroen B. Guinée (Ed.) Kluwer: Handbook on lifecycle assessment; Operational Guide to the ISO standards; Academic Publishers; 2002.
Sustainable Steel-Composite Bridges in Built Environment
Literature Page 55
[7] ISO 15686-5: Lifecycle costing: “Methodology for systematic economic evaluation of lifecycle costs over a period of analysis; 2008.
[8] Kirk, S. & Dell’Isola, A.: Lifecycle costing for de-sign professionals; MacGraw-Hill, 2nd ed.; NY, USA, 1995.
[9] Landolfo, R.: Sustainable design of structures: The outcomes of the COST Action C25-WG3; The Third International Symposium on Lifecycle Civil Engineering (IALCCE 2012); Lifecycle and Sustain-ability of Civil Infrastructure Systems – Strauss, Frangopol & Bergmeister (Eds), pp. 107-120; Aus-tria, Vienna, 2013.
[10] Frangopol D. M. & Estes A.C.: Lifecycle Evaluation and Condition Assessment of Structures; Chen W.-F. &.Lui E. M. (eds); Structural Engineering Handbook, Second Edition CRC Press, 36 1 to 51; 2005.
[11] Troive S.: Structural LCC Design of Concrete Bridges; Doctoral Thesis, Royal Institute of Tech-nology, TRITA-BKN; Bulletin 41, ISSN 1103-4270; Stockholm 1998.
[12] Woodward, D. G.: Lifecycle costing—Theory, in-formation acquisition and application; Interna-tional Journal of Project Management, vol. 15, no. 6, pp. 335–344; 1997.
Sustainable Steel-Composite Bridges in Built Environment
Literature Page 56
[13] Irzik M., Holst R., Lehan A., Schmellekamp C.: Da-ta and scenario for the basic example; Internal report for the RFCS project RFSR-CT-2009-00020 “Sustainable Steel-Composite Bridges in Built En-vironment”; Bergisch Gladbach, Germany, De-cember 2009.
[14] Vorster, M. C., Bafna, T. & Weyers, R. E.: Model for determining the optimum rehabilitation cycle for concrete bridge decks; Journal of Structural Engineering, ASCE, vol. 1319, pp. 62–67; 1991.
[15] Markow, M., Madanat, S. & Gurenich, D.: Opti-mal rehabilitation times for concrete bridge decks; Transportation Research Record, vol. 1392; 1993.
[16] Ferry, D. J. & Flanagan, R.: Lifecycle costing: A radical approach; Construction Industry Research and Information Association; London, UK, 1991.
[17] Gervásio, H., Simões da Silva, L., Perdigão, V., Barros, P., Orcesi, A., Nielsen, K.: Life cycle analy-sis of highway composite bridges; proceedings of the 6th International Conference on Bridge Maintenance, Safety and Management, Stresa, Italy, July 8-12, 2012.
Sustainable Steel-Composite Bridges in Built Environment
Annex Page 57
Annex A: Tables
Table A1: Standard maintenance scenario.
Table A2: Lack of money maintenance scenario.
Table A3: Prolonged life maintenance scenario.
Sustainable Steel-Composite Bridges in Built Environment
Annex Page 58
Table A1: Standard maintenance scenario.
Sustainable Steel-Composite Bridges in Built Environment
Annex Page 59
Table A2: Lack of money maintenance scenario.
Sustainable Steel-Composite Bridges in Built Environment
Annex Page 60
Table A3: Prolonged life maintenance scenario.