Embed Size (px)
Citation preview
i
Concrete Cracks in Composite Bridges
A Case Study of the Bothnia Line Railway Bridge over Ångermanälven
VIKTOR ANSNAES HESHAM ELGAZZAR
Master of Science Thesis Stockholm, Sweden 2012

Concrete Cracks in
Composite Bridges
A Case Study of the Bothnia Line Railway Bridge over Ångermanälven
Viktor Ansnaes and Hesham Elgazzar
June 2012
TRITA-BKN. Master Thesis 352, 2012
ISSN 1103-4297
ISRN KTH/BKN/EX-352-SE

©Ansnaes, V & Elgazzar, H, 2012
Royal Institute of Technology (KTH)
Department of Civil and Architectural Engineering
Division of Structural Design and Bridges
Stockholm, Sweden, 2012

i
Preface
We would like to thank our supervisor Henrik Gabrielsson at Reinertsen Sverige for gathering
background information for this thesis and organizing the site visit. We would also thank
Prof. Lars Pettersson for the guidance preparing the report and our examiner Prof. Raid
Karoumi who has been very helpful during the work with this thesis.
We give our thanks to the Bridge Division at KTH Royal Institute of Technology and
Reinertsen for providing working spaces for us during the thesis.
Finally, we would like to thank Anders Carolin at Trafikverket for gathering the drawings and
calculations, Karl-Åke Nilsson who helped us with the crack measurement at the bridge and
Lars-Göran Svensson at Botniabanan for arranging bridge inspection.
Stockholm, June 2012
Viktor Ansnaes and Hesham Elgazzar


iii
Abstract
Cracks in the concrete slab of continuous composite bridges are common due to the tensile
stresses at the supports. These bridges are allowed to crack as long as the cracking is
controlled and not exceeding the design crack width (according to Bro 94 the crack should be
injected if they are bigger than 0.2 mm). The Ångermanälven Bridge (railway bridge part of
the Bothnia line project) was designed with big edge beams of width 1.2 m, 40 % of the total
area of the concrete deck cross-section. During the final inspection cracks larger than the
design crack width (0.3 mm according to Bro 94) were observed over the supports.
In this thesis the design and the construction procedure of the bridge is studied to clarify the
causes of the cracking in the edge beam. The objectives of this thesis were addressed through
a literature study of the different types of cracks and the Swedish bridge codes. The expected
crack width was calculate according to the same code, using a 2-D FEM model for the
moment calculation, and compared with the crack width measured at the bridge.
The result of the calculations shows that tensile stress due to ballast and only restraining
moment due to shrinkage is not big enough to cause the measured crack width. Shrinkage
force and temperature variation effects may have contributed to the concrete cracking in the
edge beams. The large cross-section area of the edge beams indicates that it should be
designed as part of the slab, taking that into consideration, 1.1 % reinforcement ratio in the
edge beams is believed to limit the crack width to the code limits (0.3 mm).
Keywords: Composite Bridge, Cracks, Edge Beam, Bothnia Line, Reinforcement for Crack
Control.


v
Sammanfattning
Sprickor i betongplattan, på grund av dragspänningar vid stöden, är vanligt förekommande i
kontinuerliga samverkansbroar. Dessa brotyper tillåts att spricka, så länge som sprickorna kan
begränsas och inte överstiga den tillåtna sprickbredden (enligt Bro 94 ska sprickbredder över
0,2 mm injekteras). Bron över Ångermanälven (järnvägsbro som en är del av Botniabanan)
konstruerades med stora kantbalkar med en bredd på 1,2 m, 40 % av betongplattans
tvärsnittsarea. Under slutbesiktningen påträffades sprickor vid stöden som var större än den
tillåtna sprickbredden (0,3 mm enligt Bro 94).
I detta examensarbete studeras konstruktionen och byggprocessen av bron för att klargöra
orsakerna till sprickorna i kantbalken. Arbetet behandlades genom en litteraturstudie av olika
spricktyper och den svenska bronormen. Den förväntade sprickbredden beräknades enligt
samma norm, med hjälp av en FEM-modell i 2-D för momentberäkningarna, och jämfördes
sedan med de uppmätta sprickorna från bron.
Resultatet av beräkningarna visar at dragspänningarna, från ballasten och endast
tvångsmoment av betongens krympning, inte är tillräckligt stora för att orsaka den uppmätta
sprickbredden. Normalkraft orsakad av krympning och temperaturvariationer kan ha bidragit
till sprickorna i kantbalken. Kantbalkens stora tvärsnittsarea indikerar att den bör inkluderas i
tvärsnittet vid dimensionering. En armeringsmängd av 1,1 % antas begränsa sprickbredden till
0,3 mm (enligt normen).
Nyckelord: Samverkansbroar, Sprickor, Kantbalk, Bro över Ångermanälven, Botniabanan,
Armering för sprickbegränsning.


vii
Notations
Roman Letters
Notation Description Unit
A Area m2
Ac Concrete area m2
Ac.eff Effective concrete area m2
Acomp Composite area m2
Ar Reinforcement area m2
As Steel area m2
a Correction factor -
ac Distance from concrete center of gravity to composite center of gravity m
ar Distance from reinforcement center of gravity to composite center of
gravity
m
as Distance from steel center of gravity to composite center of gravity m
c Concrete cover mm
def Effective height m
E Modulus of elasticity Pa
Ec Modulus of elasticity for concrete Pa
Ec.eff Effective module of elasticity for concrete Pa
Er Modulus of elasticity for reinforcement Pa
Es Modulus of elasticity for steel Pa
ec Distance from concrete center of gravity to bottom of steel section m

viii
ecomp Distance from composite center of gravity to bottom of steel section m
er Distance from reinforcement center of gravity to bottom of steel section m
es Distance from steel center of gravity to bottom of steel section m
F Force N
fcck Concrete compressive characteristic strength Pa
fck Ultimate compressive strength of concrete Pa
fct Tensile strength of concrete Pa
fctm Concrete tension average strength Pa
fsu Ultimate strength Pa
fsy (Lower) tensile yield limit Pa
h Height of cross-section m
heb Edge beam height m
hs Steel height m
hsl.eb Distance from middle of slab to top of the edge beam m
Ic.xx Moment of inertia (around x-axis) for concrete section m4
Icomp Moment of inertia (around x-axis) for composite section m4
Ir Moment of inertia (around x-axis) for reinforcement m4
Is.xx Moment of inertia (around x-axis) for steel section m4
k Dimension dependent coefficient -
L Length m
M Moment Nm
Ml Moment due to loading Nm
Mshr Moment due to shrinkage Nm
N Shrinkage force N
Δl Additional length m
P Force N
1/rcs Bending 1/m

ix
srm Crack spacing mm
tcm Thickness of the concrete slab (middle part) m
w Weight N
wk Characteristic crack width mm
wm Mean crack width mm
yc Distance from concrete center of gravity to top slab center (origin) m
yr Distance from reinforcement center of gravity to top slab center (origin) m
ys Distance from concrete steel of gravity to top slab center (origin) m
Greek Letters
Notation Description Unit
α Ration of modulus of elasticity between steel and concrete -
β Coefficient, consider long- and short-term loading -
ε Strain -
εct Tensile strain in concrete -
εcu Ultimate strain of concrete -
εcc Creep deformation of concrete -
εcs Mean value for final shrinkage -
εr Permanent strain after unloading -
εs Strain in reinforcement -
εsf Limiting strain -
εsu Strain at ultimate stress -
εsy Stress at tensile yield limit -
ζ Crack safety factor -
θ Slope deflection -

x
κ1 Reinforcement bond coefficient -
κ2 Coefficient, account for strain distribution -
ρr Effective reinforcement ration -
σ Axial stress Pa
σm Stress caused by normal moment Pa
σn Stress caused by normal forces Pa
σs Stress in reinforcement Pa
σsr Stress when cracking appear Pa
σc Stress in concrete Pa
σcc Compressive stress in concrete Pa
σct Tensile stress in concrete Pa
υ Coefficient, account for tension stiffness in concrete between cracks -
ϕ Reinforcement diameter mm
ψγ Load coefficient -

xi
Contents
Preface ........................................................................................................................................ i
Abstract .................................................................................................................................... iii
Sammanfattning ....................................................................................................................... v
Notations ................................................................................................................................. vii
1 Introduction ...................................................................................................................... 1
1.1 Overview ................................................................................................................. 1
1.2 Summary ................................................................................................................. 2
1.3 Aim and scope ......................................................................................................... 2
1.4 Limitations ............................................................................................................... 3
2 Background ...................................................................................................................... 5
2.1 Steel Concrete Composite Bridges .......................................................................... 5
2.2 Structural Behavior .................................................................................................. 6
2.2.1 Concrete ..................................................................................................... 6
2.2.2 Reinforcing steel ........................................................................................ 8
2.2.3 Interaction between concrete and reinforcement...................................... 10
2.3 Different Types of Cracks ..................................................................................... 12
2.3.1 Plastic settlement ...................................................................................... 14
2.3.2 Plastic shrinkage ....................................................................................... 14
2.3.3 Early thermal cracks ................................................................................. 15
2.3.4 Shrinkage .................................................................................................. 17
2.3.5 Service loading ......................................................................................... 17
2.3.6 Restraints .................................................................................................. 18
2.4 Crack Measurements Methods .............................................................................. 20
2.5 Repair Methods ..................................................................................................... 20
2.6 Cracks in the Ångermanälven Bridge.................................................................... 21
3 Methods used in the Thesis ........................................................................................... 25

xii
3.1 Literature Study ..................................................................................................... 25
3.2 Design According to Swedish Standards. ............................................................. 25
3.2.1 BV Bro, utgåva 5 ...................................................................................... 25
3.2.2 Bro 94 ....................................................................................................... 28
3.2.3 BBK 94 ..................................................................................................... 29
3.3 Crack Investigation ................................................................................................ 32
3.3.1 Crack measurements ................................................................................ 32
3.4 FEM-Modelling ..................................................................................................... 32
3.4.1 2-D Beam model ...................................................................................... 34
3.4.2 Full model ................................................................................................ 35
3.4.3 Comparison between the two models ....................................................... 39
4 Calculations .................................................................................................................... 41
4.1 Construction Method ............................................................................................. 41
4.2 Creep and Shrinkage ............................................................................................. 43
4.2.1 Creep ........................................................................................................ 43
4.2.2 Shrinkage .................................................................................................. 44
4.3 Section Properties .................................................................................................. 45
4.3.1 Simplifications ......................................................................................... 45
4.3.2 Coordinate systems and moment of inertia calculation............................ 47
5 Own Measurement ......................................................................................................... 49
6 Results ............................................................................................................................. 51
6.1 Model Results ........................................................................................................ 51
6.2 Expected Crack Width ........................................................................................... 52
6.3 Measured Cracks Width Comparison .................................................................... 52
7 Conclusions and Discussion .......................................................................................... 55
7.1 Conclusions ........................................................................................................... 55
7.2 Discussion ............................................................................................................. 55
7.2.1 Calculation and Swedish Bridge Code ..................................................... 55
7.2.2 Reasons for Cracks ................................................................................... 56
7.2.3 Measurements ........................................................................................... 56
7.2.4 FEM Modeling ......................................................................................... 57
Bibliography ........................................................................................................................... 59
Appendix A Drawings ..................................................................................................... 61

xiii
Appendix B Load Coefficients ........................................................................................ 73
Appendix C Section Properties ....................................................................................... 75
Appendix D Thesis Calculations ..................................................................................... 79
Appendix E Original Calculations ............................................................................... 125
Appendix F FEM Results ............................................................................................. 131


1.1 Overview
1
1 Introduction
1.1 Overview
Bothnia Line (Botniabanan) is a 190 km high-speed railway project between Nyland and
Umeå in the middle of Sweden (see Figure 1.1) and was finished in August 2010. The railway
line has 143 bridges and 25 km of tunnels (Botniabanan, 2010).
Figure 1.1 Map over Bothnia Line, (Botniabanan, 2012).
The studied bridge (see Figure 1.2) passes over Ångermanälven located to the north of
Nyland. It is one of the longest bridges in the project with a total length of 1034 m divided
into 17 spans. The first and the last span is 48 m and the rest are 61 m long (see Appendix A).

1 Introduction
2
The superstructure consists of a composite section (steel concrete box girder). The 18
supports are built using reinforced concrete. Reinforced concrete piles are used for the
foundation of the supports 2-14 and the rest are supported on shallow foundation.
Figure 1.2 Photo of the Ångermanälven Bridge from north side (left) and south side (right).
1.2 Summary
For the continuous composite bridges, the negative moments at the supports develop tensile
stresses at the concrete part of the bridge cross-section. This increases the risk of concrete
cracking (Collin et al., 2008). The stress will be bigger the longer the distance is from the
center of gravity of the cross section. This means that the risk of cracking will increase as
further away from the center of gravity the slab is located (when subjected to tensile stresses).
If the large transversal cracks (with larger width than stipulated in the Swedish code) are not
injected or otherwise taken care of, corrosion of the steel reinforcement and spalling of the
concrete will eventually occur. This results in a shorter life time and higher maintenance cost
for the bridge (Cusson and Repette, 2000).
The Ångermanälven Bridge was completed in 2006 but has so far only been used for test
traffic load. On the final inspection (inspection that takes place after all construction work is
finished), large cracks were found in the edge beams. In the next inspection (performed by the
contractor three years after the final inspection), it was recorded that the number of cracks had
increased, but on the other hand the width of the cracks decreased (still being larger than the
code limits).
1.3 Aim and scope
The aim of the project is to study the design and the construction procedures of the bridge
trying to clarify the causes of the cracking and how it could have been avoided or limited to
acceptable values.
The main questions are:
What are the reasons for the cracks?
What is the theoretical required steel rebar area to limit cracks?
1.4 Limitations
3
What are the Swedish codes limitations for the edge beam and how should it be
designed?
1.4 Limitations
The data about the weather conditions during the curing process was not available.
The time of appearance of the first cracks, if it was before or after placing the ballast
on the bridge, was not available.
Measured concrete temperatures during pouring of different parts of the concrete slab
and edge beams were not available.
No variable loads (temperature variation, live loads, etcetera) were considered in the
thesis calculation.


2.1 Steel Concrete Composite Bridges
5
2 Background
2.1 Steel Concrete Composite Bridges
A composite structure is a structure consisting of two main materials (for girder bridges
normally concrete and steel) which work together as one unit. The interaction between the
materials is usually solved by using studs, which transfer the shear forces. This will result in a
stronger and stiffer structure than the two materials working separately.
In a composite structure, the concrete cannot shrink freely due to the steel interaction. The
shrinkage is represented by a tensile force at the center of the concrete. For a continuous beam
this will also lead to increased moments at the supports (Collin et al., 2008).
In the serviceability limit state; when a composite structure is subjected to positive bending
moment, the concrete is in compression and the steel is mostly in tension (see Figure 2.1). In
an economic point of view this is good, because the materials are stressed effectively
according to their properties. For composite structure subjected to negative bending moment
the concrete is in tension, which means that it is considered to have no resistance. All the
loads will be taken by the steel and reinforcement (Sétra, 2010).
Figure 2.1 Stress distribution in a composite cross section at serviceability limit state
(Sétra, 2010).
When the concrete subjected to tension, cracks will form and the stiffness of the concrete will
be lost (Collin et al., 2008).
2 Background
6
2.2 Structural Behavior
2.2.1 Concrete
When the concrete is initially subjected to small loads, it will have a linear elastic behavior.
When increasing the load, defects in the form of micro cracks are formed in the material
structure that makes the strain increases more rapidly than the stress resulting in a non-linear
non-elastic relationship. If the section is unloaded when it has reached a large portion of the
ultimate strength, some residual strain will remain due to the defects created in the
microstructure.
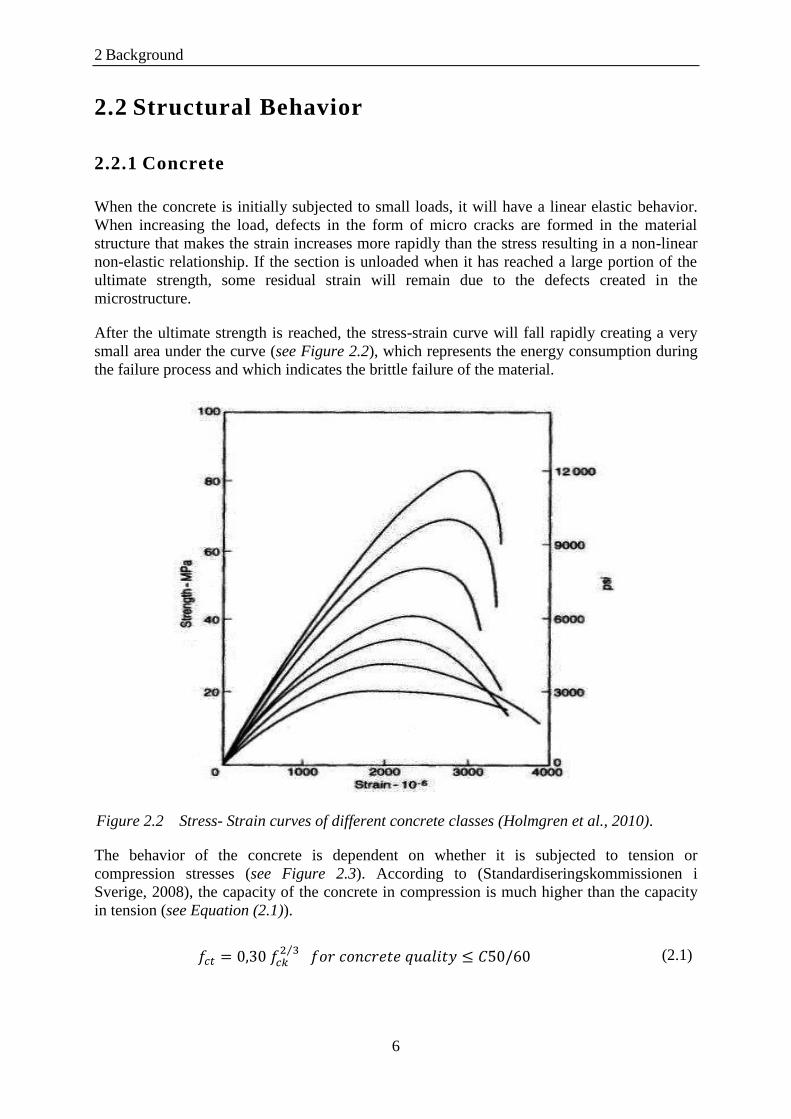
After the ultimate strength is reached, the stress-strain curve will fall rapidly creating a very
small area under the curve (see Figure 2.2), which represents the energy consumption during
the failure process and which indicates the brittle failure of the material.
Figure 2.2 Stress- Strain curves of different concrete classes (Holmgren et al., 2010).
The behavior of the concrete is dependent on whether it is subjected to tension or
compression stresses (see Figure 2.3). According to (Standardiseringskommissionen i
Sverige, 2008), the capacity of the concrete in compression is much higher than the capacity
in tension (see Equation (2.1)).
⁄ (2.1)

2.2 Structural Behavior
7
Since the concrete is a porous material, the mechanical properties are largely determined by
its porosity, which is represented by the water cement ratio of the concrete composition.
The properties of the concrete are also influenced by the manufacturing process which is why
in some important projects, like certain bridges, the compressive strength is determined from
core samples taken from the final structure.
The compressive capacity of the concrete is not a pure material property but a combination of
both tensile and shear capacity of the section, which makes the results highly dependent on
the test procedures adopted to determine it. To minimize the effects of test procedures, the
specifications for the tests, to determine the compressive strength, must be strictly followed.
Concrete is classified according to its characteristic compressive strength e.g. C50/60
indicating characteristic cylinder strength of at least 50 MPa and characteristic cube strength
of at least 60 MPa. In practice most of the used concrete are in the class range from C20/25 to
C50/60 and the classes higher than that is called high strength concrete.
The tensile strength of the concrete is less important than the compressive strength because
the brittleness of the concrete makes it very hard to safely utilize the tensile strength. It is
also very difficult to measure tensile strength in a precise way (Holmgren et al., 2010).
Figure 2.3 Concrete behavior in Compression and tension
(Alfredsson and Spåls, 2008).
Cracking of the concrete occurs when the tension stresses in the section exceeds the tensile
strength of the concrete. The initiation and development of the cracks in a concrete specimen
subjected to increasing tensile deformation until failure is presented (see Figure 2.4).
When starting to load the specimen in tension, micro cracks starts to form at the weak points
of the structure (see Figure 2.4b) and through increased loading, these micro cracks start to
connect to one other and form a fracture zone at the weakest section until the tensile strength
of the concrete is reached (see Figure 2.4c). When the stress exceeds the tensile strength, the
stresses in the fracture zone start to decrease with the increased deformation while the strain is

2 Background
8
decreasing in the rest of the specimen (see Figure 2.4d). Eventually a fully developed crack is
formed in the fracture zone, which cannot transfer any stresses (see Figure 2.4e). The
concrete around the crack, which has not reached its tensile strength during the loading
process, will then be unloaded and a redistribution of the stresses and deformations within the
section will occur (Johansson, 2000).
Figure 2.4 Crack initiation and development until failure in a concrete specimen
(Johansson, 2000).
2.2.2 Reinforcing steel
Steel exposed to a pulling force, generates tension stresses in the material (see Figure 2.5).
The stress depends on the force and the area of the steel reinforcement (see Equation (2.2)).
(2.2)
At the same time, the material increase in length. The ratio between the additional length and
the original length is called strain (see Equation (2.3)) (Burström, 2007).

2.2 Structural Behavior
9
(2.3)
Figure 2.5 Material exposed to pulling force (Burström, 2007).
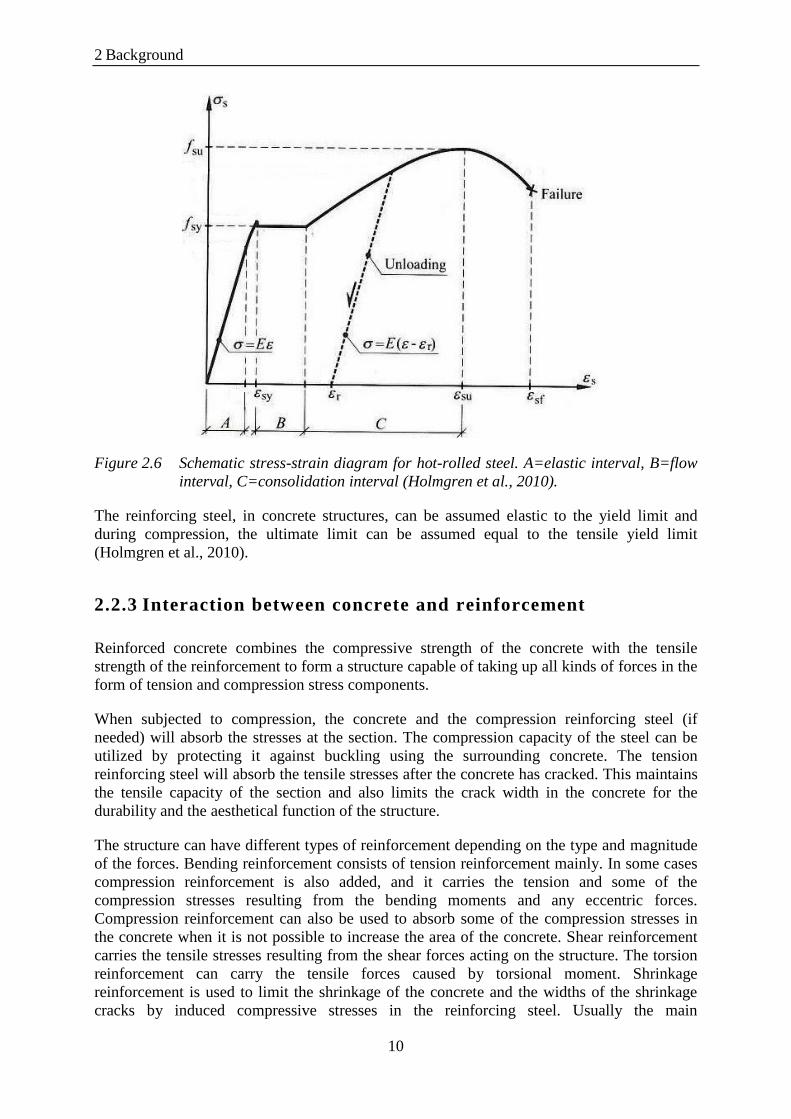
The stress-strain relation for steel (see Figure 2.6) is linear elastic until it reaches the tensile
yield limit. During this interval, the deformation is restored if the load is removed. When the
yield limit is reached the strain increase and the stress is unchanged because the steel is
yielding. After the flow interval, the stress and strain increase until the ultimate strength is
reached. When the ultimate strength is reached, the stress decrease and the strain increase
until the failure. If the load is removed after the yield limit, the strain and stress will decrease
(parallel to the linear elastic curve), but some residual deformation will remain permanently.
2 Background
10
Figure 2.6 Schematic stress-strain diagram for hot-rolled steel. A=elastic interval, B=flow
interval, C=consolidation interval (Holmgren et al., 2010).
The reinforcing steel, in concrete structures, can be assumed elastic to the yield limit and
during compression, the ultimate limit can be assumed equal to the tensile yield limit
(Holmgren et al., 2010).
2.2.3 Interaction between concrete and reinforcement
Reinforced concrete combines the compressive strength of the concrete with the tensile
strength of the reinforcement to form a structure capable of taking up all kinds of forces in the
form of tension and compression stress components.
When subjected to compression, the concrete and the compression reinforcing steel (if
needed) will absorb the stresses at the section. The compression capacity of the steel can be
utilized by protecting it against buckling using the surrounding concrete. The tension
reinforcing steel will absorb the tensile stresses after the concrete has cracked. This maintains
the tensile capacity of the section and also limits the crack width in the concrete for the
durability and the aesthetical function of the structure.
The structure can have different types of reinforcement depending on the type and magnitude
of the forces. Bending reinforcement consists of tension reinforcement mainly. In some cases
compression reinforcement is also added, and it carries the tension and some of the
compression stresses resulting from the bending moments and any eccentric forces.
Compression reinforcement can also be used to absorb some of the compression stresses in
the concrete when it is not possible to increase the area of the concrete. Shear reinforcement
carries the tensile stresses resulting from the shear forces acting on the structure. The torsion
reinforcement can carry the tensile forces caused by torsional moment. Shrinkage
reinforcement is used to limit the shrinkage of the concrete and the widths of the shrinkage
cracks by induced compressive stresses in the reinforcing steel. Usually the main

2.2 Structural Behavior
11
reinforcement absorbs these stresses, but sometimes there is a need for extra reinforcement
(especially when using pre-stressed concrete).
When loading the structure, the reinforced concrete passes through three different stages until
rupture (see Figure 2.7).
In the first stage, the concrete is uncracked. The concrete is able to take tensile stress.
In the second stage, the tensile zones in the concrete begin to crack. The direction of the
cracks is perpendicular to the tensile stresses. The tensile stress in the cracked part is taken up
by the reinforcement. This stage usually corresponds to the service condition for the beam.
The third stage (ultimate stage) represents the conditions close to the bending failure of the
structure. There are two types of failures. The first one occurs when the yield limit in the
reinforcement is reached and the second one occurs when the ultimate limit of the concrete is
reached (Holmgren et al., 2010).

2 Background
12
Figure 2.7 Stages in a reinforced concrete beam when subjected to increasing loading.
Crack illustration, expected stress and strain distribution. NA=neutral axis
(Holmgren et al., 2010).
2.3 Different Types of Cracks
Cracks in reinforced concrete have different structure and size depending on what is causing
them. According to (Concrete Society, 2010) the cracks can be divided in different categories
(see Figure 2.8).

2.3 Different Types of Cracks
13
Figure 2.8 Types of cracks (Concrete Society, 2010).
Cracks can highly affect the durability and safety of a bridge and therefore it is important to
know the different types of causes. The types of cracks mostly depends on the following
factors (Radomski, 2002):
Time of formation, after casting or construction
External appearance (see Figure 2.9)
Width and spreading
Figure 2.9 Crack location (Concrete Society, 2010).

2 Background
14
The different causes below could have been a contributing factor for the cracking in the
Ångermanälven Bridge.
Plastic settlement
Plastic shrinkage
Early thermal cracks
Shrinkage
Service Loading
Restraints
2.3.1 Plastic settlement
The plastic settlement cracks are caused by the difference in the restraining conditions of the
concrete. When the concrete is prevented from settling at some parts (e.g. by steel
reinforcement) while the adjacent concrete parts are allowed to settle, the cracks can be
formed over the restraining elements, e.g. reinforcement bars.
The cracks are formed in the first hours after casting the concrete. They are distinguished by
their pattern that mirrors the pattern of the restraining elements such as the steel reinforcement
or the change in the section shape (see Figure 2.10) (Cement Concrete & Aggregates
Australia, 2005).
The crack size can be larger than 1 mm. (Radomski, 2002).
Figure 2.10 Plastic settlement cracks formed above the steel reinforcement and large
aggregates particles (Cement Concrete & Aggregates Australia, 2005).
2.3.2 Plastic shrinkage
Plastic shrinkage is caused by dehydration of the fresh concrete (Burström, 2007).

2.3 Different Types of Cracks
15
The formations of the cracks appears during the first hours after casting and have a cracking
pattern or long cracks on the surface (see Figure 2.11). The cracks can be large, (over 1 mm)
(Radomski, 2002).
Figure 2.11 Crack illustration (Radomski, 2002).
2.3.3 Early thermal cracks
Early thermal cracks are caused by expansion and contraction of the concrete due to change in
temperature (see Figure 2.12). The temperature change is caused by the reaction between
cement and water (hydration), which generates heat. The cracks appear when the concrete is
cooling during the curing process (Burström, 2007).

2 Background
16
Figure 2.12 Change in mean temperature for newly cast concrete elements and laboratory
test (with 100% restraint) of the stresses. S - Std Slite cement, A - Std
Degerhamn cement, cement quantities 331 kg/m3 and 400 kg/m
3
(Betongföreningen. Kommittén för sprickor i betong, 1994).
There are two different types of early thermal cracks; surface cracks and deep through cracks
(see Figure 2.13). The surface cracks are formed during the expansion of the concrete in the
first few hours after casting. They do not have a general pattern and some of the cracks close
during the contraction phase, in a self-healing process (Betongföreningen. Kommittén för
sprickor i betong, 1994).
The through cracks are formed during the contraction phase of concrete and might be located
above the construction joints in the old concrete walls or due to other restraining condition by
the old concrete. The cracks are smaller than 0.4 mm (Radomski, 2002).

2.3 Different Types of Cracks
17
Figure 2.13 Examples of surface and through early thermal cracks in concrete
(Betongföreningen. Kommittén för sprickor i betong, 1994).
2.3.4 Shrinkage
Shrinkage is caused by contraction of the concrete when the water leaves the pores in the
cement paste (Burström, 2007).
The formations of the cracks appear several months after the construction work are finished
and are similar to bending or tension cracks (see Figure 2.14). The cracks are usually smaller
than 0.4 mm if the amount of reinforcement is enough (Radomski, 2002).
2.3.5 Service loading
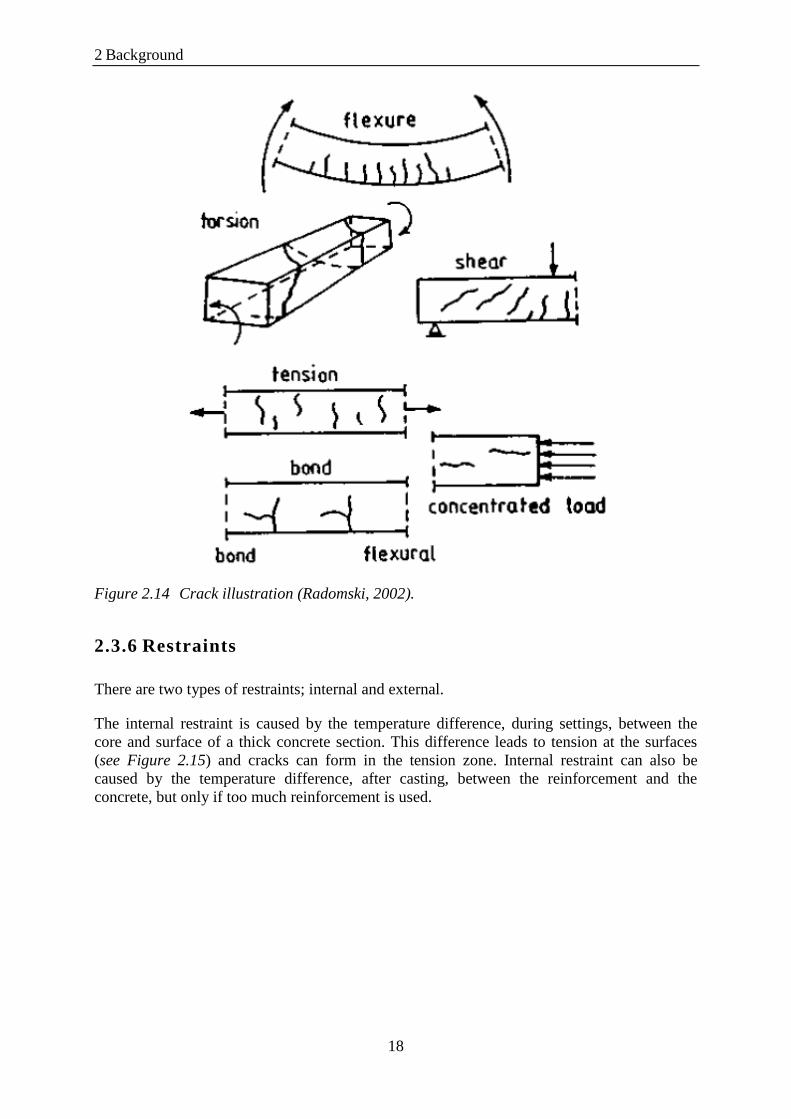
Service loading cracks is caused by different external forces (see Figure 2.14). The formation
of the cracks depends on the type of force and the appearance depends on the usage of the
structure. The cracks are generally small, but larger cracks may occur in areas where concrete
cracking is hard to asses (underestimation of the long term load etcetera). (Radomski, 2002).
2 Background
18
Figure 2.14 Crack illustration (Radomski, 2002).
2.3.6 Restraints
There are two types of restraints; internal and external.
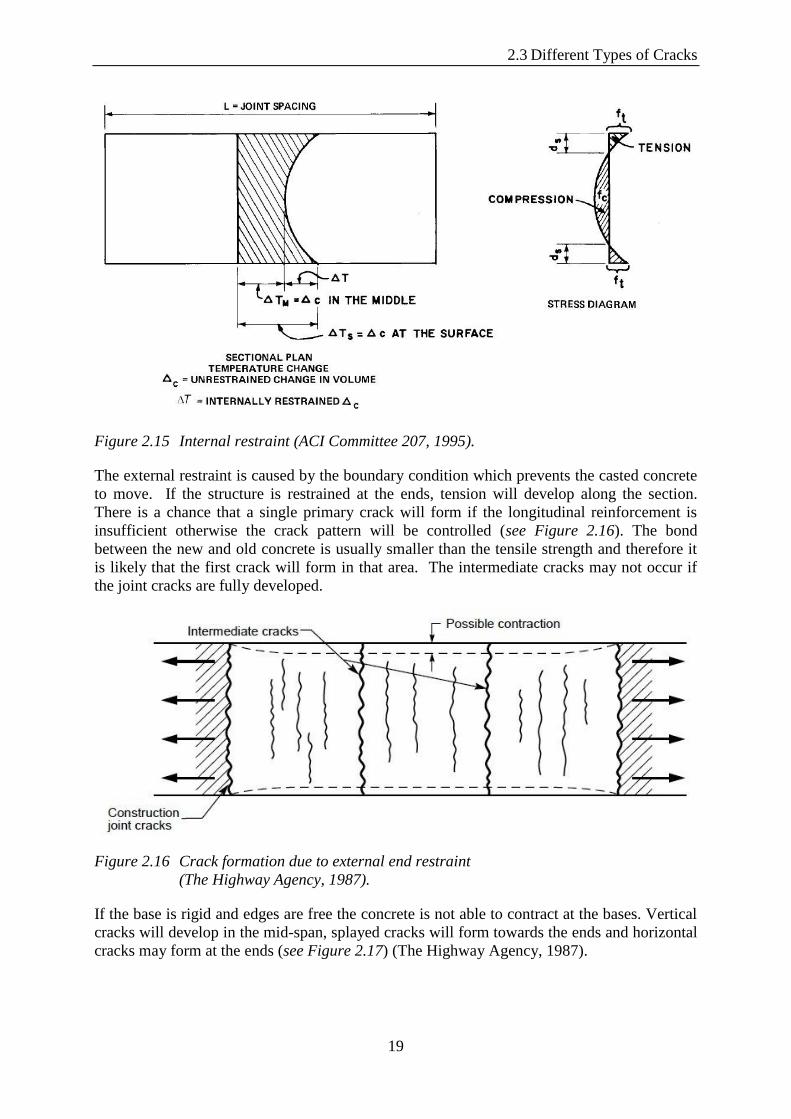
The internal restraint is caused by the temperature difference, during settings, between the
core and surface of a thick concrete section. This difference leads to tension at the surfaces
(see Figure 2.15) and cracks can form in the tension zone. Internal restraint can also be
caused by the temperature difference, after casting, between the reinforcement and the
concrete, but only if too much reinforcement is used.
2.3 Different Types of Cracks
19
Figure 2.15 Internal restraint (ACI Committee 207, 1995).
The external restraint is caused by the boundary condition which prevents the casted concrete
to move. If the structure is restrained at the ends, tension will develop along the section.
There is a chance that a single primary crack will form if the longitudinal reinforcement is
insufficient otherwise the crack pattern will be controlled (see Figure 2.16). The bond
between the new and old concrete is usually smaller than the tensile strength and therefore it
is likely that the first crack will form in that area. The intermediate cracks may not occur if
the joint cracks are fully developed.
Figure 2.16 Crack formation due to external end restraint
(The Highway Agency, 1987).
If the base is rigid and edges are free the concrete is not able to contract at the bases. Vertical
cracks will develop in the mid-span, splayed cracks will form towards the ends and horizontal
cracks may form at the ends (see Figure 2.17) (The Highway Agency, 1987).

2 Background
20
Figure 2.17 Crack formation due to external edge restraint
(The Highway Agency, 1987).
If the end and edge restraint is combined, the crack pattern will be different (see Figure 2.18).
Figure 2.18 Crack formation for combined external end and edge restraints
(The Highway Agency, 1987).
The cracks are generally smaller than 0.2 mm, but larger cracks can occur if the reinforcement
is not sufficient (Radomski, 2002).
2.4 Crack Measurements Methods
A measuring magnifier used to measure crack width in concrete structures. The
recommendation is to use a loupe with a 10 times magnifier and a measure scale of 0.1 mm
step (Vägverket, 1994a).
2.5 Repair Methods
Cracks due to load, shrinkage temperature etcetera can be rehabilitated by protection against
aggressive substances using the following methods:
Hydrophobic impregnation
Sealing
Cover of cracks with local membrane
Filling of cracks
2.6 Cracks in the Ångermanälven Bridge
21
Changing crack into a joint
Structural shielding and cladding
Surface protection with paint
They can also be rehabilitated by strengthening of the structure component using the
following methods (Danish Standards Association, 2004):
Replacing/supplementing reinforcement
Reinforcement in bored holes
Adhering flat-rolled steel or fiber-composite material as external reinforcement
Application of mortar or concrete
Injection of cracks, voids and interstices
Filling of cracks, voids and interstices
Post-tensioning with external cables
The repair method for fixing cracks depends on if the crack is dormant or live. Dormant crack
is unlikely to change in size after the repair. Live cracks are cracks which are expected to
move (change in size) after the repair, for example due to loading. The repair method also
depends on if the cracks are multiple or not.
For live multiple cracks, it is recommended, according to (Concrete Society, 2010), to use
either liquid membrane or preformed membrane (bonded or unbounded sheets) as a repair
method. The preformed membrane is to prefer if further cracking is expected. The advantage
of using fully bonded sheets is that water has a lower chance to enter the structure in case of a
damage membrane (Concrete Society, 2010).
2.6 Cracks in the Ångermanälven Bridge
According to the crack investigation report (Carlsson, 2008), the cracks are located in the
edge beam, around the supports. The cracks are probably through the edge beam with a
direction transverse to the bridge direction (see Figure 2.19).

2 Background
22
Figure 2.19 Cracks at support 16, left side (Carlsson, 2008).
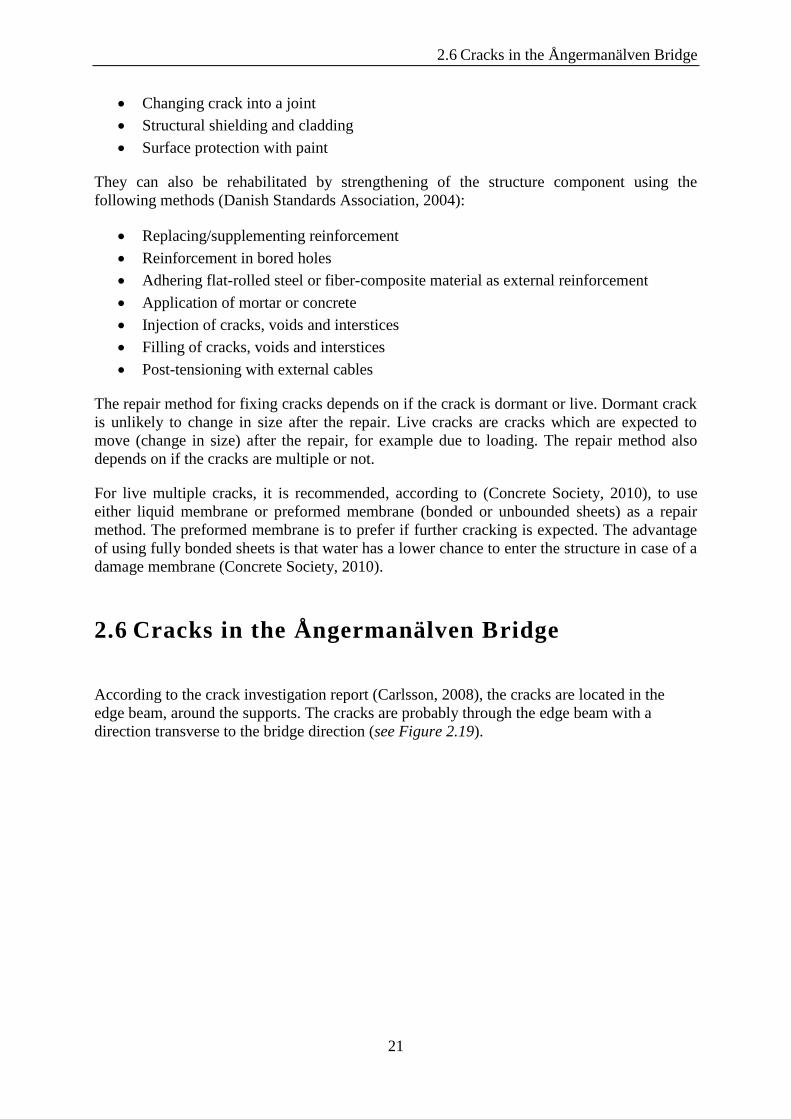
The crack widths and location have been documented by (Peab AB, 2011). The measurements
of the cracks width was done as follows:
A picture of the crack and a ruler was taken. The cracks were measured in the program
EasyEL, using the ruler as a reference.
The cracks on the top, middle and side (see Figure 2.20) of the right and left edge
beam was measured in 2007. The biggest cracks at the top were 0.38 mm at crack
number 6 for the left beam and 0.44 mm at crack number 7 for the right beam (see
Table 2.1). In 2011, the top was documented again and some new cracks had appeared
(see Figure 2.21). The biggest cracks at the top were now 0.26 mm at crack number 7
for the left beam and 0.36 mm at crack number 5 for the right beam. The cracks at the
top, which was assumed to belong to the same section, were added to see if the
development of new cracks were decreasing the old cracks.
Figure 2.20 Crack location on edge beam. a) Top, b) Middle, c) Side.

2.6 Cracks in the Ångermanälven Bridge
23
Table 2.1 Crack number, location and width (mm) for the right and left edge beam at
support 16 (Peab AB, 2011).
No. Section Year 2007 No. Section Year 2007
Top Middle Side Top Top Middle Side Top
1 484+783,6 - 0,45 0,41 - 1 484+783,2 0,42 0,35 0,23 0,32
484+785,7 0,28 - - 2 484+787,5 0,1
2 484+787,6 0,32 0,27 0,38 0,24 3 484+787,7 0,35 0,36 0,48 0,18
Σ 2-3: 0,28
3 484+787,9 -
4 484+788,9 0,34 - 0,42 0,18
4 484+788,1 0,21 - 0,27 0,22
5 484+789,3 0,39 0,37 0,27 0,36
5 484+788,6 0,16
Σ 2,4: 0,53 0,65 Σ 2-5: 0,46 6 484+789,6 0,17
6 484+789,7 0,38 0,35 0,43 0,2 7 484+790,3 0,44 0,35 - 0,27
Σ 4,5,7: 1,17 Σ 4-7: 0,98
484+790,1 - 0,28
8 484+792,1 - 0,34 - 0,21
7 484+790,3 0,36 0,34 0,26
8 484+791,3 0,35 0,28 0,2 0,2
Σ 6-8: 1,09 Σ 6-8: 0,66
9 484+793,9 - - 0,35 0,19
Support 16, Left Side (West)
Year 2011
Support 16, Right Side (East)
Year 2011
2 Background
24
Figure 2.21 Location of the cracks on the left (above) and right (below) edge beam at
support 16 (Peab AB, 2011).

3.1 Literature Study
25
3 Methods used in the Thesis
3.1 Literature Study
The project started with a literature study on the properties of reinforced concrete, regarding
strength and cracking. The study also included an introduction to composite bridges. The
cause, formation and time of different types of cracks were also studied for the crack
investigation. Parts in BBK 94, BRO 94 including supplement nr 4 and BV Bro, utgåva 5
regarding maximum crack widths and required reinforcement area, were studied. A study of
different repair methods was performed to see how the cracks could be repaired.
3.2 Design According to Swedish Standards.
The crack width in the edge beam was calculated according to BRO 94 (bridge code) with
supplement nr 4, BV Bro, utgåva 5 (railway bridge code) and BBK 94 (concrete code). The
stresses used in the calculations were based on the forces from the FEM-model. This was
done to see if the lack of reinforcement was causing the cracks.
3.2.1 BV Bro, utgåva 5
The requirements of the design of railway bridges are according to (Banverket, 1999). The
sections of BV Bro are mentioned within the parenthesis.
Crack width and exposure class
The acceptable crack width allowed in a concrete structure (see Table 3.1) is depending on the
exposure class (see Table 3.2) and bridge lifetime.

3 Methods used in the Thesis
26
Table 3.1 Maximum crack width wk in mm and minimum crack safety factor
(Vägverket, 1999b).
Table 3.2 Environmental classes (Banverket, 1999).
Ångermanälven Bridge is designed for a lifetime of 120 years. The concrete slab belongs to
environmental class L2 because it is part of the superstructure.
Loads
Due to assumptions, load coefficients in Table 3.3 are the ones considered in this case (for full
table see Appendix B).

3.2 Design According to Swedish Standards.
27
Table 3.3 Load coefficients ψγ for load combination I, V:A and V:B, extraction from (BV
222-1), (Banverket, 1999).
Dimensions of the edge beam
Edge beams with casted balusters should be designed with a width of at least 400 mm.
The top of the edge beam should at least slope 1:20 towards the middle.
The height of the edge beam should be designed for a future track lifting of at least 150 mm
(BV 441.25).
Crack width limitation
All concrete surfaces, except the edge of the bottom slabs, should use mesh as surface
reinforcement with a diameter of at least 12 mm and a maximum spacing of 200 mm, if the
crack width calculation does not require more reinforcement. Control of the minimum
required reinforcement ratio (see Equation (3.1)) according to BBK 94 is not needed.
(3.1)
Where
As is the reinforcement area.
fst is the tensile strength of the reinforcement steel ≤ 420 MPa.
Aef is the effective concrete area.
fcth is a high value of the concrete strength.
If Equation (3.1) is used to calculate the minimum required reinforcement ratio in the edge
beams, it will result in 1 % reinforcement ratio. Which is the same as the recommended
reinforcement ratio according to Bro 94 (see 3.2.2).
Crack width limitation according to Bro 94 (see Table 3.1) is not valid in the construction
stage. However Equation (3.2) still has to be fulfilled.
(3.2)

3 Methods used in the Thesis
28
This specially regards bridges which in the construction stage have a different moment
distribution than in the final stage (BV 442.321) (Banverket, 1999).
3.2.2 Bro 94
Requirements for the design of the reinforcement in the slab and edge beam according to
(Vägverket, 1994b) and (Vägverket, 1999a). The sections of Bro 94 are mentioned within the
parenthesis.
Crack width limitation
The distance between the studs in the longitudinal direction can be used instead of the crack
spacing srm (see Equation (3.7)) in the concrete slab in the serviceability limit state. This is
only valid if the studs have been placed in pair in the longitudinal direction (53.32).
The spacing in the edge beam is calculated according to Equation (3.7) because the distance
from the studs to the edge beam is considered to be too far to have an effect on the cracking.
Design of longitudinal reinforcement in a steel -concrete composite bridge
slab
Longitudinal reinforcement should be added in the concrete slab so that the total amount of
reinforcement is at least 0.50 % of the concrete cross-section area. This requirement also
applies to compressed concrete.
In parts of the slab which are cracked due to load combination V:A (serviceability limit state),
the longitudinal reinforcement together with additional reinforcement should be at least 1.0 %
of the concrete cross-section area. The maximum allowed reinforcement diameter is 16 mm
(53.341).
In the concrete casting joints in the transverse direction should have longitudinal
reinforcement of at least 0.70 % of the concrete cross section area (53.342) (Vägverket,
1999a).
Crack width control in concrete structures
Additional surface reinforcement should be used in structural members where shrinkage and
temperature cracks usually are common (42.321).
The reinforcement should be installed so that concrete with a gravel size of 32 mm could be
used in the pouring process. Processing of the concrete should also be possible (44.311).
Injection of cracks
Cracks with a width larger than 0.2 mm should be injected (44.55) (Vägverket, 1994a).

3.2 Design According to Swedish Standards.
29
3.2.3 BBK 94
Relevant sections are mentioned within parenthesis.
Cracking criteria
These crack criteria can be used in both in serviceability and ultimate limit state. The
limitation of the case depends on the boundary condition in the cracking section.
A plate, beam, column or similar part subjected to a bending moment and normal force, the
concrete subjected to tensile force is considered uncracked if Equation (3.3) is fulfilled.
(3.3)
Where
n is the stress caused by normal forces (positive during tensile).
m is the stress caused by moment (positive during tensile).
fct is the concrete strength.
is the crack safety factor, can be varied and provided specifically for
various applications of the cracking criteria (see Table 3.1).
k is a dimension dependent coefficient which depends on the cross-section
total height h (see Figure 3.1).
Figure 3.1 Coefficient k as a function of the cross-section total height h
(Boverket, 1994).
If an incorrect assessment of the density or bending deformation does not involve personal
injury, serious damage or substantial financial loss for other reasons the coefficient can be
set equal to 1.0 (4.5.3) (Boverket, 1994).
3 Methods used in the Thesis
30
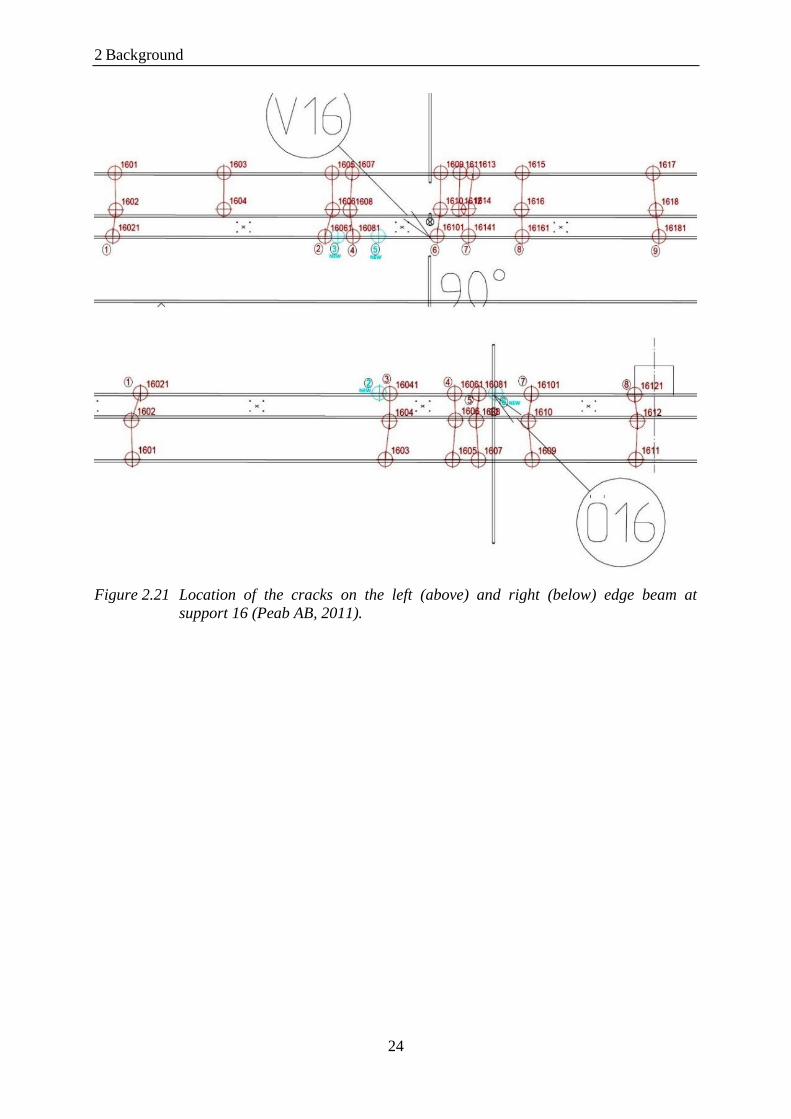
Calculation of the crack width
This method can be used to calculate the crack width close to the reinforcement for cracks
caused by moment and/or normal force. With this method it is assumed that the minimum
amount reinforcement is satisfied (see Equation (3.1)).
The characteristic crack width wk and mean crack width wm can be calculated according to
Equation (3.4) and Equation (3.5).
(3.4)
(3.5)
(3.6)
Where
Es is the modulus of elasticity of the reinforcement Es = Esk = 200 GPa.
srm is the mean crack spacing according to Equation (3.7).
is a coefficient that considers the effect of the long-term load and repeated
load, with
= 1.0 at first loading.
= 0.5 for long-term or repeated load.
1 is a coefficient that accounts for bond of the reinforcement, where
1 = 0.8 for ribbed bars.
1 = 1.2 for intended bars.
1 = 1.6 for plain bars.
For intended bars 1 could be set equal to 0.8, if the bar’s nominal specific
rib area 0.15d for a nominal bar diameter d 10 mm and 0.20d for
d > 10 mm.
is a coefficient that accounts for tension stiffness in the concrete between
cracks.
s is the stress in the non-prestressed reinforcement at a crack.
sr is the value of s at the load causing cracking, i.e. immediately after the
formation of the crack. Long-term load (= 0.5) and ribbed bars
(1 = 0.8) were used in the calculation.
The mean crack spacing srm in mm is determined according to Equation (3.7).
(3.7)
Where
Aef is the effective area (see Figure 3.2), i.e. the part of the tension zone with
the same center of gravity as the bonded reinforcement.
As is the area of bonded tensile reinforcement.
r is the effective reinforcement ratio. r = As/Aef.
1 is a coefficient (see Equation (3.6)).

3.2 Design According to Swedish Standards.
31
2 is a coefficient which accounts for the strain distribution
(see Equation (3.8) and Equation (3.9)).
is the bar diameter in mm.
Figure 3.2 Determination of the effective concrete area Aef for beam in bending (top left),
slab in bending (top right) and member in tension (bottom) (Boverket, 1994).
The whole edge beam at the supports is in tension (bottom figure is used).
(3.8)
Where 1 and 2 are the strain (see Figure 3.3). 1 > 2. If the strain distribution is according to
figure and the height is according to Figure 3.2, Equation (3.9) can be used to determine 2
(Boverket, 1994).
(3.9)
Where
def is the height of the effective concrete area.
c is the thickness of the concrete cover.
h is the total height of the member.
x is the distance from the compressed edge to the neutral axis.
aTP is the distance from the bottom edge to the CG line.
Figure 3.3 Strain 1 and 2 for determination of the coefficient 2 (Boverket, 1994).

3 Methods used in the Thesis
32
3.3 Crack Investigation
3.3.1 Crack measurements
A visual inspection of the bridge was performed (as part of the thesis) first to determine
different types of cracks on the edge beams, their distribution along the different spans and
general locations of the cracks with the large widths. The continuity of the cracks through the
edge beams and if the cracks are continuous through the whole depth of the edge beams or not
were also observed. Since the noise barriers are installed, only the inner part of the edge
beams are accessible for measurements.
The locations of the cracks are determined by using the provided marks on the rail track every
20 m along the bridge and transferring them to the noise barriers to have closer references to
measure the crack locations. The crack locations were then determined using hand held laser
rangefinder or a tape meter.
The cracks were classified to two categories according to their apparent visible width:
Small cracks with width smaller than 0.2 mm.
Big cracks with width greater than or equal to 0.2 mm. For which the widths were
measured, recorded, and pictured for further references.
The crack widths were measured using a crack width magnifier or a crack width ruler. The
width of the largest opening of the crack was recorded as the crack width.
For the transverse cracks, only the cracks that are continuous through the width and the depth
of the edge beam were considered. As for the longitudinal cracks, the biggest width of the
cracks was recorded along with the length of the cracks. The different casting stages of the
concrete left the edge beams with casting joints which were considered as transverse cracks
and measured with the same procedures.
The measurement works were more focused on the supports number 2, 3, 16 and 17 so as to
compare the results with the previous investigation reports. Same procedures were adopted
between supports 10 and 18. For the rest of the bridge, a quick investigation was performed
recording the locations and widths of the cracks.
The spacing of a transversal crack was calculated based on its relative location to the two
adjacent cracks, before and after. The average of the two distances was considered as the
spacing of the crack.
3.4 FEM-Modelling
It was decided to study the cracks at support number 16 by creating a finite elements model
Using LUSAS (LUSAS, 2011). As the support is only two spans from the end abutment, these
2 spans are modeled along with 3 spans length on the other side of the support (see Figure
3.4) this will closely model the 17 spans bridge for the load cares at hand.

3.4 FEM-Modelling
33
Since all the supports taken into account are roller supports, one of them had to be changed
into a hinged support to gain the required stability of the bridge. The final from the inner side
of the bridge (support number 13) is chosen to be the hinged support.
Figure 3.4 Sketch of the total spans modelled around the support under study (support
number 16) and the support condition of each.
Loads on the bridge were calculated based on the concrete, steel and ballast cross sections
according to the calculations by (Tyréns AB, 2004) (see Table 3.4).
Three load cases are applied to the bridge, dead loads of the bridge (concrete and steel own
weights), ballast load and a combination of the own material weight and the ballast load with
appropriate loading factor (see Table 3.3) to be able to study the effects of each of the cases
on the bridge (see Equation (3.10)).
All the loads are applied as global distributed loads and assigned to the appropriate elements.
Loads assigned to the full section are distributed per unit area and the loads applied to the 2-D
beam are distributed per unit length (see Table 3.4).
Table 3.4 The own weight of the different materials used and the total combination of the
different loads.
Material Concrete
wc
Steel
ws
Ballast
wbal
Total
combination
wtot (min/max)
Own weight (kN/m) 77,47 33 76,64 171,78/206,27
Own weight (kN/m2) 11,63 4,95 12,71 26,75/32,47
(3.10)

3 Methods used in the Thesis
34
3.4.1 2-D Beam model
A 2-D model was created as to have a primary idea about the internal forces in the bridge
before further detailing of the bridge at the support and the spans around it. It is used also to
determine points of the zero moments at which the connection between the 2-D beam and the
full section detailed model is to be modeled.
The section used in the 2-D model is an I-Beam section with the same moment of inertia as
the original bridge section.
3-D thick beam elements were chosen to mesh the model to include the transversal effects of
the loading as well as the longitudinal ones, to include the effects of the transverse shear
deformations and also because it is the most effective type of beam elements in modeling
straight, constant section structures.
Quality assurance of the model was performed by four means:
The total own weight of the bridge length was checked against the total summation of
reactions from LUSAS and was found to be exactly matching (see Table 3.5).
Table 3.5 The results of the hand calculated total loads of the materials and the
counteracting reactions of the model for quality assurance checking.
Total load of materials
Hand calculated Loads (MN) 54,64
LUSAS Reaction summation (MN) 54,64
Convergence analysis of the elements size was performed for the vertical
displacement, longitudinal bending moment and vertical shear forces (see
Appendix F). The optimum mesh size was determined based on the vertical shear
force Fz convergence to be 2 m (see Figure 3.5).

3.4 FEM-Modelling
35
Figure 3.5 Vertical shear force along the bridge length drawn for mesh sizes 8, 4, 2, 1, and
0.5 m to for the convergence of mesh size.
The longitudinal bending moment My due to own weight of the bridge was calculated
with the empirical values according to (Sundquist, 2010a). The results are compared to
the model output results (see Table 3.6). The results are similar.
Table 3.6 Longitudinal bending moment results from hand calculations and LUSAS model
due to own weight of the bridge.
Position M13-
14
M14 M14-15 M15 M15-16 M16 M16-17 M17 M17-18
LUSAS
results
(MNm)
32,28
-42,58 14,17 -32,08 17,16 -35,15 17,65 -32,29 17,72
Hand
calculations
(MNm)
31,65 -43,98 14,8 -29,18 14,8 -29,18 14,8 -34,42 18,2
3.4.2 Full model
A more detailed straight section of the bridge is modeled between the boundaries, determined
from the 2-D model between the zero longitudinal moment points around the support 16, and
is connected to the 2-D model at the same positions.
The steel section is modeled as surfaces for the different plates with assigning the thickness to
each one of them. The concrete slab is modeled as four surfaces, for the four slopes of the

3 Methods used in the Thesis
36
slab, representing the mid line of each surface and assigning a variation of the thickness to
each one of them using the surface grid variation option with the appropriate thicknesses (see
Figure 3.6).
The edge beam is modeled as a predefined I-beam section with the same properties as the
edge beam. It is assigned to the edge lines of the concrete surface with an eccentricity as the
distance between the concrete edge and the edge beam center of gravity. By doing this, the
full connection between the edge beams and the concrete section is achieved (see Figure 3.7).
Figure 3.6 The full section and the 2-D beam section isometric view.
Figure 3.7 Full section of the bridge with the edge beams assigned to the edge lines of the
concrete surface with the appropriate eccentricity.

3.4 FEM-Modelling
37
Section connection (between concrete and top steel flanges)
The connection between the concrete surface and the top flanges of the steel section is
modeled using a constraint equation. A tied mesh is used with a normal constraint type to
fully connect them rigidly and achieve the full composite action of the whole section by
maintaining the original relative position of the two surfaces after loading with the same
displacements and rotations for both surfaces under all the loading cases and conditions.
The tied mesh is chosen since it does not require the matching of the mesh from both surfaces,
which gives more freedom to assigning the mesh size independently to each of the surfaces.
The normal constraint type of the tied mesh is chosen because it automatically defines the
search direction normal to the master/slave surfaces to detect the mesh to which it is tied. By
assigning the concrete surface to be the master, it is guaranteed that the steel section will only
follow the displacement of the concrete section and that the forces will be transferred with the
required arrangement from the concrete section, which is loaded first, to the steel flanges
which will follow the behavior of the concrete as they are assigned to be the slaves of the tied
mesh (see Figure 3.8).
Figure 3.8 The concrete surfaces (masters) and the steel top flanges (slaves) assigned to the
tied mesh constraint equation.
Model connection (between beam and full 3-D section)
The 2-D beam was inserted in the model at the point of the center of gravity of the full section
to eliminate any possible extra effects due to eccentricity. The end of the beam is tied with a
constraint equation to the full section to guarantee the continuity of the model with the same
displacements and rotations at the connection. The geometric rigid links was the most suitable
constraining equation choice for this connection since we are connecting the edge points of
the full section to the end point of the 2-D beam (see Figure 3.9).

3 Methods used in the Thesis
38
Figure 3.9 The end of the 2-D beam and the edge points of the full section assigned to the
rigid links connection.
Only the edge points of the full section are linked to the end of the 2-D beam (see Figure 3.9)
to avoid the double constraining of the top flanges as they are already linked as slaves to the
concrete section (masters) with the tied mesh constraint equation. The continuity of the model
after loading is checked by the shape of the deformed mesh and the final displacements (see
Figure 3.10 and Figure 3.11).
Figure 3.10 The original and deformed mesh after loading assuring the continuity of the
connections before and after the loading.

3.4 FEM-Modelling
39
Figure 3.11 The vertical displacement due to the bridge’s own weight along the bridge
assuring the continuity of the model at the connections between the full section
and the 2-D beam.
3.4.3 Comparison between the two models
To compare the 2-D beam model and the full model, the displacements of both are compared
at the nodes with the maximum values in each span calculated for the own weight of the
structure only. The general shape of the deformed model is considered as well (see Table 3.7).
The displacement results of the 2-D model and the full model are similar.
Table 3.7 Comparison of the displacement values between 2-D and full model calculated
for the own weight of the bridge at the maximum nodes of each span.
Position Maximum
(span 13-14)
span 14-15 span 15-16 span 16-17 span 17-18
Distance from
origin (m)
27,50 94,50 155,80 210,30 270,00
2-D model
displacement
(cm)
3,80 1,30 1,80 1,80 1,30
Full model
displacement
(cm)
3,70 1,60 1,20 1,20 1,50

4.1 Construction Method
41
4 Calculations
4.1 Construction Method
The bridge has a composite section consisting of a steel box section and a concrete slab with
edge beams. A box section for the steel beam is used as it is better suited for curved bridges
since it has more warping and torsion resistance than regular I-beam sections.
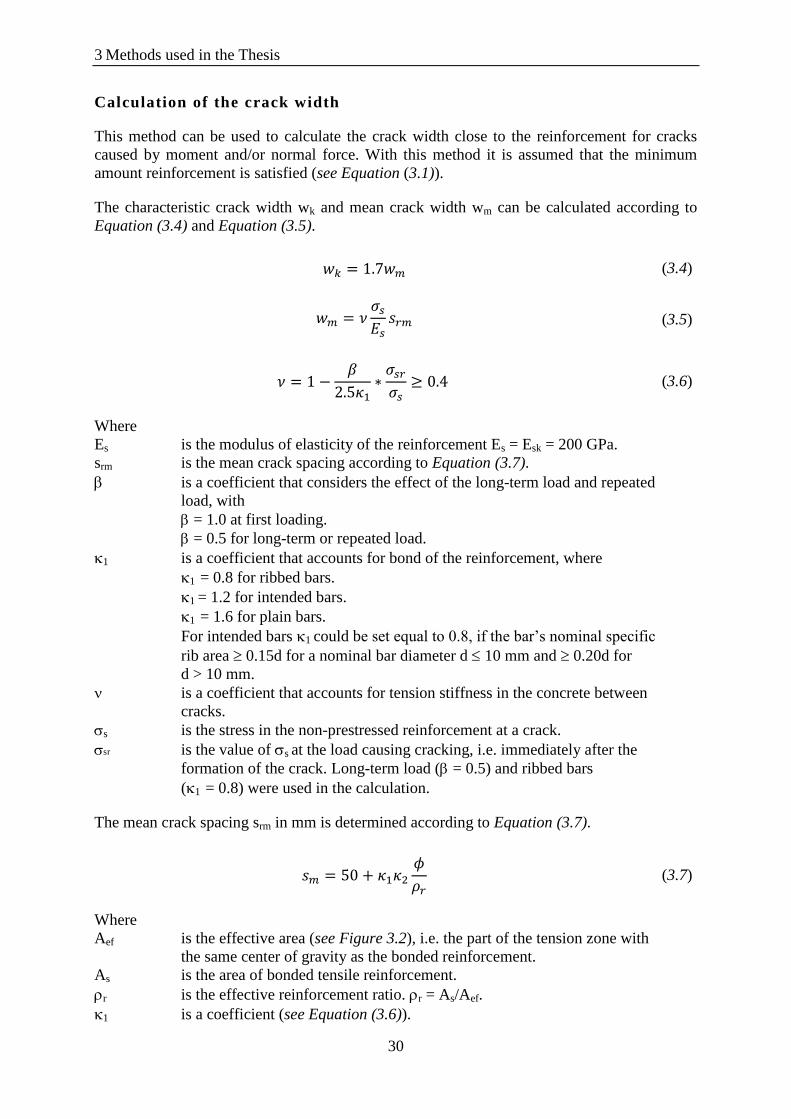
The steel section was installed first using launching technique. The launching process is to
prepare a launching area behind one or both abutments where the work shop manufactured
steel box sections are welded together before launching. Also the areas close to the welds are
painted before launching. Temporary supports are used before the abutment to hold the
sections before launching and also temporary bearings are used on the intermediate supports.
A so called launching nose is used to help the steel girder up on the next support because of
the relatively large vertical deflection of the cantilevering girder (see Figure 4.1 ) and also to
reduce the steel stresses during the launching process. After the steel section of the whole
bridge is erected, it is then used to support the formwork for casting the concrete slab. The
steel section is fabricated with an upwards cumber to compensate for the steel girder
deflection when the concrete is poured (see Figure 4.2) (Sundquist, 2010b).
Figure 4.1 Launching technique and procedures showing 1- the welded steel parts.
2- launching nose. 4- Tensile rods. 5- Hydraulic jacks. 6- Temporary bearings.
8,9- temporary supports for launching (Sundquist, 2010b).

4 Calculations
42
Figure 4.2 Camber in the steel section to compensate for the steel girder deflection from
concrete (see Appendix A).
The steel section is varied between the supports to give the most efficient and economic use
of the steel. The height of the section and the width of the bottom flange are kept constant,
while the width of the top flanges increases gradually towards the support along 7 m distance
from both sides. Each span consists of three different steel sections along the span length, a
section for the mid-span, another section over the supports and one is used between the mid-
span and the support sections. The section with the largest stiffness and area is the support
section (see Figure 4.3).
Figure 4.3 Difference in the steel plates thickness and width along the span
(see Appendix A).
The bridge is divided into many segments where the concrete section is casted in a predefined
sequence to decrease the tensile stresses at top of the section over the support due to the own
weight of the concrete. The casting sequence is depending on casting the mid-spans segments
before casting the segments over the supports (see Figure 4.4). By casting the mid-span
segments first, the strain of the steel section is enforced to develop all along the span. When
casting the concrete slab of the segment over the support, after the elongation of the top steel
flanges has almost fully developed, the tensile stresses in the concrete over the supports
decreases due to the own weight of the concrete. This reduces the risk for concrete cracking.

4.2 Creep and Shrinkage
43
Figure 4.4 The predefined sequence of casting concrete segments showing the mid-span
sections with lower numbers (3, 4) indicating earlier casting than the support
segments (6, 10) (see Appendix A).
After the hardening and the curing process of the concrete is finished, the top of the concrete
slab is water proofed, then the ballast is laid over, leveled and the track is installed using some
equipment like a track layer. A ballast regulator is then used to form the ballast slopes and
adjust their levels. After that the installation of different parts of the railway bridge like noise
barriers takes place.
4.2 Creep and Shrinkage
4.2.1 Creep
For the calculation of moment of inertia, the ratio between the modulus of elasticity for
steel and concrete is used. The modulus of elasticity of concrete differs depending on the
short-term or long-term effects. If the short term effect is considered the ratio is according
to Equation (4.1).
(4.1)
In the long-term effect the creep of the concrete is considered and the ratio is according to
Equation (4.2).
(4.2)
Where
(4.3)
Where eff is the effective creep coefficient (see Table 4.1) (Collin et al., 2008).

4 Calculations
44
Table 4.1 Creep coefficient in different environments (Boverket, 1994).
The effective creep coefficient used in Table 4.1 is valid for regular concrete and if loading
occurs at such an age that the compressive strength has reached the required value.
The environment at the Ångermanälven Bridge is “normally outdoors”.
If loading occurs before this age and the concrete have a compressive strength which is a % of
the required value, then the creep coefficient is multiplied by a factor (see Table 4.2)
(Boverket, 1994).
Loading is assumed to occur after the compressive strength is fully reached.
Table 4.2 Correction factor at a % of the required compressive strength
(Boverket, 1994).
4.2.2 Shrinkage
The shrinkage effect in the concrete is counteracted by a compressive force, at the middle of
the concrete slab, which is according to Equation (4.4) for the short-term load and according
to Equation (4.5) for the long-term load (Collin et al., 2008).
(4.4)
(4.5)
Where es is final shrinkage (see Table 4.3) (Collin et al., 2008).

4.3 Section Properties
45
Table 4.3 Mean value for the final shrinkage cs for normal concrete at normal conditions
(Boverket, 1994).
The mean value for the final shrinkage refers to free shrinkage after long time. Normal
condition refers to members with at least 100 mm thickness, maximum 16-64 mm gravel size
and viscous to plastic consistency.
If the shrinkage is uneven, the maximum shrinkage is 1.25cs and the minimum shrinkage is
0.75cs (see Figure 4.5) (Boverket, 1994).
Figure 4.5 Two cases of uneven shrinkage in normal concrete (Boverket, 1994).
4.3 Section Properties
4.3.1 Simplifications
The section of the superstructure (see Figure 4.6) has more details than needed for the
analysis of the edge beam. By making the model simpler, the calculation time can be
shortened without affecting the result.

4 Calculations
46
Figure 4.6 Section of the superstructure (mid-span).
The following simplifications have been made to the model (see Figure 4.7):
No holes for drainage pipe in concrete and steel.
Simplification of the concrete section near the upper flanges.
Sharp edges instead of smooth ones.
No studs between the steel and concrete.
No stiffening plate at the bottom flange.
The concrete has the same level between the two upper steel flanges
Assuming continues slope between the edge beam and the bottom edge of the slab.
Neglecting the outer parts of the lower steel flange.
Figure 4.7 Simplified section.

4.3 Section Properties
47
4.3.2 Coordinate systems and moment of inertia calculation
Two different coordinate systems were created; one used 3-D model and one for the
calculations of the moment of inertia (see Appendix C). The moment of inertia for the cross-
section was calculated to get the stiffness for the 2-D model.
Due to the complexity of the cross-section, the moment of inertia was calculated with
Arbitrary section property calculator (see Appendix D) in LUSAS (LUSAS, 2011).

4.3 Section Properties
49
5 Own Measurement
The investigation results for the edge beams of the bridge at the support number 16 were
recorded (see Table 5.1). The measurements are compared to the previously done
measurements in section 6.3.
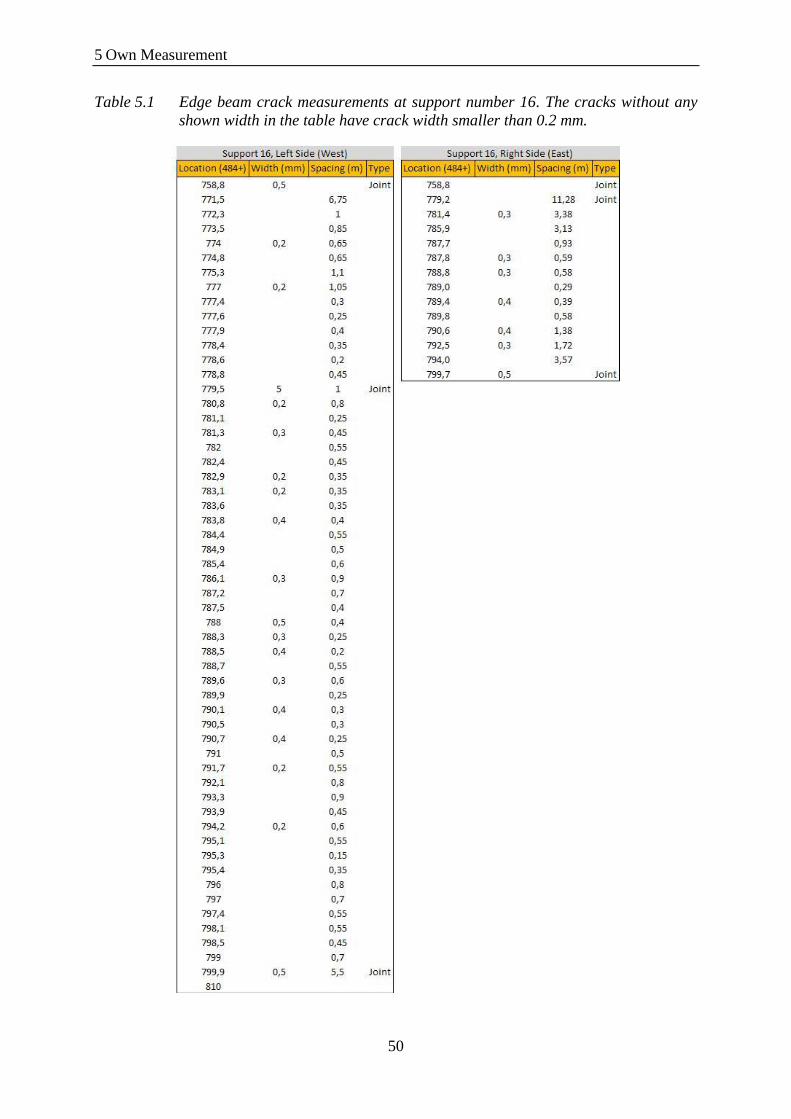
The largest crack width is 0.5 mm at 484+788 at the left side edge beam. The smallest spacing
of a crack is 0.2 m for the crack at 484+788.5 at the left side edge beam of the bridge also (see
Table 5.1).
The largest casting joint is 5 mm wide at 484+779.5 just 10 m away from the support at the
left side edge beam. Three other casting joints have widths of 0.5 mm at 484+758.8, and
484+799.9 at the left side edge beam, and at 484+788 at the right side edge beam (see Table
5.1).
Widest cracks are found closer to the support, but smaller cracks are found along the whole
span as well (see Table 5.1).
5 Own Measurement
50
Table 5.1 Edge beam crack measurements at support number 16. The cracks without any
shown width in the table have crack width smaller than 0.2 mm.
6.1 Model Results
51
6 Results
6.1 Model Results
Only the 2-D model results are used in the calculations of the stresses. Bending moment
results are the only values included in the performed calculations.
Since the model is straight and horizontal, the applied loads are only vertical load. The
developed section forces are only the longitudinal bending moment (My) and the vertical
shear force (Fz). The vertical displacement (DZ) for long and short term loading is presented
as well (see Appendix F).
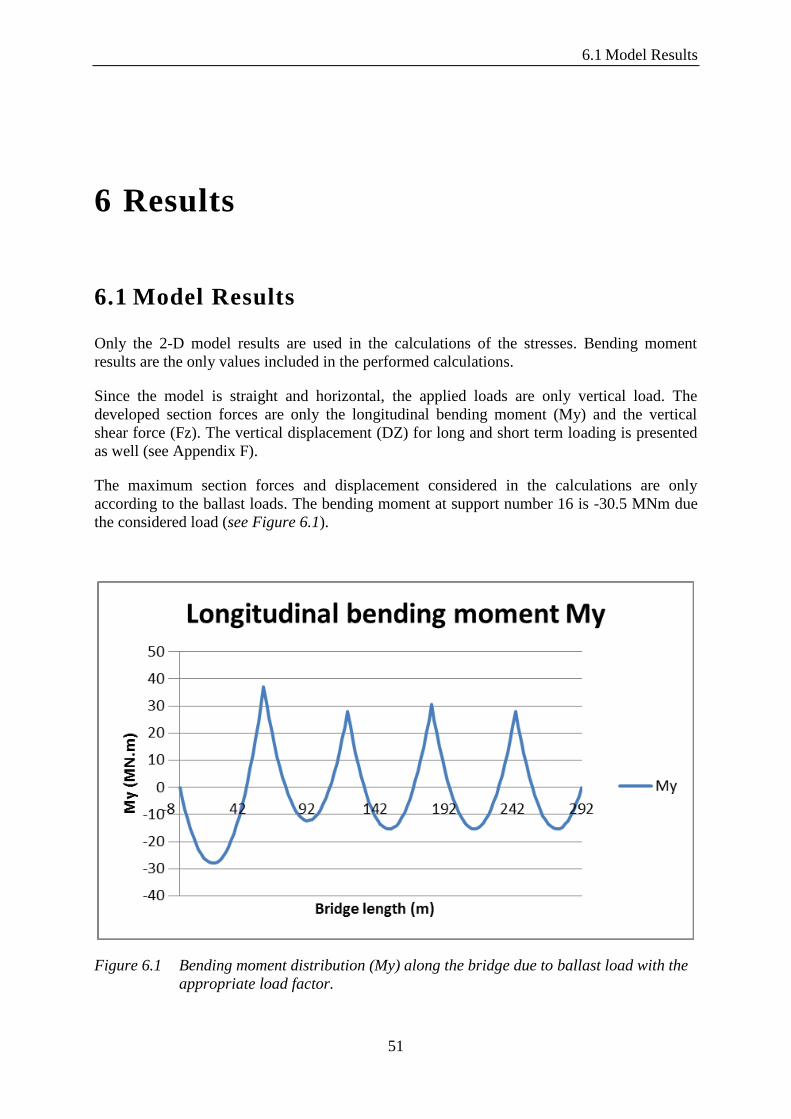
The maximum section forces and displacement considered in the calculations are only
according to the ballast loads. The bending moment at support number 16 is -30.5 MNm due
the considered load (see Figure 6.1).
Figure 6.1 Bending moment distribution (My) along the bridge due to ballast load with the
appropriate load factor.
6 Results
52
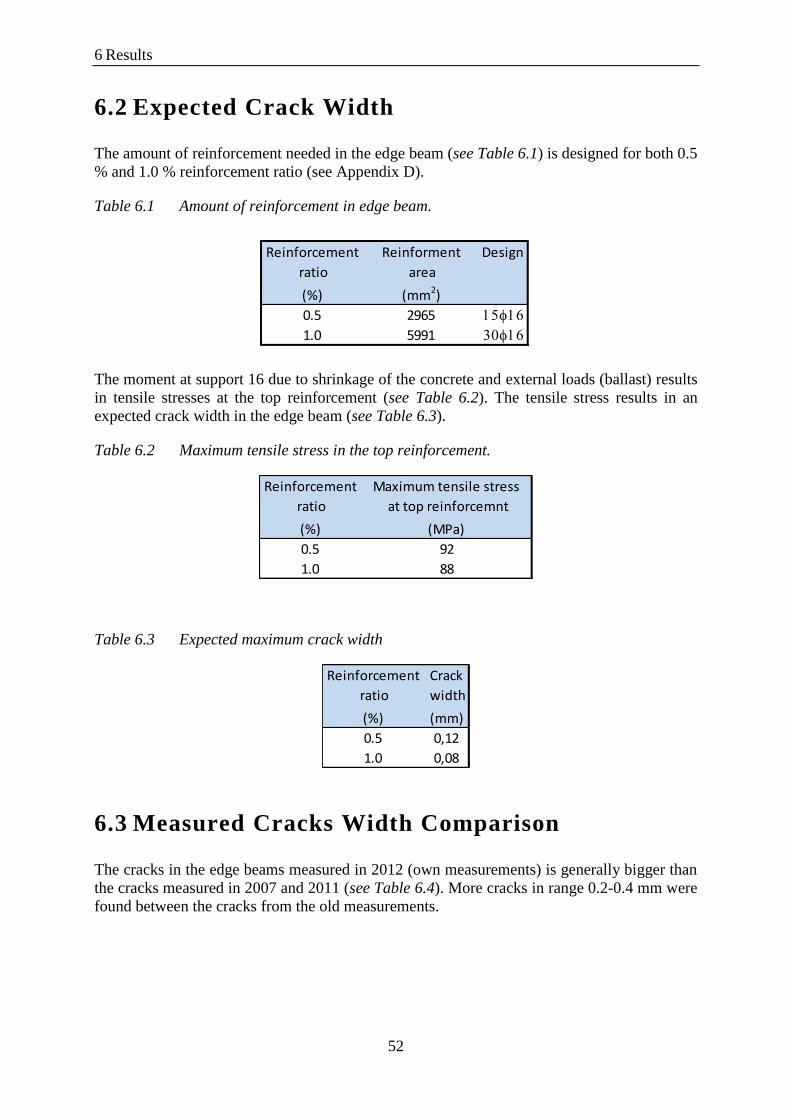
6.2 Expected Crack Width
The amount of reinforcement needed in the edge beam (see Table 6.1) is designed for both 0.5
% and 1.0 % reinforcement ratio (see Appendix D).
Table 6.1 Amount of reinforcement in edge beam.
The moment at support 16 due to shrinkage of the concrete and external loads (ballast) results
in tensile stresses at the top reinforcement (see Table 6.2). The tensile stress results in an
expected crack width in the edge beam (see Table 6.3).
Table 6.2 Maximum tensile stress in the top reinforcement.
Table 6.3 Expected maximum crack width
6.3 Measured Cracks Width Comparison
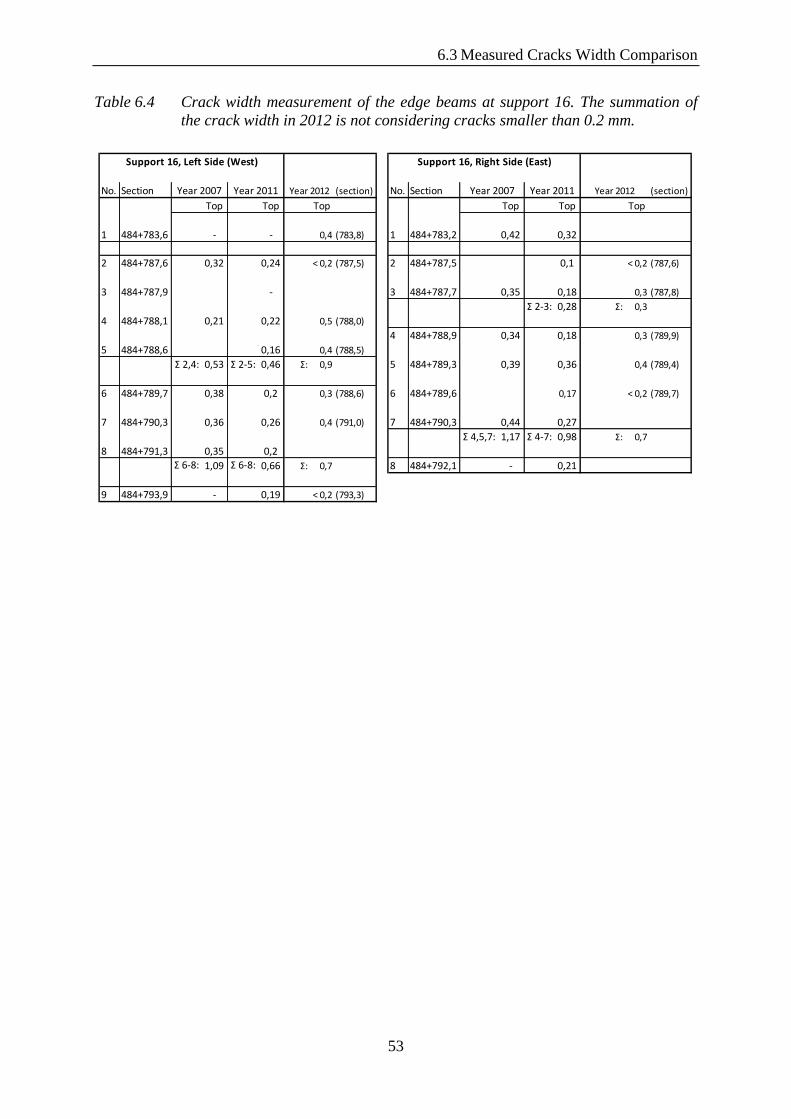
The cracks in the edge beams measured in 2012 (own measurements) is generally bigger than
the cracks measured in 2007 and 2011 (see Table 6.4). More cracks in range 0.2-0.4 mm were
found between the cracks from the old measurements.
Reinforcement Reinforment Design
ratio area
(%) (mm2)
0.5 2965 1516
1.0 5991 3016
Reinforcement Maximum tensile stress
ratio at top reinforcemnt
(%) (MPa)
0.5 92
1.0 88
Reinforcement Crack
ratio width
(%) (mm)
0.5 0,12
1.0 0,08
6.3 Measured Cracks Width Comparison
53
Table 6.4 Crack width measurement of the edge beams at support 16. The summation of
the crack width in 2012 is not considering cracks smaller than 0.2 mm.
No. Section (section) No. Section (section)
Top Top Top Top Top Top
1 484+783,6 - - 0,4 (783,8) 1 484+783,2 0,42 0,32
2 484+787,6 0,32 0,24 < 0,2 (787,5) 2 484+787,5 0,1 < 0,2 (787,6)
3 484+787,9 - 3 484+787,7 0,35 0,18 0,3 (787,8)
Σ 2-3: 0,28 Σ: 0,3
4 484+788,1 0,21 0,22 0,5 (788,0)
4 484+788,9 0,34 0,18 0,3 (789,9)
5 484+788,6 0,16 0,4 (788,5)
Σ 2,4: 0,53 Σ 2-5: 0,46 Σ: 0,9 5 484+789,3 0,39 0,36 0,4 (789,4)
6 484+789,7 0,38 0,2 0,3 (788,6) 6 484+789,6 0,17 < 0,2 (789,7)
7 484+790,3 0,36 0,26 0,4 (791,0) 7 484+790,3 0,44 0,27
Σ 4,5,7: 1,17 Σ 4-7: 0,98 Σ: 0,7
8 484+791,3 0,35 0,2Σ 6-8: 1,09 Σ 6-8: 0,66 Σ: 0,7 8 484+792,1 - 0,21
9 484+793,9 - 0,19 < 0,2 (793,3)
Year 2012 Year 2012
Support 16, Right Side (East)
Year 2007 Year 2011
Support 16, Left Side (West)
Year 2007 Year 2011


7.1 Conclusions
55
7 Conclusions and Discussion
The cracking of the edge beams were studied according to bridge codes requirements. The
bridge was modeled in 2-D and the crack width was calculated and compared to the measured
ones. From that the following conclusions were drawn:
7.1 Conclusions
The calculated crack width is smaller than the measured ones.
1.1 % reinforcement ratio in the edge beams is believed to limit the crack width to the
code limitations (0.3 mm).
Cracks at the support may be initiated due to tensile shrinkage stresses in the concrete
section.
Other factors, related to the construction process, may have increased the tensile
stresses in the edge beams at the supports and thus contributing to open the cracks to
the measured cracks width values.
Nonstructural factors (shrinkage and temperature variation) have significant effect on
the edge beam cracking, since cracks are also found near to the mid-span where the
concrete section is compressed due to the structural loads.
2-D modeling is sufficient to acquire reasonable results of the bending moment
distribution, shear forces and displacements for the performed calculations.
3-D modeling is not needed for the studied case.
The edge beams should have been checked for crack widths limitations according to
the code requirements.
7.2 Discussion
7.2.1 Calculation and Swedish Bridge Code
The problem with the code in this case is if the edge beam on the Ångermanälven Bridge
should be designed as an edge beam or as part of the slab. The code is clear on the minimum
dimensions of an edge beam but there is no limitation in how big it could be.
In the original calculation, the edge beam is not structurally contributing to the slab and
therefore using 0.5 % instead of 1.0 % as the longitudinal reinforcement ratio, according to
53.341 in Bro 94. But the code says that if the slab is cracked for V:A loads then 1.0% of the
concrete area should be used as reinforcement area. Our calculations, which consider the edge
0
56
beams as part of the structural slab, shows that the edge beams is cracked due to shrinkage at
the supports and therefore 1.0 % should have been used instead of 0.5 % in those locations.
The expected crack width in the edge beam was not checked in the original calculation. The
calculations of the slab shows expected crack width of 0.162 mm in the slab directly over the
top flanges. The crack width in the edge beam should, due to stress distribution of the cross-
section and the fact that the top of the edge beam is located 0.8 m higher than the slab, be
greater than this value.
There was no extra surface reinforcement added to the edge beams, although section 42.321
in Bro 94 states that extra surface reinforcement should be used in structural members where
shrinkage and temperature cracks are common. Because of the size of the edge beam the risk
for temperature cracks is relatively high.
Based on simple comparison between the reinforcement ratio and the developed crack width
in our calculations, 1.1 % reinforcement in the edge beams is believed to decrease the crack
width from 0.5 mm (measured) to 0.3 mm (code limit).
7.2.2 Reasons for Cracks
The shrinkage of the concrete is most likely the reason for the cracks initiation. The tensile
stresses, developed due to that, are usually higher than the concrete tensile strength. Other
factors will contribute to further increase of the cracks width by creating tensile stresses at the
crack locations.
The external loading (for example ballast, test traffic load) will develop more tensile stresses
in the concrete section over the supports increasing the width of cracks. The temperature
difference between the adjacent concrete segments during curing phase (due to different
hydration of concrete especially in the first hours of casting a new segment) can cause
cracking. A non-homogenous joint will be created across the section which is more likely to
develop cracks when the tensile loading exceeds the concrete tensile strength.
The large volume of the edge beams will lead to high temperature difference between the
inside of the concrete and the outer atmosphere during the curing phase. A rapid rate of heat
emissions, depending on the weather conditions and production methods, will develop
through the section which is more likely to develop through cracks.
The complicated geometry of the edge beams probably caused some difficulties in their
casting process, resulting in non-homogenous surfaces at some parts which can easily develop
cracks under tensile loading.
7.2.3 Measurements
Using the picture of crack and ruler method (described in section 2.6), it is hard to get precise
measurement due to the resolution of the pictures. The risk for human error is also bigger.
Adopting the measurement procedures described in section 3.3.1, more precise measurements
are achieved. More transversal cracks were found and wider cracks were measured at the
same locations of the previous investigations.
7 Conclusions and Discussion
7.2 Discussion
57
Longitudinal cracks were found on the edge beams with large widths, which can indicate a
large non-structural cracking effect.
Surface spread cracks are observed with very small widths (smaller than 0.1 mm) at some
locations indicating plastic shrinkage cracking and/or surface cracks from the curing process.
7.2.4 FEM Modeling
The 3-D modeling of the bridge section is very difficult and time consuming. The real
behavior of the connections between adjacent surfaces is hard to model. The complicated non-
linear section geometry of the bridge is difficult to represent in the model without making a
lot of simplifications and so deviating from the real behavior of the section under loading. The
full section modeling in 3-D is unnecessary for the studied case.
For the studied bridge, the simple 2-D model results were compared to the full section 3-D
model and no significant changes in the required results were observed. Therefore a 2-D beam
model of the bridge, using 3-D thick beam elements, is considered efficient enough for
calculating the internal forces distribution and displacement along the bridge.


0
59
Bibliography
ACI COMMITTEE 207 1995. Effect of Restraint, Volume Change, and Reinforcement on
Cracking of Mass Concrete. Farmington Hills, Michigan.
ALFREDSSON, H. & SPÅLS, J. 2008. Cracking behaviour of concrete subjected to restraint
forces : finite element analyses of prisms with different cross-sections and restraints,
Göteborg, Chalmers University of Technology.
BANVERKET 1999. BV BRO, Utgåva 5 (BVH 583.10): Banverkets ändringar och tillägg till
Vägverkets BRO 94, Borlänge, Banverket.
BETONGFÖRENINGEN. KOMMITTÉN FÖR SPRICKOR I BETONG 1994. Cracks in
concrete structures - specially thermal cracks : report, Stockholm, Svenska
betongföreningen.
BOTNIABANAN. 2010. Korta fakta - [Online]. Available:
http://www.botniabanan.se/Forstasidan-Historia/Om-Botniabanan/Korta-fakta/
[Accessed 2012-01-31 2012].
BOTNIABANAN. 2012. Akvarellkarta [Online]. Available:
http://www.botniabanan.se/upload/bilder/karta/akvarellkarta.jpg [Accessed 2012-01-
31 2012].
BOVERKET 1994. Boverkets handbok om betongkonstruktioner, Band 1, Konstruktion:
BBK 94, Karlskrona, Boverket.
BURSTRÖM, P. G. 2007. Byggnadsmaterial : uppbyggnad, tillverkning och egenskaper,
Lund, Studentlitteratur.
CARLSSON, C. 2008. Botniabanan, Långa broar i Ångermanland - Bro över ångermanälven
och Nätraån, sprickor i farbanekonsol. Kontroll efter inmätning. TYRÉNS AB,
Stockholm, Sweden.
CEMENT CONCRETE & AGGREGATES AUSTRALIA. 2005. PLASTIC SETTLEMENT
Cracking [Online]. Available:
http://www.concrete.net.au/publications/pdf/Settlement.pdf [Accessed 2012-02-02
2012].
COLLIN, P., JOHANSSON, B. & SUNDQUIST, H. 2008. Steel concrete composite bridges,
Stockholm, Structural design & bridges, KTH.
CONCRETE SOCIETY 2010. Non-structural cracks in concrete : a Concrete Society report,
London, Concrete Society.
CUSSON, D. & REPETTE, W. L. 2000. Early-age cracking in reconstructed concrete bridge
barrier walls. ACI Structural Journal, 97, 438-446.
DANISH STANDARDS ASSOCIATION 2004. Repair of concrete structures to EN 1504 : a
guide for renovation of concrete structures--repair materials and systems according to
the EN 1504 series, Amsterdam ; London, Elsevier.
HOLMGREN, J., LAGERBLAD, B. & WESTERBERG, B. 2010. Reinforced concrete
structures : textbook on Concrete Structures, Stockholm, Concrete Structures, KTH.
JOHANSSON, M. 2000. Structural Behavior in Concrete Frame Corners of Civil Defence
Shelters. Doctor of Philosophy, Chalmers University of Technology.
60
LUSAS 2011. LUSAS 14.7 user's manual, United Kingdom.
PEAB AB 2011. Sprickmätning, bro över Ångermanälven.
RADOMSKI, W. 2002. Bridge rehabilitation, London, Imperial College.
STANDARDISERINGSKOMMISSIONEN I SVERIGE 2008. Eurokod 2 : Dimensionering
av betongkonstruktioner = Eurocode 2 : Design of concrete structures. Del 1-1 = Part
1-1, Allmänna regler och regler för byggnader = General rules and rules for
buildings, Stockholm, SIS.
SUNDQUIST, H. 2010a. Beam and frame structures, Stockholm, KTH.
SUNDQUIST, H. 2010b. Infrastructure structures, Stockholm, Architecture and the Built
Environment, KTH Royal Institute of Technology.
SÉTRA 2010. Steel - Concrete Composite Bridges - Sustainable Design Guide. France.
THE HIGHWAY AGENCY 1987. Design Manual for Roads and Bridges, Volume 1 -
Highway Structures : Approval Procedures and General Design, Section 3 - General
Design, Part 14 - Early Thermal Cracking of Concrete, London, The Highway
Agency.
TYRÉNS AB 2004. Bro över Ångermanälven, Nyland - Örnsköldsvik, km 484+396. Kap.
D1, Dimensionering av farbaneplatta. Stockholm.
VÄGVERKET 1994a. Bro. Broinspektionshandbok, Borlänge, Vägverket.
VÄGVERKET 1994b. Bro 94 (1994:4), 4.Betongkonstruktioner: Allmänn teknisk beskrivning
för broar, Borlänge, Vägverket.
VÄGVERKET 1999a. Bro 94 (1999:19), 5.Stål-, trä- och aluminiumkonstruktioner: Allmänn
teknisk beskrivning för broar, Borlänge, Vägverket.
VÄGVERKET 1999b. Bro 94 (1999:21), Supplement nr 4: Allmänn teknisk beskrivning för
broar, Borlänge, Vägverket.

APPENDIX A
61
Appendix A Drawings
1-596-068-10 (Summary, overview)
1-596-068-46 (Concrete slab)
1-596-068-51 (Concrete casting sequence)
1-596-068-54 (Slab reinforcement at the supports)
1-596-068-106 (steel sections 52-61, summery)
1-596-068-107 (steel sections 62-67, summery)
1-596-068-144 (steel section 58 (mid-span))
1-596-068-145 (steel section 59 (middle))
1-596-068-146 (steel section 60 (support))

62
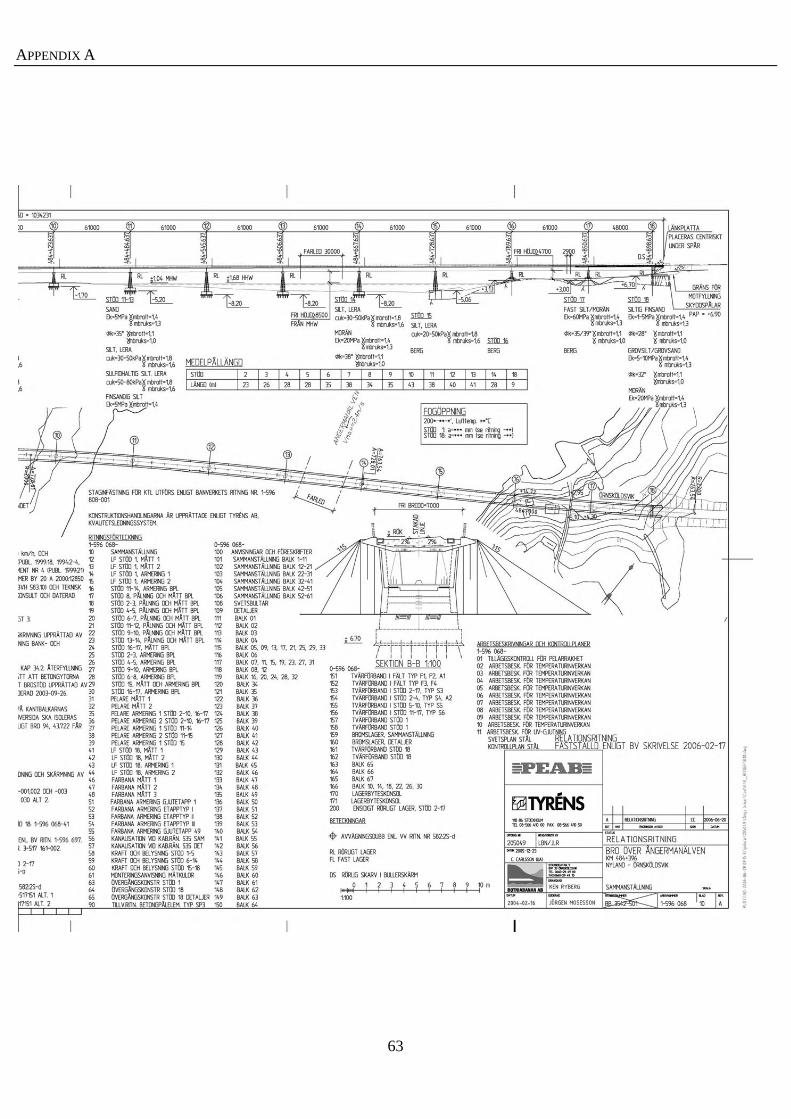
APPENDIX A
63
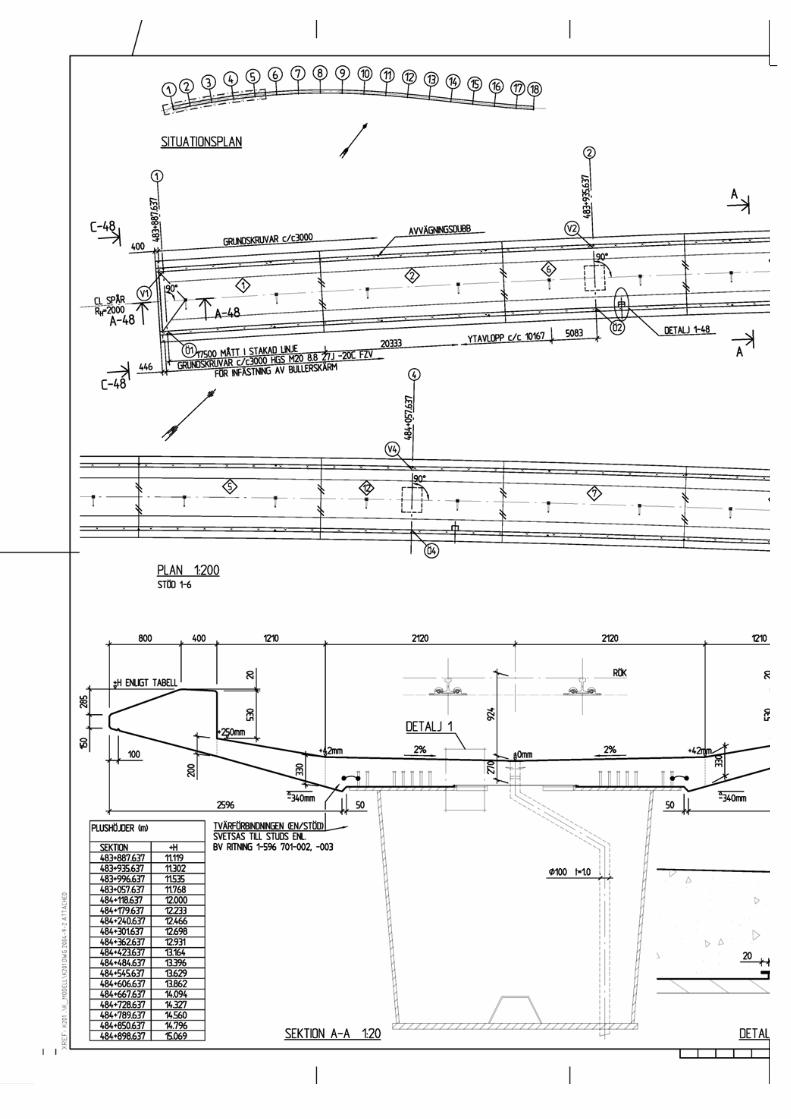
64
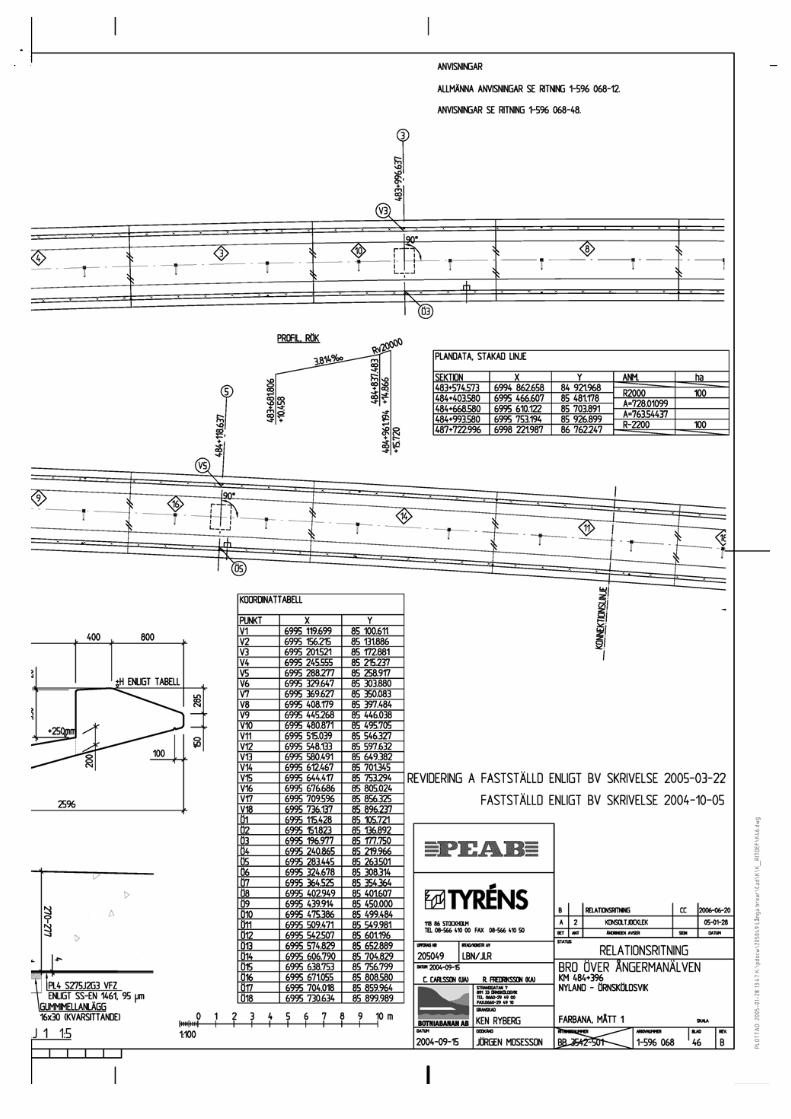
APPENDIX A
65

66
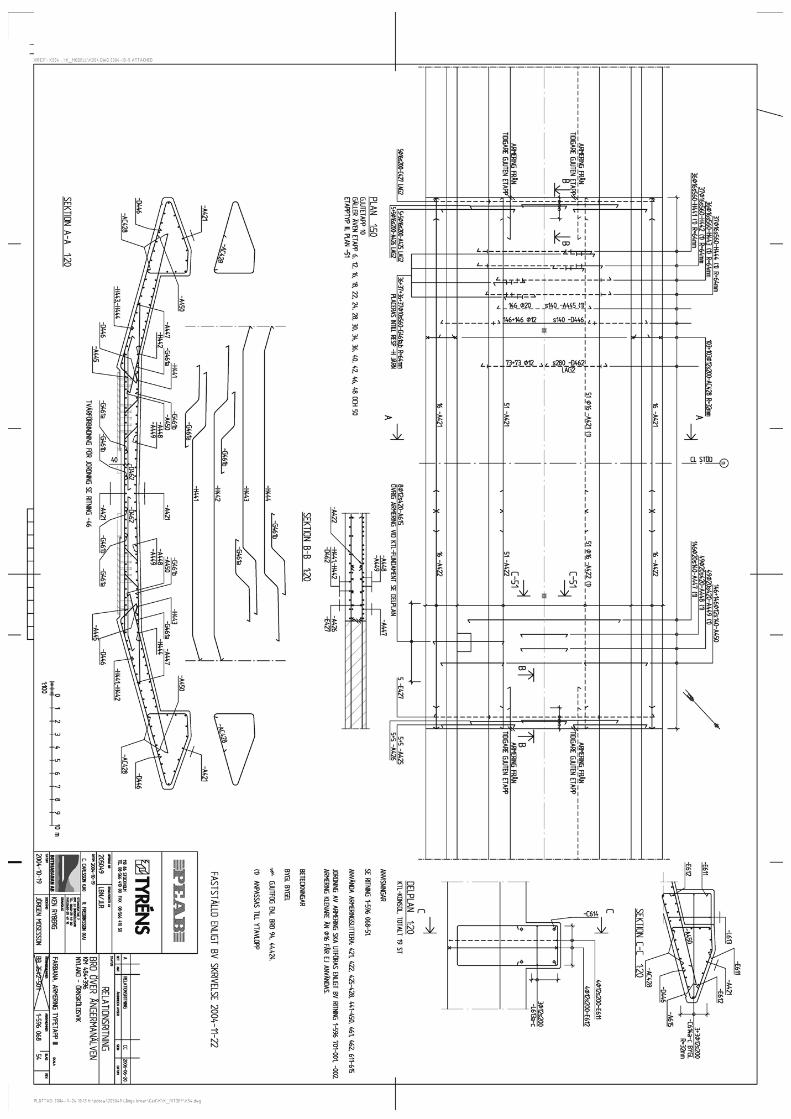
APPENDIX A
67

68

APPENDIX A
69

70
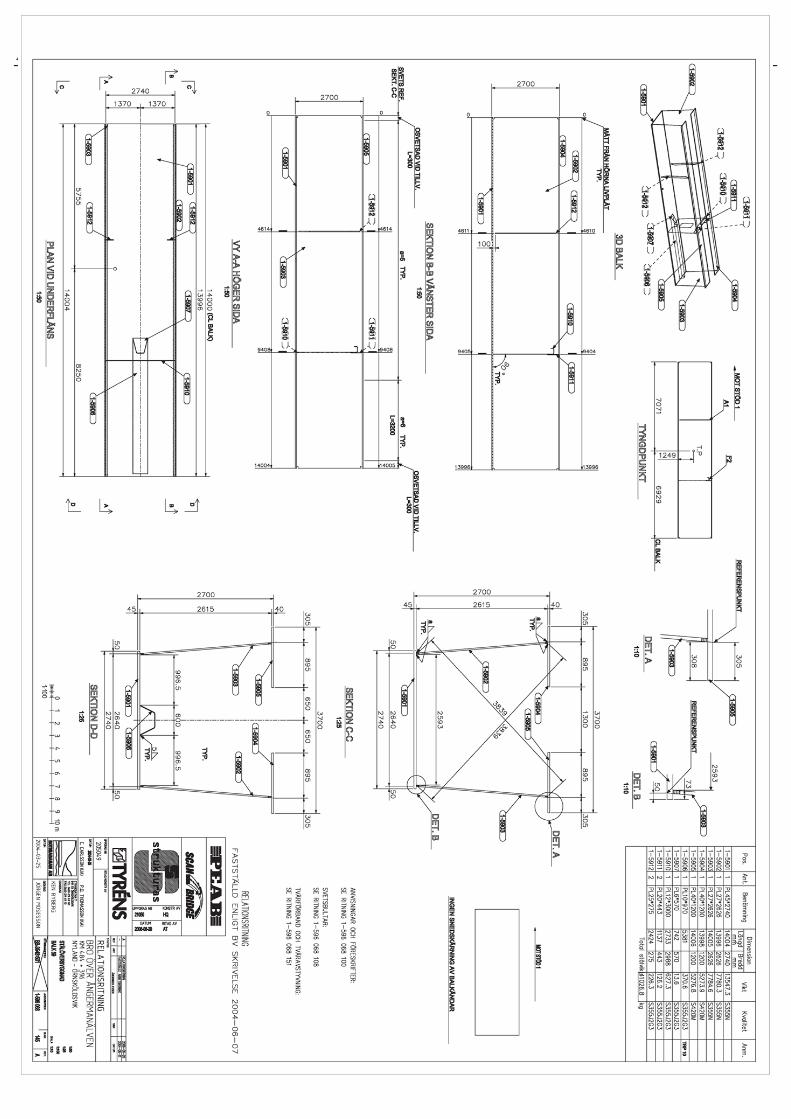
APPENDIX A
71
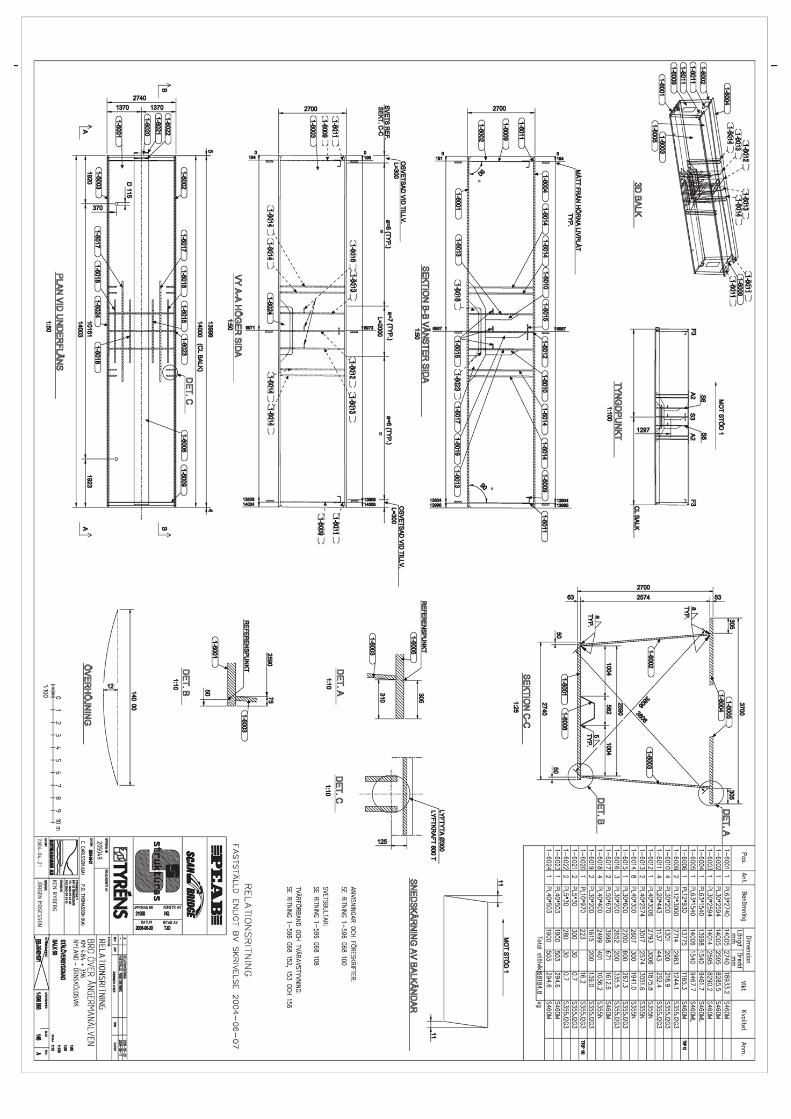
72

APPENDIX B
73
Appendix B Load Coefficients
Table B.1 Load coefficients ψγ for different load combinations (Tabell 222-1), (Banverket,
1999).

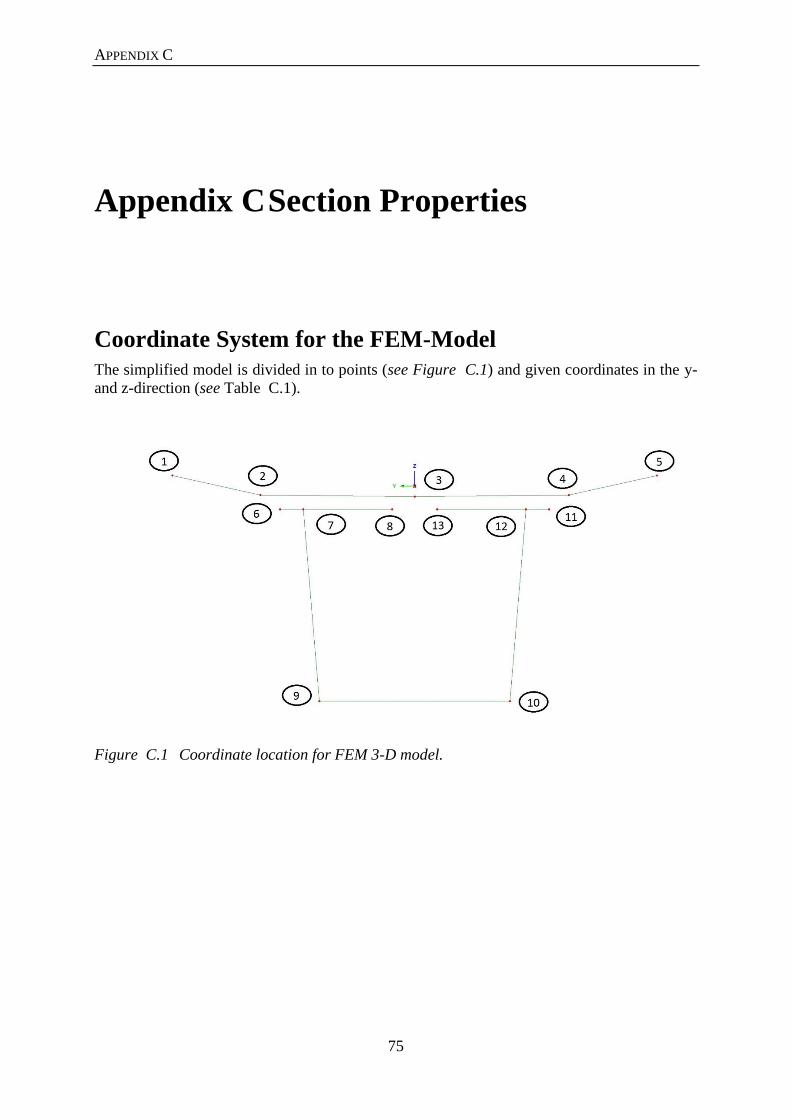
APPENDIX C
75
Appendix C Section Properties
Coordinate System for the FEM-Model
The simplified model is divided in to points (see Figure C.1) and given coordinates in the y-
and z-direction (see Table C.1).
Figure C.1 Coordinate location for FEM 3-D model.
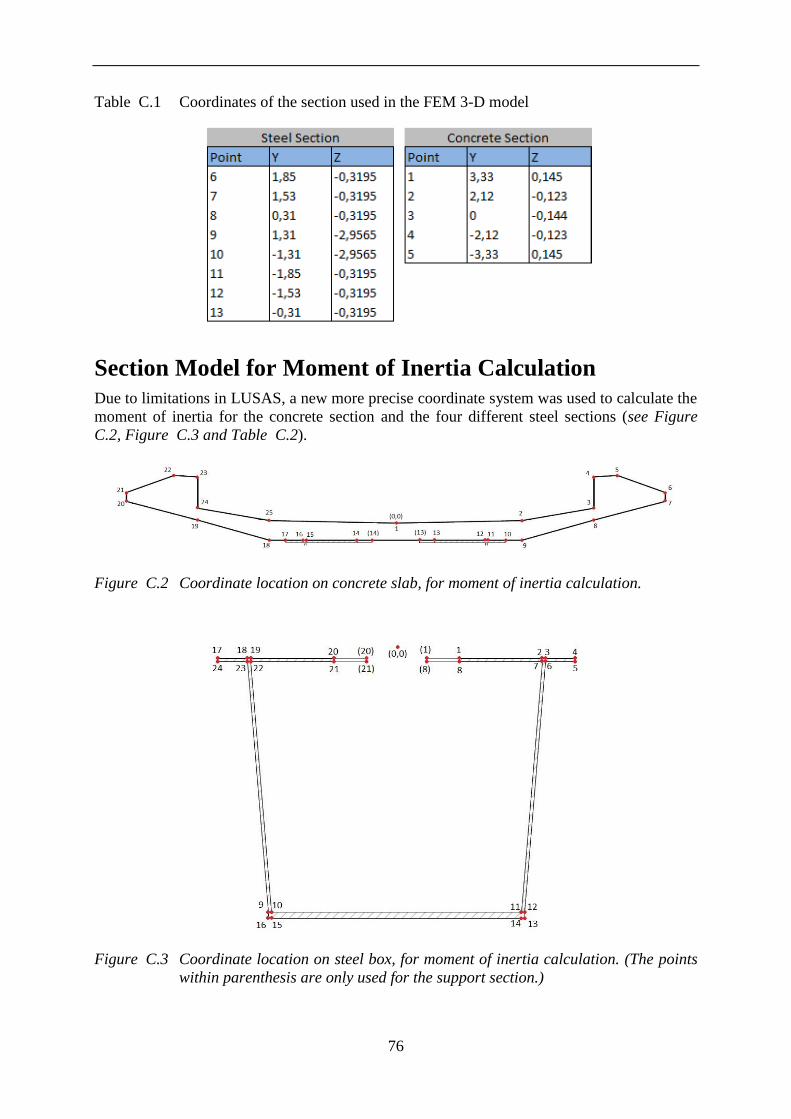
76
Table C.1 Coordinates of the section used in the FEM 3-D model
Section Model for Moment of Inertia Calculation
Due to limitations in LUSAS, a new more precise coordinate system was used to calculate the
moment of inertia for the concrete section and the four different steel sections (see Figure
C.2, Figure C.3 and Table C.2).
Figure C.2 Coordinate location on concrete slab, for moment of inertia calculation.
Figure C.3 Coordinate location on steel box, for moment of inertia calculation. (The points
within parenthesis are only used for the support section.)
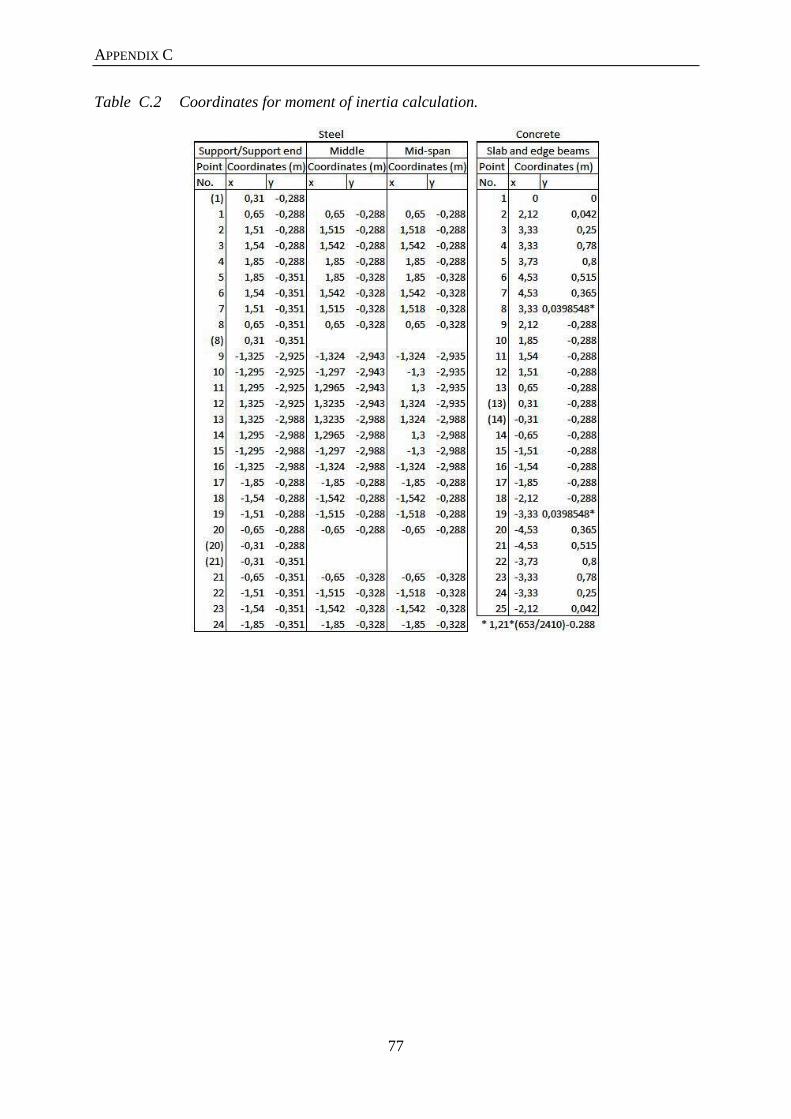
APPENDIX C
77
Table C.2 Coordinates for moment of inertia calculation.


APPENDIX D
79
Appendix D Thesis Calculations
Moment of Inertia
Due to limitations in LUSAS, the moment of inertia for the whole composite section could
not be calculated directly. The concrete section and the steel section is therefore created
separately and analyzed in the Arbitrary section property calculator (see Figure D.1, Figure
D.2, Figure D.3, Figure D.4 and Figure D.5). The moment of inertia of the composite
sections; mid-span, middle (section between mid-span and support end), support end (end of
the support section) and support, is then calculated by hand. The Arbitrary section property
calculator was also used to calculate the area of the edge beam (see Figure D.6).
Figure D.1 Output data from LUSAS, for the concrete section.

80
Figure D.2 Output data from LUSAS, for the steel section at mid-span.
Figure D.3 Output data from LUSAS, for the steel section at middle.

APPENDIX D
81
Figure D.4 Output data from LUSAS, for the steel section at supports.
Figure D.5 Output data from LUSAS, for the steel section at support end.
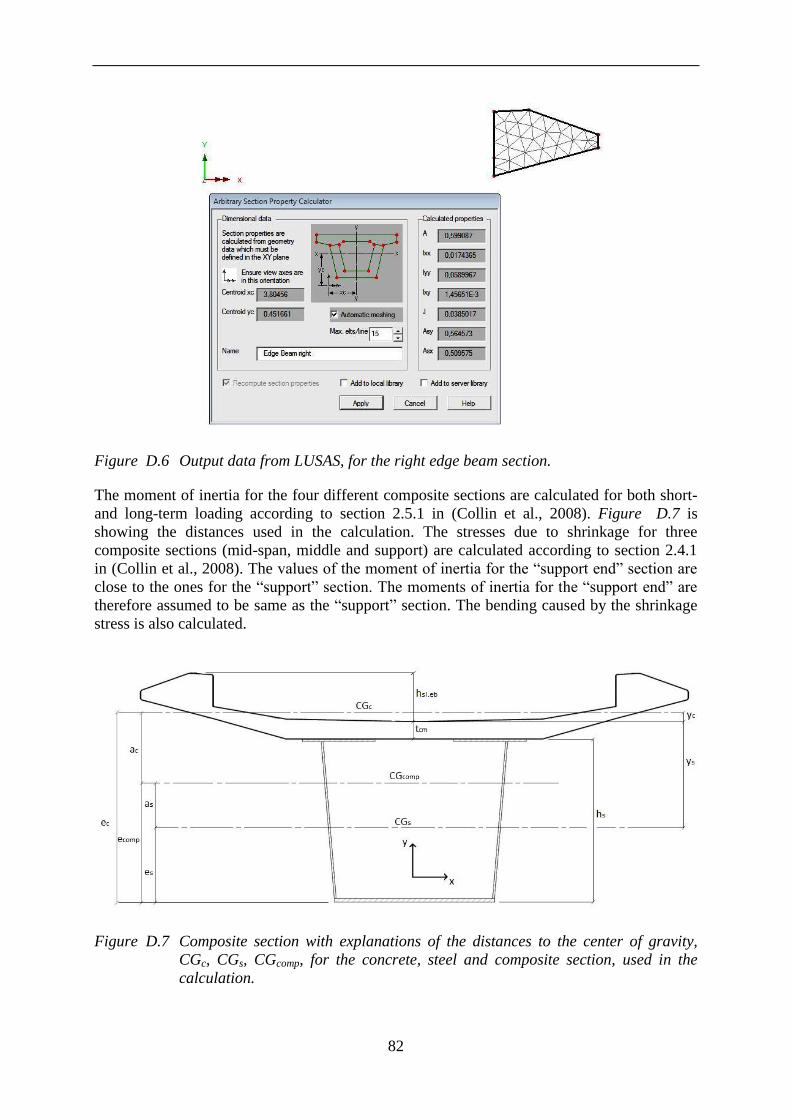
82
Figure D.6 Output data from LUSAS, for the right edge beam section.
The moment of inertia for the four different composite sections are calculated for both short-
and long-term loading according to section 2.5.1 in (Collin et al., 2008). Figure D.7 is
showing the distances used in the calculation. The stresses due to shrinkage for three
composite sections (mid-span, middle and support) are calculated according to section 2.4.1
in (Collin et al., 2008). The values of the moment of inertia for the “support end” section are
close to the ones for the “support” section. The moments of inertia for the “support end” are
therefore assumed to be same as the “support” section. The bending caused by the shrinkage
stress is also calculated.
Figure D.7 Composite section with explanations of the distances to the center of gravity,
CGc, CGs, CGcomp, for the concrete, steel and composite section, used in the
calculation.

APPENDIX D
83
Moment of inertia and stress due to shrinkage for mid-span section
BBK 94, 2.4.7

84
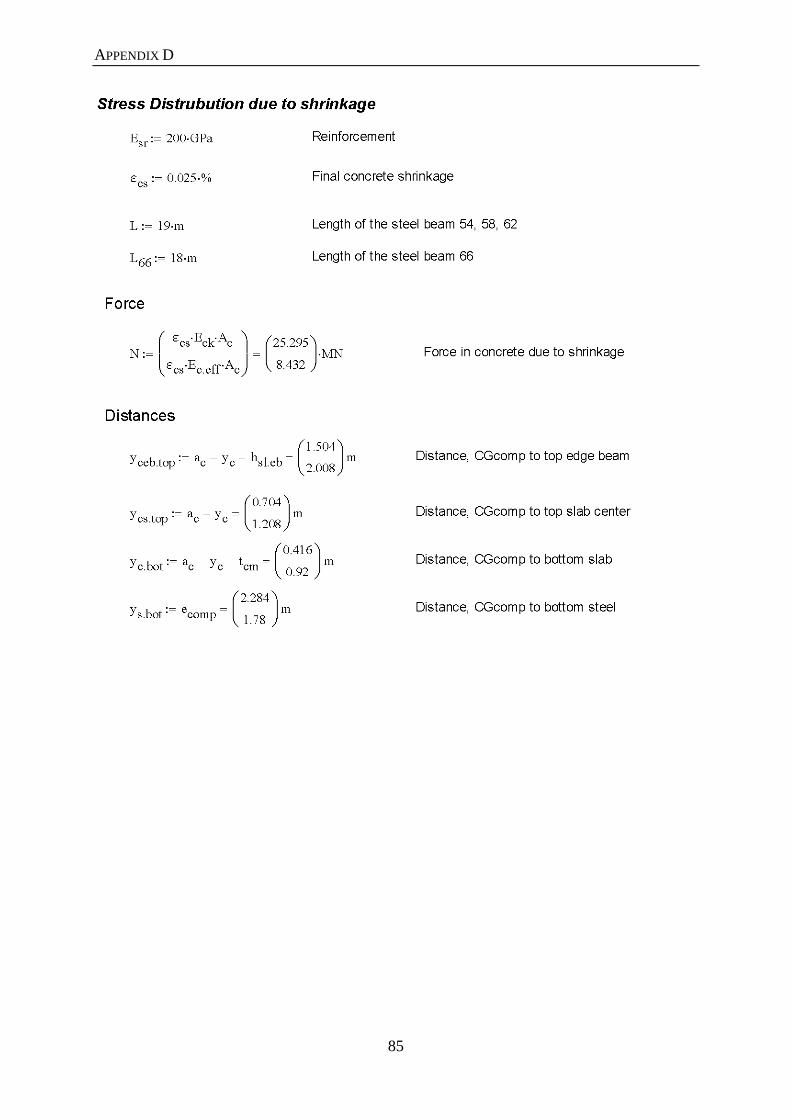
APPENDIX D
85
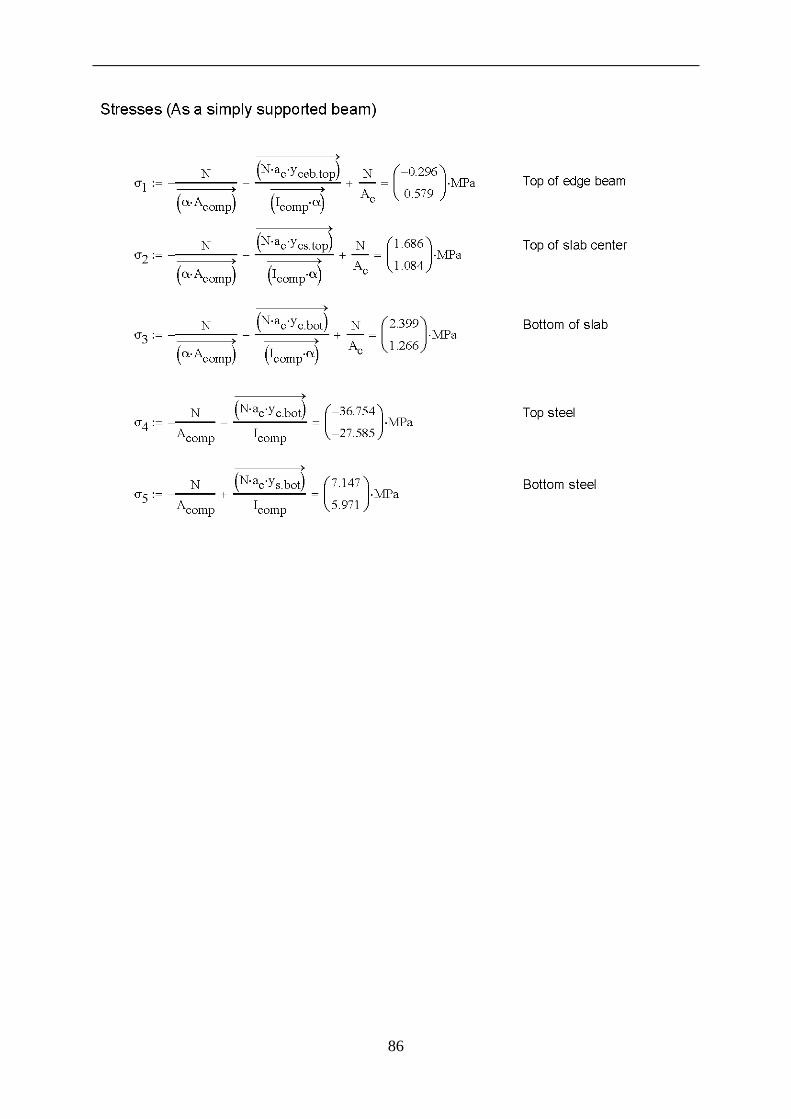
86

APPENDIX D
87
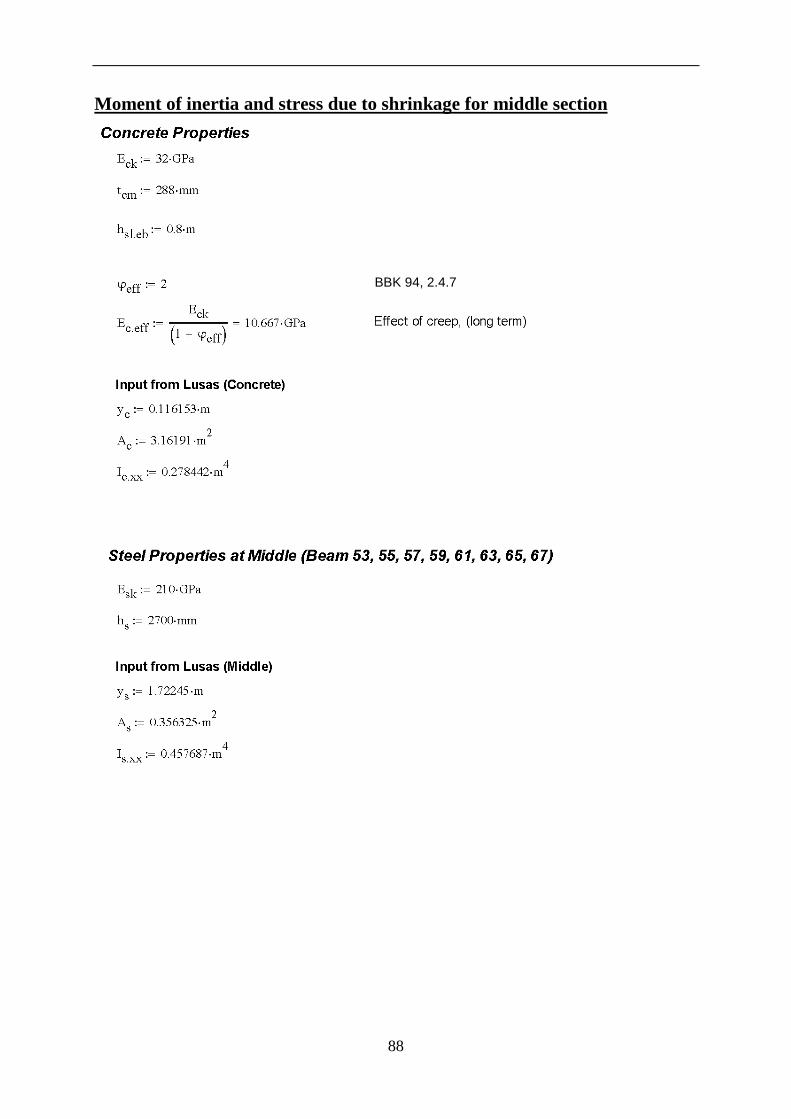
88
Moment of inertia and stress due to shrinkage for middle section
BBK 94, 2.4.7

APPENDIX D
89
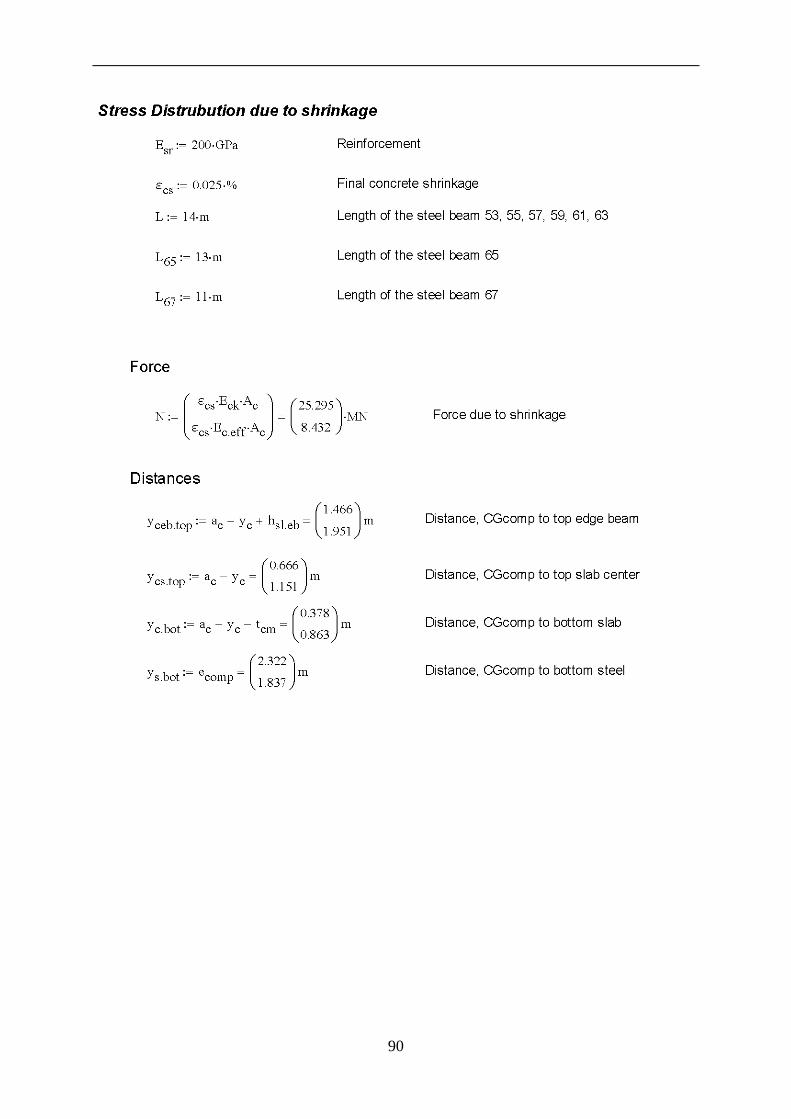
90
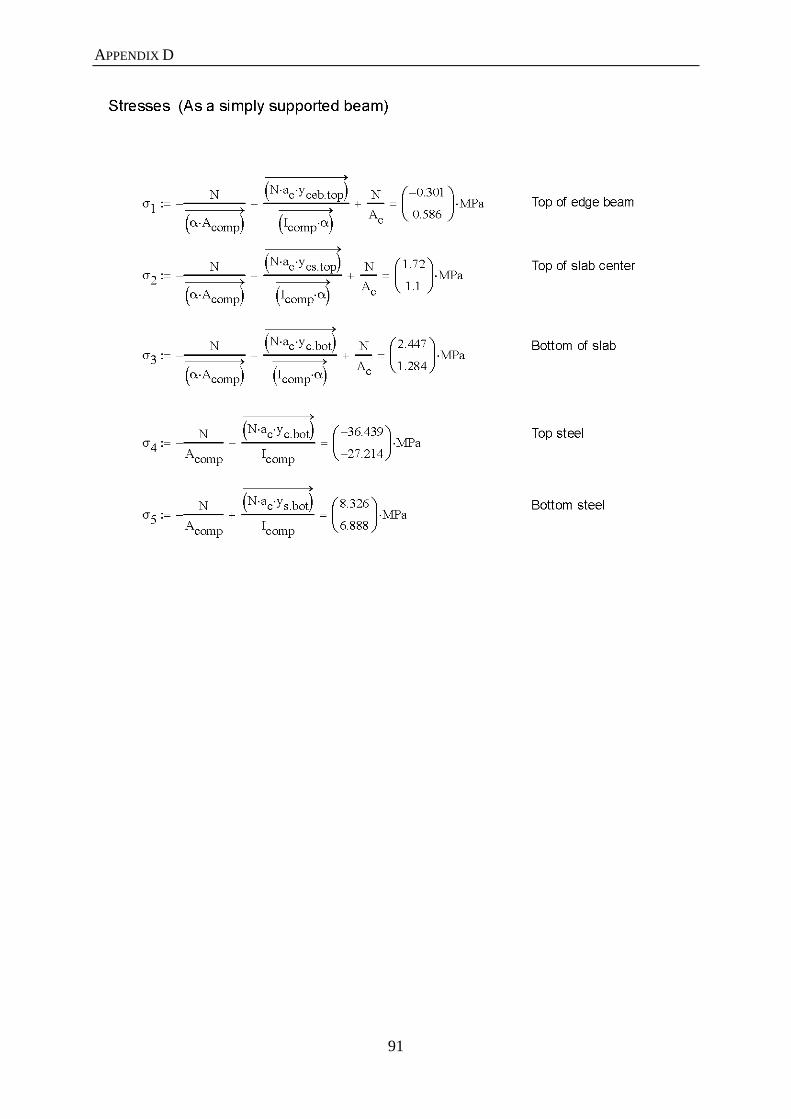
APPENDIX D
91
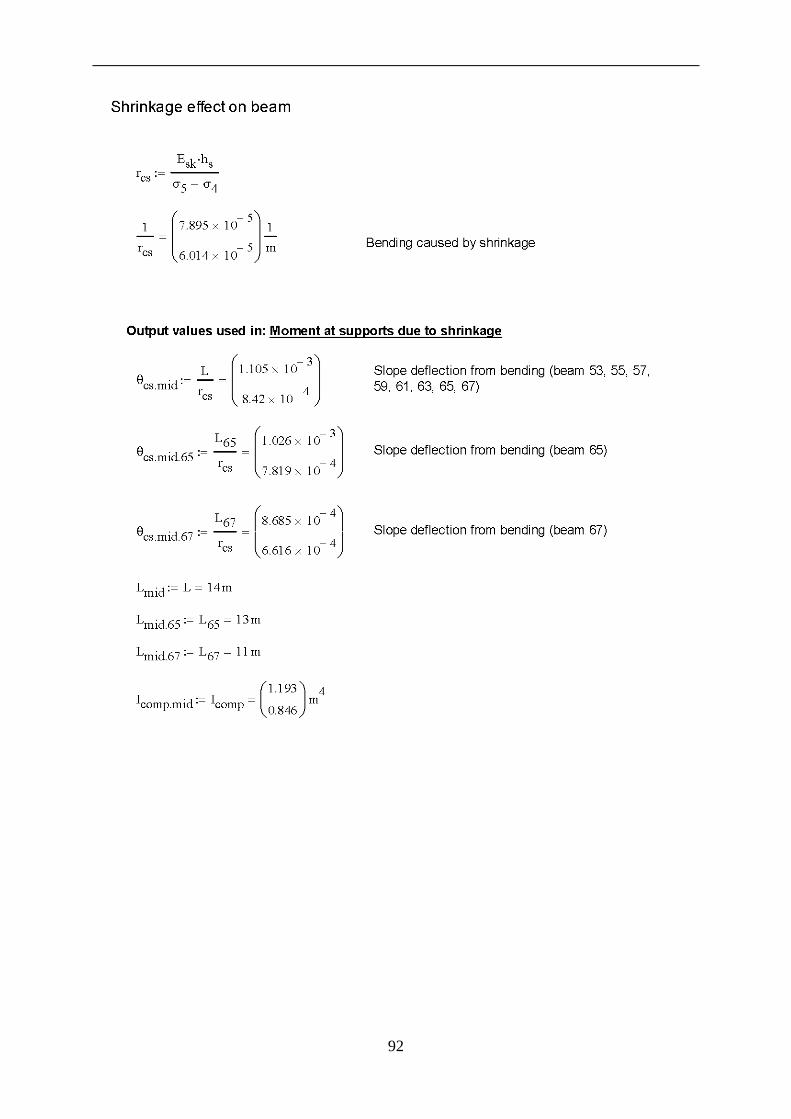
92

APPENDIX D
93
Moment of inertia and stress due to shrinkage for support section
BBK 94, 2.4.7

94
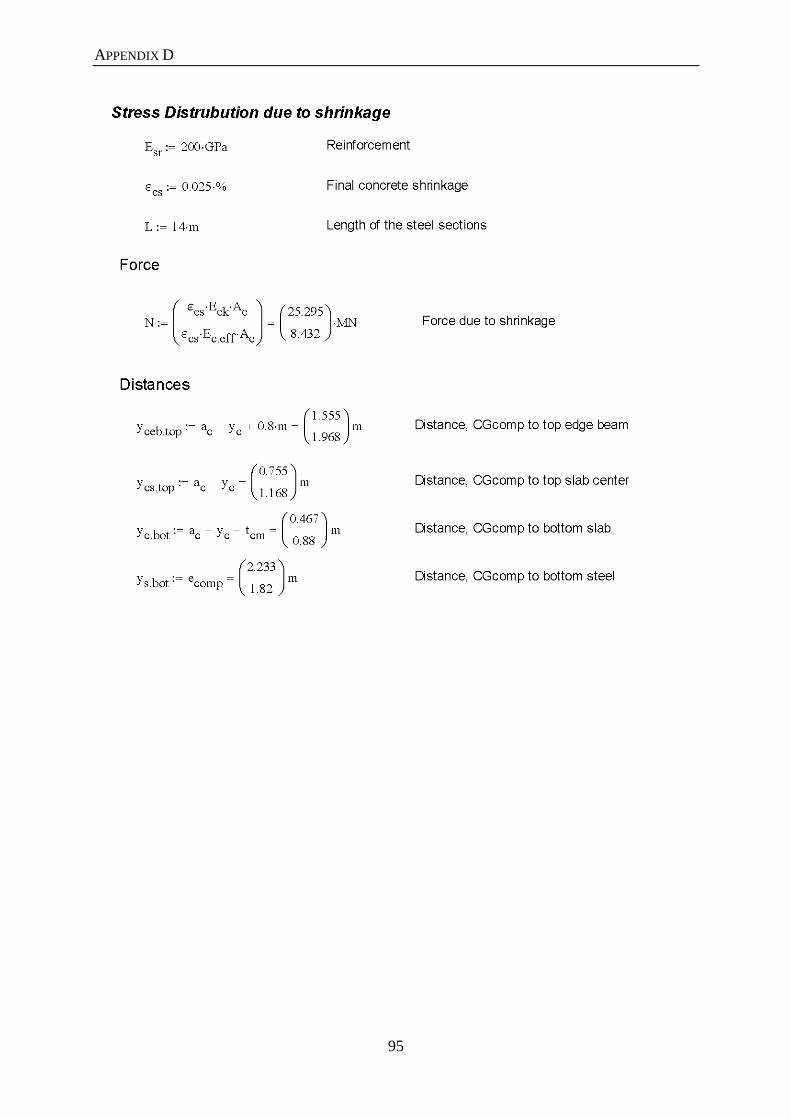
APPENDIX D
95

96

APPENDIX D
97
Moment of inertia for support end section
BBK 94, 2.4.7

98
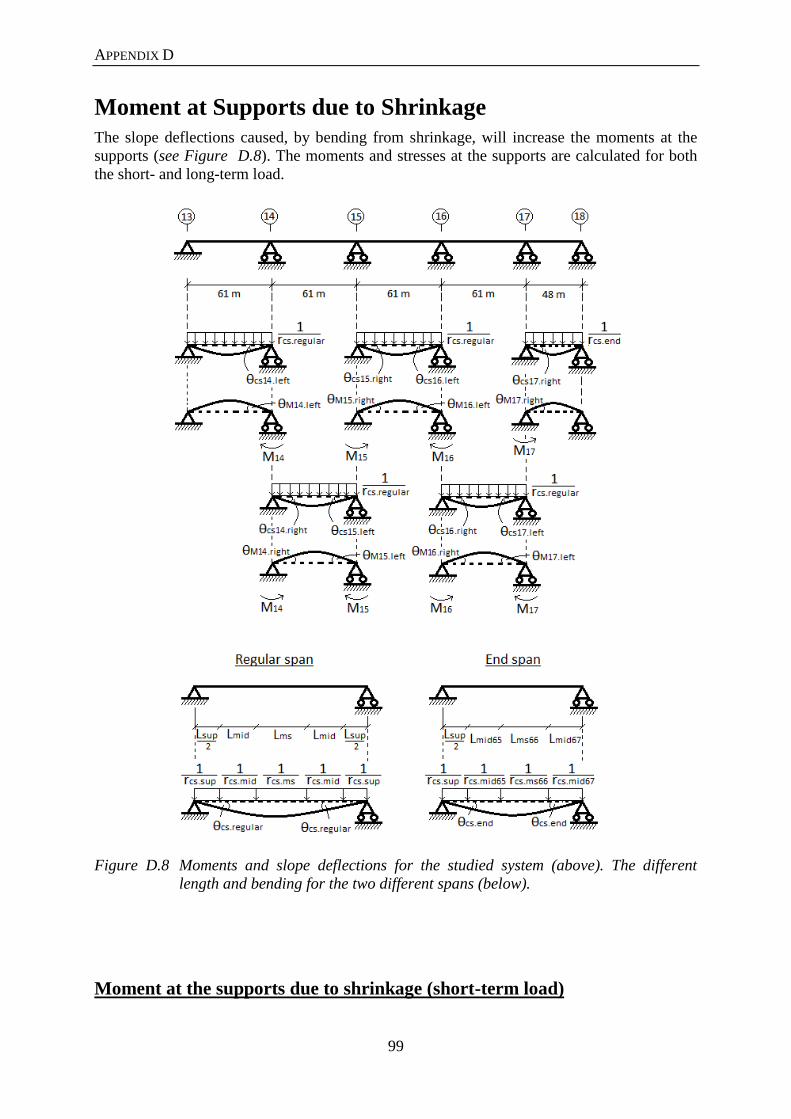
APPENDIX D
99
Moment at Supports due to Shrinkage
The slope deflections caused, by bending from shrinkage, will increase the moments at the
supports (see Figure D.8). The moments and stresses at the supports are calculated for both
the short- and long-term load.
Figure D.8 Moments and slope deflections for the studied system (above). The different
length and bending for the two different spans (below).
Moment at the supports due to shrinkage (short-term load)

100

APPENDIX D
101

102

APPENDIX D
103

104
Indata from: Moment of inertia and stress due to shrinkage for support section

APPENDIX D
105
Moments at the supports due to shrinkage (long-term load)
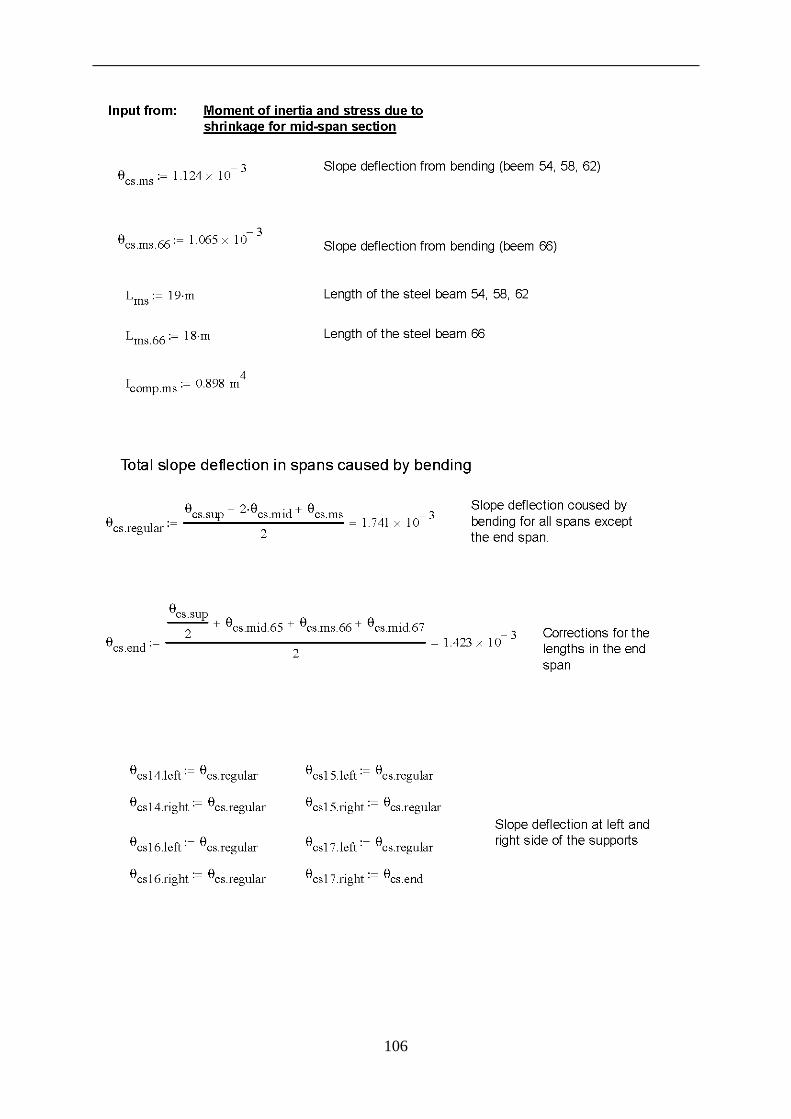
106

APPENDIX D
107

108

APPENDIX D
109
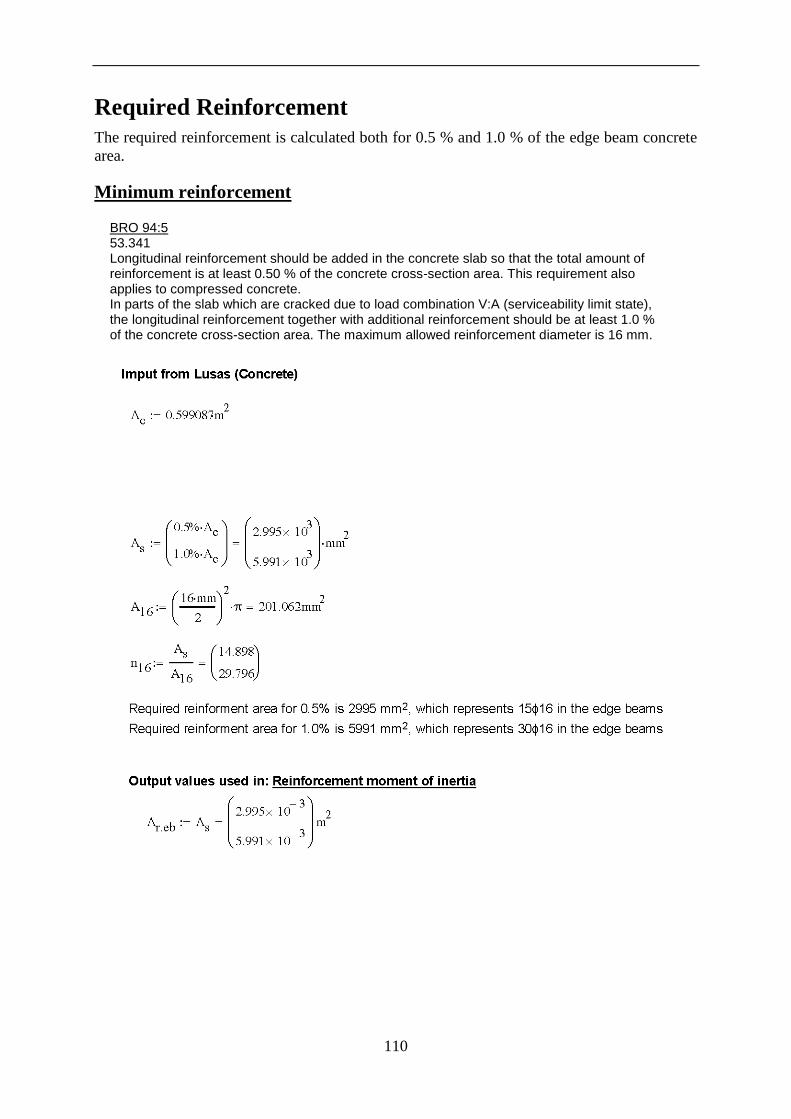
110
Required Reinforcement
The required reinforcement is calculated both for 0.5 % and 1.0 % of the edge beam concrete
area.
Minimum reinforcement
BRO 94:5 53.341 Longitudinal reinforcement should be added in the concrete slab so that the total amount of reinforcement is at least 0.50 % of the concrete cross-section area. This requirement also applies to compressed concrete. In parts of the slab which are cracked due to load combination V:A (serviceability limit state), the longitudinal reinforcement together with additional reinforcement should be at least 1.0 % of the concrete cross-section area. The maximum allowed reinforcement diameter is 16 mm.
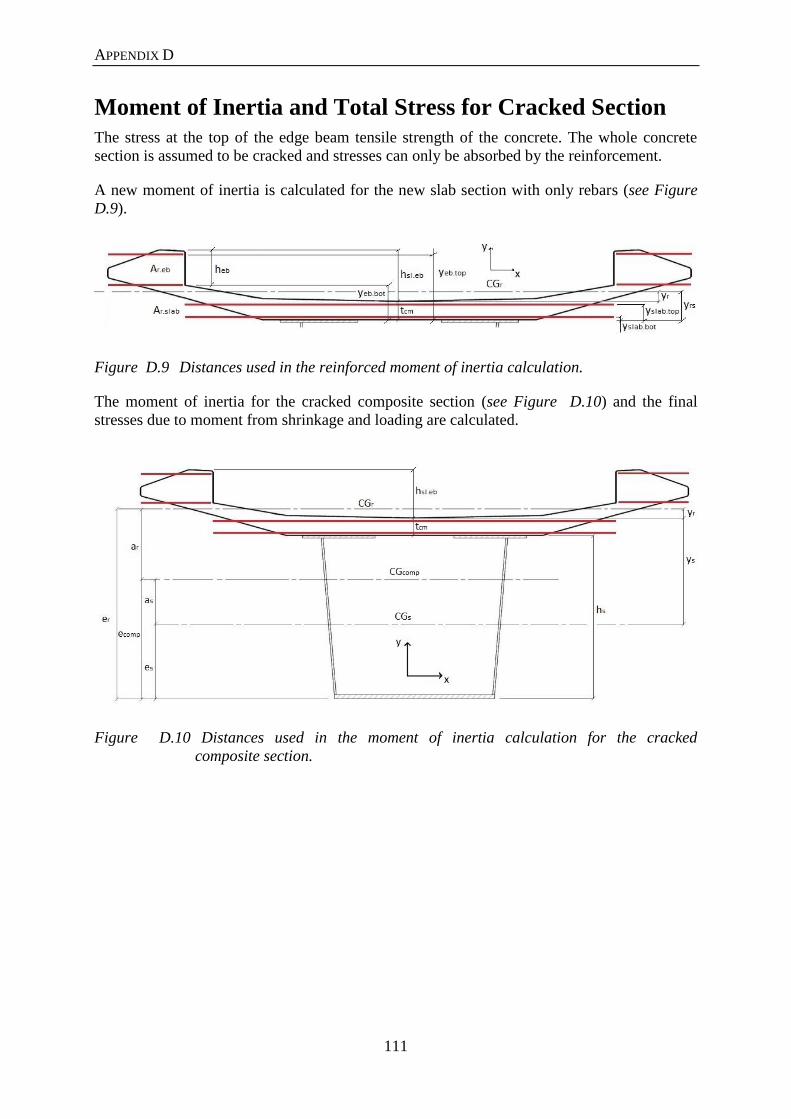
APPENDIX D
111
Moment of Inertia and Total Stress for Cracked Section
The stress at the top of the edge beam tensile strength of the concrete. The whole concrete
section is assumed to be cracked and stresses can only be absorbed by the reinforcement.
A new moment of inertia is calculated for the new slab section with only rebars (see Figure
D.9).
Figure D.9 Distances used in the reinforced moment of inertia calculation.
The moment of inertia for the cracked composite section (see Figure D.10) and the final
stresses due to moment from shrinkage and loading are calculated.
Figure D.10 Distances used in the moment of inertia calculation for the cracked
composite section.

112
Reinforcement moment of inertia

APPENDIX D
113

114
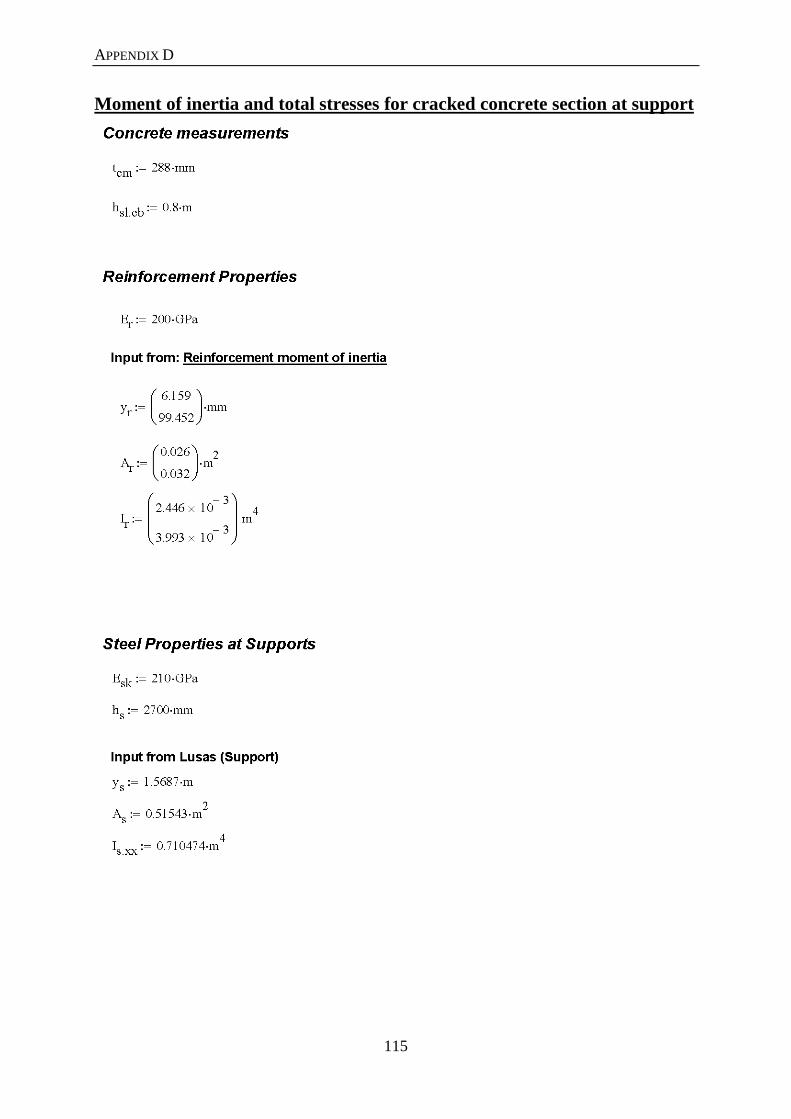
APPENDIX D
115
Moment of inertia and total stresses for cracked concrete section at support

116
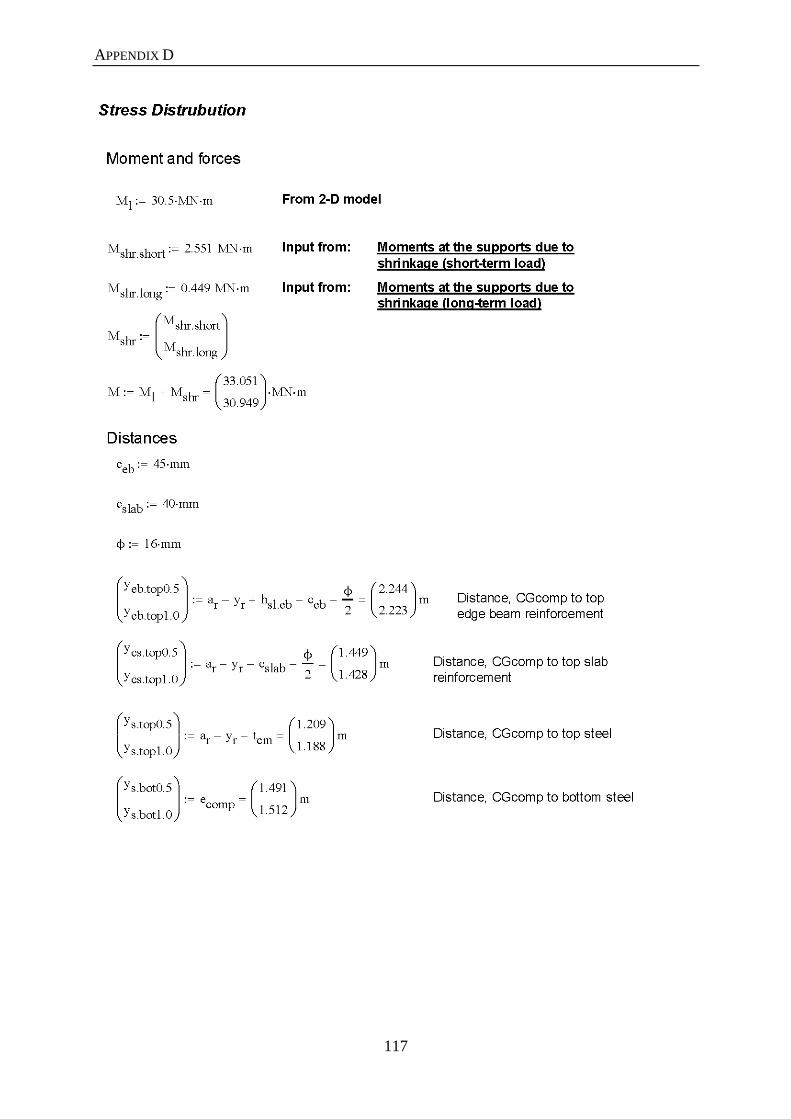
APPENDIX D
117

118
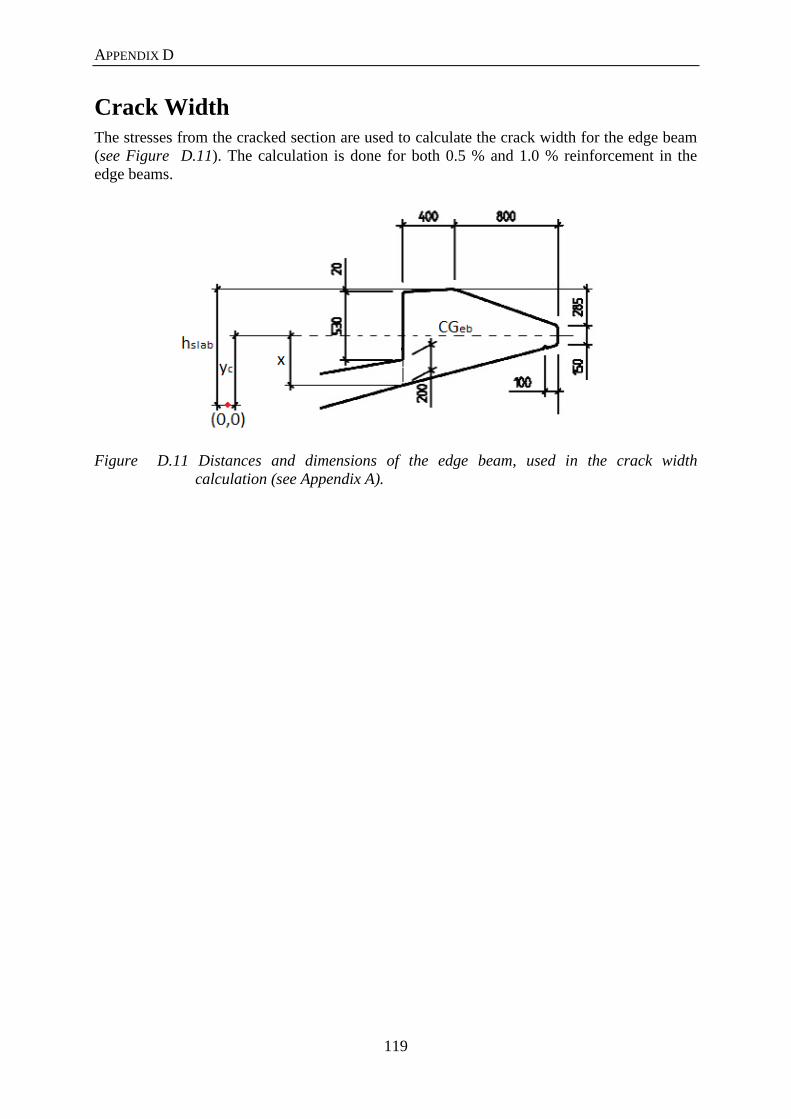
APPENDIX D
119
Crack Width
The stresses from the cracked section are used to calculate the crack width for the edge beam
(see Figure D.11). The calculation is done for both 0.5 % and 1.0 % reinforcement in the
edge beams.
Figure D.11 Distances and dimensions of the edge beam, used in the crack width
calculation (see Appendix A).
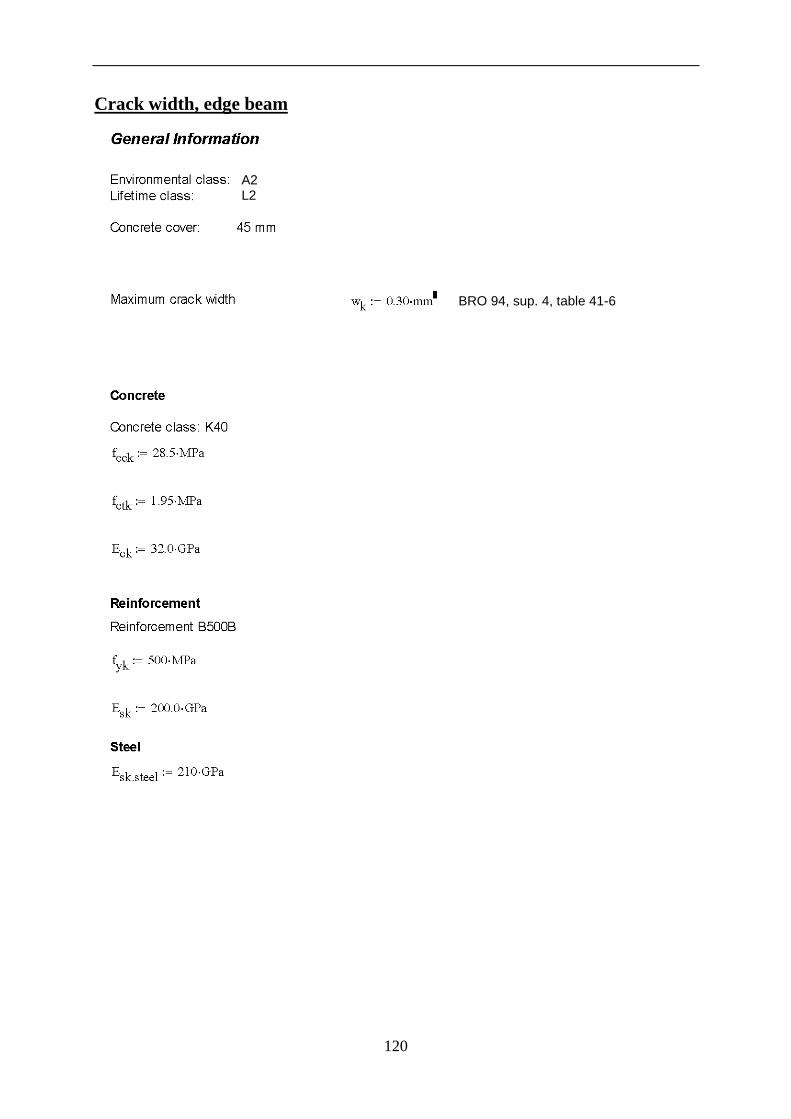
120
Crack width, edge beam
A2 L2
BRO 94, sup. 4, table 41-6

APPENDIX D
121
BRO 94:5 53.341 Longitudinal reinforcement should be added in the concrete slab so that the total amount of reinforcement is at least 0.50 % of the concrete cross-section area. This requirement also applies to compressed concrete. In parts of the slab which are cracked due to load combination V:A (serviceability limit state), the longitudinal reinforcement together with additional reinforcement should be at least 1.0 % of the concrete cross-section area. The maximum allowed reinforcement diameter is 16 mm.

122
BBK 94, 4.5.3
2.4.7
4.3

APPENDIX D
123
Whole section is in tension, bottom figure is used
Figure 4.5.5
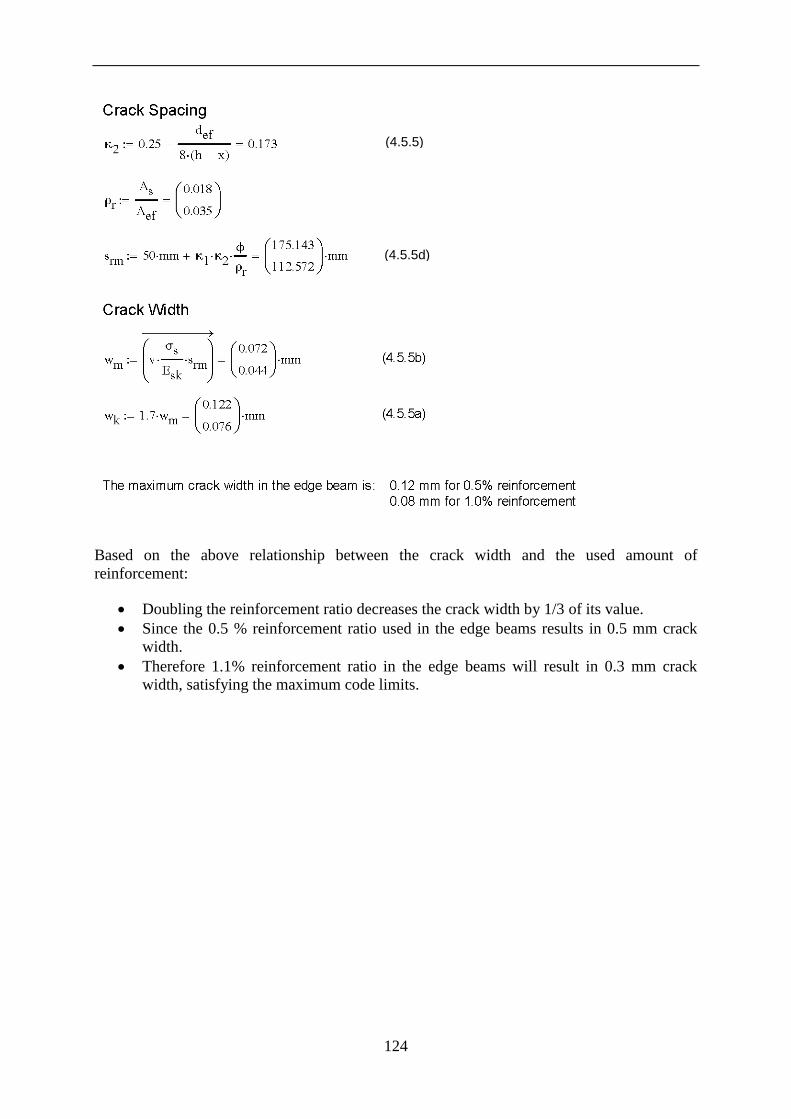
124
Based on the above relationship between the crack width and the used amount of
reinforcement:
Doubling the reinforcement ratio decreases the crack width by 1/3 of its value.
Since the 0.5 % reinforcement ratio used in the edge beams results in 0.5 mm crack
width.
Therefore 1.1% reinforcement ratio in the edge beams will result in 0.3 mm crack
width, satisfying the maximum code limits.
(4.5.5)
(4.5.5d)

APPENDIX E
125
Appendix E Original Calculations
This is the original calculation (in Swedish) for the longitudinal reinforcement (Tyréns AB,
2004) regarding the amount of reinforcement used in the slab and edge beams. It also includes
the expected crack width in the slab.

126

APPENDIX E
127

128

APPENDIX E
129
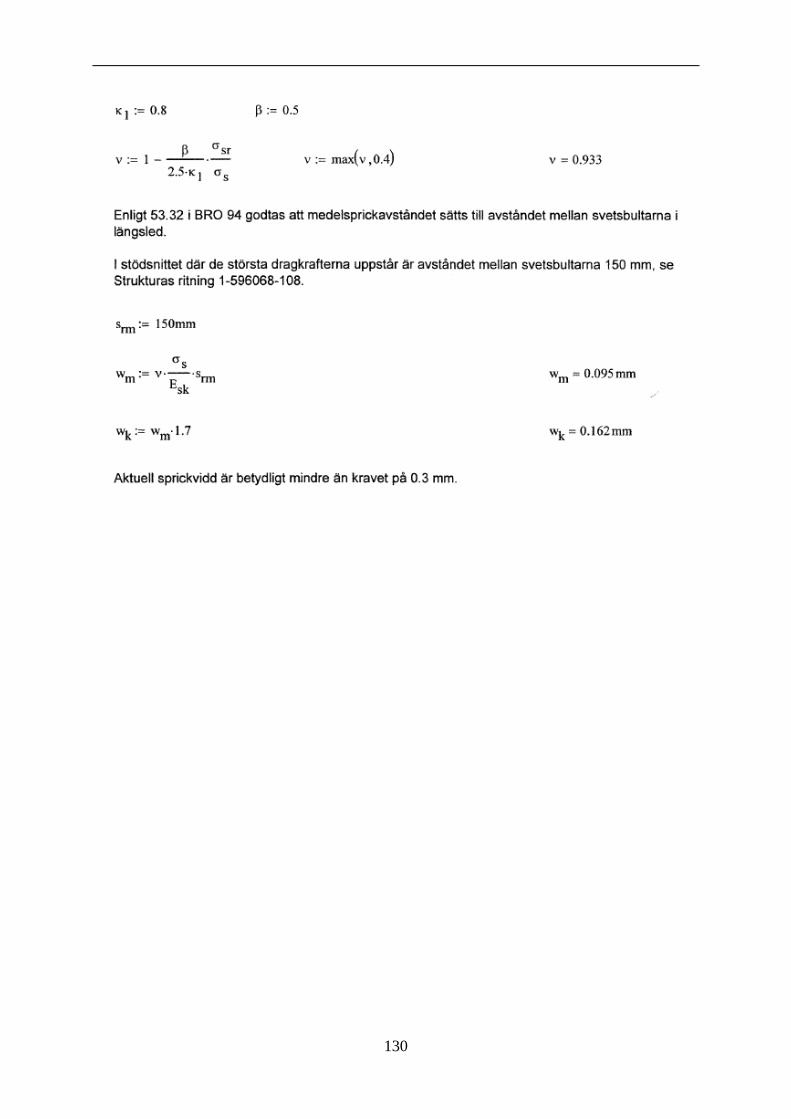
130
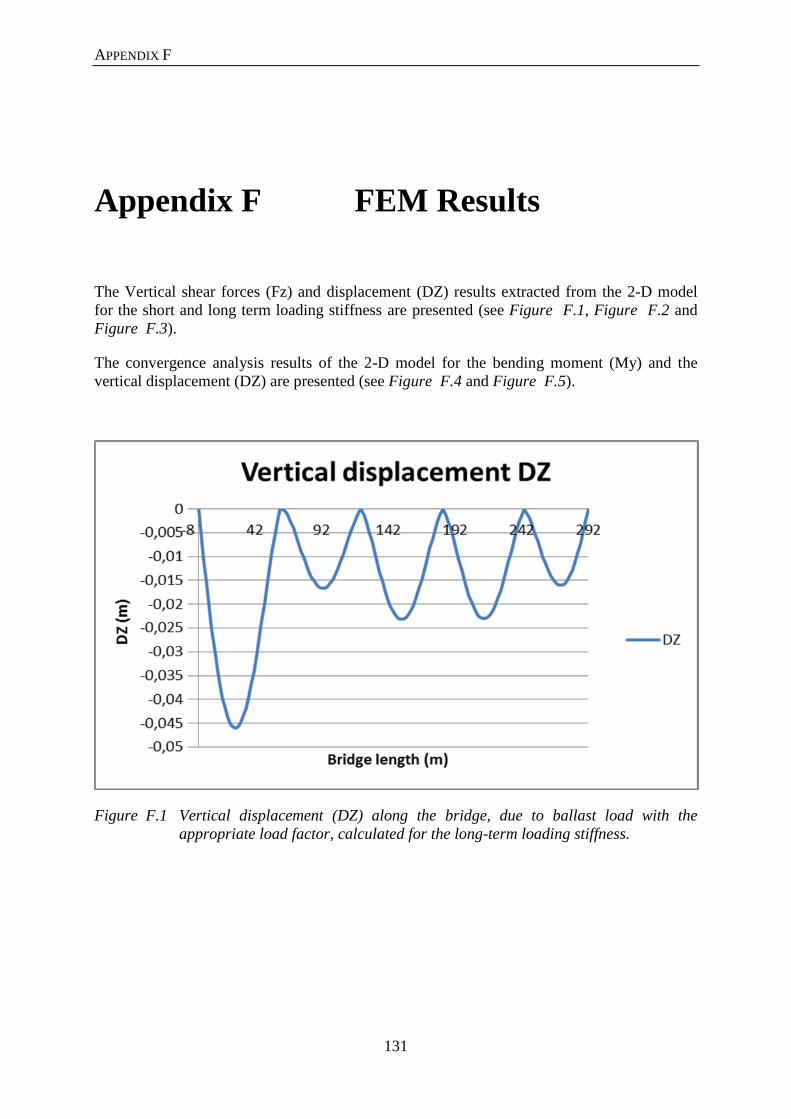
APPENDIX F
131
Appendix F FEM Results
The Vertical shear forces (Fz) and displacement (DZ) results extracted from the 2-D model
for the short and long term loading stiffness are presented (see Figure F.1, Figure F.2 and
Figure F.3).
The convergence analysis results of the 2-D model for the bending moment (My) and the
vertical displacement (DZ) are presented (see Figure F.4 and Figure F.5).
Figure F.1 Vertical displacement (DZ) along the bridge, due to ballast load with the
appropriate load factor, calculated for the long-term loading stiffness.
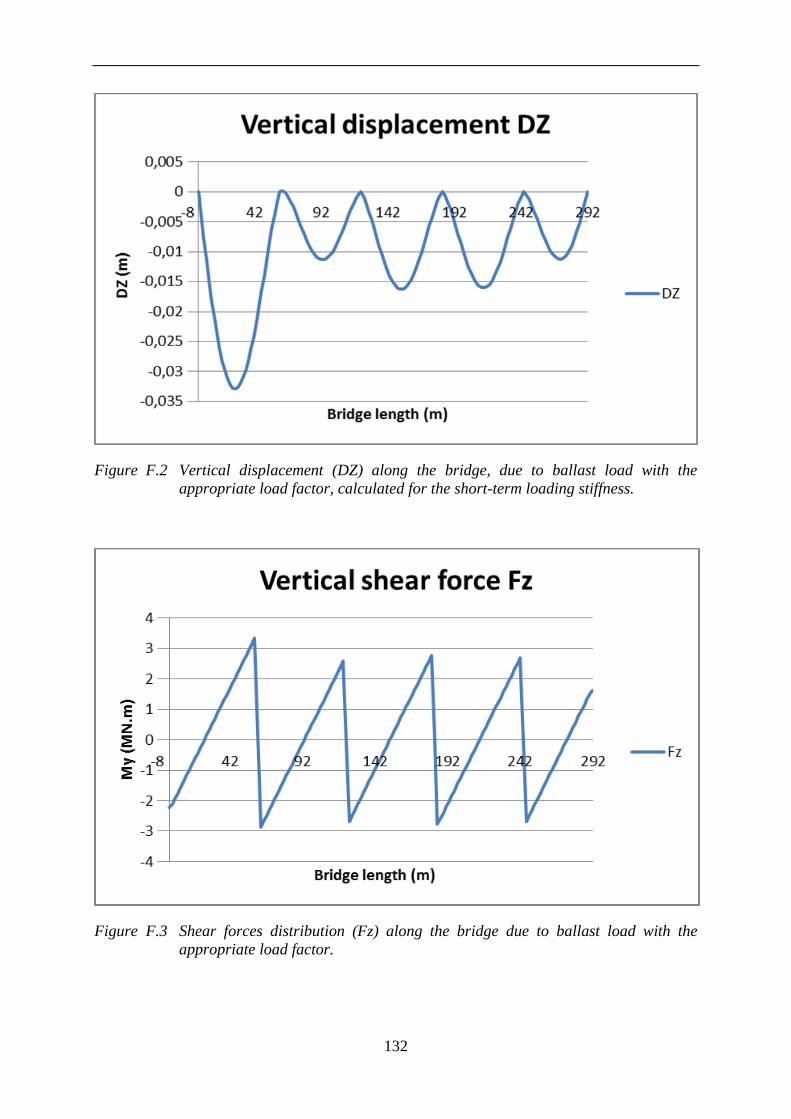
132
Figure F.2 Vertical displacement (DZ) along the bridge, due to ballast load with the
appropriate load factor, calculated for the short-term loading stiffness.
Figure F.3 Shear forces distribution (Fz) along the bridge due to ballast load with the
appropriate load factor.

APPENDIX F
133
Figure F.4 Bending moment along the bridge length drawn for mesh sizes 8, 4, 2, 1, and
0.5m for the convergence of mesh size.
Figure F.5 Vertical displacement along the bridge length drawn for mesh sizes 8, 4, 2, 1,
and 0.5m for the convergence of mesh size.

TRITA-BKN. Master Thesis 352,
Structural Design and Bridges 2012
ISSN 1103-4297
ISRN KTH/BKN/EX-352-SE
www.kth.se