Embed Size (px)
Citation preview
ANNUAL REPORT 2014
SustainableSolutions
For A BetterTomorrow
Our Vision
To be the leading company the world seeks for innovative and effective environmental solutions.
Our Mission
To provide efficient and cost-effective solutions to meet our clients’ needs through innovation and technological advancement.
Group Financial Highlights
Message from Executive Chairman & Group Chief Executive Officer
Board of Directors
Key Management Committee
Management Committee
Geographical Presence
Financial Review
Operating Review
Corporate Governance
Corporate Social Responsibility
2
4
10
14
14
15
16
19
24
38
Table of Contents
1
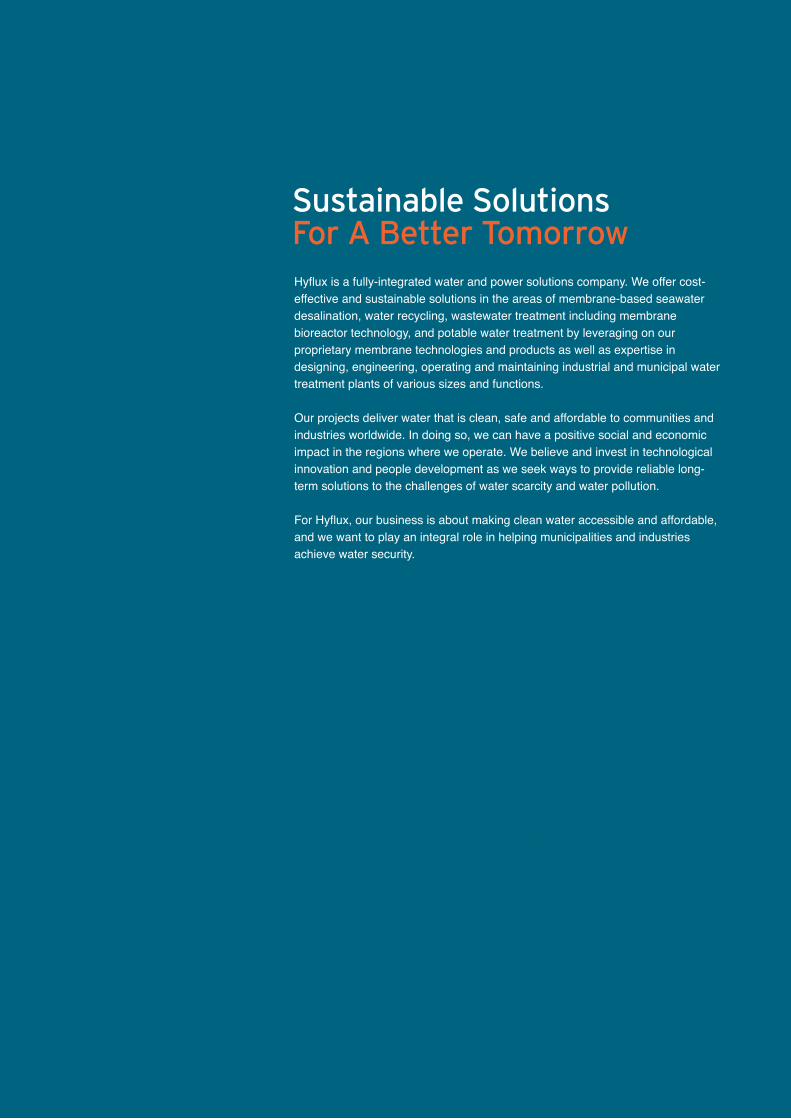
Sustainable Solutions For a Better Tomorrow
Hyflux is a fully-integrated water and power solutions company. We offer cost-effective and sustainable solutions in the areas of membrane-based seawater desalination, water recycling, wastewater treatment including membrane bioreactor technology, and potable water treatment by leveraging on our proprietary membrane technologies and products as well as expertise in designing, engineering, operating and maintaining industrial and municipal water treatment plants of various sizes and functions.
Our projects deliver water that is clean, safe and affordable to communities and industries worldwide. In doing so, we can have a positive social and economic impact in the regions where we operate. We believe and invest in technological innovation and people development as we seek ways to provide reliable long-term solutions to the challenges of water scarcity and water pollution.
For Hyflux, our business is about making clean water accessible and affordable, and we want to play an integral role in helping municipalities and industries achieve water security.
Sustainable SolutionsFor A Better Tomorrow
2
Hyflux Ltd Annual Report 2014
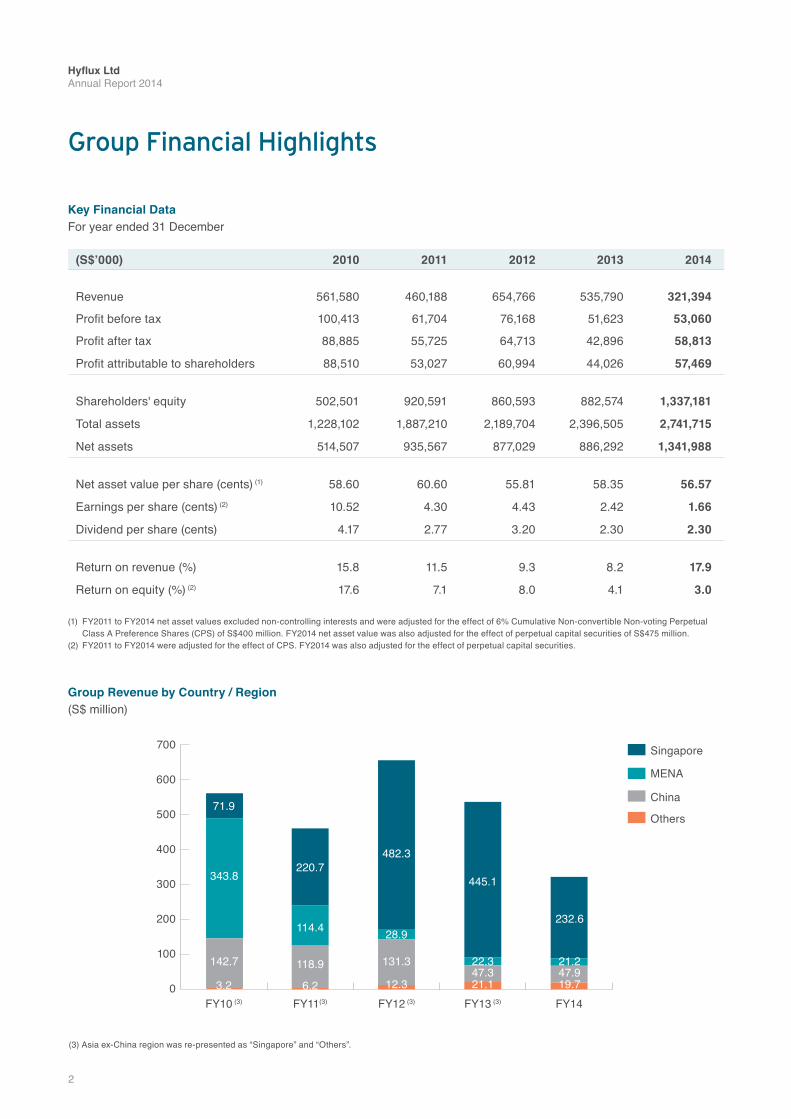
Group Financial Highlights
(S$’000) 2010 2011 2012 2013 2014
Revenue 561,580 460,188 654,766 535,790 321,394
Profit before tax 100,413 61,704 76,168 51,623 53,060
Profit after tax 88,885 55,725 64,713 42,896 58,813
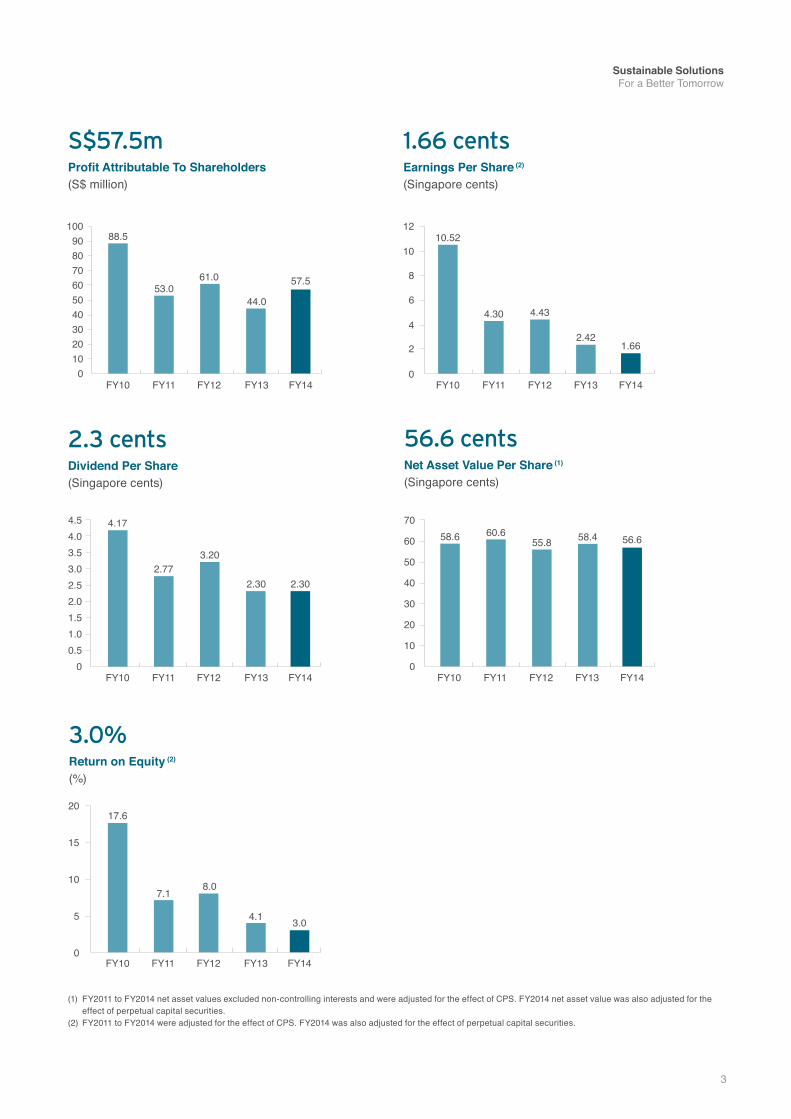
Profit attributable to shareholders 88,510 53,027 60,994 44,026 57,469
Shareholders' equity 502,501 920,591 860,593 882,574 1,337,181
Total assets 1,228,102 1,887,210 2,189,704 2,396,505 2,741,715
Net assets 514,507 935,567 877,029 886,292 1,341,988
Net asset value per share (cents) (1) 58.60 60.60 55.81 58.35 56.57
Earnings per share (cents) (2) 10.52 4.30 4.43 2.42 1.66
Dividend per share (cents) 4.17 2.77 3.20 2.30 2.30
Return on revenue (%) 15.8 11.5 9.3 8.2 17.9
Return on equity (%) (2) 17.6 7.1 8.0 4.1 3.0
Key Financial DataFor year ended 31 December
Group Revenue by Country / Region(S$ million)
(3) Asia ex-China region was re-presented as “Singapore” and “Others”.
(1) FY2011 to FY2014 net asset values excluded non-controlling interests and were adjusted for the effect of 6% Cumulative Non-convertible Non-voting Perpetual Class A Preference Shares (CPS) of S$400 million. FY2014 net asset value was also adjusted for the effect of perpetual capital securities of S$475 million. (2) FY2011 to FY2014 were adjusted for the effect of CPS. FY2014 was also adjusted for the effect of perpetual capital securities.
Singapore
MENA
China
Others
FY10 (3) FY11(3) FY12 (3) FY13 (3) FY14
700
300
600
200
500
100
400
0 6.2 12.3 21.1 19.7
142.7 118.9 131.3 22.3 21.247.3 47.9
343.8
114.4 28.9
71.9
220.7482.3
445.1
232.6
3.2
3
Sustainable Solutions For a Better Tomorrow
(1) FY2011 to FY2014 net asset values excluded non-controlling interests and were adjusted for the effect of CPS. FY2014 net asset value was also adjusted for the effect of perpetual capital securities.(2) FY2011 to FY2014 were adjusted for the effect of CPS. FY2014 was also adjusted for the effect of perpetual capital securities.
FY10
FY10
4.17
FY10
17.6
88.5
0
0
0
0
10
0.5
5
20
10
20
1.0
10
30
30
1.5
15
40
40
2.0
20
50
50
2.5
60
60
3.0
70
70
3.5
80
4.0
90
4.5
0
2
4
6
8
10
12100
FY10
FY10
58.6
10.52
FY11
FY11
2.77
FY11
7.1
53.0
FY11
FY11
60.6
4.30
FY12
FY12
3.20
FY12
8.0
61.0
FY12
FY12
55.8
4.43
FY13
FY13
2.30 2.30
FY13
4.1 3.0
44.0
57.5
FY13
FY13
58.4 56.6
2.421.66
FY14
FY14
FY14
FY14
FY14
1.66 centsEarnings Per Share (2)
(Singapore cents)
56.6 centsNet Asset Value Per Share (1)
(Singapore cents)
S$57.5mProfit Attributable To Shareholders(S$ million)
2.3 centsDividend Per Share
(Singapore cents)
3.0%Return on Equity (2)
(%)
4
Hyflux Ltd Annual Report 2014
Message fromExecutive Chairman & Group Chief Executive Officer
Olivia Lum Executive Chairman & Group Chief Executive Officer
5
Sustainable Solutions For a Better Tomorrow
Dear Stakeholders,
2014 was a year of strategic progress for Hyflux amid the climate of global economic and political uncertainties. We successfully completed the construction of the 411 MW combined cycle gas turbine power plant co-located with Tuaspring Desalination Plant in Singapore. This development marked our expansion into a new business that will complement and enhance our competitiveness in our core water business.
The global water industry started to show signs of recovery after a long bout of weakness in the wake of the global financial crisis and political upheavals in the Middle East and North Africa region. But the momentum of municipal project tenders did not start to pick up until the second half of 2014.
We have displayed resilience and performed commendably. Our Group revenue for the year ended 31 December 2014 was S$321.4 million while profit after tax and minority interests was S$57.5 million. The lower revenue was due to a time lag between the completion of Tuaspring Desalination Plant and the commencement of engineering, procurement and construction (EPC) works for the seawater reverse osmosis
desalination plant in Dahej in the state of Gujarat, India. A higher level of divestment activities contributed to higher profits in FY2014.
The pace of progress towards achieving financial close for the 336,000 m3/day desalination project for the Dahej Special Economic Zone (SEZ) has been slower than anticipated despite a water purchase agreement signed with Dahej SEZ Limited in January 2013. We continue to actively work with our consortium partner, Hitachi Ltd, and the relevant authorities to move the project forward.
We strengthened our balance sheet during the year. As part of our asset light strategy, we sold and leased back Hyflux Innovation Centre as well as divested our interests in Hyflux Marmon Development Pte Ltd and Marmon Hyflux Investments Pte Ltd. We also successfully raised S$475.0 million through two perpetual capital securities issues in January and July 2014. The proceeds will enable us to finance infrastructure and water projects, acquire new technology, invest in R&D, and expand our membrane manufacturing automation and capacity.
Our total order book currently stands at more than S$2.9 billion with operations and maintenance (O&M) contributing S$2.0 billion.
2014 was a year of strategic progress for Hyflux amid the climate of global economic and political uncertainties.

6
Hyflux Ltd Annual Report 2014
In December 2014, we won an international tender by Oman Power and Water Procurement Company SAOC (OPWP) to design, build, own and operate an independent water project (IWP) in Qurayyat, Sultanate of Oman. The project is worth an estimated US$250.0 million and will add another 200,000 m3/day of desalinated water to Oman’s drinking water supply. I am pleased to announce that we have signed the water purchase agreement in March 2015. Construction is expected to start soon. The project is scheduled to commence commercial operation by May 2017 and deliver water to OPWP for a period of 20 years.
Magtaa Desalination Plant was officially opened by Algeria’s Prime Minister, Mr Abdelmalek Sellal, in November 2014. We were also greatly honoured to have Singapore’s Minister for the Environment and Water Resources, Dr Vivian Balakrishnan, attend the event.
Magtaa Desalination Plant has a designed capacity of 500,000 m3/day and is the largest
seawater reverse osmosis desalination plant on the African continent. It will provide a sustainable and reliable supply of water to Oran, Algeria’s second largest city, and the neighbouring provinces under a 25-year water purchase agreement with L’ Algérienne Des Eaux and Sonatrach. The plant will also contribute to our recurring income base over the next 25 years.
In Singapore, we look forward to commissioning Tuaspring Power Plant after it is connected to the national power grid in the second half of 2015 following a prolonged grid connection delay.
Message fromExecutive Chairman & Group Chief Executive Officer
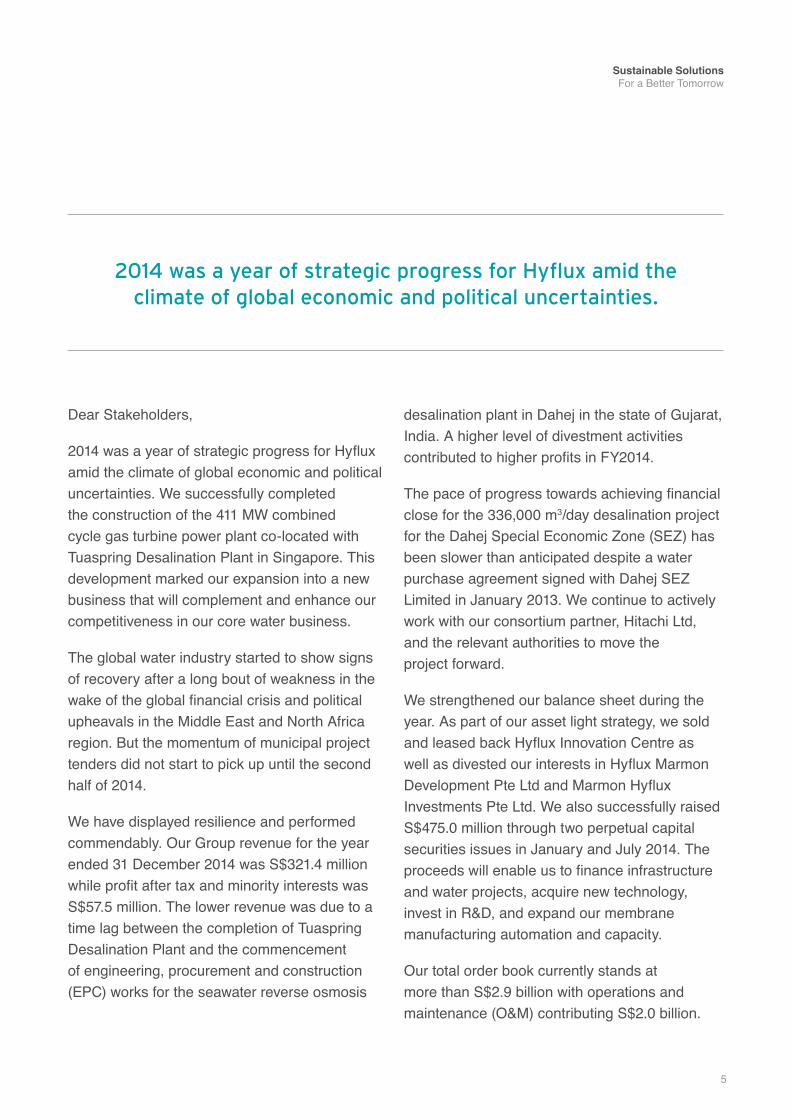
The integration of a desalination facility with a power plant is a first in Asia and for Hyflux. When the power
plant comes online, it will open up opportunities for us in the independent water and power project sector.
Official opening ceremony of Magtaa Desalination Plant, Algeria
7
Sustainable Solutions For a Better Tomorrow
The integration of a desalination facility with a power plant is a first in Asia and for Hyflux. When the power plant comes online, it will open up opportunities for us in the independent water and power project sector.
By 2016, we expect to see substantially stronger recurring income from our current portfolio of water projects, asset returns, membrane sales and other services.
Our Board of Directors has proposed a final dividend of 1.60 Singapore cents per ordinary share. Together with an interim dividend of 0.70 Singapore cents per ordinary share paid in September 2014, the total dividend for the full year will amount to 2.30 Singapore cents per ordinary share.
RECOVERY OF WATER INFRASTRUCTURE PROJECT MARKET
We are cautiously optimistic about the recovery of the water industry in 2015 amidst a weaker oil price environment. There are signs pointing to
a rebound in the global market for large-scale water infrastructure projects, and we have been actively bidding for projects in selective markets in the Middle East, Africa, Asia and the Americas.
While the first half of the current financial year is likely to be slow, we expect a pick-up in the second half. We will also be exploring some asset divestment opportunities during the year. The journey may be challenging, but we believe challenges will also bring opportunities to those who are nimble and flexible. Our focus on areas where we can add value, prudence and discipline in our investments as well as efficient cost structure, will put us in good stead in the competitive global landscape.
The fundamental need for water will not change. Growing populations and industries will continue to drive the demand for water. In regions facing water stress, demand is outstripping supply from available infrastructure. Countries are increasingly recognising that they have to plan and develop alternative sources of water through desalination and water recycling. In fact, the desalination market is expected to grow by 61% to be worth US$21.0 billion a year by 2019. With countries looking to the private sector to fund public sector water investments, we can expect more Build-Operate-Transfer (BOT) and Public-Private-Partnership (PPP) opportunities to come.
Tuaspring Power Plant, Singapore
8
Hyflux Ltd Annual Report 2014
Message fromExecutive Chairman & Group Chief Executive Officer
To support sustainable growth, we believe that an integrated approach to urban development and resource
management is required. Urbanisation presents an opportunity for Hyflux to help future cities to draw on
the synergies between water, energy and waste.
SUSTAINABLE SOLUTIONS FOR A BETTER TOMORROW
In a world where the economy, environment and society are interconnected, Hyflux as one of the leading companies in water and environmental solutions, has a key role to play in the development of sustainable cities.
Over half of the world’s population currently lives in cities. By 2050, the proportion of city dwellers in the world will reach nearly three-quarters, with much of this increase concentrated in Asia and Africa. The number of cities with populations of over a million people will also increase, and so too, will megacities with more than 10 million people. Rapid urbanisation will exert pressure on vital services such as drinking water, sanitation, and electricity. To support sustainable growth, we believe that an integrated approach to urban development and resource management is required. Urbanisation presents an opportunity for Hyflux to help future cities to draw on the synergies between water, energy and waste.
We are also looking to the future and anticipating the needs of municipal and industrial customers as well as the types of products and solutions we can offer. An example of this is our Floating Desalination Production Vessel, which was launched during the Singapore International Water Week 2014. The vessel was conceived to provide a quick, flexible and reliable water supply and is most suited for emergency situations or humanitarian purposes, as well as for highly populated and industrialised areas with land limitations or space availability issues.
We will continue to invest in innovation as well as the acquisition of membrane and materials technology to drive resource efficiency and resource recovery.
Every stage of the water value chain offers opportunities for us to create value. We will strengthen our competitiveness and core capabilities as well as leverage our partnerships and financial platform to stay ahead of the competition.
9
Sustainable Solutions For a Better Tomorrow
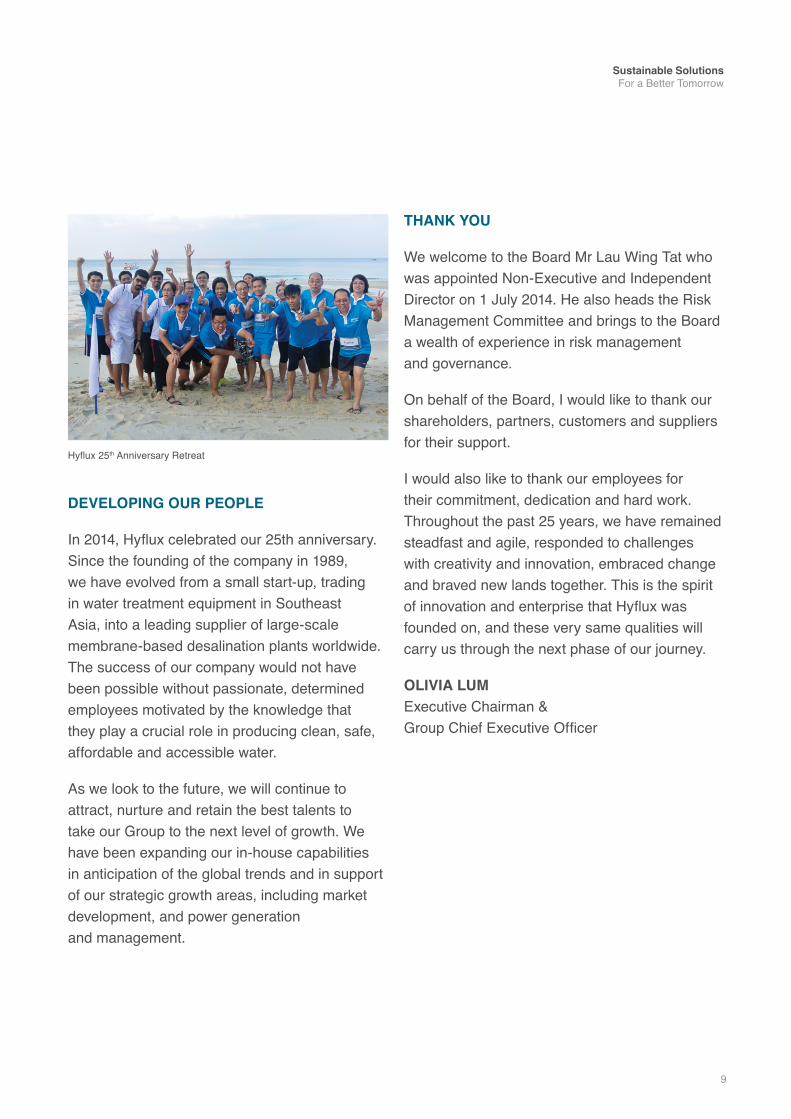
DEVELOPING OUR PEOPLE
In 2014, Hyflux celebrated our 25th anniversary. Since the founding of the company in 1989, we have evolved from a small start-up, trading in water treatment equipment in Southeast Asia, into a leading supplier of large-scale membrane-based desalination plants worldwide. The success of our company would not have been possible without passionate, determined employees motivated by the knowledge that they play a crucial role in producing clean, safe, affordable and accessible water.
As we look to the future, we will continue to attract, nurture and retain the best talents to take our Group to the next level of growth. We have been expanding our in-house capabilities in anticipation of the global trends and in support of our strategic growth areas, including market development, and power generation and management.
THANK YOU
We welcome to the Board Mr Lau Wing Tat who was appointed Non-Executive and Independent Director on 1 July 2014. He also heads the Risk Management Committee and brings to the Board a wealth of experience in risk management and governance.
On behalf of the Board, I would like to thank our shareholders, partners, customers and suppliers for their support.
I would also like to thank our employees for their commitment, dedication and hard work. Throughout the past 25 years, we have remained steadfast and agile, responded to challenges with creativity and innovation, embraced change and braved new lands together. This is the spirit of innovation and enterprise that Hyflux was founded on, and these very same qualities will carry us through the next phase of our journey.
OLIVIA LUM Executive Chairman & Group Chief Executive Officer
Hyflux 25th Anniversary Retreat
10
Hyflux Ltd Annual Report 2014
Board of Directors
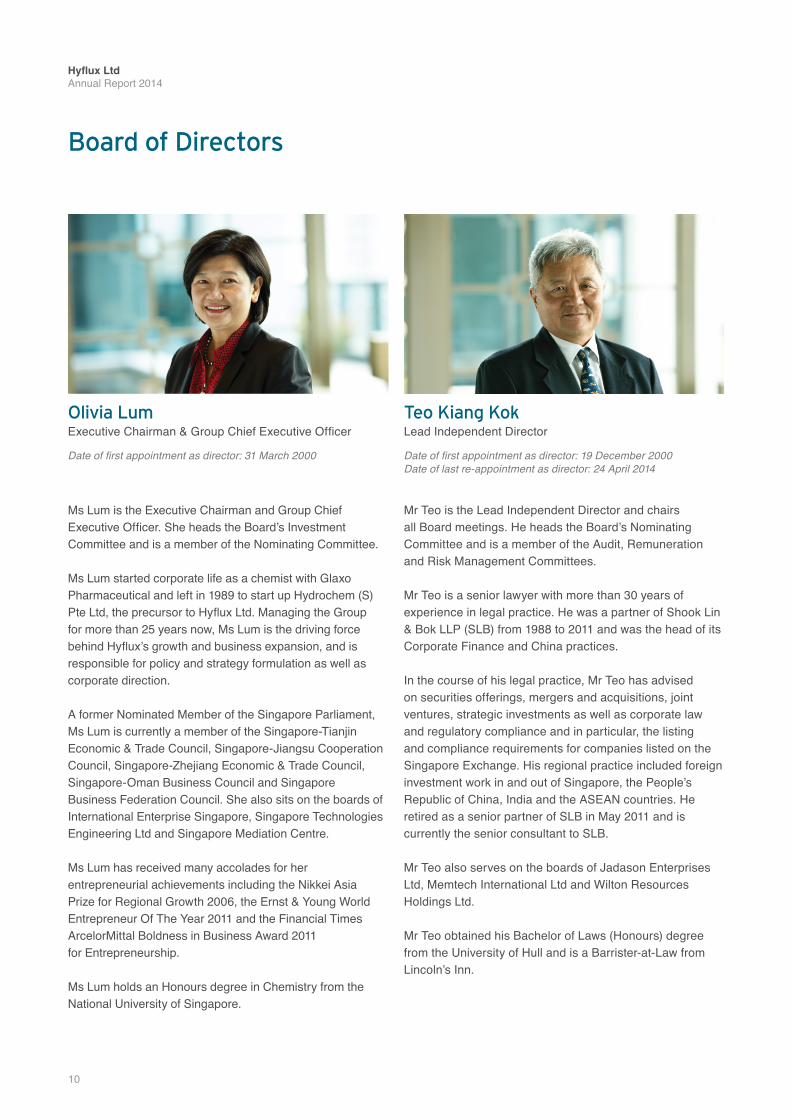
Ms Lum is the Executive Chairman and Group Chief Executive Officer. She heads the Board’s Investment Committee and is a member of the Nominating Committee.
Ms Lum started corporate life as a chemist with Glaxo Pharmaceutical and left in 1989 to start up Hydrochem (S) Pte Ltd, the precursor to Hyflux Ltd. Managing the Group for more than 25 years now, Ms Lum is the driving force behind Hyflux’s growth and business expansion, and is responsible for policy and strategy formulation as well as corporate direction.
A former Nominated Member of the Singapore Parliament, Ms Lum is currently a member of the Singapore-Tianjin Economic & Trade Council, Singapore-Jiangsu Cooperation Council, Singapore-Zhejiang Economic & Trade Council, Singapore-Oman Business Council and Singapore Business Federation Council. She also sits on the boards of International Enterprise Singapore, Singapore Technologies Engineering Ltd and Singapore Mediation Centre.
Ms Lum has received many accolades for her entrepreneurial achievements including the Nikkei Asia Prize for Regional Growth 2006, the Ernst & Young World Entrepreneur Of The Year 2011 and the Financial Times ArcelorMittal Boldness in Business Award 2011 for Entrepreneurship.
Ms Lum holds an Honours degree in Chemistry from the National University of Singapore.
Mr Teo is the Lead Independent Director and chairs all Board meetings. He heads the Board’s Nominating Committee and is a member of the Audit, Remuneration and Risk Management Committees.
Mr Teo is a senior lawyer with more than 30 years of experience in legal practice. He was a partner of Shook Lin & Bok LLP (SLB) from 1988 to 2011 and was the head of its Corporate Finance and China practices.
In the course of his legal practice, Mr Teo has advised on securities offerings, mergers and acquisitions, joint ventures, strategic investments as well as corporate law and regulatory compliance and in particular, the listing and compliance requirements for companies listed on the Singapore Exchange. His regional practice included foreign investment work in and out of Singapore, the People’s Republic of China, India and the ASEAN countries. He retired as a senior partner of SLB in May 2011 and is currently the senior consultant to SLB.
Mr Teo also serves on the boards of Jadason Enterprises Ltd, Memtech International Ltd and Wilton Resources Holdings Ltd.
Mr Teo obtained his Bachelor of Laws (Honours) degree from the University of Hull and is a Barrister-at-Law from Lincoln’s Inn.
Olivia LumExecutive Chairman & Group Chief Executive Officer
Date of first appointment as director: 31 March 2000
Teo Kiang KokLead Independent Director
Date of first appointment as director: 19 December 2000Date of last re-appointment as director: 24 April 2014
11
Sustainable Solutions For a Better Tomorrow
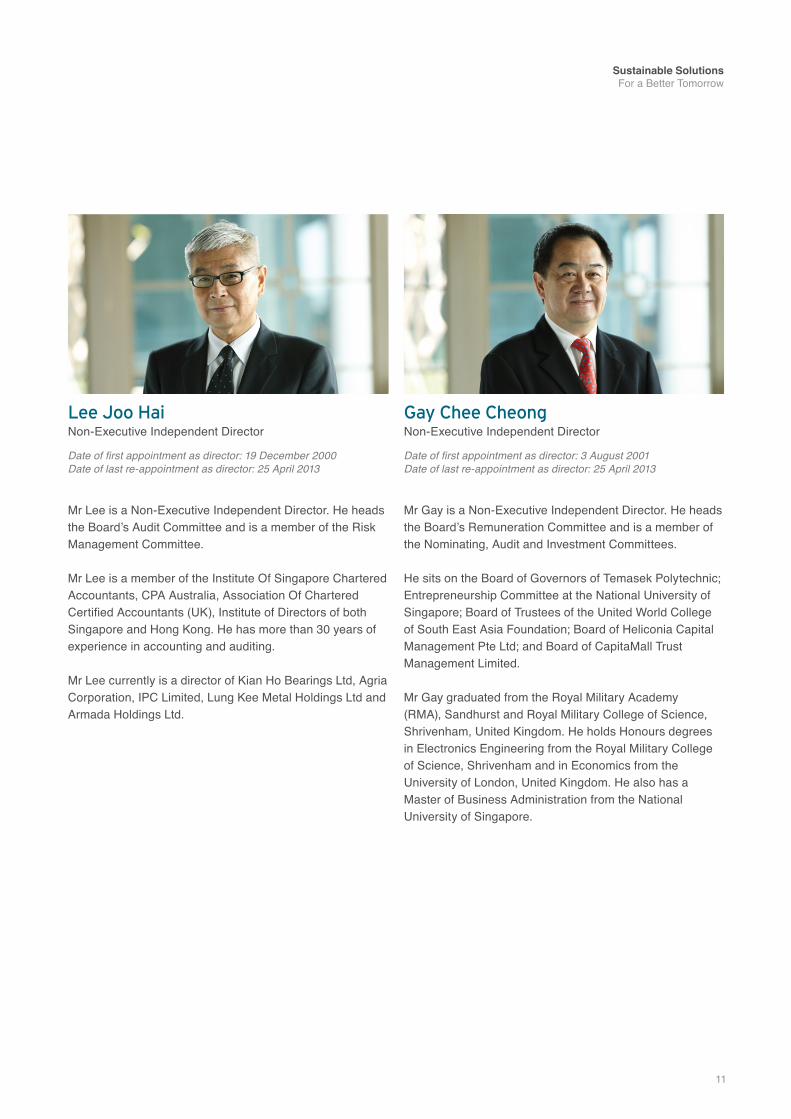
Mr Lee is a Non-Executive Independent Director. He heads the Board’s Audit Committee and is a member of the Risk Management Committee.
Mr Lee is a member of the Institute Of Singapore Chartered Accountants, CPA Australia, Association Of Chartered Certified Accountants (UK), Institute of Directors of both Singapore and Hong Kong. He has more than 30 years of experience in accounting and auditing.
Mr Lee currently is a director of Kian Ho Bearings Ltd, Agria Corporation, IPC Limited, Lung Kee Metal Holdings Ltd and Armada Holdings Ltd.
Mr Gay is a Non-Executive Independent Director. He heads the Board’s Remuneration Committee and is a member of the Nominating, Audit and Investment Committees.
He sits on the Board of Governors of Temasek Polytechnic; Entrepreneurship Committee at the National University of Singapore; Board of Trustees of the United World College of South East Asia Foundation; Board of Heliconia Capital Management Pte Ltd; and Board of CapitaMall Trust Management Limited.
Mr Gay graduated from the Royal Military Academy (RMA), Sandhurst and Royal Military College of Science, Shrivenham, United Kingdom. He holds Honours degrees in Electronics Engineering from the Royal Military College of Science, Shrivenham and in Economics from the University of London, United Kingdom. He also has a Master of Business Administration from the National University of Singapore.
Lee Joo HaiNon-Executive Independent Director
Date of first appointment as director: 19 December 2000Date of last re-appointment as director: 25 April 2013
Gay Chee CheongNon-Executive Independent Director
Date of first appointment as director: 3 August 2001Date of last re-appointment as director: 25 April 2013
12
Hyflux Ltd Annual Report 2014
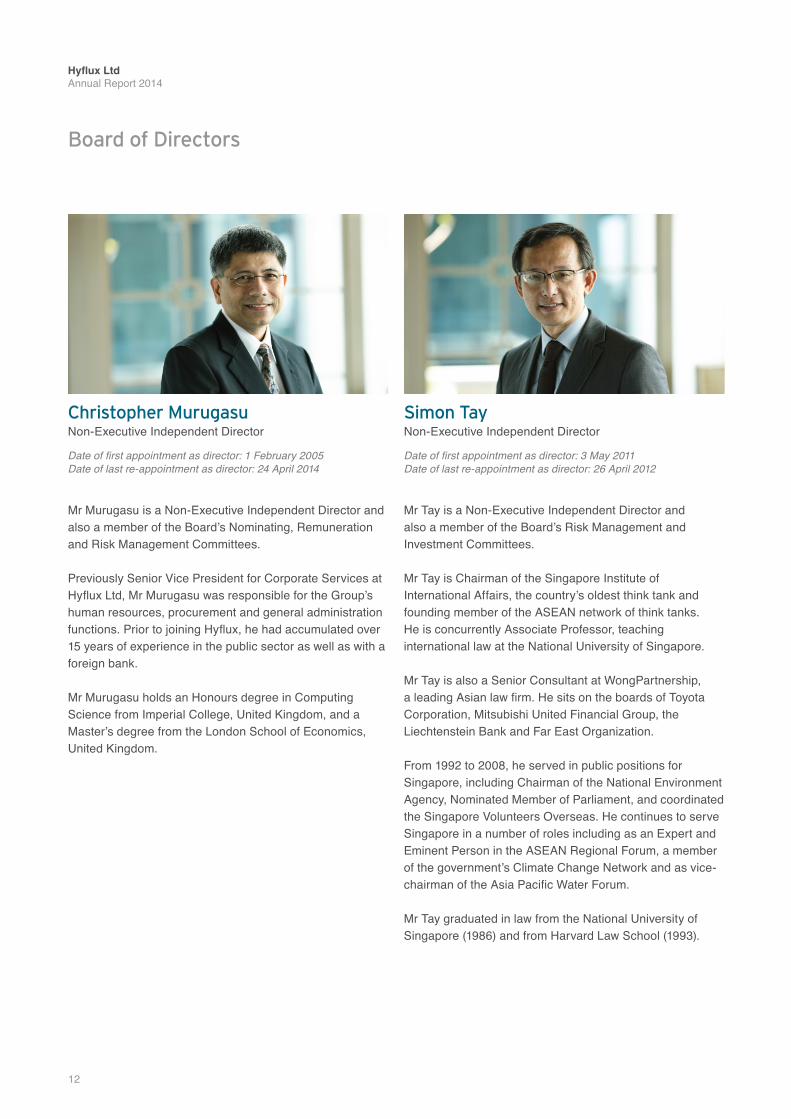
Mr Murugasu is a Non-Executive Independent Director and also a member of the Board’s Nominating, Remuneration and Risk Management Committees.
Previously Senior Vice President for Corporate Services at Hyflux Ltd, Mr Murugasu was responsible for the Group’s human resources, procurement and general administration functions. Prior to joining Hyflux, he had accumulated over 15 years of experience in the public sector as well as with a foreign bank.
Mr Murugasu holds an Honours degree in Computing Science from Imperial College, United Kingdom, and a Master’s degree from the London School of Economics, United Kingdom.
Mr Tay is a Non-Executive Independent Director and also a member of the Board’s Risk Management and Investment Committees.
Mr Tay is Chairman of the Singapore Institute of International Affairs, the country’s oldest think tank and founding member of the ASEAN network of think tanks. He is concurrently Associate Professor, teaching international law at the National University of Singapore.
Mr Tay is also a Senior Consultant at WongPartnership, a leading Asian law firm. He sits on the boards of Toyota Corporation, Mitsubishi United Financial Group, the Liechtenstein Bank and Far East Organization.
From 1992 to 2008, he served in public positions for Singapore, including Chairman of the National Environment Agency, Nominated Member of Parliament, and coordinated the Singapore Volunteers Overseas. He continues to serve Singapore in a number of roles including as an Expert and Eminent Person in the ASEAN Regional Forum, a member of the government’s Climate Change Network and as vice-chairman of the Asia Pacific Water Forum.
Mr Tay graduated in law from the National University of Singapore (1986) and from Harvard Law School (1993).
Christopher MurugasuNon-Executive Independent Director
Date of first appointment as director: 1 February 2005Date of last re-appointment as director: 24 April 2014
Simon TayNon-Executive Independent Director
Date of first appointment as director: 3 May 2011Date of last re-appointment as director: 26 April 2012
Board of Directors
13
Sustainable Solutions For a Better Tomorrow
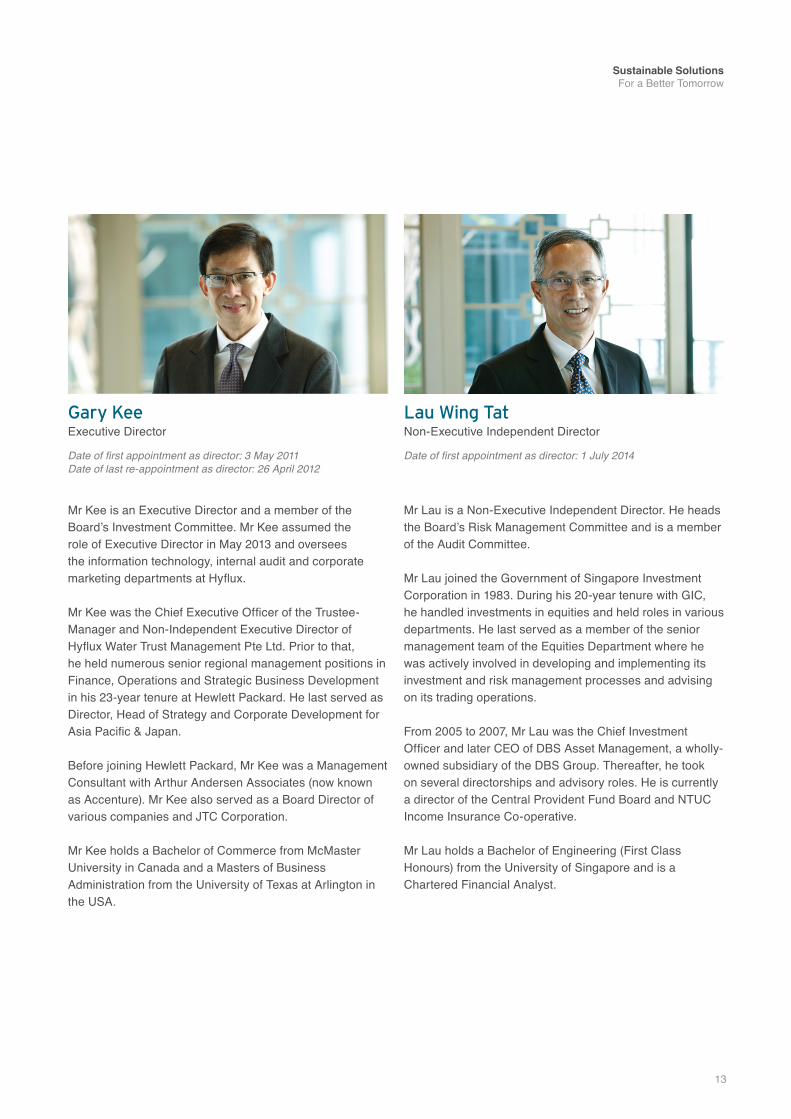
Mr Kee is an Executive Director and a member of the Board’s Investment Committee. Mr Kee assumed the role of Executive Director in May 2013 and oversees the information technology, internal audit and corporate marketing departments at Hyflux.
Mr Kee was the Chief Executive Officer of the Trustee-Manager and Non-Independent Executive Director of Hyflux Water Trust Management Pte Ltd. Prior to that, he held numerous senior regional management positions in Finance, Operations and Strategic Business Development in his 23-year tenure at Hewlett Packard. He last served as Director, Head of Strategy and Corporate Development for Asia Pacific & Japan.
Before joining Hewlett Packard, Mr Kee was a Management Consultant with Arthur Andersen Associates (now known as Accenture). Mr Kee also served as a Board Director of various companies and JTC Corporation.
Mr Kee holds a Bachelor of Commerce from McMaster University in Canada and a Masters of Business Administration from the University of Texas at Arlington in the USA.
Mr Lau is a Non-Executive Independent Director. He heads the Board’s Risk Management Committee and is a member of the Audit Committee.
Mr Lau joined the Government of Singapore Investment Corporation in 1983. During his 20-year tenure with GIC, he handled investments in equities and held roles in various departments. He last served as a member of the senior management team of the Equities Department where he was actively involved in developing and implementing its investment and risk management processes and advising on its trading operations.
From 2005 to 2007, Mr Lau was the Chief Investment Officer and later CEO of DBS Asset Management, a wholly-owned subsidiary of the DBS Group. Thereafter, he took on several directorships and advisory roles. He is currently a director of the Central Provident Fund Board and NTUC Income Insurance Co-operative.
Mr Lau holds a Bachelor of Engineering (First Class Honours) from the University of Singapore and is a Chartered Financial Analyst.
Gary KeeExecutive Director
Date of first appointment as director: 3 May 2011Date of last re-appointment as director: 26 April 2012
Lau Wing TatNon-Executive Independent Director
Date of first appointment as director: 1 July 2014
14
Hyflux Ltd Annual Report 2014
Key Management Committee
Management Committee
Olivia Lum Executive Chairman & Group Chief Executive Officer
Wong Lup Wai Group EVP & Group Chief Operating Officer
Gary Kee Executive Director
Winnifred Heap Group Senior EVP
Lim Suat Wah Group EVP & Group Chief Financial Officer
Hyflux’s Key Management Committee is responsible for driving the Group’s strategic vision, formulating business plans to achieve business goals, creating the conditions for successful day-to-day operation and delivering long-term value for all stakeholders.
The Management Committee implements the Group’s vision and executes global operational plans.
Peter Wu Group Senior MD, Business Development
Kum Mun Lock Group Senior MD, Business Development
Oon Chong Howe Group Senior MD, Business Development
Zhao Qing Group Senior MD & Chief Executive Officer, China
Zhao Ping Group Senior MD & Chief Executive Officer, Galaxy NewSpring
Cheong Aik Hock Group Senior VP, Legal
Adrian Chong Group Senior VP, Commercial Contracts and Purchasing
Nah Tien Liang Group Senior VP, Investment
Jeremy Tan Group Senior VP, Human Resource
15
Sustainable Solutions For a Better Tomorrow
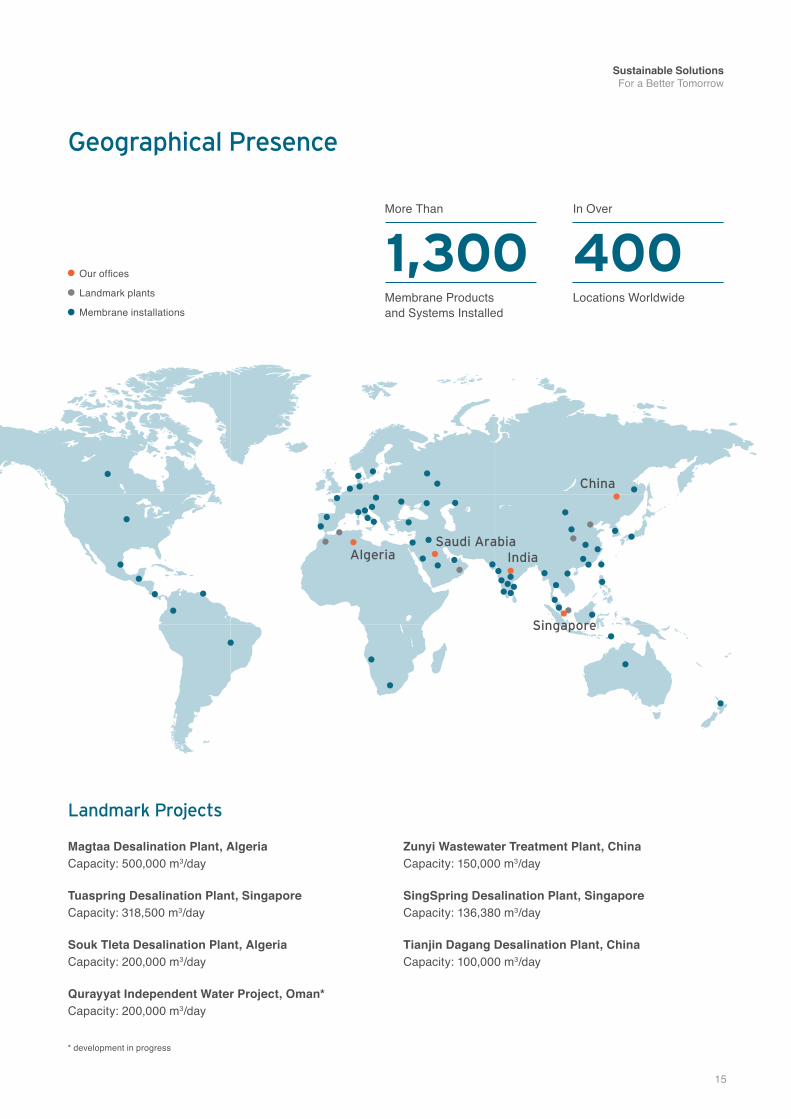
Geographical Presence
Algeria IndiaSaudi Arabia
China
Our offices
Landmark plants
Membrane installations
4001,300More Than In Over
Membrane Products and Systems Installed
Locations Worldwide
Singapore
Landmark Projects
Magtaa Desalination Plant, Algeria Capacity: 500,000 m3/day
Tuaspring Desalination Plant, Singapore Capacity: 318,500 m3/day
Souk Tleta Desalination Plant, Algeria Capacity: 200,000 m3/day
Qurayyat Independent Water Project, Oman* Capacity: 200,000 m3/day
Zunyi Wastewater Treatment Plant, China Capacity: 150,000 m3/day
SingSpring Desalination Plant, Singapore Capacity: 136,380 m3/day
Tianjin Dagang Desalination Plant, China Capacity: 100,000 m3/day
* development in progress
16
Hyflux Ltd Annual Report 2014
Financial Review
For year ended 31 December
(S$ million) 2013 2014 % change
Revenue 535.8 321.4 (40)
Profit before tax 51.6 53.1 3
Profit attributable to shareholders 44.0 57.5 31
Earnings per share (cents) 2.42 1.66 (31)
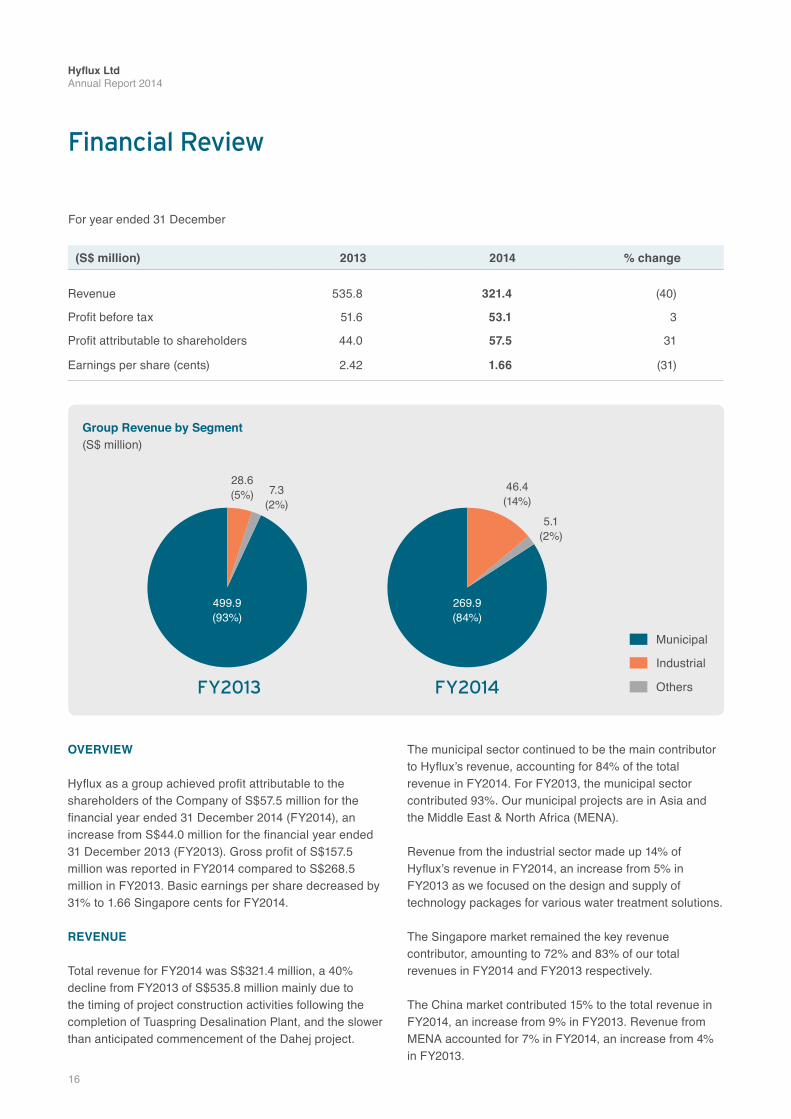
OVERVIEW Hyflux as a group achieved profit attributable to the shareholders of the Company of S$57.5 million for the financial year ended 31 December 2014 (FY2014), an increase from S$44.0 million for the financial year ended 31 December 2013 (FY2013). Gross profit of S$157.5 million was reported in FY2014 compared to S$268.5 million in FY2013. Basic earnings per share decreased by 31% to 1.66 Singapore cents for FY2014.
REVENUE
Total revenue for FY2014 was S$321.4 million, a 40% decline from FY2013 of S$535.8 million mainly due to the timing of project construction activities following the completion of Tuaspring Desalination Plant, and the slower than anticipated commencement of the Dahej project.
The municipal sector continued to be the main contributor to Hyflux’s revenue, accounting for 84% of the total revenue in FY2014. For FY2013, the municipal sector contributed 93%. Our municipal projects are in Asia and the Middle East & North Africa (MENA).
Revenue from the industrial sector made up 14% of Hyflux’s revenue in FY2014, an increase from 5% in FY2013 as we focused on the design and supply of technology packages for various water treatment solutions.
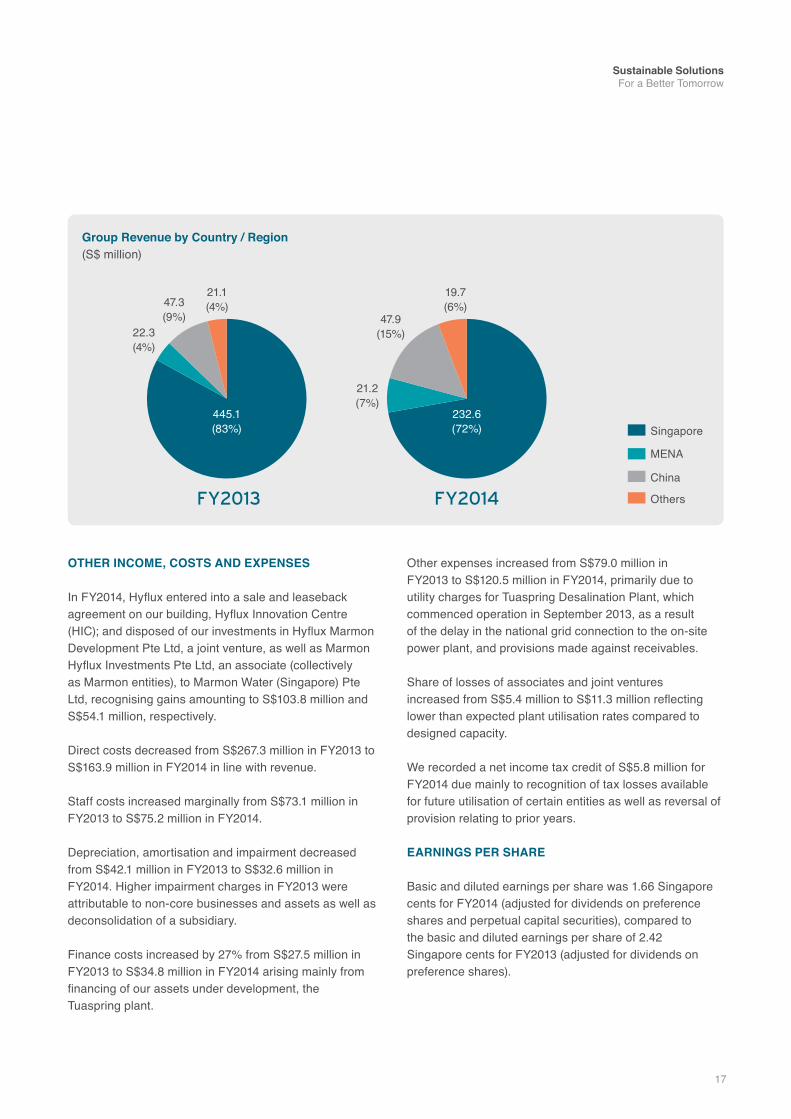
The Singapore market remained the key revenue contributor, amounting to 72% and 83% of our total revenues in FY2014 and FY2013 respectively.
The China market contributed 15% to the total revenue in FY2014, an increase from 9% in FY2013. Revenue from MENA accounted for 7% in FY2014, an increase from 4% in FY2013.
Group Revenue by Segment(S$ million)
Municipal
Industrial
Others
28.6(5%)
46.4(14%)
7.3(2%)
5.1(2%)
FY2013 FY2014
499.9(93%)
269.9(84%)
17
Sustainable Solutions For a Better Tomorrow
OTHER INCOME, COSTS AND EXPENSES
In FY2014, Hyflux entered into a sale and leaseback agreement on our building, Hyflux Innovation Centre (HIC); and disposed of our investments in Hyflux Marmon Development Pte Ltd, a joint venture, as well as Marmon Hyflux Investments Pte Ltd, an associate (collectively as Marmon entities), to Marmon Water (Singapore) Pte Ltd, recognising gains amounting to S$103.8 million and S$54.1 million, respectively.
Direct costs decreased from S$267.3 million in FY2013 to S$163.9 million in FY2014 in line with revenue.
Staff costs increased marginally from S$73.1 million in FY2013 to S$75.2 million in FY2014.
Depreciation, amortisation and impairment decreased from S$42.1 million in FY2013 to S$32.6 million in FY2014. Higher impairment charges in FY2013 were attributable to non-core businesses and assets as well as deconsolidation of a subsidiary.
Finance costs increased by 27% from S$27.5 million in FY2013 to S$34.8 million in FY2014 arising mainly from financing of our assets under development, the Tuaspring plant.
Other expenses increased from S$79.0 million in FY2013 to S$120.5 million in FY2014, primarily due to utility charges for Tuaspring Desalination Plant, which commenced operation in September 2013, as a result of the delay in the national grid connection to the on-site power plant, and provisions made against receivables.
Share of losses of associates and joint ventures increased from S$5.4 million to S$11.3 million reflecting lower than expected plant utilisation rates compared to designed capacity.
We recorded a net income tax credit of S$5.8 million for FY2014 due mainly to recognition of tax losses available for future utilisation of certain entities as well as reversal of provision relating to prior years.
EARNINGS PER SHARE
Basic and diluted earnings per share was 1.66 Singapore cents for FY2014 (adjusted for dividends on preference shares and perpetual capital securities), compared to the basic and diluted earnings per share of 2.42 Singapore cents for FY2013 (adjusted for dividends on preference shares).
Group Revenue by Country / Region(S$ million)
22.3(4%)
21.2(7%)
47.3(9%) 47.9
(15%)
21.1(4%)
19.7(6%)
FY2013 FY2014
445.1(83%)
232.6(72%) Singapore
MENA
China
Others
18
Hyflux Ltd Annual Report 2014
Financial Review
BALANCE SHEET REVIEW
Shareholders’ equity increased from S$882.6 million as at 31 December 2013 to S$1,337.2 million as at 31 December 2014. The perpetual capital securities issuance in January and July 2014 totalling S$475.0 million; and foreign operations translation gains arising from the strengthening of the Chinese Renminbi and US dollar against the Singapore dollar contributed to the overall increase in equity base. The increase was, however, lowered by the marked-to-market effect of interest rate swaps relating to Hyflux’s floating rate loan, dividends for the year as well as purchase of treasury shares. We purchased 10.4 million treasury shares for a total cost of S$10.5 million during the year.
Current assets increased from S$620.9 million as at 31 December 2013 to S$838.8 million as at 31 December 2014 mainly due to the net proceeds from the issuance of perpetual capital securities and divestments during the year. As at 31 December 2014, a leasehold property with carrying value of S$4.0 million was reclassified to an asset held for sale pursuant to sale and purchase agreements entered into by Hyflux with a third party. The sale was completed subsequent to year-end upon satisfaction of conditions precedent and legal title transfers.
Non-current assets increased from S$1,775.6 million as at 31 December 2013 to S$1,902.9 million as at 31 December 2014, mainly from our continuing investments in service concession projects and deferred tax assets recognised, offset by the disposal of HIC.
Current liabilities rose from S$359.9 million as at 31 December 2013 to S$390.6 million as at 31 December 2014. Included in the current liabilities was a fixed-rate unsecured notes issued under Hyflux’s Multicurrency Debt Issuance Programme amounting to S$75.0 million that will become payable in March 2015. The amount was reclassified from long-term borrowings as at year-end.
Non-current liabilities recorded a corresponding decrease from S$1,150.4 million as at 31 December 2013 to S$1,009.1 million as at 31 December 2014, primarily due to the reclassification mentioned above as well as repayment of borrowings during the year. As at 31 December 2014, fixed-rate unsecured notes amounting to S$419.1 million will mature between 2016 and 2019.
CASHFLOW AND LIQUIDITY
Our overall cash position increased from S$243.9 million as at 31 December 2013 to S$444.4 million as at 31 December 2014.
In FY2014, net cash of S$226.1 million was used in our operating activities, mainly towards investments in projects with service concession arrangements. Excluding cash used in these projects, net cash outflows from operating activities were S$15.0 million.
Cash generated from investing activities of S$206.3 million in FY2014 was largely contributed by net proceeds from the sale and leaseback of HIC as well as disposals of investments in the Marmon entities. This was offset by loans to a joint venture, acquisition of property, plant and equipment, and additional capital injection into Tahlyat Myah Magtaa SPA (TMM), Hyflux’s 47% associate.
The issuance of S$475.0 million of perpetual capital securities in aggregate, in January and July 2014, contributed to the net financing inflows in FY2014. The inflow was offset by repayment of borrowings including one of our fixed-rate unsecured notes of S$60.0 million; payments of dividends on ordinary shares, preference shares and perpetual capital securities; and interest costs. Proceeds from the issuance of perpetual capital securities are used for continued strategic investments by the Group.
19
Sustainable Solutions For a Better Tomorrow
Operating Review
ENGINEERING, PROCUREMENT AND CONSTRUCTION (EPC)
In 2014, Hyflux started to see signs of recovery in the global water industry with new large-scale water projects coming into the market after several challenging years.
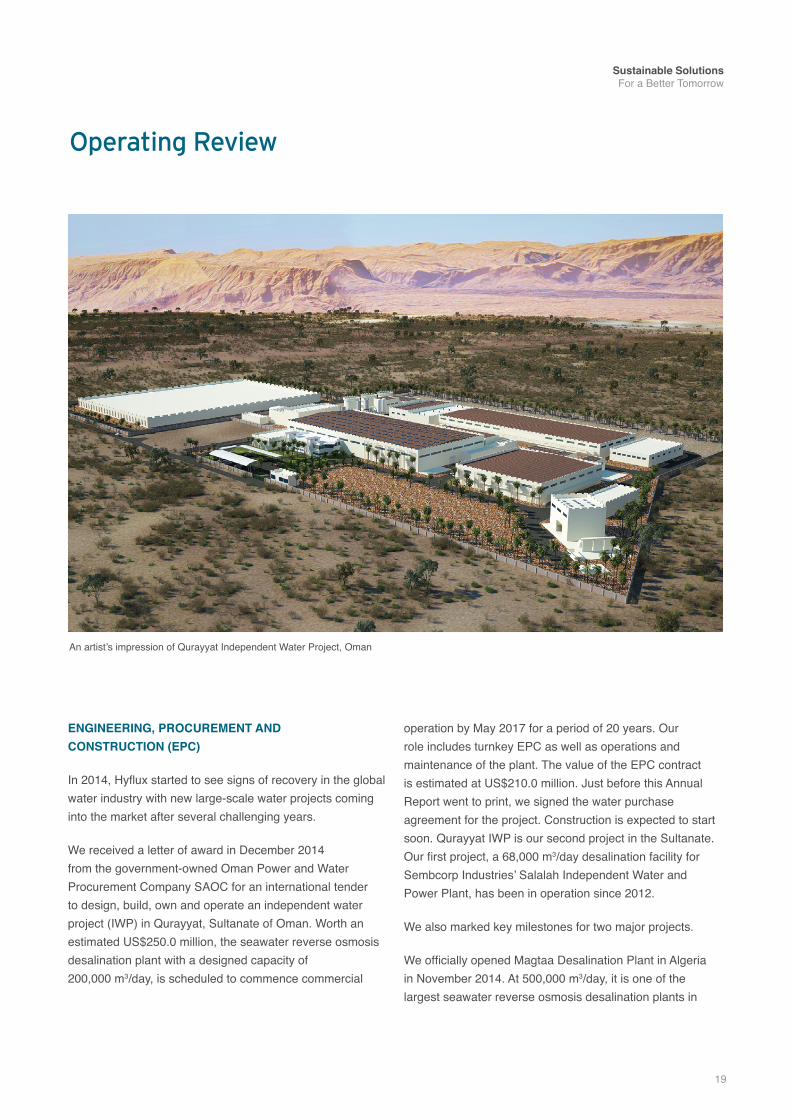
We received a letter of award in December 2014 from the government-owned Oman Power and Water Procurement Company SAOC for an international tender to design, build, own and operate an independent water project (IWP) in Qurayyat, Sultanate of Oman. Worth an estimated US$250.0 million, the seawater reverse osmosis desalination plant with a designed capacity of 200,000 m3/day, is scheduled to commence commercial
operation by May 2017 for a period of 20 years. Our role includes turnkey EPC as well as operations and maintenance of the plant. The value of the EPC contract is estimated at US$210.0 million. Just before this Annual Report went to print, we signed the water purchase agreement for the project. Construction is expected to start soon. Qurayyat IWP is our second project in the Sultanate. Our first project, a 68,000 m3/day desalination facility for Sembcorp Industries’ Salalah Independent Water and Power Plant, has been in operation since 2012.
We also marked key milestones for two major projects.
We officially opened Magtaa Desalination Plant in Algeria in November 2014. At 500,000 m3/day, it is one of the largest seawater reverse osmosis desalination plants in
An artist’s impression of Qurayyat Independent Water Project, Oman
20
Hyflux Ltd Annual Report 2014
Tuaspring Power Plant co-located with Tuaspring Desalination Plant, Singapore
Operating Review
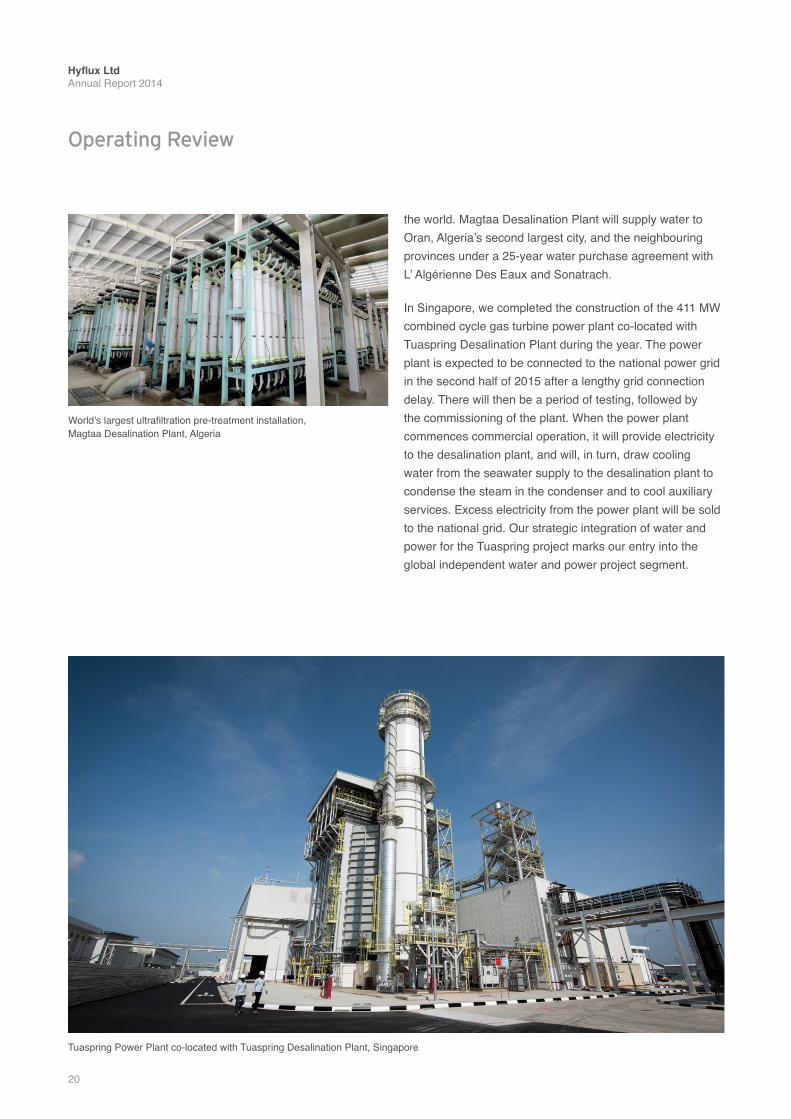
the world. Magtaa Desalination Plant will supply water to Oran, Algeria’s second largest city, and the neighbouring provinces under a 25-year water purchase agreement with L’ Algérienne Des Eaux and Sonatrach.
In Singapore, we completed the construction of the 411 MW combined cycle gas turbine power plant co-located with Tuaspring Desalination Plant during the year. The power plant is expected to be connected to the national power grid in the second half of 2015 after a lengthy grid connection delay. There will then be a period of testing, followed by the commissioning of the plant. When the power plant commences commercial operation, it will provide electricity to the desalination plant, and will, in turn, draw cooling water from the seawater supply to the desalination plant to condense the steam in the condenser and to cool auxiliary services. Excess electricity from the power plant will be sold to the national grid. Our strategic integration of water and power for the Tuaspring project marks our entry into the global independent water and power project segment.
World’s largest ultrafiltration pre-treatment installation, Magtaa Desalination Plant, Algeria
21
Sustainable Solutions For a Better Tomorrow
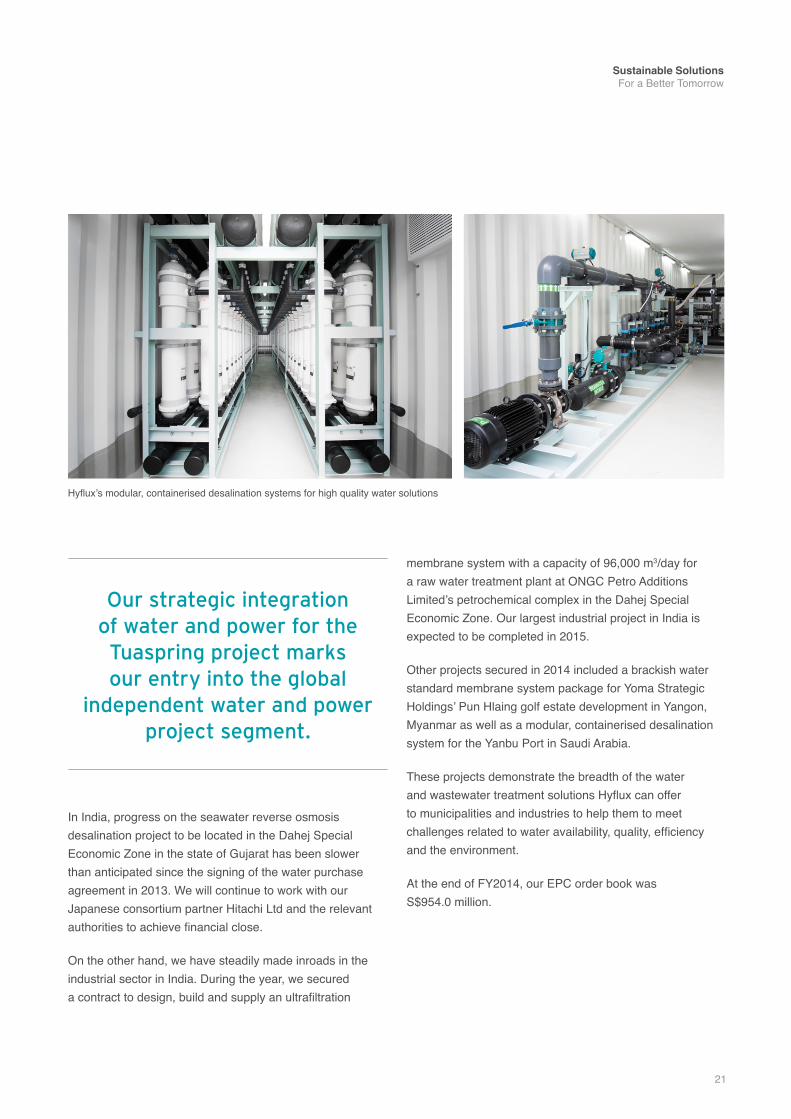
In India, progress on the seawater reverse osmosis desalination project to be located in the Dahej Special Economic Zone in the state of Gujarat has been slower than anticipated since the signing of the water purchase agreement in 2013. We will continue to work with our Japanese consortium partner Hitachi Ltd and the relevant authorities to achieve financial close.
On the other hand, we have steadily made inroads in the industrial sector in India. During the year, we secured a contract to design, build and supply an ultrafiltration
membrane system with a capacity of 96,000 m3/day for a raw water treatment plant at ONGC Petro Additions Limited’s petrochemical complex in the Dahej Special Economic Zone. Our largest industrial project in India is expected to be completed in 2015.
Other projects secured in 2014 included a brackish water standard membrane system package for Yoma Strategic Holdings’ Pun Hlaing golf estate development in Yangon, Myanmar as well as a modular, containerised desalination system for the Yanbu Port in Saudi Arabia.
These projects demonstrate the breadth of the water and wastewater treatment solutions Hyflux can offer to municipalities and industries to help them to meet challenges related to water availability, quality, efficiency and the environment.
At the end of FY2014, our EPC order book was S$954.0 million.
Our strategic integration of water and power for the Tuaspring project marks our entry into the global
independent water and power project segment.
Hyflux’s modular, containerised desalination systems for high quality water solutions
22
Hyflux Ltd Annual Report 2014
Operating Review
OPERATIONS & MAINTENANCE (O&M)
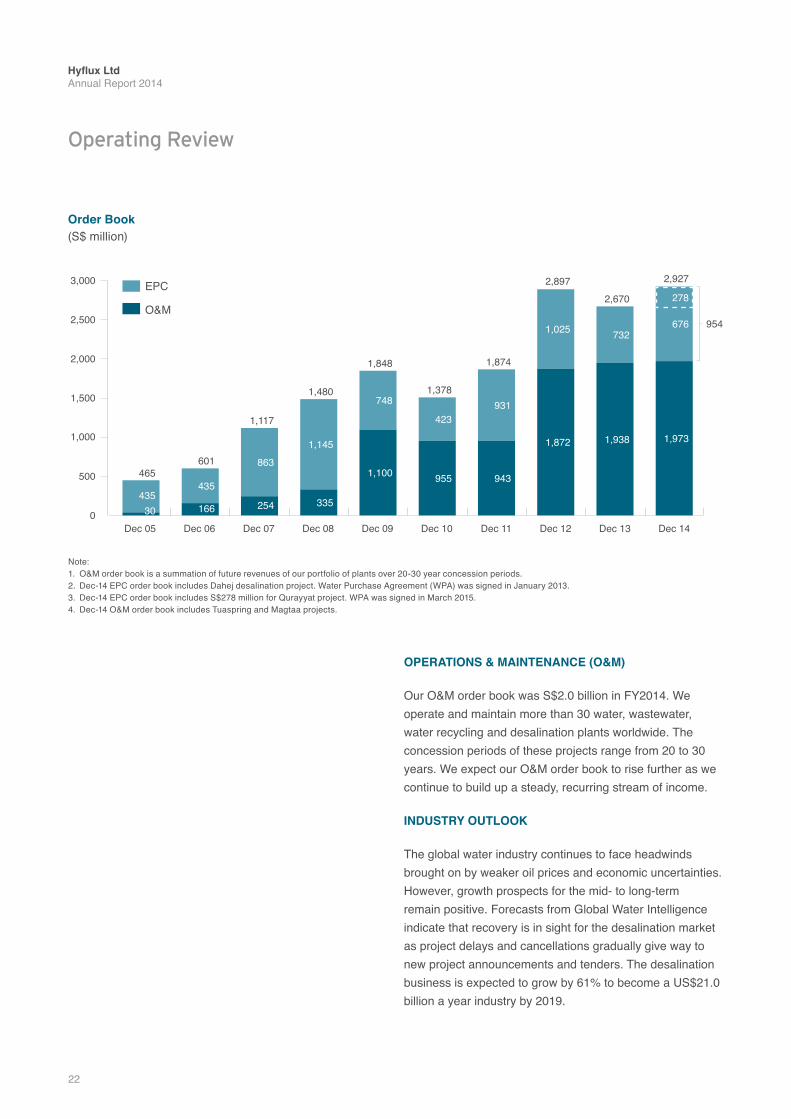
Our O&M order book was S$2.0 billion in FY2014. We operate and maintain more than 30 water, wastewater, water recycling and desalination plants worldwide. The concession periods of these projects range from 20 to 30 years. We expect our O&M order book to rise further as we continue to build up a steady, recurring stream of income.
INDUSTRY OUTLOOK
The global water industry continues to face headwinds brought on by weaker oil prices and economic uncertainties. However, growth prospects for the mid- to long-term remain positive. Forecasts from Global Water Intelligence indicate that recovery is in sight for the desalination market as project delays and cancellations gradually give way to new project announcements and tenders. The desalination business is expected to grow by 61% to become a US$21.0 billion a year industry by 2019.
Note:1. O&M order book is a summation of future revenues of our portfolio of plants over 20-30 year concession periods.2. Dec-14 EPC order book includes Dahej desalination project. Water Purchase Agreement (WPA) was signed in January 2013.3. Dec-14 EPC order book includes S$278 million for Qurayyat project. WPA was signed in March 2015. 4. Dec-14 O&M order book includes Tuaspring and Magtaa projects.
Order Book(S$ million)
Dec 05 Dec 06 Dec 07 Dec 08 Dec 09 Dec 10 Dec 11 Dec 12 Dec 13 Dec 14
465601
1,117
1,480
1,848
1,378
1,874
2,8972,670
2,927
954
0
500
1,000
1,500
2,000
3,000
2,500
435435
863
1,145
748
423931
1,025 732676
278
30 166 254 335
1,100 955 943
1,872 1,938 1,973
EPC
O&M
23
Sustainable Solutions For a Better Tomorrow
Climate change as well as population and economic growth are putting unprecedented stress on global water resources. Many people do not have access to safe drinking water because water resources are limited or polluted by domestic and industrial wastewater. By 2035, the world’s population is projected to increase by 1.6 billion to reach 8.7 billion while urban areas will more than double in size. Much of this increase will be concentrated in Asia and Africa. Over the same period, GDP is expected to more than double.
With rapid urbanisation and the growth of megacities, the pressure on the environment, water and energy resources, and sanitation will be tremendous. New opportunities will become available as cities increasingly recognise the need to embrace a sustainable, integrated approach to urban development and resource management. Hyflux’s approach in providing integrated water and power solutions can help cities draw on the synergies between water, energy and waste so that resources and land use can be optimised.
We strive for continuous innovation in design, techniques and processes as well as invest in the development of new products and technologies to deliver better performance efficiency and reliability, and to anticipate tomorrow’s challenges. In June 2014, we launched the Floating Desalination Production Vessel at the Singapore International Water Week. The vessel is equipped with a comprehensive desalination facility on board that draws on
our expertise in design, engineering and installation. For coastal regions where land is limited or where short-term water solutions are required, mobile floating desalination plants offer a quick and highly flexible alternative to land-based desalination plants.
We will focus on growing our presence in Africa and Latin America by setting up new offices in Nigeria and Mexico. This will place us closer to selective markets in these regions where we are pursuing municipal and industrial projects.
We strive for continuous innovation in design, techniques and processes as well as invest in the development of new products and technologies to deliver better
performance efficiency and reliability, and to anticipate tomorrow’s challenges.
24
Hyflux Ltd Annual Report 2014
Corporate Governance
INTRODUCTION
Hyflux Ltd (the “Company”) continues to place great importance on the governance of the Company and its subsidiaries (together, the “Group”), which it believes is vital to its well being and success. The Company is committed to maintaining high standards of corporate governance and processes that will enhance the Group’s effectiveness, ensure the appropriate degree of accountability and transparency and an increase in long term value and return to shareholders.
The Group subscribes to the Singapore Code of Corporate Governance issued by the Monetary Authority of Singapore (“Code”) and believes that this forms a sound platform for supporting good corporate governance practices. This corporate governance statement (“Statement”) outlines the main corporate governance practices of the Group with specific reference made to the principles and guidelines of the Code, forming part of the Continuing Obligations set out in the Listing Manual of Singapore Exchange Securities Trading Limited (“SGX-ST”).
The Company has complied substantially with the requirements of the Code and provided an explanation for any deviation from the Code, where applicable. The Group will continue to review and refine its practices in light of best practices in the market, consistent with the needs and the circumstances of the Group.
In developing the appropriate corporate governance practices, the Group takes into account all applicable legislations and recognised standards. The Group is committed to instilling and maintaining good corporate governance at all times.
A. BOARD MATTERS
Principle 1: The Board’s Conduct of Affairs
The primary role of the Company’s board of directors (“Board”) is to protect and enhance long-term shareholders’ value and to ensure that the Group is run in accordance with best international management and corporate governance practices, appropriate to the needs and development of the Group.
The Board is responsible for general oversight of the Group’s activities and performance and for setting the Group’s overall strategic direction. It provides leadership and guidance on corporate strategies, business directions, risk policies and implementation of corporate objectives, thereby taking responsibility for the overall corporate governance of the Group.
In delegating responsibility for the day-to-day operation and leadership of the Group to the Executive Chairman and Chief Executive Officer and the management team, the Board has processes and systems in place to ensure that significant issues, risks and major strategic decisions are monitored and considered at Board level.
To assist in the execution of its responsibilities, the Board has established several Board Committees, namely, Audit Committee, Nominating Committee, Remuneration Committee, Risk Management Committee and Investment Committee. These Board Committees function within clearly defined terms of reference, which are reviewed on a regular basis.
Matters which are specifically reserved to the full Board for decision are those involving material acquisitions, disposal of assets, corporate or financial restructuring, share issuances, dividends and other returns to shareholders, conflict of interest for substantial shareholder or Director, as well as interested person transactions.
The meeting schedules of all the Board and Board Committees for the calendar year are given to all Directors well in advance. The Board may convene additional meetings to address any specific significant matters that may arise from time to time.
25
Sustainable Solutions For a Better Tomorrow
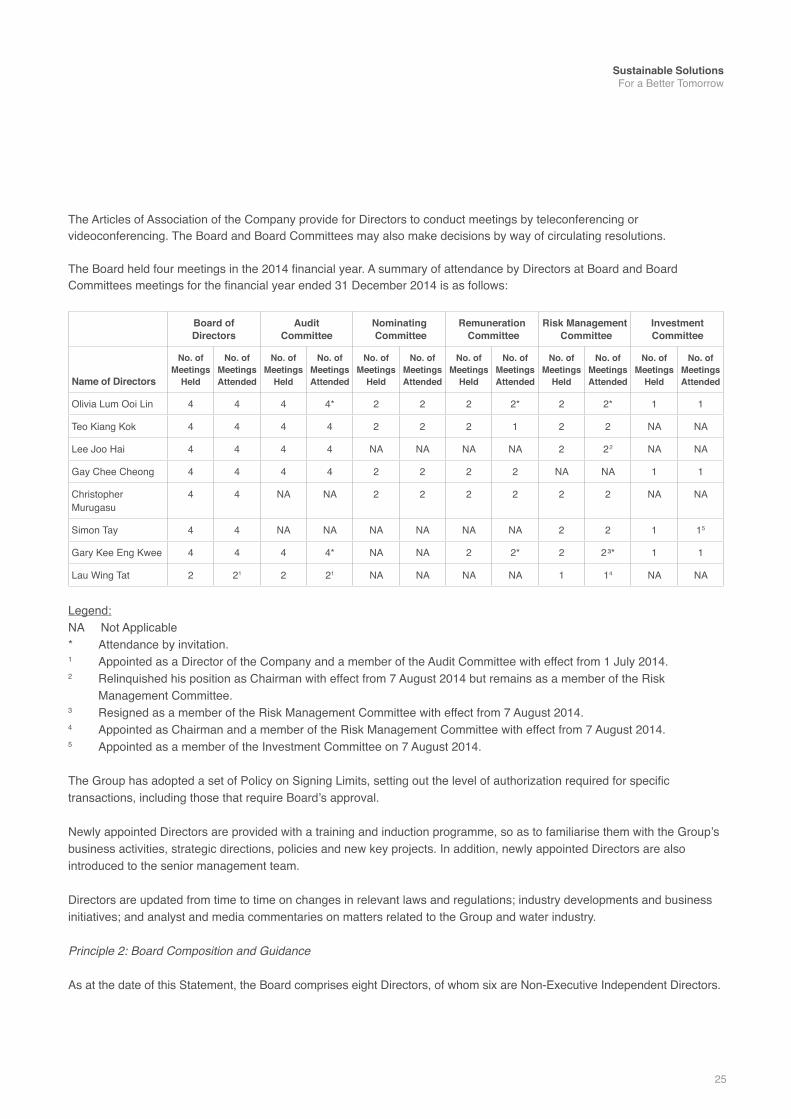
The Articles of Association of the Company provide for Directors to conduct meetings by teleconferencing or videoconferencing. The Board and Board Committees may also make decisions by way of circulating resolutions.
The Board held four meetings in the 2014 financial year. A summary of attendance by Directors at Board and Board Committees meetings for the financial year ended 31 December 2014 is as follows:
Board of Directors
Audit Committee
Nominating Committee
Remuneration Committee
Risk Management Committee
Investment Committee
Name of Directors
No. of Meetings
Held
No. of Meetings Attended
No. of Meetings
Held
No. of Meetings Attended
No. of Meetings
Held
No. of Meetings Attended
No. of Meetings
Held
No. of Meetings Attended
No. of Meetings
Held
No. of Meetings Attended
No. of Meetings
Held
No. of Meetings Attended
Olivia Lum Ooi Lin 4 4 4 4* 2 2 2 2* 2 2* 1 1
Teo Kiang Kok 4 4 4 4 2 2 2 1 2 2 NA NA
Lee Joo Hai 4 4 4 4 NA NA NA NA 2 22 NA NA
Gay Chee Cheong 4 4 4 4 2 2 2 2 NA NA 1 1
ChristopherMurugasu
4 4 NA NA 2 2 2 2 2 2 NA NA
Simon Tay 4 4 NA NA NA NA NA NA 2 2 1 15
Gary Kee Eng Kwee 4 4 4 4* NA NA 2 2* 2 2 ³* 1 1
Lau Wing Tat 2 21 2 21 NA NA NA NA 1 14 NA NA
Legend:NA Not Applicable* Attendance by invitation.1 Appointed as a Director of the Company and a member of the Audit Committee with effect from 1 July 2014.2 Relinquished his position as Chairman with effect from 7 August 2014 but remains as a member of the Risk Management Committee.3 Resigned as a member of the Risk Management Committee with effect from 7 August 2014.4 Appointed as Chairman and a member of the Risk Management Committee with effect from 7 August 2014.5 Appointed as a member of the Investment Committee on 7 August 2014.
The Group has adopted a set of Policy on Signing Limits, setting out the level of authorization required for specific transactions, including those that require Board’s approval.
Newly appointed Directors are provided with a training and induction programme, so as to familiarise them with the Group’s business activities, strategic directions, policies and new key projects. In addition, newly appointed Directors are also introduced to the senior management team.
Directors are updated from time to time on changes in relevant laws and regulations; industry developments and business initiatives; and analyst and media commentaries on matters related to the Group and water industry.
Principle 2: Board Composition and Guidance
As at the date of this Statement, the Board comprises eight Directors, of whom six are Non-Executive Independent Directors.
26
Hyflux Ltd Annual Report 2014
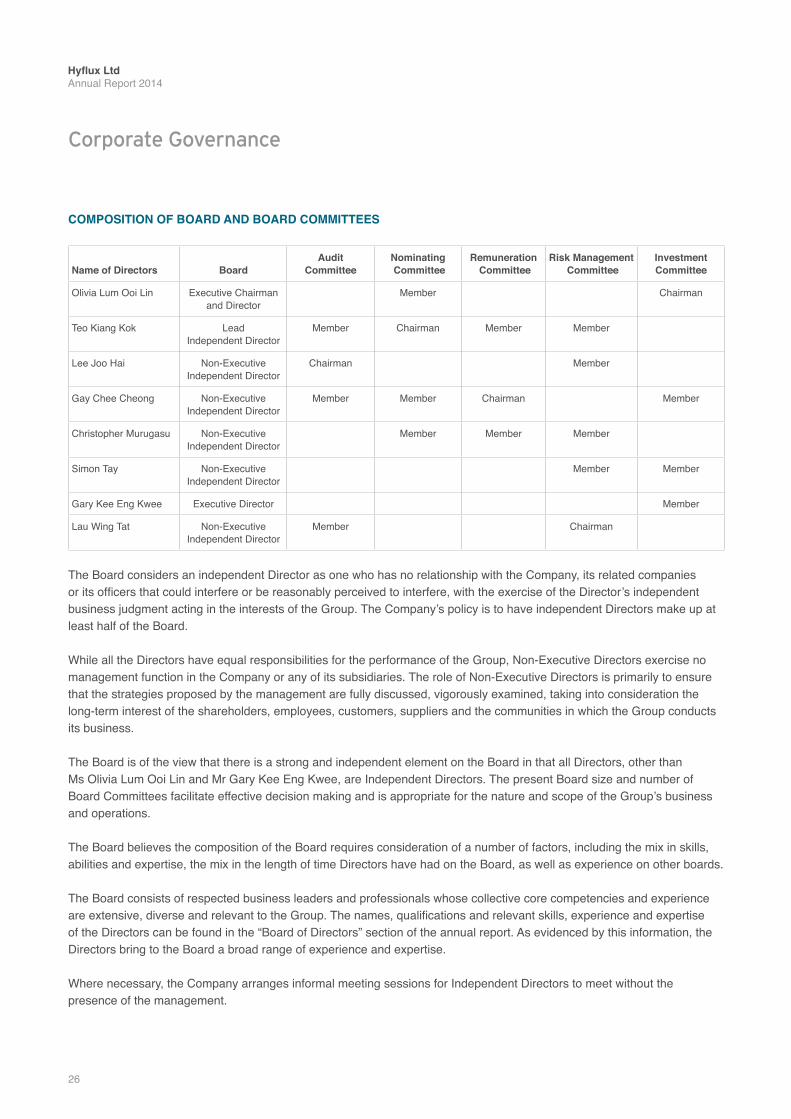
COMPOSITION OF BOARD AND BOARD COMMITTEES
Name of Directors BoardAudit
CommitteeNominating Committee
Remuneration Committee
Risk Management Committee
Investment Committee
Olivia Lum Ooi Lin Executive Chairman and Director
Member Chairman
Teo Kiang Kok LeadIndependent Director
Member Chairman Member Member
Lee Joo Hai Non-ExecutiveIndependent Director
Chairman Member
Gay Chee Cheong Non-ExecutiveIndependent Director
Member Member Chairman Member
Christopher Murugasu Non-ExecutiveIndependent Director
Member Member Member
Simon Tay Non-ExecutiveIndependent Director
Member Member
Gary Kee Eng Kwee Executive Director Member
Lau Wing Tat Non-ExecutiveIndependent Director
Member Chairman
The Board considers an independent Director as one who has no relationship with the Company, its related companies or its officers that could interfere or be reasonably perceived to interfere, with the exercise of the Director’s independent business judgment acting in the interests of the Group. The Company’s policy is to have independent Directors make up at least half of the Board.
While all the Directors have equal responsibilities for the performance of the Group, Non-Executive Directors exercise no management function in the Company or any of its subsidiaries. The role of Non-Executive Directors is primarily to ensure that the strategies proposed by the management are fully discussed, vigorously examined, taking into consideration the long-term interest of the shareholders, employees, customers, suppliers and the communities in which the Group conducts its business.
The Board is of the view that there is a strong and independent element on the Board in that all Directors, other than Ms Olivia Lum Ooi Lin and Mr Gary Kee Eng Kwee, are Independent Directors. The present Board size and number of Board Committees facilitate effective decision making and is appropriate for the nature and scope of the Group’s business and operations.
The Board believes the composition of the Board requires consideration of a number of factors, including the mix in skills, abilities and expertise, the mix in the length of time Directors have had on the Board, as well as experience on other boards.
The Board consists of respected business leaders and professionals whose collective core competencies and experience are extensive, diverse and relevant to the Group. The names, qualifications and relevant skills, experience and expertise of the Directors can be found in the “Board of Directors” section of the annual report. As evidenced by this information, the Directors bring to the Board a broad range of experience and expertise.
Where necessary, the Company arranges informal meeting sessions for Independent Directors to meet without the presence of the management.
Corporate Governance
27
Sustainable Solutions For a Better Tomorrow
Principle 3: Chairman and Chief Executive Officer
Ms Olivia Lum Ooi Lin is the Executive Chairman and Group Chief Executive Officer of the Company. The Board considers that vesting two roles in the same person provides the Group with strong and consistent leadership in the development and execution of the Group’s business strategies and is beneficial to the Group.
In line with the Code, Mr Teo Kiang Kok was appointed as the Lead Independent Director in 2012 and has been holding this position since then. As Lead Independent Director, Mr Teo chairs all Board meetings. If shareholders of the Company have serious concerns for which contact through the normal channels of the Executive Chairman and Chief Executive Officer or the Chief Financial Officer have failed to resolve or is inappropriate, they may contact the Lead Independent Director.
The Board is of the opinion that the process of decision making by the Board has been independent, based on collective decisions without any individual exercising any considerable concentration of power or influence.
The Independent Directors, led by the Lead Independent Director, meet amongst themselves without the presence of the other directors where necessary, and the Lead Independent Director will provide feedback to the Executive Chairman after such meetings.
Principle 4: Board Membership
The Nominating Committee (“NC”) has been tasked by the Board to identify, select and recommend individuals with the appropriate skills, expertise and experience for appointment, thereby ensuring a balanced and effective Board at all times.
The NC comprises four Directors:Mr Teo Kiang Kok (Chairman) Mr Gay Chee CheongMs Olivia Lum Ooi LinMr Christopher Murugasu
The primary function and duties of the NC are outlined as follows: 1. to make recommendations to the Board on all Board appointments and re-nominations having regard to the composition and each Director’s competencies, commitment, contribution and performance (e.g. attendance, preparedness, participation, candour, and any other salient factors);
2. to ensure that all Directors would be required to submit themselves for re-nomination and re-election at regular intervals and at least once in every three years;
3. to determine annually, and as and when circumstances require, whether a Director is independent, in accordance with the independence guidelines set out in the Code;
4. to review whether a Director is able to and has adequately carried out his duties as a Director of the Company, in particular where the Director concerned has multiple board representations;
5. proposes a framework for assessing Board effectiveness and individual Director’s contribution, and carry out such assessment; and
6. reviews and recommends to the Board, the training and professional development programmes for the Directors.
28
Hyflux Ltd Annual Report 2014
In carrying out the assessment of the independence of the Non-Executive Directors, the NC considered the following attributes and contributions of all the Non-Executive Independent Directors and found that the length of tenure does not have any impact on their independence: 1. The Non-Executive Independent Directors provide their objective and constructive views to the Board and management; 2. The Non-Executive Independent Directors always speak up and offer practical solutions to issues and work towards increasing value of the Group for the benefit of all shareholders; and
3. The Non-Executive Independent Directors evaluate and assess the information provided to the Board in an independent and constructive manner and render such advice as may be necessary to assist management to implement plans/policies adopted by the Group.
The NC believes that the Non-Executive Independent Directors’ experience and knowledge of the Group’s business, combined with their external business and professional experience enable them to provide effective challenges and make constructive contributions to management discussions.
In addition, all the Non-Executive Independent Directors have made written confirmations to their independence in accordance with the Code and the SGX-ST’s Listing Manual.
Accordingly, the NC has determined that Mr Teo Kiang Kok, Mr Lee Joo Hai, Mr Gay Chee Cheong and Mr Christopher Murugasu are independent directors notwithstanding that each of them has served on the Board for more than nine years from the dates of their respective appointment. The Board accepts the NC’s view and affirms the independence of these Directors.
All Directors are required to declare their board representations. Although the Non-Executive Independent Directors hold directorships in other companies, the Board is of the view that such multiple Board representations do not hinder them from carrying out their duties as Directors. These Directors would widen the experience of the Board and give it a broader perspective. The NC has reviewed the work and other commitments of such Directors and assessed their ability to discharge their Board responsibilities. The NC is satisfied that these Directors have committed and are able to commit sufficient time, effort and attention to the affairs of the Group. The NC is of the view that fixing a number for such board representation is not meaningful in the context of the Group. The Board accepts and affirms the view of the NC.
The NC has recommended the nomination of Directors retiring by rotation under the Company’s Articles of Association, namely, Mr Lau Wing Tat, Mr Gary Kee Eng Kwee and Mr Simon Tay.
In reviewing the nomination of the retiring Directors, the NC considered the performance and contribution of each of the retiring Directors, having regard not only to their attendance and participation at Board and Board Committees meetings but also the time and efforts devoted to the Group’s business and affairs.
There is no alternate director on the Board.
The profiles of the Directors are set out in the “Board of Directors” section of the annual report. The shareholdings of the individual Directors of the Company are set out in the “Directors’ Report” of the annual report. None of the directors hold shares in the subsidiaries of the Company.
Corporate Governance
29
Sustainable Solutions For a Better Tomorrow
Principle 5: Board Performance
The Code recommends that the NC be responsible for assessing the effectiveness of the Board as a whole and the individual Directors’ contribution. The NC believes that it is more appropriate and effective to focus the assessment on the Board as a whole, bearing in mind that each member of the Board contributes in different ways to the success of the Group.
The NC in conducting the evaluation and appraisal process focuses on a set of performance criteria which includes the evaluation of the size and composition of the Board, the Board’s access to information, Board processes and accountability, Board performance in relation to discharging its principal responsibilities and the Directors’ standards of conduct.
The Board is of the view that the financial indicators, as set out in the Code as a guide for the evaluation of the Board and its Directors, may not be appropriate as they are more relevant as a form of measurement of the management’s performance.
The NC conducted a Board performance evaluation to assess the effectiveness of the Board as a whole throughout the financial year ended 31 December 2014 and is satisfied that sufficient effort, time and attention have been given by the Directors to the affairs of the Group. The NC has discussed with the Board its assessment of the Board’s performance and effectiveness.
The NC also evaluated on a continual basis the performance of individual Directors based on performance criteria which included individual skills, industry experience and business knowledge, attendance record, contributions to strategy development and quality of participation at Board and Committee meetings.
Principle 6: Access to Information
The Board has separate and independent access to senior management of the Group, the Company Secretary and the external auditors at all times. The Directors also have unrestricted access to the Company’s records and information, all minutes of meetings held by the Board and Board Committees and management accounts to enable them to carry out their duties.
The Company Secretary attends all Board and Board Committees meetings. The Company Secretary administers, attends and prepares minutes of the Board and Board Committees meetings, and assists in ensuring that Board procedures are followed and reviewed in accordance with the Company’s Articles of Association so that the Board functions effectively and the relevant rules and regulations applicable to the Company are complied with. The Company Secretary’s role is to advise the Board on all governance matters, ensuring that legal and regulatory requirements, as well as Board policies and procedures are complied with. The appointment and the removal of the Company Secretary are subject to the Board’s approval.
Should Directors, whether as a group or individually, require professional advice, the Company shall upon the direction of the Board, appoint a professional advisor selected by such Director(s). The costs of such service shall be borne by the Company.
30
Hyflux Ltd Annual Report 2014
B. REMUNERATION MATTERS
Principle 7: Procedures for Developing Remuneration Policies
The Remuneration Committee (“RC”) comprises three Directors: Mr Gay Chee Cheong (Chairman)Mr Teo Kiang Kok Mr Christopher Murugasu The RC is committed to the principles of accountability and transparency; and it ensures that remuneration arrangements demonstrate a clear link between reward and performance.
The RC is responsible for ensuring a formal and transparent procedure for developing policy on executive remuneration, and for fixing the remuneration packages of individual Director and senior management employees.
The RC’s review covers all aspects of remuneration, including but not limited to Directors’ fees, salaries, allowances, bonus, and employees share options and benefits in kind and specific remuneration package for each Director.
In structuring a compensation framework for Executive Directors and senior management employees, the RC seeks to link a portion of the compensation to the Group’s performance. RC also reviews and recommends to the Board the remuneration package for the Non-Executive Directors. Its recommendations are submitted for endorsement by the Board. The RC, when deemed necessary, may obtain expert advice with regard to remuneration matters.
Principle 8: Level and Mix of Remuneration
The remuneration policy of the Group is to provide compensation packages at market rates, reward performance and attract, retain and motivate Directors and members of the senior management team.
The Executive Directors do not receive Directors’ fees. The Executive Directors and senior management employees remuneration packages are based on service contracts and their remuneration packages are determined having due regard to the performance of the individuals, the Group as well as market trends.
Non-Executive Independent Directors are paid yearly Directors’ fees of an agreed amount based on their contributions, taking into account factors such as effort and time spent, responsibilities of the Directors and the need to pay competitive fees to attract, motivate and retain the Directors.
Principle 9: Disclosure on Remuneration
An appropriate and attractive level of remuneration has been set to attract, retain and motivate Directors and employees. The remuneration package for Executive Directors and employees consists of both fixed and variable components. The variable component is determined based on the performance of the individual employee and the Group’s performance in the relevant financial year. Annual increments and adjustments to remuneration are reviewed and approved taking into account the outcome of the annual appraisal of the employees.
Non-Executive Directors are paid Directors’ fees that are subject to shareholders’ approval at the Company’s Annual General Meeting (“AGM”). The RC recommends total Directors’ fees of S$478,301 be paid to Non-Executive Directors for the financial year ended 31 December 2014. This will be tabled for shareholders’ approval at the forthcoming AGM.
Corporate Governance
31
Sustainable Solutions For a Better Tomorrow
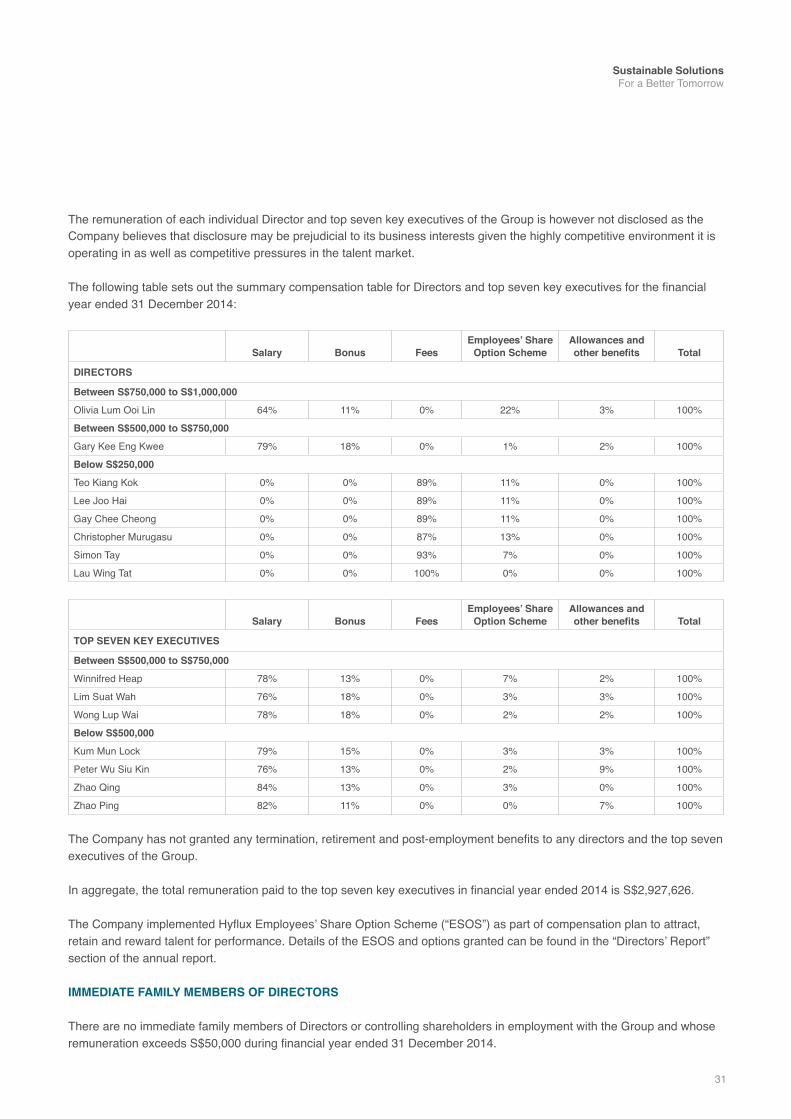
The remuneration of each individual Director and top seven key executives of the Group is however not disclosed as the Company believes that disclosure may be prejudicial to its business interests given the highly competitive environment it is operating in as well as competitive pressures in the talent market.
The following table sets out the summary compensation table for Directors and top seven key executives for the financial year ended 31 December 2014:
Salary Bonus FeesEmployees’ Share
Option SchemeAllowances and other benefits Total
DIRECTORS
Between S$750,000 to S$1,000,000
Olivia Lum Ooi Lin 64% 11% 0% 22% 3% 100%
Between S$500,000 to S$750,000
Gary Kee Eng Kwee 79% 18% 0% 1% 2% 100%
Below S$250,000
Teo Kiang Kok 0% 0% 89% 11% 0% 100%
Lee Joo Hai 0% 0% 89% 11% 0% 100%
Gay Chee Cheong 0% 0% 89% 11% 0% 100%
Christopher Murugasu 0% 0% 87% 13% 0% 100%
Simon Tay 0% 0% 93% 7% 0% 100%
Lau Wing Tat 0% 0% 100% 0% 0% 100%
Salary Bonus FeesEmployees’ Share
Option SchemeAllowances and other benefits Total
TOP SEVEN KEY EXECUTIVES
Between S$500,000 to S$750,000
Winnifred Heap 78% 13% 0% 7% 2% 100%
Lim Suat Wah 76% 18% 0% 3% 3% 100%
Wong Lup Wai 78% 18% 0% 2% 2% 100%
Below S$500,000
Kum Mun Lock 79% 15% 0% 3% 3% 100%
Peter Wu Siu Kin 76% 13% 0% 2% 9% 100%
Zhao Qing 84% 13% 0% 3% 0% 100%
Zhao Ping 82% 11% 0% 0% 7% 100%
The Company has not granted any termination, retirement and post-employment benefits to any directors and the top seven executives of the Group.
In aggregate, the total remuneration paid to the top seven key executives in financial year ended 2014 is S$2,927,626.
The Company implemented Hyflux Employees’ Share Option Scheme (“ESOS”) as part of compensation plan to attract, retain and reward talent for performance. Details of the ESOS and options granted can be found in the “Directors’ Report” section of the annual report.
IMMEDIATE FAMILY MEMBERS OF DIRECTORS
There are no immediate family members of Directors or controlling shareholders in employment with the Group and whose remuneration exceeds S$50,000 during financial year ended 31 December 2014.
32
Hyflux Ltd Annual Report 2014
C. ACCOUNTABILITY AND AUDIT
Principle 10: Accountability
The Board promotes timely and balanced disclosure of all material matters concerning the Group. It updates shareholders on the operations and financial position of the Group through quarterly, half yearly and full year results announcements as well as timely announcements of other matters as prescribed by the SGX-ST’s Listing Manual requirements and other relevant rules and regulations.
Price sensitive information is first publicly released, either before the Company meets with any group of investors or analysts or simultaneously with such meetings.
The Board is accountable to shareholders for the management of the Group and the management is accountable to the Board by providing the Board with the necessary information for the discharge of its duties.
In line with the Listing Rules of the SGX-ST, the Board provides a negative assurance statement to the shareholders in its quarterly financial statements announcements, confirming to the best of its knowledge that nothing had come to the attention of the Board which might render the financial statements false or misleading in any material aspect.
Principle 11: Risk Management and Internal Controls
The Board recognizes the importance of maintaining a sound system of risk management and internal control within the Group to safeguard the shareholders’ interests and the Group’s assets, and to manage risks.
The Audit Committee (“AC”) and the Risk Management Committee (“RMC”) oversee and ensure that such system has been appropriately implemented and monitored.
The risk management and internal control processes and framework are intended to provide reasonable but not absolute assurance against material misstatements or loss, and to safeguard assets and ensure maintenance of proper accounting records, reliability of financial information, compliance with appropriate legislations, regulations and best practices, and the identification and containment of business risks.
The RMC comprises five Directors:Mr Lau Wing Tat (Chairman)Mr Lee Joo Hai Mr Teo Kiang KokMr Simon TayMr Christopher Murugasu
Corporate Governance
33
Sustainable Solutions For a Better Tomorrow
The functions of the RMC are as follows:
1. to review with management, and, where needed, with external consultants on areas of risk that may affect the viability and smooth operations of the Group, as well as management’s risk mitigation efforts, with the view of safeguarding shareholders’ interests and Group’s assets;
2. to direct and work with management to develop and review policies and processes to address and manage identified areas of risk in a systematic and structured manner;
3. to make recommendations to the Board in relation to business risks that may affect the Group, as and when these may arise; and
4. to perform any other functions as may be agreed by the Board.
The Board regularly reviews and improves its business and operational activities to identify areas of significant business risks as well as taking appropriate measures to control and mitigate these risks. The management reviews all significant control policies and procedures and highlights all significant matters to the Board. The financial risk management objectives and policies are outlined in the financial statements. Risk management alone does not guarantee that business undertakings will not fail. However, by identifying and managing risks that may arise, the Board is in a position to make more informed decisions and will benefit from a better balance between risk and reward. This will assist in safeguarding and creating shareholders’ value.
The AC and the Board have received assurance from the Chief Executive Officer, the Chief Financial Officer and department heads of the respective business units of the Company that as of 31 December 2014:
(1) the financial records have been properly maintained and the financial statements give a true and fair view of the Group’s operations and finances; and
(2) the Group’s risk management and internal control systems to address the key financial, operational and compliance risks affecting the operations are adequate to meet the needs of the Group in its current business environment.
The AC, together with the Board, have reviewed the adequacy and effectiveness of the Group’s risk management and internal control system put in place to address the key financial, operational, compliance and information technology risks affecting the operations.
Based on the reports submitted by internal and external auditors, and reviews by the management, the Board with the concurrence of the AC are satisfied that the risk management and internal control systems put in place to address the key financial, operational, compliance and information technology risks affecting the operations are adequate and effective to meet the needs of the Group in its current business environment as at 31 December 2014.
Principle 12: Audit Committee
The AC comprises four Directors:Mr Lee Joo Hai (Chairman) Mr Gay Chee Cheong Mr Teo Kiang KokMr Lau Wing Tat
34
Hyflux Ltd Annual Report 2014
In accordance with the principles in the Code, the AC comprises all Non-Executive Directors. The members of AC, collectively, have expertise and extensive experience in accounting, financial management and business, and are qualified to fulfill the AC’s responsibilities.
The primary functions of the AC are as follows:
1. to assist the Board in discharging its statutory responsibilities on financial and accounting matters;
2. to review the financial and operating results and accounting policies of the Group;
3. to review significant financial reporting issues and judgments relating to financial statements for each financial year, interim and annual results announcement before submission to the Board for approval;
4. to review the adequacy and effectiveness of the Company’s internal control (financial, operational, compliance and information technology) policies and systems established by the management, either carried out internally or with the assistance of any competent third parties;
5. to review the audit plans and reports of the external and internal auditors and to consider the effectiveness of the actions taken by management on the auditors’ recommendations;
6. to appraise and report to the Board on the audits undertaken by the external and internal auditors, the adequacy of the disclosure of information, and the appropriateness and quality of the system of management and internal controls;
7. to review the independence of external auditors annually and to consider the appointment or re-appointment of external auditors and matters relating to the resignation or removal of the auditors and to approve the remuneration and terms of engagement of the external auditors; and
8. to review interested person transactions, as defined in the SGX-ST’s Listing Manual.
In fulfilling its responsibilities, the AC receives regular reports from the management and the external auditors, Messrs KPMG LLP. The AC has full access to and co-operation of the management and meets with Messrs KPMG LLP in private at least once a year, and more frequently if necessary. The external auditors provide the AC with updates on recent developments in accounting standards on a periodic basis.
The AC reviewed all the non-audit services provided by the external auditors and the aggregate amount of audit fees paid to them. For details of fees payable to the external auditors in respect of audit and non-audit services, please refer to “Note 25 of the Notes to the Financial Statements” section of this annual report. The AC is satisfied that the nature and extent of such services will not prejudice the independence and objectivity of the external auditors; hence has recommended the re-appointment of Messrs KPMG LLP as external auditors of the Company at the coming AGM of the Company.
The AC has explicit authority within the scope of its responsibilities to seek any information it requires or to investigate any matter within its terms of reference. The AC has adequate resources to enable it to discharge its responsibilities properly.
The Board has put in place a confidential communication programme as endorsed by the AC. Employees may, in confidence, raise concerns about possible corporate improprieties in matters of financial reporting or other matters and to ensure that arrangements are in place for the independent investigations of such matters and for appropriate follow up actions. The details of the confidential communication programme and arrangements have been made available to all employees.
No former partner or director of the Company’s existing external auditors is a member of the AC.
Corporate Governance
35
Sustainable Solutions For a Better Tomorrow
Principle 13: Internal Audit
The Board has put in place a dedicated team of internal auditors. The internal audit function reviews the effectiveness of the material internal controls of the Group. The head of internal audit reports directly to the Chairman of the AC and has an appropriate standing within the Group. The AC also ensures that the internal audit function is adequately resourced, and reviews annually the adequacy of the internal audit function. The internal audit team meets the standards set by nationally and internationally recognised professional bodies including the Standards for the Professional Practice of Internal Auditing set by The Institute of Internal Auditors.
Within this framework, the internal audit function provides reasonable assurance that the risks incurred by the Group in each major activity will be identified, analysed and managed by management. The internal auditors will also make recommendations to enhance the effectiveness and security of the Group’s operations.
D. SHAREHOLDER RIGHTS AND RESPONSIBILITY
Principle 14: Shareholder Rights
Principle 15: Communication with Shareholders
Principle 16: Conduct of Shareholder Meetings
The Company is committed to regular and proactive communication with its shareholders. It aims to provide shareholders with clear, balanced, useful and material information on a timely basis to ensure that shareholders receive a balanced and up-to-date view of the Group’s performance and business.
Communication is made through:
1. an annual report that is prepared and issued to all shareholders. The Board makes every effort to ensure that the annual report includes all relevant information about the Group, including future development and other disclosures required by the Companies’ Act, Chapter 50, and Singapore Financial Reporting Standards;
2. quarterly and full-year financial statements comprising a summary of the financial information and affairs of the Group for the relevant period;
3. explanatory memoranda for AGM and extraordinary general meetings;
4. press releases on major developments of the Group;
5. disclosures to the SGX-ST via SGXNET; and
6. the Group’s website at http://www.hyflux.com at which shareholders can access information on the Group at all times.
36
Hyflux Ltd Annual Report 2014
In addition, shareholders are encouraged to attend the Company’s AGM to ensure a high level of accountability and to stay informed of the Group’s strategies and growth.
The Company’s Articles of Association allows all shareholders the right to appoint up to two proxies to attend and vote on their behalf at shareholders’ meetings. The Company will consider amending its Articles of Association to allow corporations which provide nominee or custodial services to appoint more than two proxies so that shareholders who hold shares through such corporations can attend and participate in shareholders’ meetings as proxies.
Separate resolutions are proposed on each substantially separate issue at the shareholders’ meeting. All the resolutions at the general meeting are in single item resolutions.
Shareholders are also given the opportunity to participate effectively and vote at shareholders’ meetings of the Company, where relevant rules and procedures governing such meetings (for instance, how to vote) are clearly communicated.
Shareholders are given the opportunity to raise questions and clarify any issues that they may have relating to the resolutions to be passed. The Board and senior management are present at each shareholders’ meeting to respond to any questions from the shareholders. The Group’s external auditors are also present to address queries about the conduct of the audit and the preparation and content of the auditors’ report. The Group fully supports the Code’s principle to encourage active shareholder participation.
The Company does not have a fixed dividend policy for its ordinary shares. The form, frequency and amount of dividends will depend on the Company’s earnings, general financial condition, results of operations, capital requirements, cash flow, general business condition, development plans and other factors as the Directors may deem appropriate.
Notwithstanding the above, the Company has been declaring dividends on half-yearly basis. Any payouts are clearly communicated to the shareholders via the financial results announcement through SGXNET.
INVESTMENT COMMITTEE
The Investment Committee (“IC”) comprises four Directors:Ms Olivia Lum Ooi Lin (Chairman)Mr Gay Chee CheongMr Gary Kee Eng KweeMr Simon Tay
The functions of the IC are as follows:
1. to oversee all aspects of investment policy and strategy for Group;
2. to review proposals on major investments which are not in the ordinary course of the Group’s business and to make recommendations to the Board for its approval; and
3. to review any other matters as authorised by the Board.
Corporate Governance
37
Sustainable Solutions For a Better Tomorrow
KEY MANAGEMENT COMMITTEE
The Company’s Key Management Committee is responsible for driving the Group’s strategic vision, formulating business plans to achieve business goals, creating the conditions for successful day-to-day operation and delivering long-term value for all stakeholders.
The Key Management Committee comprises the following members:Ms Olivia Lum Ooi Lin (Chairman)Mr Gary Kee Eng KweeMs Winnifred HeapMs Lim Suat WahMr Wong Lup Wai
DEALING IN SECURITIES
The Company has adopted its own internal compliance code pursuant to the SGX-ST’s best practices on dealings in securities and these are applicable to all its officers in relation to their dealings in the Company’s securities. Its officers are advised not to deal in the Company’s shares during the period commencing two weeks or one month before the announcement of the Group’s quarterly or full-year results respectively, or if they are in possession of unpublished price-sensitive information of the Group. All officers and employees are also not allowed to deal in the Company’s securities on short-term considerations, and are expected to observe insider trading laws at all times even when dealing in securities within the permitted trading period.
MATERIAL CONTRACTS
There are no material contracts of the Company or its subsidiaries involving the interests of the Executive Chairman and Group Chief Executive Officer, each Director or controlling shareholders, either still subsisting at the end of the financial year or entered into since the end of the previous financial year.
INTERESTED PARTY TRANSACTION
The Group has established procedures to ensure that all transactions with interested persons are reported in a timely manner to the AC and that the transactions are at arm’s length basis. All interested person transactions are subject to review by the AC to ensure compliance with established procedures.
For the financial year ended 31 December 2014, the Group did not enter into any transaction that would be regarded as an interested person transaction pursuant to SGX-ST’s Listing Manual.

38
Hyflux Ltd Annual Report 2014
Corporate Social Responsibility
We value our employees and seek to make Hyflux a place where they can realise their full potential while making a
difference at work.
HUMAN CAPITAL
Hyflux has a workforce of some 2,400 employees globally, working together for a common goal to deliver sustainable solutions that improve lives in the communities we serve. Our focus is on recruiting, engaging, motivating and retaining individuals whose skills, aspirations and values are aligned to the company’s strategic vision and core values. The diverse backgrounds, experiences and perspectives of the people we recruit not only allow us to understand and connect with our customers around the world, but also serve as catalysts for new ideas and innovation.
We value our employees and seek to make Hyflux a place where they can realise their full potential while making a difference at work. Training and workshops, job rotations and overseas postings are part of the employee development programme to equip our staff with in-depth experience and capabilities that are crucial to our expanding operations and long-term success. We regularly engage employees through dialogue sessions with senior management and through the company’s intranet. We also strive to create a work environment that is fun. Hyfun Club, which is run by representatives from
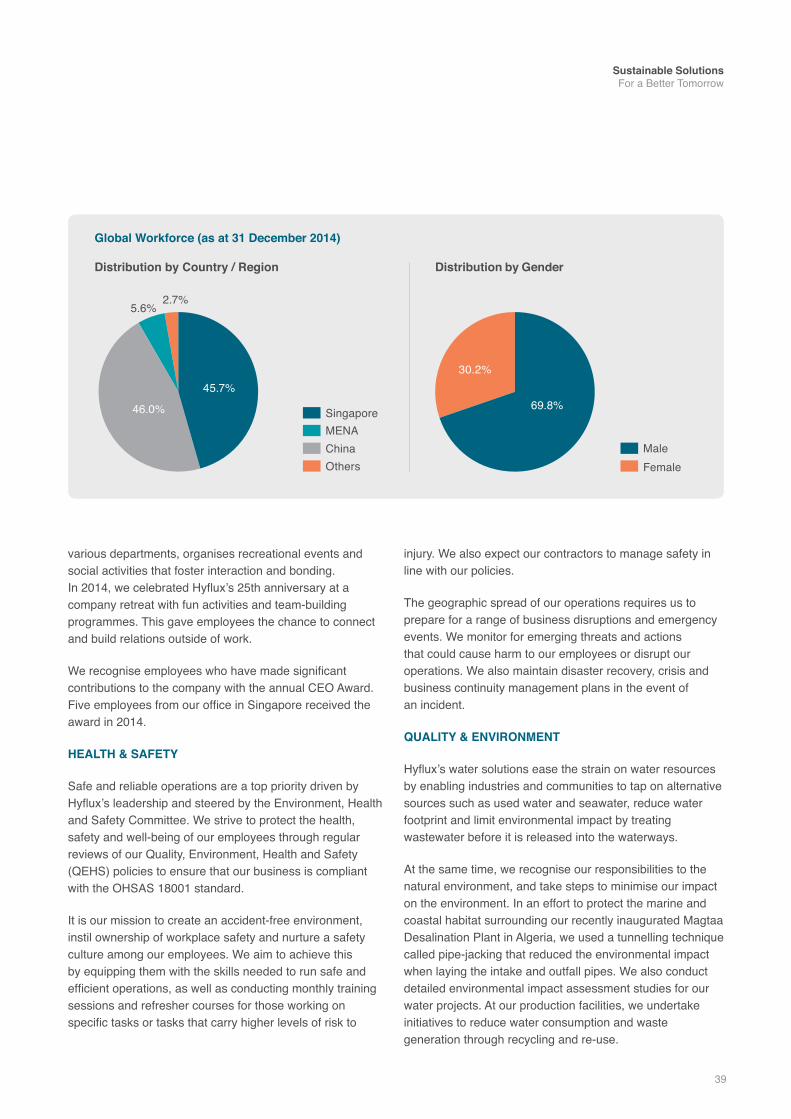
39
Sustainable Solutions For a Better Tomorrow
various departments, organises recreational events and social activities that foster interaction and bonding. In 2014, we celebrated Hyflux’s 25th anniversary at a company retreat with fun activities and team-building programmes. This gave employees the chance to connect and build relations outside of work.
We recognise employees who have made significant contributions to the company with the annual CEO Award. Five employees from our office in Singapore received the award in 2014.
HEALTH & SAFETY
Safe and reliable operations are a top priority driven by Hyflux’s leadership and steered by the Environment, Health and Safety Committee. We strive to protect the health, safety and well-being of our employees through regular reviews of our Quality, Environment, Health and Safety (QEHS) policies to ensure that our business is compliant with the OHSAS 18001 standard.
It is our mission to create an accident-free environment, instil ownership of workplace safety and nurture a safety culture among our employees. We aim to achieve this by equipping them with the skills needed to run safe and efficient operations, as well as conducting monthly training sessions and refresher courses for those working on specific tasks or tasks that carry higher levels of risk to
injury. We also expect our contractors to manage safety in line with our policies.
The geographic spread of our operations requires us to prepare for a range of business disruptions and emergency events. We monitor for emerging threats and actions that could cause harm to our employees or disrupt our operations. We also maintain disaster recovery, crisis and business continuity management plans in the event of an incident.
QUALITY & ENVIRONMENT
Hyflux’s water solutions ease the strain on water resources by enabling industries and communities to tap on alternative sources such as used water and seawater, reduce water footprint and limit environmental impact by treating wastewater before it is released into the waterways.
At the same time, we recognise our responsibilities to the natural environment, and take steps to minimise our impact on the environment. In an effort to protect the marine and coastal habitat surrounding our recently inaugurated Magtaa Desalination Plant in Algeria, we used a tunnelling technique called pipe-jacking that reduced the environmental impact when laying the intake and outfall pipes. We also conduct detailed environmental impact assessment studies for our water projects. At our production facilities, we undertake initiatives to reduce water consumption and waste generation through recycling and re-use.
Distribution by Country / Region
Global Workforce (as at 31 December 2014)
Distribution by Gender
Singapore
China MaleFemaleOthers
69.8%
30.2%
5.6%2.7%
45.7%
46.0%
MENA
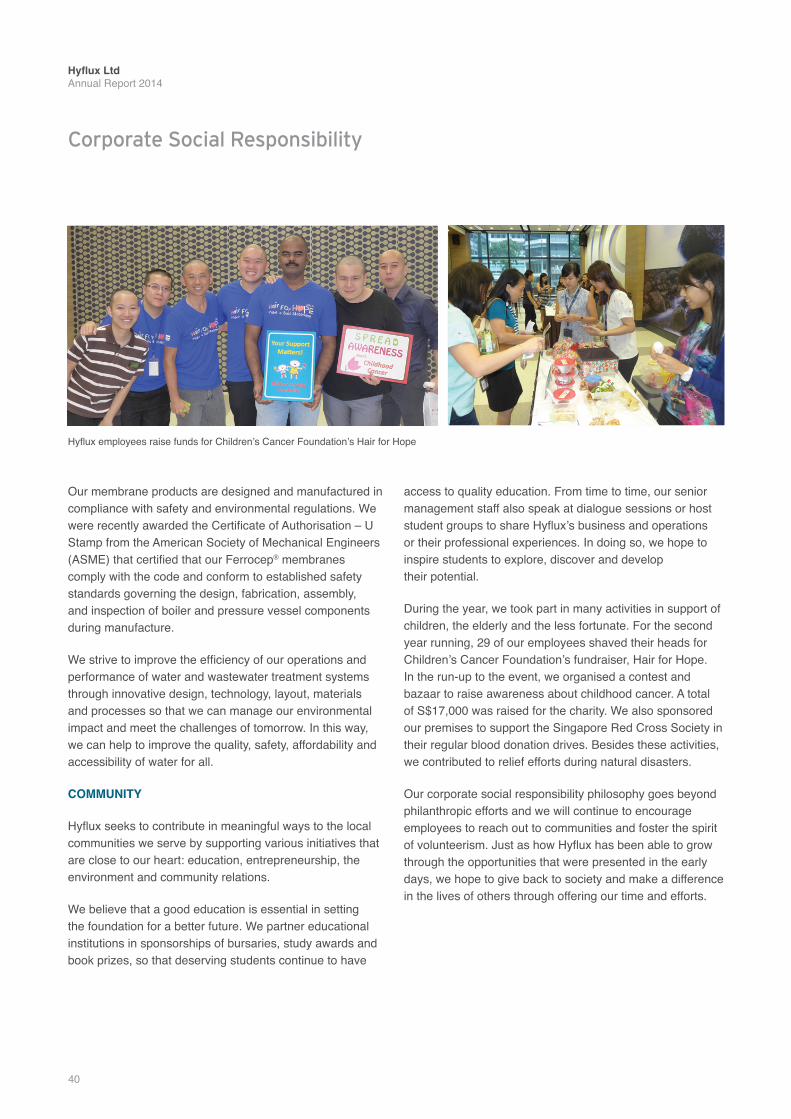
40
Hyflux Ltd Annual Report 2014
Our membrane products are designed and manufactured in compliance with safety and environmental regulations. We were recently awarded the Certificate of Authorisation – U Stamp from the American Society of Mechanical Engineers (ASME) that certified that our Ferrocep® membranes comply with the code and conform to established safety standards governing the design, fabrication, assembly, and inspection of boiler and pressure vessel components during manufacture.
We strive to improve the efficiency of our operations and performance of water and wastewater treatment systems through innovative design, technology, layout, materials and processes so that we can manage our environmental impact and meet the challenges of tomorrow. In this way, we can help to improve the quality, safety, affordability and accessibility of water for all.
COMMUNITY
Hyflux seeks to contribute in meaningful ways to the local communities we serve by supporting various initiatives that are close to our heart: education, entrepreneurship, the environment and community relations.
We believe that a good education is essential in setting the foundation for a better future. We partner educational institutions in sponsorships of bursaries, study awards and book prizes, so that deserving students continue to have
access to quality education. From time to time, our senior management staff also speak at dialogue sessions or host student groups to share Hyflux’s business and operations or their professional experiences. In doing so, we hope to inspire students to explore, discover and develop their potential.
During the year, we took part in many activities in support of children, the elderly and the less fortunate. For the second year running, 29 of our employees shaved their heads for Children’s Cancer Foundation’s fundraiser, Hair for Hope. In the run-up to the event, we organised a contest and bazaar to raise awareness about childhood cancer. A total of S$17,000 was raised for the charity. We also sponsored our premises to support the Singapore Red Cross Society in their regular blood donation drives. Besides these activities, we contributed to relief efforts during natural disasters.
Our corporate social responsibility philosophy goes beyond philanthropic efforts and we will continue to encourage employees to reach out to communities and foster the spirit of volunteerism. Just as how Hyflux has been able to grow through the opportunities that were presented in the early days, we hope to give back to society and make a difference in the lives of others through offering our time and efforts.
Corporate Social Responsibility
Hyflux employees raise funds for Children’s Cancer Foundation’s Hair for Hope

Table of Contents
42 Directors’ Report
49 Statement by Directors
50 Independent Auditors’ Report
51 Statements of Financial Position
53 Consolidated Income Statement
54 Consolidated Statement of Comprehensive Income
55 Consolidated Statement of Changes in Equity
59 Consolidated Statement of Cash Flows
61 Notes to the Financial Statements
126 Supplementary Information
127 Statistics of Shareholdings
129 Substantial Ordinary Shareholders
130 Hyflux Group of Companies
132 Corporate Information
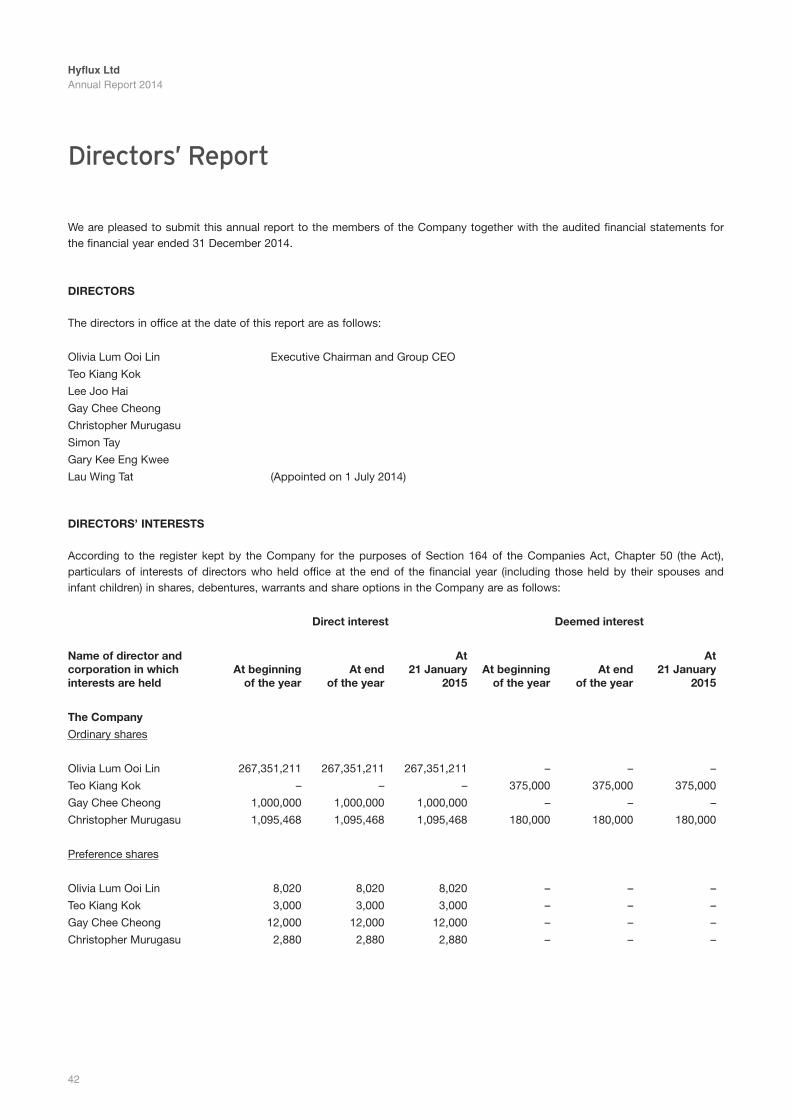
Hyflux LtdAnnual Report 2014
42
Directors’ Report
We are pleased to submit this annual report to the members of the Company together with the audited financial statements for the financial year ended 31 December 2014.
Directors
The directors in office at the date of this report are as follows:
Olivia Lum Ooi Lin Executive Chairman and Group CEO
Teo Kiang Kok
Lee Joo Hai
Gay Chee Cheong
Christopher Murugasu
Simon Tay
Gary Kee Eng Kwee
Lau Wing Tat (Appointed on 1 July 2014)
Directors’ interests
According to the register kept by the Company for the purposes of Section 164 of the Companies Act, Chapter 50 (the Act), particulars of interests of directors who held office at the end of the financial year (including those held by their spouses and infant children) in shares, debentures, warrants and share options in the Company are as follows:
Direct interest Deemed interest
name of director and corporation in which interests are held
At beginningof the year
At endof the year
At 21 January
2015At beginning
of the yearAt end
of the year
At 21 January
2015
the company
Ordinary shares
Olivia Lum Ooi Lin 267,351,211 267,351,211 267,351,211 – – –
Teo Kiang Kok – – – 375,000 375,000 375,000
Gay Chee Cheong 1,000,000 1,000,000 1,000,000 – – –
Christopher Murugasu 1,095,468 1,095,468 1,095,468 180,000 180,000 180,000
Preference shares
Olivia Lum Ooi Lin 8,020 8,020 8,020 – – –
Teo Kiang Kok 3,000 3,000 3,000 – – –
Gay Chee Cheong 12,000 12,000 12,000 – – –
Christopher Murugasu 2,880 2,880 2,880 – – –
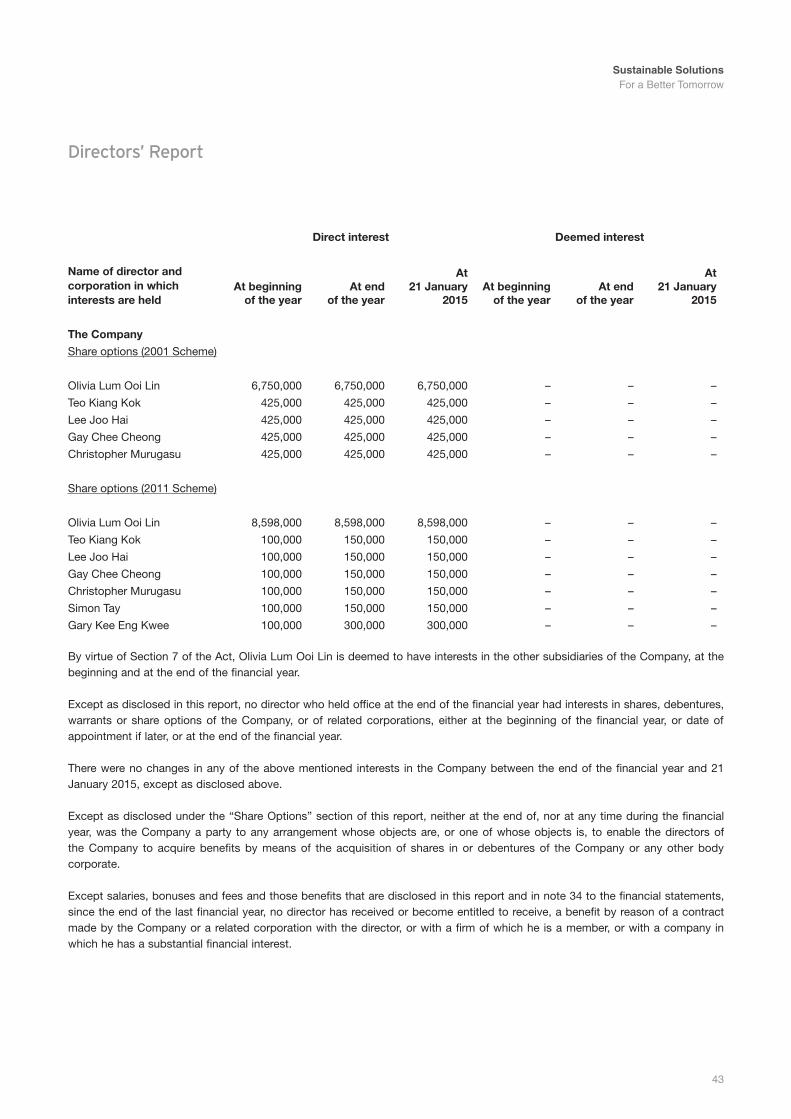
Sustainable Solutions For a Better Tomorrow
43
Direct interest Deemed interest
name of director and corporation in which interests are held
At beginningof the year
At endof the year
At 21 January
2015At beginning
of the yearAt end
of the year
At 21 January
2015
the company
Share options (2001 Scheme)
Olivia Lum Ooi Lin 6,750,000 6,750,000 6,750,000 – – –
Teo Kiang Kok 425,000 425,000 425,000 – – –
Lee Joo Hai 425,000 425,000 425,000 – – –
Gay Chee Cheong 425,000 425,000 425,000 – – –
Christopher Murugasu 425,000 425,000 425,000 – – –
Share options (2011 Scheme)
Olivia Lum Ooi Lin 8,598,000 8,598,000 8,598,000 – – –
Teo Kiang Kok 100,000 150,000 150,000 – – –
Lee Joo Hai 100,000 150,000 150,000 – – –
Gay Chee Cheong 100,000 150,000 150,000 – – –
Christopher Murugasu 100,000 150,000 150,000 – – –
Simon Tay 100,000 150,000 150,000 – – –
Gary Kee Eng Kwee 100,000 300,000 300,000 – – –
By virtue of Section 7 of the Act, Olivia Lum Ooi Lin is deemed to have interests in the other subsidiaries of the Company, at the beginning and at the end of the financial year.
Except as disclosed in this report, no director who held office at the end of the financial year had interests in shares, debentures, warrants or share options of the Company, or of related corporations, either at the beginning of the financial year, or date of appointment if later, or at the end of the financial year.
There were no changes in any of the above mentioned interests in the Company between the end of the financial year and 21 January 2015, except as disclosed above.
Except as disclosed under the “Share Options” section of this report, neither at the end of, nor at any time during the financial year, was the Company a party to any arrangement whose objects are, or one of whose objects is, to enable the directors of the Company to acquire benefits by means of the acquisition of shares in or debentures of the Company or any other body corporate.
Except salaries, bonuses and fees and those benefits that are disclosed in this report and in note 34 to the financial statements, since the end of the last financial year, no director has received or become entitled to receive, a benefit by reason of a contract made by the Company or a related corporation with the director, or with a firm of which he is a member, or with a company in which he has a substantial financial interest.
Directors’ Report
Hyflux LtdAnnual Report 2014
44
shAre options
The Hyflux Employees’ Share Option Scheme (the 2001 Scheme) of the Company was approved and adopted by its members at an Extraordinary General Meeting held on 27 September 2001.
On 24 November 2003, the members of the Company approved a modification to the 2001 Scheme which allowed Olivia Lum Ooi Lin, Executive Chairman and Group CEO, and a substantial shareholder of the Company, to participate in the 2001 Scheme. The maximum entitlement of Olivia Lum Ooi Lin is 10% of the total number of shares which may be issued by the Company under the 2001 Scheme.
The 2001 Scheme expired on 26 September 2011.
On 27 April 2011, the members of the Company approved the implementation of a new share option scheme (the 2011 Scheme) to replace the 2001 Scheme that expired on 26 September 2011 and allowed Olivia Lum Ooi Lin, Executive Chairman and Group CEO, and a substantial shareholder of the Company, to participate in the 2011 Scheme. The implementation of the 2011 Scheme and replacement of the expired scheme do not affect the rights of holders of the options under the expired scheme. The maximum entitlement of Olivia Lum Ooi Lin is 10% of the total number of shares which may be issued by the Company under the 2011 Scheme. The aggregate number of scheme shares available to Olivia Lum Ooi Lin and her associates (as defined in the Listing Manual of Singapore Exchange Securities Trading Limited (SGX-ST’s Listing Manual)) shall not exceed 25% of the total number of scheme shares available under the 2011 Scheme.
The 2011 Scheme is administered by the Company’s Remuneration Committee. It has been in force since 27 September 2011 and shall expire on 26 September 2021.
Directors’ Report
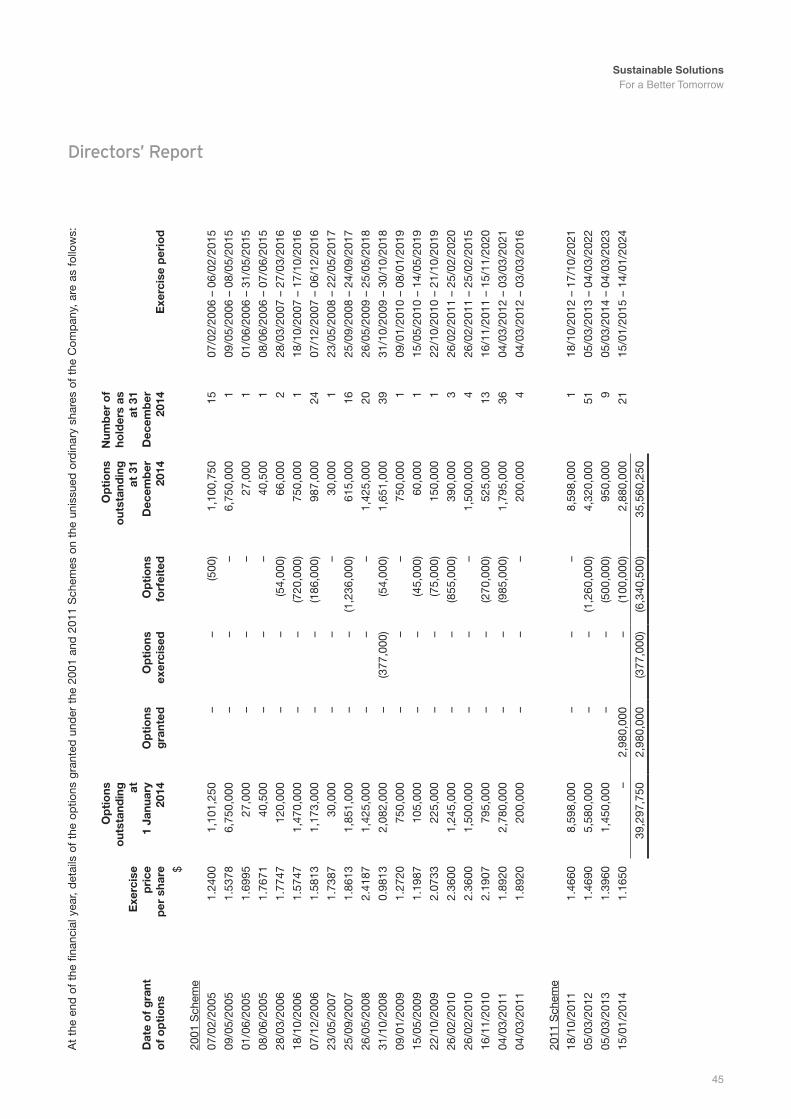
Sustainable Solutions For a Better Tomorrow
45
At
the
end
of
the
finan
cial
yea
r, d
etai
ls o
f th
e op
tions
gra
nted
und
er t
he 2
001
and
201
1 S
chem
es o
n th
e un
issu
ed o
rdin
ary
shar
es o
f th
e C
omp
any,
are
as
follo
ws:
Dat
e o
f g
rant
o
f o
pti
ons
exe
rcis
ep
rice
per
sha
re
op
tio
ns
out
stan
din
g
at1
Janu
ary
2014
op
tio
nsg
rant
edo
pti
ons
exer
cise
do
pti
ons
forf
eite
d
op
tio
nso
utst
and
ing
at
31
Dec
emb
er
2014
num
ber
of
hold
ers
as
at 3
1D
ecem
ber
20
14e
xerc
ise
per
iod
$
2001
Sch
eme
07/0
2/20
051.
2400
1,10
1,25
0–
–(5
00)
1,10
0,75
015
07/0
2/20
06 –
06/
02/2
015
09/0
5/20
051.
5378
6,75
0,00
0–
––
6,75
0,00
01
09/0
5/20
06 –
08/
05/2
015
01/0
6/20
051.
6995
27,0
00–
––
27,0
001
01/0
6/20
06 –
31/
05/2
015
08/0
6/20
051.
7671
40,5
00–
––
40,5
001
08/0
6/20
06 –
07/
06/2
015
28/0
3/20
061.
7747
12
0,00
0–
–(5
4,00
0)66
,000
228
/03/
2007
– 2
7/03
/201
6
18/1
0/20
061.
5747
1,47
0,00
0–
–(7
20,0
00)
750,
000
118
/10/
2007
– 1
7/10
/201
6
07/1
2/20
061.
5813
1,17
3,00
0–
–(1
86,0
00)
987,
000
2407
/12/
2007
– 0
6/12
/201
6
23/0
5/20
071.
7387
30,0
00–
––
30,0
001
23/0
5/20
08 –
22/
05/2
017
25/0
9/20
071.
8613
1,85
1,00
0–
–(1
,236
,000
)61
5,00
016
25/0
9/20
08 –
24/
09/2
017
26/0
5/20
082.
4187
1,42
5,00
0–
––
1,42
5,00
020
26/0
5/20
09 –
25/
05/2
018
31/1
0/20
080.
9813
2,08
2,00
0–
(377
,000
)(5
4,00
0)1,
651,
000
3931
/10/
2009
– 3
0/10
/201
8
09/0
1/20
091.
2720
75
0,00
0–
––
750,
000
109
/01/
2010
– 0
8/01
/201
9
15/0
5/20
091.
1987
10
5,00
0–
–(4
5,00
0)60
,000
115
/05/
2010
– 1
4/05
/201
9
22/1
0/20
092.
0733
225,
000
––
(75,
000)
150,
000
122
/10/
2010
– 2
1/10
/201
9
26/0
2/20
102.
3600
1,24
5,00
0–
–(8
55,0
00)
390,
000
326
/02/
2011
– 2
5/02
/202
0
26/0
2/20
102.
3600
1,50
0,00
0–
––
1,50
0,00
04
26/0
2/20
11 –
25/
02/2
015
16/1
1/20
102.
1907
795,
000
––
(270
,000
)52
5,00
013
16/1
1/20
11 –
15/
11/2
020
04/0
3/20
111.
8920
2,78
0,00
0–
–(9
85,0
00)
1,79
5,00
036
04/0
3/20
12 –
03/
03/2
021
04/0
3/20
111.
8920
200,
000
––
–20
0,00
04
04/0
3/20
12 –
03/
03/2
016
2011
Sch
eme
18/1
0/20
111.
4660
8,59
8,00
0–
––
8,59
8,00
01
18/1
0/20
12 –
17/
10/2
021
05/0
3/20
121.
4690
5,58
0,00
0–
–(1
,260
,000
)4,
320,
000
5105
/03/
2013
– 0
4/03
/202
2
05/0
3/20
131.
3960
1,45
0,00
0–
–(5
00,0
00)
950,
000
905
/03/
2014
– 0
4/03
/202
3
15/0
1/20
141.
1650
–2,
980,
000
–(1
00,0
00)
2,88
0,00
021
15/0
1/20
15 –
14/
01/2
024
39,2
97,7
502,
980,
000
(377
,000
)(6
,340
,500
)35
,560
,250
Directors’ Report

Hyflux LtdAnnual Report 2014
46
Except as disclosed above, there were no unissued shares of the Company or its subsidiaries under options granted by the Company or its subsidiaries as at the end of the financial year.
Details of options granted to directors of the Company under the 2001 Scheme and 2011 Scheme (collectively as the Schemes) are as follows:
name of director
options granted for
the financial year ended
31 December 2014
Aggregate options
granted since commencement
of schemes to31 December
2014
Aggregate options
exercised since commencement
of schemes to31 December
2014
Aggregate options
expired since commencement
of schemes to31 December
2014
Aggregate options
outstandingas at
31 December 2014
2001 scheme
Olivia Lum Ooi Lin – 8,625,000 (1,875,000) – 6,750,000
Teo Kiang Kok – 800,000 (375,000) – 425,000
Lee Joo Hai – 800,000 (375,000) – 425,000
Gay Chee Cheong – 725,000 (300,000) – 425,000
Christopher Murugasu – 1,409,375 (984,375) – 425,000
Gary Kee Eng Kwee – 700,000 (100,000) (600,000) –
Total – 13,059,375 (4,009,375) (600,000) 8,450,000
2011 scheme
Olivia Lum Ooi Lin – 8,598,000 – – 8,598,000
Teo Kiang Kok 50,000 150,000 – – 150,000
Lee Joo Hai 50,000 150,000 – – 150,000
Gay Chee Cheong 50,000 150,000 – – 150,000
Christopher Murugasu 50,000 150,000 – – 150,000
Simon Tay 50,000 150,000 – – 150,000
Gary Kee Eng Kwee 200,000 300,000 – – 300,000
Total 450,000 9,648,000 – – 9,648,000
Except as disclosed in this report, since the commencement of the Schemes to the end of the financial year:
• NooptionshavebeengrantedtothecontrollingshareholdersoftheCompanyortheirassociates;
• Noparticipanthasbeengranted5%ormoreofthetotaloptionsavailableundertheSchemes;
• NooptionshavebeengrantedtodirectorsandemployeesoftheholdingcompanyanditsrelatedcorporationsundertheSchemes;
• Nooptionsthatentitletheholdersoftheoptionstoparticipate,byvirtueofsuchholding,inanyshareissueofanyothercorporationhavebeengranted;and
• Theexercisepriceoftheoptionsissetatthemarketprice,asdefinedintheSchemes,atthetimeofgrant.Nooptionshave been granted at a discount.
Directors’ Report
Sustainable Solutions For a Better Tomorrow
47
AuDit committee
The members of the Audit Committee at the date of this report are:
Lee Joo Hai (Chairman), non-executive independent directorGay Chee Cheong, non-executive independent directorTeo Kiang Kok, non-executive independent directorLau Wing Tat, non-executive independent director
The members of the Audit Committee, collectively, have expertise and extensive experience in accounting, financial management and business, and are qualified to discharge the Audit Committee’s responsibilities.
The primary functions of the Audit Committee are as follows:
1. assiststheBoardindischargingitsstatutoryresponsibilitiesonfinancialandaccountingmatters;
2. reviewsthefinancialandoperatingresultsandaccountingpoliciesoftheGroup;
3. reviews significant financial reporting issues and judgements relating to financial statements for each financial year, interimandannualresultsannouncementbeforesubmissiontotheBoardforapproval;
4. reviews the adequacy and effectiveness of the Group’s internal control (financial, operational, compliance and information technology) policies and systems established by the management, either carried out internally or with the assistance of anycompetentthirdparties;
5. reviews the audit plans and reports of the external and internal auditors and considers the effectiveness of the actions takenbythemanagementontheauditors’recommendations;
6. appraises and reports to the Board on the audits undertaken by the external and internal auditors, the adequacy of the disclosureofinformation,andtheappropriatenessandqualityofthesystemofmanagementandinternalcontrols;
7. reviews the independence of external auditors annually and considers the appointment or re-appointment of external auditors, reviews the level of audit and non-audit fees and matters relating to the resignation or removal of the auditors andapprovestheremunerationandtermsofengagementoftheexternalauditors;and
8. reviews interested person transactions, as defined in the SGX-ST’s Listing Manual.
The Audit Committee has held 4 meetings since the last directors’ report. In fulfilling its responsibilities, the Audit Committee receives regular reports from the management. The Audit Committee has full access to and co-operation of the management and meets with KPMG LLP in private at least once a year, and more frequently if necessary.
The Audit Committee has explicit authority within the scope of its responsibilities to seek any information it requires or investigate any matter within its terms of reference. The Audit Committee has adequate resources to enable it to discharge its responsibilities properly.
Directors’ Report
Hyflux LtdAnnual Report 2014
48
The Board has put in place a confidential communication programme as endorsed by the Audit Committee. Employees may, in confidence, raise concerns about possible corporate improprieties in matters of financial reporting or other matters and to ensure that arrangements are in place for the independent investigations of such matters and for appropriate follow-up actions. The details of the confidential communication policies and arrangements have been made available to all employees.
The Audit Committee is satisfied with the independence and objectivity of the external auditors and has recommended to the Board of Directors that the auditors, KPMG LLP, be nominated for re-appointment as auditors at the forthcoming Annual General Meeting of the Company.
In appointing our auditors for the Company, subsidiaries and significant associated companies, we have complied with Rules 712, 715 and 716 of the SGX-ST’s Listing Manual.
AuDitors
The auditors, KPMG LLP, have indicated their willingness to accept re-appointment.
On behalf of the Board of Directors
olivia Lum ooi LinExecutive Chairman and Group CEO
teo Kiang KokDirector
26 March 2015
Directors’ Report
Sustainable Solutions For a Better Tomorrow
49
Statement by Directors
In our opinion:
(a) the financial statements set out on pages 51 to 125 are drawn up so as to give a true and fair view of the state of affairs of the Group and of the Company as at 31 December 2014 and the results, changes in equity and cash flows of the Group for the year ended on that date in accordance with the provisions of the Singapore Companies Act, Chapter 50 andSingaporeFinancialReportingStandards;and
(b) at the date of this statement, there are reasonable grounds to believe that the Company will be able to pay its debts as and when they fall due.
The Board of Directors has, on the date of this statement, authorised these financial statements for issue.
On behalf of the Board of Directors
olivia Lum ooi LinExecutive Chairman and Group CEO
teo Kiang KokDirector
26 March 2015
Hyflux LtdAnnual Report 2014
50
Independent Auditors’ Reportmembers of the companyhyflux Ltd
report on the financial statements
We have audited the accompanying financial statements of Hyflux Ltd (the Company) and its subsidiaries (the Group), which comprise the statements of financial position of the Group and the Company as at 31 December 2014, the income statement, statement of comprehensive income, statement of changes in equity and statement of cash flows of the Group for the year then ended, and a summary of significant accounting policies and other explanatory information, as set out on pages 51 to 125.
Management’s responsibility for the financial statements
Management is responsible for the preparation of financial statements that give a true and fair view in accordance with the provisions of the Singapore Companies Act, Chapter 50 (the Act) and Singapore Financial Reporting Standards, and for devising and maintaining a system of internal accounting controls sufficient to provide a reasonable assurance that assets aresafeguardedagainst loss fromunauthoriseduseordisposition;and transactionsareproperlyauthorisedand that theyarerecorded as necessary to permit the preparation of true and fair profit and loss accounts and balance sheets and to maintain accountability of assets.
Auditors’ responsibility
Our responsibility is to express an opinion on these financial statements based on our audit. We conducted our audit in accordance with Singapore Standards on Auditing. Those standards require that we comply with ethical requirements and plan and perform the audit to obtain reasonable assurance about whether the financial statements are free from material misstatement.
An audit involves performing procedures to obtain audit evidence about the amounts and disclosures in the financial statements. The procedures selected depend on the auditor’s judgement, including the assessment of the risks of material misstatement of the financial statements, whether due to fraud or error. In making those risk assessments, the auditor considers internal control relevant to the entity’s preparation of financial statements that give a true and fair view in order to design audit procedures that are appropriate in the circumstances, but not for the purpose of expressing an opinion on the effectiveness of the entity’s internal control. An audit also includes evaluating the appropriateness of accounting policies used and the reasonableness of accounting estimates made by management, as well as evaluating the overall presentation of the financial statements.
We believe that the audit evidence we have obtained is sufficient and appropriate to provide a basis for our audit opinion.
Opinion
In our opinion, the consolidated financial statements of the Group and the statement of financial position of the Company are properly drawn up in accordance with the provisions of the Act and Singapore Financial Reporting Standards to give a true and fair view of the state of affairs of the Group and of the Company as at 31 December 2014 and the results, changes in equity and cash flows of the Group for the year ended on that date.
report on other legal and regulatory requirements
In our opinion, the accounting and other records required by the Act to be kept by the Company and by those subsidiaries incorporated in Singapore of which we are the auditors have been properly kept in accordance with the provisions of the Act.
KpmG LLpPublic Accountants andChartered Accountants
singapore26 March 2015
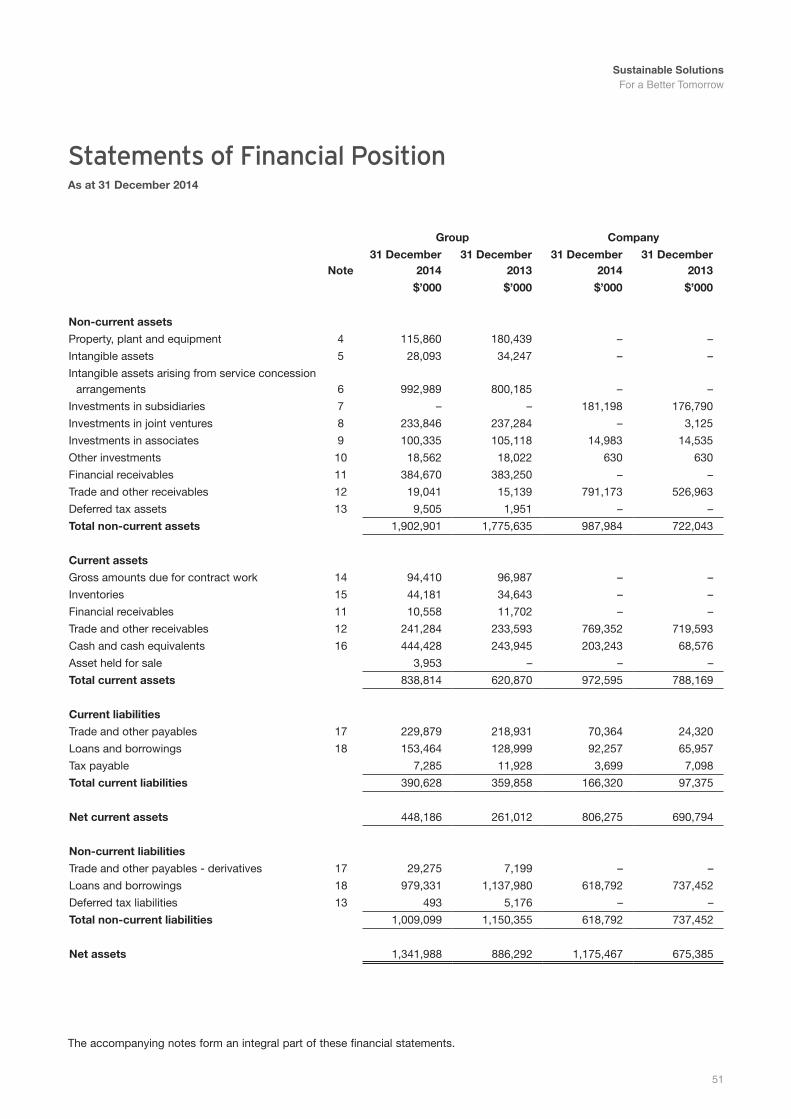
Sustainable Solutions For a Better Tomorrow
51
The accompanying notes form an integral part of these financial statements.
Statements of Financial PositionAs at 31 December 2014
Group company
note31 December
201431 December
201331 December
201431 December
2013
$’000 $’000 $’000 $’000
non-current assets
Property, plant and equipment 4 115,860 180,439 – –
Intangible assets 5 28,093 34,247 – –
Intangible assets arising from service concession arrangements 6 992,989 800,185 – –
Investments in subsidiaries 7 – – 181,198 176,790
Investments in joint ventures 8 233,846 237,284 – 3,125
Investments in associates 9 100,335 105,118 14,983 14,535
Other investments 10 18,562 18,022 630 630
Financial receivables 11 384,670 383,250 – –
Trade and other receivables 12 19,041 15,139 791,173 526,963
Deferred tax assets 13 9,505 1,951 – –
total non-current assets 1,902,901 1,775,635 987,984 722,043
current assets
Gross amounts due for contract work 14 94,410 96,987 – –
Inventories 15 44,181 34,643 – –
Financial receivables 11 10,558 11,702 – –
Trade and other receivables 12 241,284 233,593 769,352 719,593
Cash and cash equivalents 16 444,428 243,945 203,243 68,576
Asset held for sale 3,953 – – –
total current assets 838,814 620,870 972,595 788,169
current liabilities
Trade and other payables 17 229,879 218,931 70,364 24,320
Loans and borrowings 18 153,464 128,999 92,257 65,957
Tax payable 7,285 11,928 3,699 7,098
total current liabilities 390,628 359,858 166,320 97,375
net current assets 448,186 261,012 806,275 690,794
non-current liabilities
Trade and other payables - derivatives 17 29,275 7,199 – –
Loans and borrowings 18 979,331 1,137,980 618,792 737,452
Deferred tax liabilities 13 493 5,176 – –
total non-current liabilities 1,009,099 1,150,355 618,792 737,452
net assets 1,341,988 886,292 1,175,467 675,385
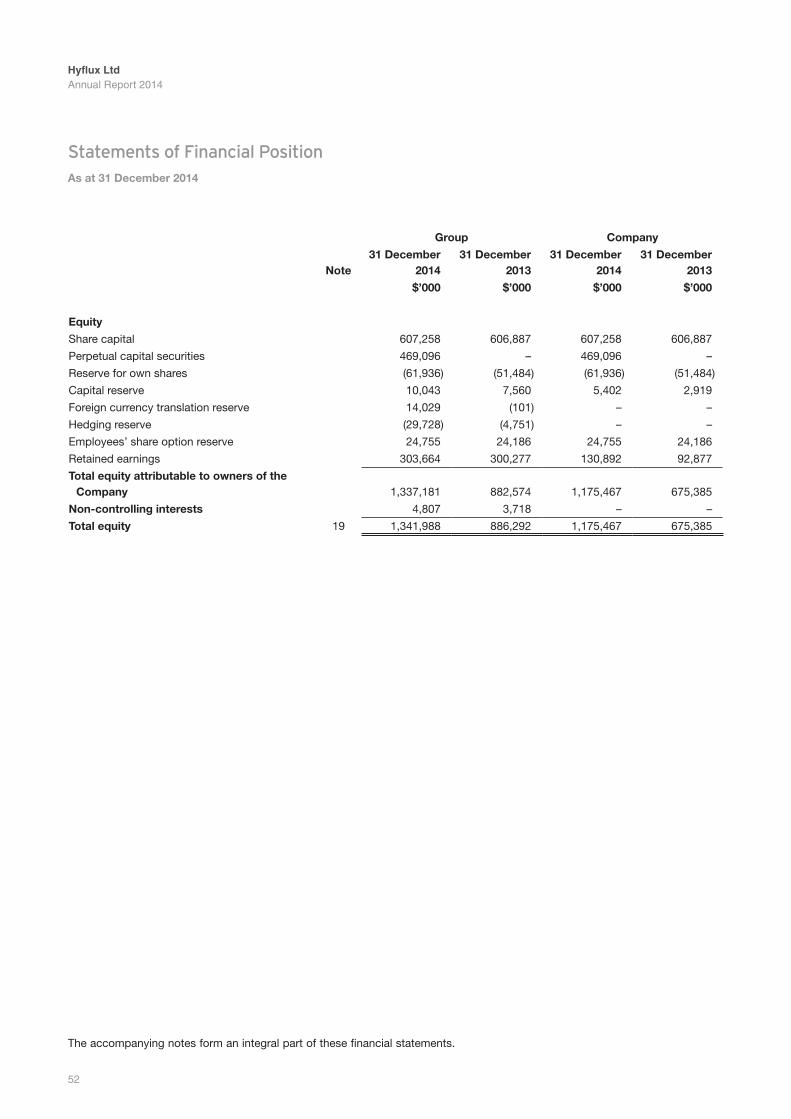
Hyflux LtdAnnual Report 2014
52
The accompanying notes form an integral part of these financial statements.
Group company
note31 December
201431 December
201331 December
201431 December
2013
$’000 $’000 $’000 $’000
equity
Share capital 607,258 606,887 607,258 606,887
Perpetual capital securities 469,096 – 469,096 –
Reserve for own shares (61,936) (51,484) (61,936) (51,484)
Capital reserve 10,043 7,560 5,402 2,919
Foreign currency translation reserve 14,029 (101) – –
Hedging reserve (29,728) (4,751) – –
Employees’ share option reserve 24,755 24,186 24,755 24,186
Retained earnings 303,664 300,277 130,892 92,877
total equity attributable to owners of the company 1,337,181 882,574 1,175,467 675,385
non-controlling interests 4,807 3,718 – –
total equity 19 1,341,988 886,292 1,175,467 675,385
Statements of Financial PositionAs at 31 December 2014
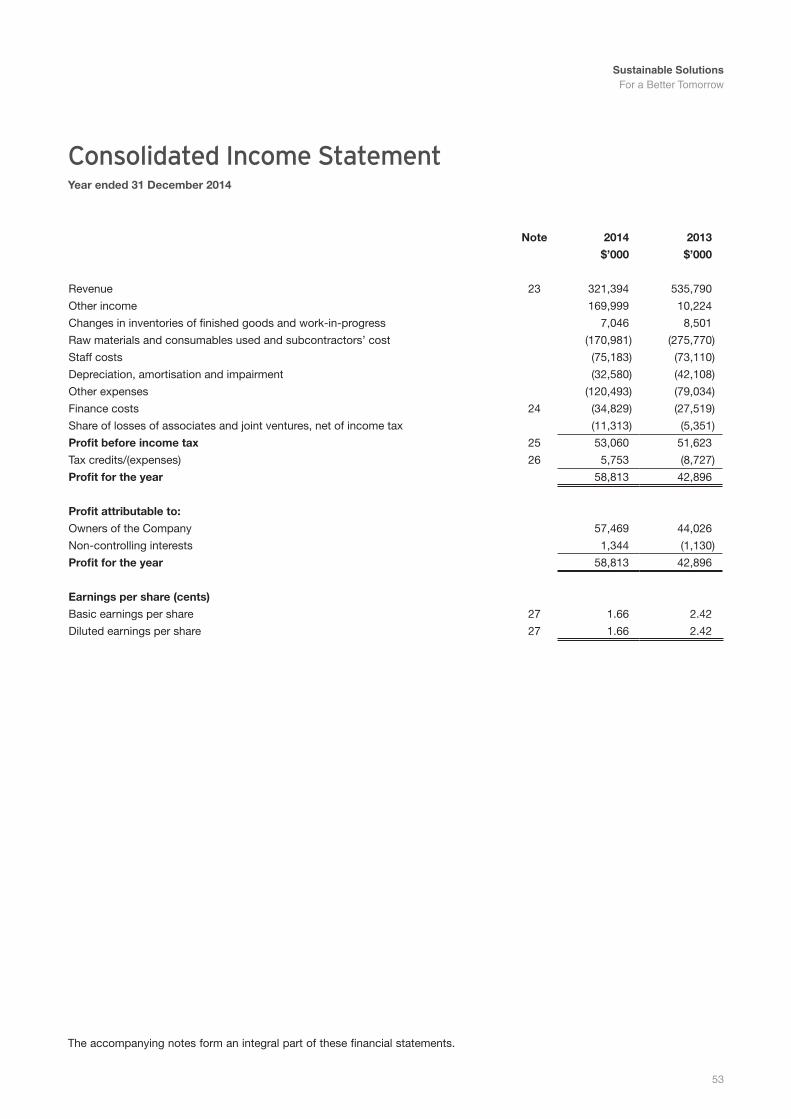
Sustainable Solutions For a Better Tomorrow
53
Consolidated Income StatementYear ended 31 December 2014
The accompanying notes form an integral part of these financial statements.
note 2014 2013
$’000 $’000
Revenue 23 321,394 535,790
Other income 169,999 10,224
Changes in inventories of finished goods and work-in-progress 7,046 8,501
Raw materials and consumables used and subcontractors’ cost (170,981) (275,770)
Staff costs (75,183) (73,110)
Depreciation, amortisation and impairment (32,580) (42,108)
Other expenses (120,493) (79,034)
Finance costs 24 (34,829) (27,519)
Share of losses of associates and joint ventures, net of income tax (11,313) (5,351)
profit before income tax 25 53,060 51,623
Tax credits/(expenses) 26 5,753 (8,727)
profit for the year 58,813 42,896
profit attributable to:
Owners of the Company 57,469 44,026
Non-controlling interests 1,344 (1,130)
profit for the year 58,813 42,896
earnings per share (cents)
Basic earnings per share 27 1.66 2.42
Diluted earnings per share 27 1.66 2.42
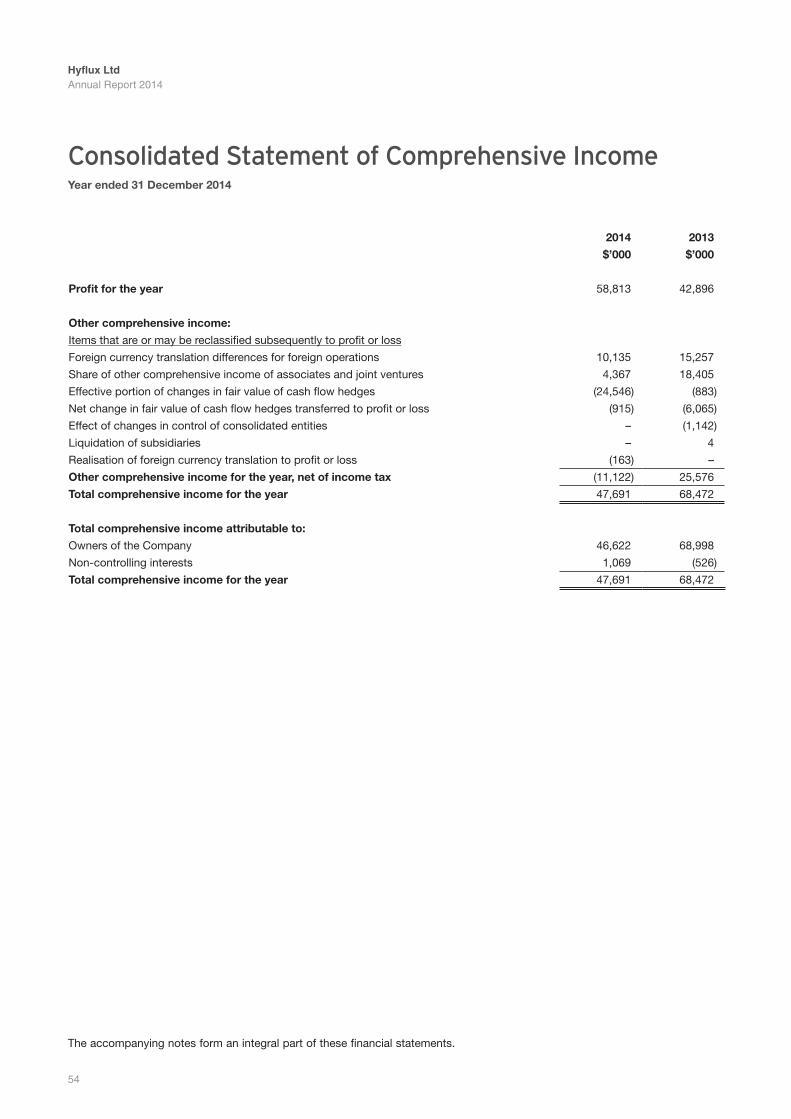
Hyflux LtdAnnual Report 2014
54
Consolidated Statement of Comprehensive IncomeYear ended 31 December 2014
The accompanying notes form an integral part of these financial statements.
2014 2013
$’000 $’000
profit for the year 58,813 42,896
other comprehensive income:
Items that are or may be reclassified subsequently to profit or loss
Foreign currency translation differences for foreign operations 10,135 15,257
Share of other comprehensive income of associates and joint ventures 4,367 18,405
Effective portion of changes in fair value of cash flow hedges (24,546) (883)
Net change in fair value of cash flow hedges transferred to profit or loss (915) (6,065)
Effect of changes in control of consolidated entities – (1,142)
Liquidation of subsidiaries – 4
Realisation of foreign currency translation to profit or loss (163) –
other comprehensive income for the year, net of income tax (11,122) 25,576
total comprehensive income for the year 47,691 68,472
total comprehensive income attributable to:
Owners of the Company 46,622 68,998
Non-controlling interests 1,069 (526)
total comprehensive income for the year 47,691 68,472
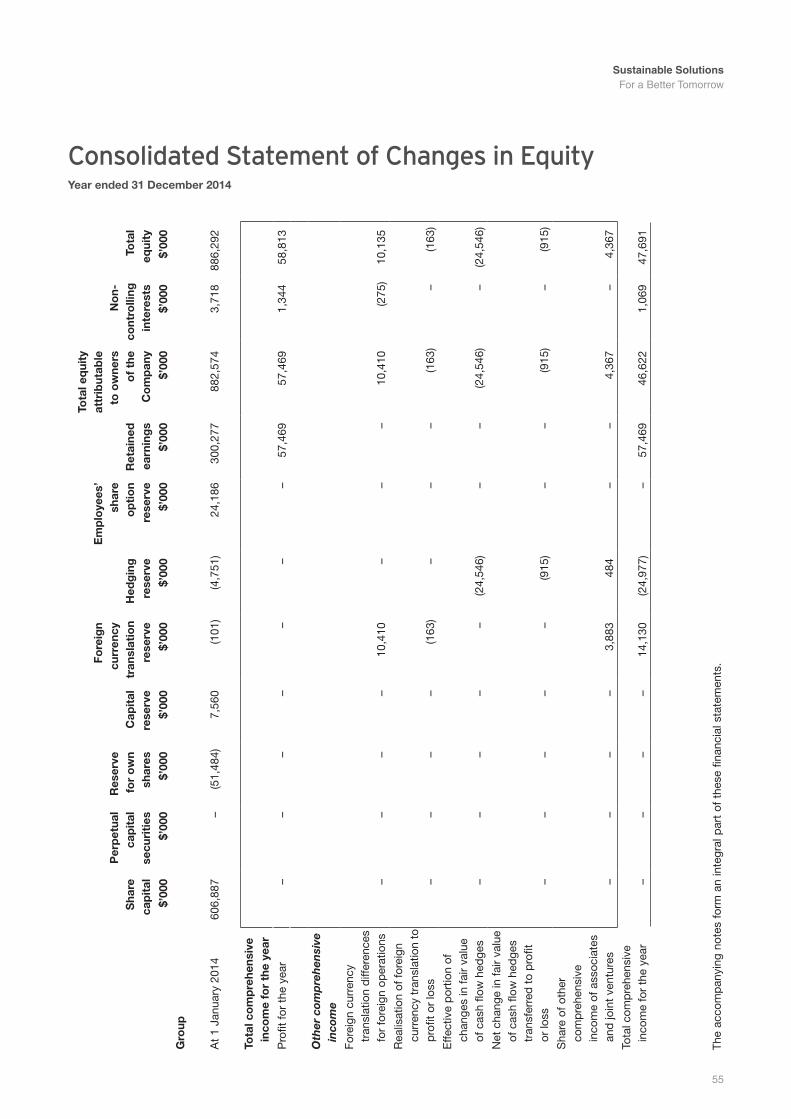
Sustainable Solutions For a Better Tomorrow
55
The
acco
mp
anyi
ng n
otes
for
m a
n in
tegr
al p
art
of t
hese
fina
ncia
l sta
tem
ents
.
Consolidated Statement of Changes in EquityYear ended 31 December 2014
sha
reca
pit
al
per
pet
ual
cap
ital
se
curi
ties
res
erve
for
ow
n sh
ares
cap
ital
rese
rve
Fore
ign
curr
ency
tr
ansl
atio
n re
serv
eh
edg
ing
re
serv
e
em
plo
yees
’ sh
are
op
tio
n re
serv
er
etai
ned
ea
rnin
gs
tota
l eq
uity
attr
ibut
able
to o
wne
rso
f th
ec
om
pan
y
no
n-co
ntro
lling
inte
rest
sto
tal
equi
ty
$’00
0$’
000
$’00
0$’
000
$’00
0$’
000
$’00
0$’
000
$’00
0$’
000
$’00
0
Gro
up
At
1 Ja
nuar
y 20
1460
6,88
7–
(51,
484)
7,56
0(1
01)
(4,7
51)
24,1
8630
0,27
788
2,57
43,
718
886,
292
tota
l co
mp
rehe
nsiv
e in
com
e fo
r th
e ye
ar
Pro
fit fo
r th
e ye
ar–
––
––
––
57,4
6957
,469
1,34
458
,813
Oth
er c
omp
reh
ensi
ve
inco
me
Fore
ign
curr
ency
tr
ansl
atio
n d
iffer
ence
s fo
r fo
reig
n op
erat
ions
––
––
10,4
10–
––
10,4
10(2
75)
10,1
35
Rea
lisat
ion
of fo
reig
n cu
rren
cy t
rans
latio
n to
p
rofit
or
loss
––
––
(163
)–
––
(163
)–
(163
)
Effe
ctiv
e p
ortio
n of
ch
ange
s in
fair
valu
e of
cas
h flo
w h
edge
s–
––
––
(24,
546)
––
(24,
546)
–(2
4,54
6)
Net
cha
nge
in fa
ir va
lue
of c
ash
flow
hed
ges
tran
sfer
red
to
pro
fit
or lo
ss–
––
––
(915
)–
–(9
15)
–(9
15)
Sha
re o
f oth
er
com
pre
hens
ive
inco
me
of a
ssoc
iate
s an
d jo
int
vent
ures
––
––
3,88
348
4–
–4,
367
–4,
367
Tota
l com
pre
hens
ive
inco
me
for
the
year
––
––
14,1
30(2
4,97
7)–
57,4
6946
,622
1,06
947
,691
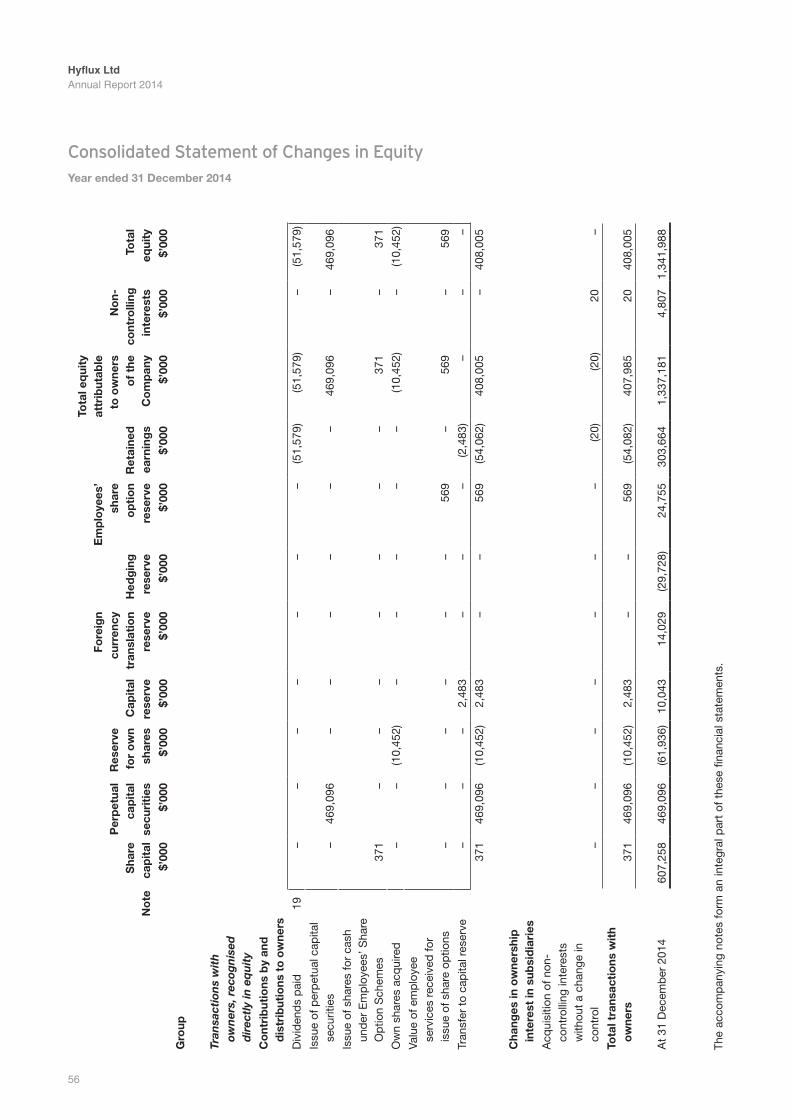
Hyflux LtdAnnual Report 2014
56
no
tes
hare
cap
ital
per
pet
ual
cap
ital
se
curi
ties
res
erve
for
ow
n sh
ares
cap
ital
rese
rve
Fore
ign
curr
ency
tr
ansl
atio
n re
serv
eh
edg
ing
re
serv
e
em
plo
yees
’ sh
are
op
tio
n re
serv
er
etai
ned
ea
rnin
gs
tota
l eq
uity
attr
ibut
able
to o
wne
rs
of
the
co
mp
any
no
n-co
ntro
lling
inte
rest
sto
tal
equi
ty
$’00
0$’
000
$’00
0$’
000
$’00
0$’
000
$’00
0$’
000
$’00
0$’
000
$’00
0
Gro
up
Tran
sact
ion
s w
ith
ow
ner
s, r
ecog
nis
ed
dir
ectl
y in
eq
uit
y
co
ntri
but
ions
by
and
d
istr
ibut
ions
to
ow
ners
Div
iden
ds
pai
d19
––
––
––
–(5
1,57
9)(5
1,57
9)–
(51,
579)
Issu
e of
per
pet
ual c
apita
l se
curit
ies
–46
9,09
6–
––
––
–46
9,09
6–
469,
096
Issu
e of
sha
res
for
cash
un
der
Em
plo
yees
’ Sha
re
Op
tion
Sch
emes
371
––
––
––
–37
1–
371
Ow
n sh
ares
acq
uire
d–
–(1
0,45
2)–
––
––
(10,
452)
–(1
0,45
2)
Valu
e of
em
plo
yee
serv
ices
rec
eive
d fo
r is
sue
of s
hare
op
tions
––
––
––
569
–56
9–
569
Tran
sfer
to
cap
ital r
eser
ve–
––
2,48
3–
––
(2,4
83)
––
–
371
469,
096
(10,
452)
2,48
3–
–56
9(5
4,06
2)40
8,00
5–
408,
005
cha
nges
in o
wne
rshi
p
inte
rest
in s
ubsi
dia
ries
Acq
uisi
tion
of n
on-
cont
rolli
ng in
tere
sts
with
out
a ch
ange
in
cont
rol
––
––
––
–(2
0)(2
0)20
–
tota
l tra
nsac
tio
ns w
ith
ow
ners
371
469,
096
(10,
452)
2,48
3–
–56
9(5
4,08
2)40
7,98
520
408,
005
At
31 D
ecem
ber
201
460
7,25
846
9,09
6(6
1,93
6)10
,043
14,0
29(2
9,72
8)24
,755
303,
664
1,33
7,18
14,
807
1,34
1,98
8
The
acco
mp
anyi
ng n
otes
for
m a
n in
tegr
al p
art
of t
hese
fina
ncia
l sta
tem
ents
.
Consolidated Statement of Changes in EquityYear ended 31 December 2014
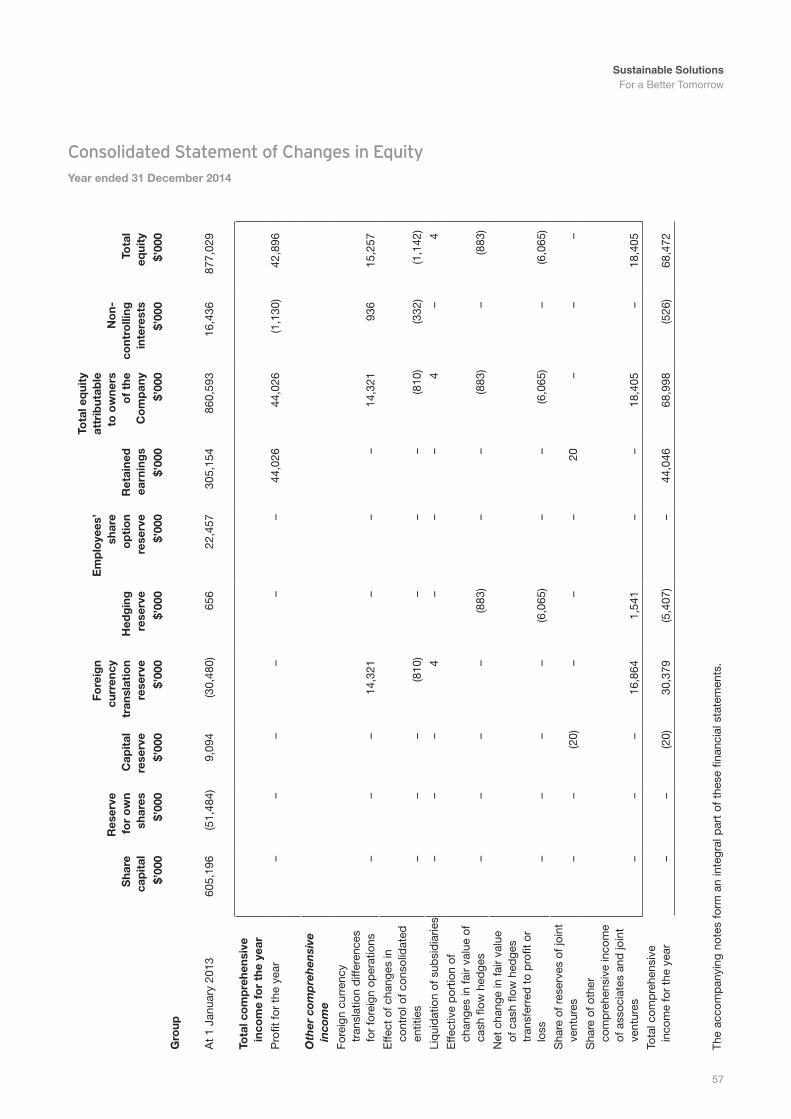
Sustainable Solutions For a Better Tomorrow
57
sha
reca
pit
al
res
erve
for
ow
n sh
ares
cap
ital
rese
rve
Fore
ign
curr
ency
tr
ansl
atio
n re
serv
eh
edg
ing
re
serv
e
em
plo
yees
’ sh
are
op
tio
n re
serv
er
etai
ned
ea
rnin
gs
tota
l eq
uity
attr
ibut
able
to o
wne
rs
of
the
co
mp
any
no
n-co
ntro
lling
inte
rest
sto
tal
equi
ty
$’00
0$’
000
$’00
0$’
000
$’00
0$’
000
$’00
0$’
000
$’00
0$’
000
Gro
up
At
1 Ja
nuar
y 20
1360
5,19
6(5
1,48
4)9,
094
(30,
480)
656
22,4
5730
5,15
486
0,59
316
,436
877,
029
tota
l co
mp
rehe
nsiv
e in
com
e fo
r th
e ye
ar
Pro
fit fo
r th
e ye
ar–
––
––
–44
,026
44,0
26(1
,130
)42
,896
Oth
er c
omp
reh
ensi
ve
inco
me
Fore
ign
curr
ency
tr
ansl
atio
n d
iffer
ence
s fo
r fo
reig
n op
erat
ions
––
–14
,321
––
–14
,321
936
15,2
57
Effe
ct o
f cha
nges
in
cont
rol o
f con
solid
ated
en
titie
s–
––
(810
)–
––
(810
)(3
32)
(1,1
42)
Liq
uid
atio
n of
sub
sid
iarie
s–
––
4–
––
4–
4
Effe
ctiv
e p
ortio
n of
ch
ange
s in
fair
valu
e of
ca
sh fl
ow h
edge
s–
––
–(8
83)
––
(883
)–
(883
)
Net
cha
nge
in fa
ir va
lue
of c
ash
flow
hed
ges
tran
sfer
red
to
pro
fit o
r lo
ss–
––
–(6
,065
)–
–(6
,065
)–
(6,0
65)
Sha
re o
f res
erve
s of
join
t ve
ntur
es–
–(2
0)–
––
20–
––
Sha
re o
f oth
er
com
pre
hens
ive
inco
me
of a
ssoc
iate
s an
d jo
int
vent
ures
––
–16
,864
1,54
1–
–18
,405
–18
,405
Tota
l com
pre
hens
ive
inco
me
for
the
year
––
(20)
30,3
79(5
,407
)–
44,0
4668
,998
(526
)68
,472
The
acco
mp
anyi
ng n
otes
for
m a
n in
tegr
al p
art
of t
hese
fina
ncia
l sta
tem
ents
.
Consolidated Statement of Changes in EquityYear ended 31 December 2014
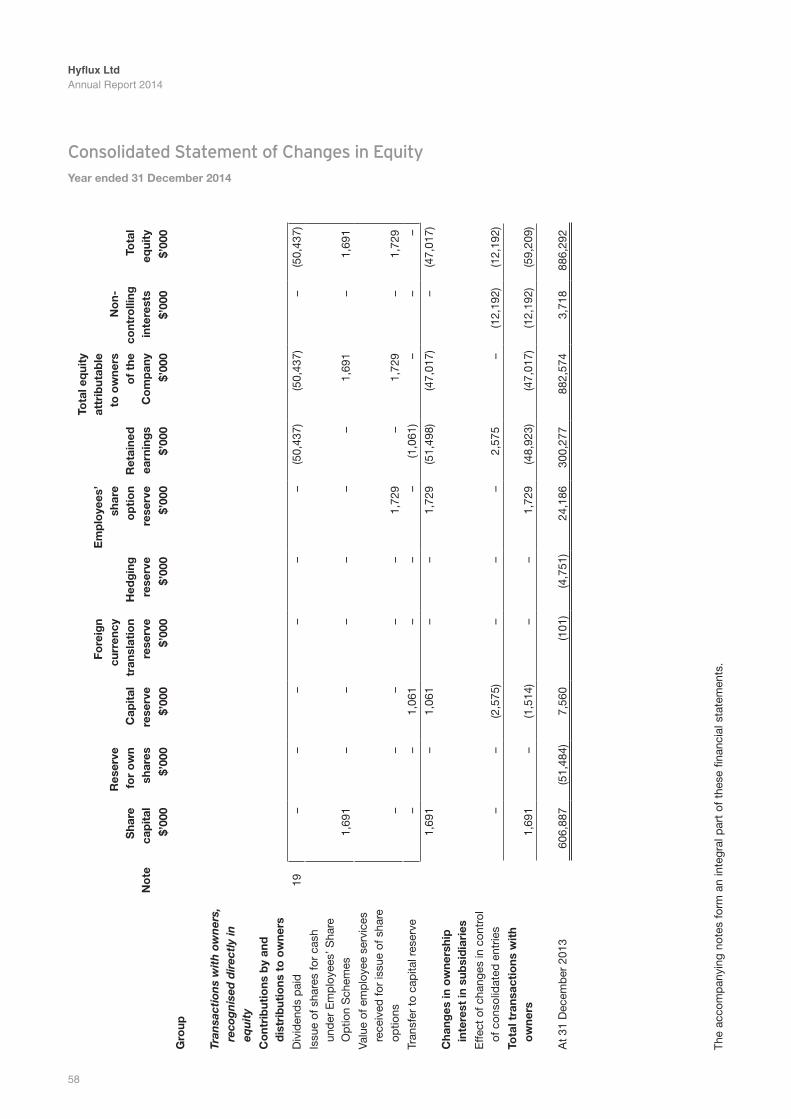
Hyflux LtdAnnual Report 2014
58
no
tes
hare
cap
ital
res
erve
for
ow
n sh
ares
cap
ital
rese
rve
Fore
ign
curr
ency
tran
slat
ion
rese
rve
hed
gin
gre
serv
e
em
plo
yees
’sh
are
op
tio
nre
serv
er
etai
ned
earn
ing
s
tota
l eq
uity
attr
ibut
able
to o
wne
rs
of
the
co
mp
any
no
n-co
ntro
lling
inte
rest
sto
tal
equi
ty
$’00
0$’
000
$’00
0$’
000
$’00
0$’
000
$’00
0$’
000
$’00
0$’
000
Gro
up
Tran
sact
ion
s w
ith
ow
ner
s,
reco
gn
ised
dir
ectl
y in
eq
uit
y
co
ntri
but
ions
by
and
d
istr
ibut
ions
to
ow
ners
Div
iden
ds
pai
d19
––
––
––
(50,
437)
(50,
437)
–(5
0,43
7)
Issu
e of
sha
res
for
cash
un
der
Em
plo
yees
’ Sha
re
Op
tion
Sch
emes
1,69
1–
––
––
–1,
691
–1,
691
Valu
e of
em
plo
yee
serv
ices
re
ceiv
ed fo
r is
sue
of s
hare
op
tions
––
––
–1,
729
–1,
729
–1,
729
Tran
sfer
to
cap
ital r
eser
ve–
–1,
061
––
–(1
,061
)–
––
1,69
1–
1,06
1–
–1,
729
(51,
498)
(47,
017)
–(4
7,01
7)
cha
nges
in o
wne
rshi
p
inte
rest
in s
ubsi
dia
ries
Effe
ct o
f cha
nges
in c
ontr
ol
of c
onso
lidat
ed e
ntrie
s–
–(2
,575
)–
––
2,57
5–
(12,
192)
(12,
192)
tota
l tra
nsac
tio
ns w
ith
ow
ners
1,69
1–
(1,5
14)
––
1,72
9(4
8,92
3)(4
7,01
7)(1
2,19
2)(5
9,20
9)
At
31 D
ecem
ber
201
360
6,88
7(5
1,48
4)7,
560
(101
)(4
,751
)24
,186
300,
277
882,
574
3,71
888
6,29
2
The
acco
mp
anyi
ng n
otes
for
m a
n in
tegr
al p
art
of t
hese
fina
ncia
l sta
tem
ents
.
Consolidated Statement of Changes in EquityYear ended 31 December 2014
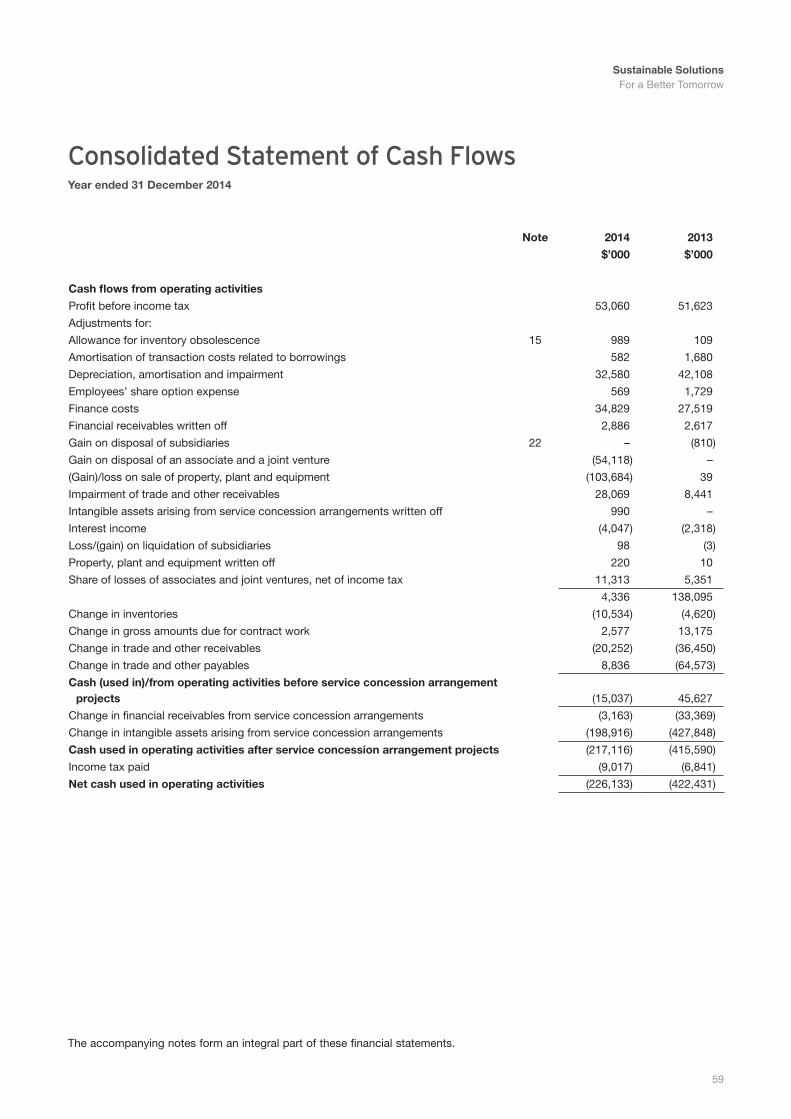
Sustainable Solutions For a Better Tomorrow
59
Consolidated Statement of Cash FlowsYear ended 31 December 2014
The accompanying notes form an integral part of these financial statements.
note 2014 2013
$’000 $’000
cash flows from operating activities
Profit before income tax 53,060 51,623
Adjustments for:
Allowance for inventory obsolescence 15 989 109
Amortisation of transaction costs related to borrowings 582 1,680
Depreciation, amortisation and impairment 32,580 42,108
Employees’ share option expense 569 1,729
Finance costs 34,829 27,519
Financial receivables written off 2,886 2,617
Gain on disposal of subsidiaries 22 – (810)
Gain on disposal of an associate and a joint venture (54,118) –
(Gain)/loss on sale of property, plant and equipment (103,684) 39
Impairment of trade and other receivables 28,069 8,441
Intangible assets arising from service concession arrangements written off 990 –
Interest income (4,047) (2,318)
Loss/(gain) on liquidation of subsidiaries 98 (3)
Property, plant and equipment written off 220 10
Share of losses of associates and joint ventures, net of income tax 11,313 5,351
4,336 138,095
Change in inventories (10,534) (4,620)
Change in gross amounts due for contract work 2,577 13,175
Change in trade and other receivables (20,252) (36,450)
Change in trade and other payables 8,836 (64,573)
cash (used in)/from operating activities before service concession arrangement projects (15,037) 45,627
Change in financial receivables from service concession arrangements (3,163) (33,369)
Change in intangible assets arising from service concession arrangements (198,916) (427,848)
cash used in operating activities after service concession arrangement projects (217,116) (415,590)
Income tax paid (9,017) (6,841)
net cash used in operating activities (226,133) (422,431)
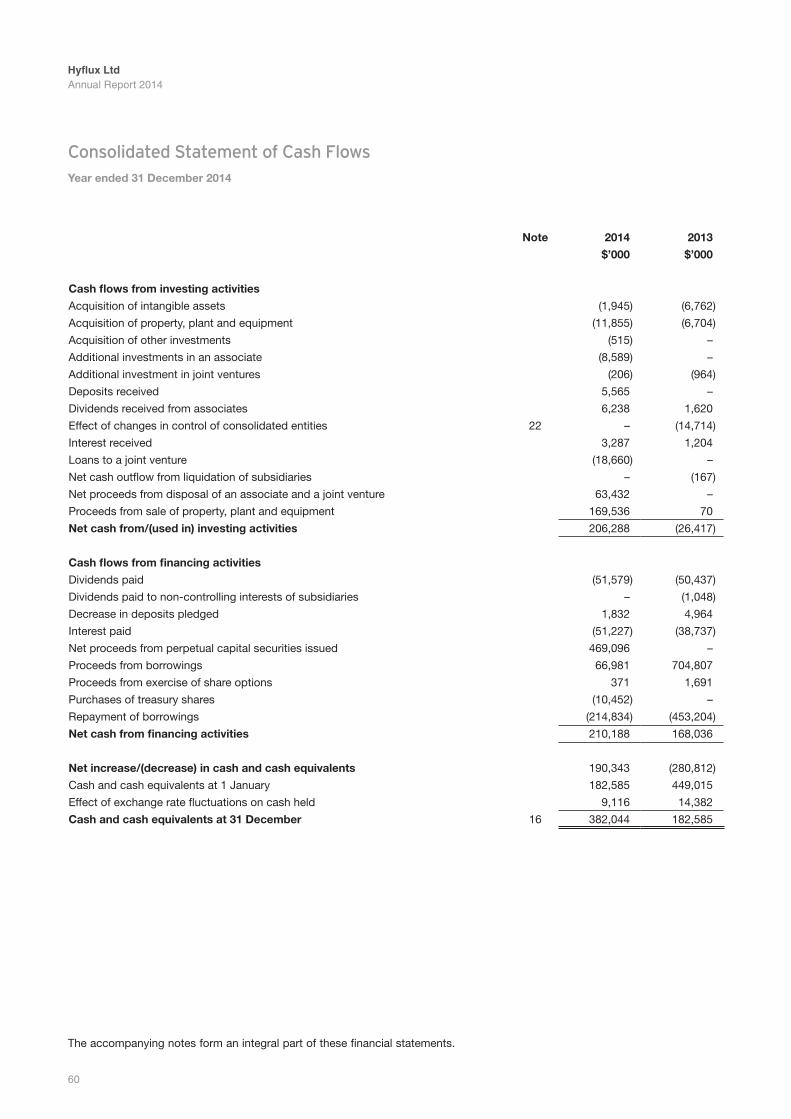
Hyflux LtdAnnual Report 2014
60
The accompanying notes form an integral part of these financial statements.
note 2014 2013
$’000 $’000
cash flows from investing activities
Acquisition of intangible assets (1,945) (6,762)
Acquisition of property, plant and equipment (11,855) (6,704)
Acquisition of other investments (515) –
Additional investments in an associate (8,589) –
Additional investment in joint ventures (206) (964)
Deposits received 5,565 –
Dividends received from associates 6,238 1,620
Effect of changes in control of consolidated entities 22 – (14,714)
Interest received 3,287 1,204
Loans to a joint venture (18,660) –
Net cash outflow from liquidation of subsidiaries – (167)
Net proceeds from disposal of an associate and a joint venture 63,432 –
Proceeds from sale of property, plant and equipment 169,536 70
net cash from/(used in) investing activities 206,288 (26,417)
cash flows from financing activities
Dividends paid (51,579) (50,437)
Dividends paid to non-controlling interests of subsidiaries – (1,048)
Decrease in deposits pledged 1,832 4,964
Interest paid (51,227) (38,737)
Net proceeds from perpetual capital securities issued 469,096 –
Proceeds from borrowings 66,981 704,807
Proceeds from exercise of share options 371 1,691
Purchases of treasury shares (10,452) –
Repayment of borrowings (214,834) (453,204)
net cash from financing activities 210,188 168,036
net increase/(decrease) in cash and cash equivalents 190,343 (280,812)
Cash and cash equivalents at 1 January 182,585 449,015
Effect of exchange rate fluctuations on cash held 9,116 14,382
cash and cash equivalents at 31 December 16 382,044 182,585
Consolidated Statement of Cash FlowsYear ended 31 December 2014

Sustainable Solutions For a Better Tomorrow
61
Notes to the Financial Statements
These notes form an integral part of the financial statements.
The financial statements were authorised for issue by the Board of Directors on 26 March 2015.
1 DomiciLe AnD Activities
Hyflux Ltd (the Company) is incorporated in the Republic of Singapore. The address of the Company’s registered office is Hyflux Innovation Centre, 80 Bendemeer Road, Singapore 339949.
The financial statements of the Group as at and for the year ended 31 December 2014 comprise the Company and its subsidiaries (together referred to as the Group and individually as Group entities) and the Group’s interests in associates and joint ventures.
The principal activities of the Company are those relating to investment holding.
The principal activities of the subsidiaries comprise the following:
Water– Seawater desalination, raw water purification, wastewater cleaning, water recycling, water reclamation and ultra
pure water production for municipal and industrial clients as well as home consumer filtration and purification products;and
– Design, construction and sale of water treatment plants, seawater desalination plants, wastewater treatment plants and water recycling plants under service concession arrangements.
energy– Design, construction and operation of power plants and trading in the electricity markets.
2 BAsis oF prepArAtion
2.1 Statement of compliance
The financial statements have been prepared in accordance with the Singapore Financial Reporting Standards (FRS).
2.2 Basis of measurement
The financial statements have been prepared on the historical cost basis except for derivative financial instruments which are measured at fair value.
2.3 Functional and presentation currency
These financial statements are presented in Singapore dollars (SGD), which is the Company’s functional currency. Other significant entities within the Group have Chinese Renminbi, SGD, US dollars and Algerian Dinar as their functional currency. All financial information presented in Singapore dollars has been rounded to the nearest thousand, unless otherwise stated.
Hyflux LtdAnnual Report 2014
62
Notes to the Financial Statements
2.4 Use of estimates and judgements
The preparation of the financial statements in conformity with FRSs requires management to make judgements, estimates and assumptions that affect the application of accounting policies and the reported amounts of assets, liabilities, income and expenses. Actual results may differ from these estimates.
Estimates and underlying assumptions are reviewed on an ongoing basis. Revisions to accounting estimates are recognised in the period in which the estimates are revised and in any future periods affected.
Information about assumptions and estimation uncertainties that have a significant risk of resulting in a material adjustment within the next financial year are included in the following notes:
• Note 4 – key assumptions used in discounted cash flow projections, residual values and useful livesofproperty,plantandequipment;
• Note5 – usefullivesandrecoverabilityofintangibleassets;• Note 6 and 29 – fair value measurement of intangible assets arising from service concession
arrangements;• Note10 – valuationofotherinvestments;• Note21 – recoverabilityoftradeandotherreceivablesandgrossamountsduefromcontractwork;
and• Note 33 – contingencies.
2.5 Changes in accounting policies
The Group has adopted all new or revised FRSs and INT FRSs that became mandatory from 1 January 2014. The adoption of these new FRSs and INT FRSs has no significant impact to the Group.
3 siGniFicAnt AccountinG poLicies
The accounting policies set out below have been applied consistently to all periods presented in these financial statements, and have been applied consistently by Group entities.
3.1 Basis of consolidation
Business combinations
Business combinations are accounted for using the acquisition method as at the acquisition date, which is the date on which control is transferred to the Group. Control is the power to govern the financial and operating policies of an entity so as to obtain benefits from its activities. In assessing control, the Group takes into consideration potential voting rights that are currently exercisable.
The consideration transferred does not include amounts related to the settlement of pre-existing relationships. Such amounts are generally recognised in profit or loss.
Any contingent consideration payable is recognised at fair value at the acquisition date. If the contingent consideration is classified as equity, it is not remeasured and settlement is accounted for within equity. Otherwise, subsequent changes to the fair value of the contingent consideration are recognised in profit or loss.
Sustainable Solutions For a Better Tomorrow
63
Notes to the Financial Statements
When share-based payment awards (replacement awards) are exchanged for awards held by the acquiree’s employees (acquiree’s awards) and relate to past services, then all or a portion of the amount of the acquirer’s replacement awards is included in measuring the consideration transferred in the business combination. This determination is based on the market-based value of the replacement awards compared with the market-based value of the acquiree’s awards and the extent to which the replacement awards relate to past and/or future service.
Non-controlling interests that are present ownership interests and entitle their holders to a proportionate share of the acquiree’s net assets in the event of liquidation are measured either at fair value or at the non-controlling interests’ proportionate share of the recognised amounts of the acquiree’s identifiable net assets, at the acquisition date. The measurement basis taken is elected on a transaction-by-transaction basis. All other non-controlling interests are measured at acquisition-date fair value or, when applicable, on the basis specified in another standard.
Costs related to the acquisition, other than those associated with the issue of debt or equity securities, that the Group incurs in connection with a business combination are expensed as incurred.
Acquisition of non-controlling interests
Changes in the Group’s interest in a subsidiary that do not result in a loss of control are accounted for as transactions with owners in their capacity as owners and therefore no adjustments are made to goodwill and no gain or loss is recognised in profit or loss. Adjustments to non-controlling interests arising from transactions that do not involve the loss of control are based on a proportionate amount of the net assets of the subsidiary.
Subsidiaries
Subsidiaries are entities controlled by the Group. The Group controls an entity when it is exposed to, or has rights to, variable returns from its involvement with the entity and has the ability to affect those returns through its power over the entity. The financial statements of subsidiaries are included in the consolidated financial statements from the date that control commences until the date that control ceases.
The accounting policies of subsidiaries have been changed when necessary to align them with the policies adopted by the Group. Losses applicable to the non-controlling interests in a subsidiary are allocated to the non-controlling interests even if doing so causes the non-controlling interests to have a deficit balance.
Loss of control
Upon the loss of control, the Group derecognises the assets and liabilities of the subsidiary, any non-controlling interests and the other components of equity related to the subsidiary. Any surplus or deficit arising from the loss of control is recognised in profit or loss. If the Group retains any interest in the previous subsidiary, then such interest is measured at fair value at the date that control is lost. Subsequently, it is accounted for as a joint arrangement, an equity-accounted investee, as an available-for-sale financial asset, or as a financial asset at fair value through profit or loss depending on the level of influence retained.
Hyflux LtdAnnual Report 2014
64
Notes to the Financial Statements
Joint arrangements
Joint arrangements are arrangements of which the Group has joint control, established by contracts requiring unanimous consent for decisions about the activities that significantly affect the arrangements’ returns. They are classified and accounted for as follows:
• Joint operation - when the Group has rights to the assets, and obligations for the liabilities, relating to an arrangement, it accounts for each of its assets, liabilities and transactions, including its share of those held or incurred jointly, in relation to the joint operation.
• Joint venture - when the Group has rights only to the net assets of the arrangements, it accounts for its interest using the equity method, as for associates (see notes on Associates below).
Associates
Associates are those entities in which the Group has significant influence, but not control, over the financial and operating policies of these entities. Significant influence is presumed to exist when the Group holds between 20% and 50% of voting power of another entity.
Associates are accounted for using the equity method and are recognised initially at cost. The cost of investments includes transaction costs. The consolidated financial statements include the Group’s share of the profit or loss and other comprehensive income of associates, after adjustments to align the accounting policies with those of the Group, from the date that significant influence commences until the date that significant influence ceases.
When the Group’s share of losses exceeds its interest in an associate, the carrying amount of that interest, including any long-term investments, is reduced to zero, and the recognition of further losses is discontinued except to the extent that the Group has an obligation to fund the associate’s operations or has made payments on behalf of the associate.
Transactions eliminated on consolidation
Intra-group balances and transactions, and any unrealised income and expenses arising from intra-group transactions, are eliminated in preparing the consolidated financial statements.
Unrealised gains arising from transactions with equity-accounted associates and joint ventures are eliminated against the investment to the extent of the Group’s interest in the associates and joint ventures. Unrealised losses are eliminated in the same way as unrealised gains, but only to the extent that there is no evidence of impairment.
Accounting for subsidiaries, joint arrangements and associates in the separate financial statements
Investments in subsidiaries, joint ventures and associates are stated in the Company’s statement of financial position at cost less accumulated impairment losses.
3.2 Foreign currency
Foreign currency transactions
Transactions in foreign currencies are translated to the respective functional currencies of Group entities at the exchange rates at the dates of the transactions. Monetary assets and liabilities denominated in foreign currencies at the end of the reporting date are retranslated to the functional currency at the exchange rate at that date. The foreign currency gain or loss on monetary items is the difference between amortised cost in the functional currency at the beginning of the year, adjusted for effective interest and payments during the year, and the amortised cost in foreign currency translated at the exchange rate at the end of the year.
Sustainable Solutions For a Better Tomorrow
65
Notes to the Financial Statements
Non-monetary assets and liabilities denominated in foreign currencies that are measured at fair value are retranslated to the functional currency at the exchange rate at the date that the fair value was determined. Non-monetary items in a foreign currency that are measured in terms of historical cost are translated using the exchange rate at the date of the transaction. Foreign currency differences arising on retranslation are recognised in profit or loss, except for differences which are recognised in other comprehensive income arising on the retranslation of available-for-sale equity instruments (except on impairment in which case foreign currency differences that have been recognised in other comprehensive incomearereclassifiedtoprofitorloss);andqualifyingcashflowhedgestotheextentthehedgeiseffective.
Foreign operations
The assets and liabilities of foreign operations, excluding goodwill and fair value adjustments arising on acquisition, are translated to Singapore dollars at exchange rates at the end of the reporting date. The income and expenses of foreign operations are translated to Singapore dollars at exchange rates at the dates of the transactions. Goodwill and fair value adjustments arising on the acquisition of a foreign operation on or after 1 January 2005 are treated as assets and liabilities of the foreign operation and translated at the exchange rates at the end of the reporting period. For acquisitions prior to 1 January 2005, the exchange rates at the date of acquisition were used.
Foreign currency differences are recognised in other comprehensive income, and presented in the foreign currency translation reserve (translation reserve) in equity. However, if the foreign operation is a non-wholly-owned subsidiary, then the relevant proportionate share of the translation difference is allocated to the non-controlling interests. When a foreign operation is disposed of such that control, significant influence or joint control is lost, the cumulative amount in the translation reserve related to that foreign operation is reclassified to profit or loss as part of the gain or loss on disposal. When the Group disposes of only part of its interest in a subsidiary that includes a foreign operation while retaining control, the relevant proportion of the cumulative amount is reattributed to non-controlling interests. When the Group disposes of only part of its investment in an associate or joint venture that includes a foreign operation while retaining significant influence or joint control, the relevant proportion of the cumulative amount is reclassified to profit or loss.
When the settlement of a monetary item receivable from or payable to a foreign operation is neither planned nor likely to occur in the foreseeable future, foreign exchange gains and losses arising from such a monetary item that are considered to form part of a net investment in a foreign operation are recognised in other comprehensive income, and are presented as equity in the translation reserve.
3.3 Financial instruments
Non-derivative financial assets
The Group initially recognises loans and receivables and deposits on the date that they are originated. All other financial assets (including assets designated at fair value through profit or loss) are recognised initially on the trade date, which is the date the Group becomes a party to the contractual provisions of the instrument.
The Group derecognises a financial asset when the contractual rights to the cash flows from the asset expire, or it transfers the rights to receive the contractual cash flows on the financial asset in a transaction in which substantially all the risks and rewards of ownership of the financial asset are transferred. Any interest in transferred financial assets that is created or retained by the Group is recognised as a separate asset or liability.
Financial assets and liabilities are offset and the net amount presented in the statement of financial position when, and only when, the Group has a legal right to offset the amounts and intends either to settle on a net basis or to realise the asset and settle the liability simultaneously.
The Group classifies non-derivative financial assets into the following categories: financial assets at fair value through profit or loss, loans and receivables and available-for-sale financial assets.
Hyflux LtdAnnual Report 2014
66
Notes to the Financial Statements
Financial assets at fair value through profit or loss
A financial asset is classified at fair value through profit or loss if it is designated as such upon initial recognition. Financial assets are designated at fair value through profit or loss if the Group manages such investments and makes purchase and sale decisions based on their fair value in accordance with the Group’s documented risk management or investment strategy. Attributable transaction costs are recognised in profit or loss as incurred. Financial assets at fair value through profit or loss are measured at fair value, and changes therein, which takes into account any dividend income, are recognised in profit or loss.
Financial assets designated at fair value through profit or loss comprise equity securities that otherwise would have been classified as available for sale.
Loans and receivables
Loans and receivables are financial assets with fixed or determinable payments that are not quoted in an active market. Such assets are recognised initially at fair value plus any directly attributable transaction costs. Subsequent to initial recognition, loans and receivables are measured at amortised cost using the effective interest method, less any impairment losses.
Loans and receivables comprise cash and cash equivalents, trade and other receivables, including financial receivables arising from service concession arrangements and gross amounts due from contract work.
Cash and cash equivalents
Cash and cash equivalents comprise cash balances and bank deposits.
For the purpose of the statement of cash flows, pledged deposits are excluded whilst bank overdrafts that are repayable on demand and that form an integral part of the Group’s cash management are included in cash and cash equivalents.
Service concession arrangements
The Group recognises a financial asset arising from a service concession arrangement when it has an unconditional contractual right to receive cash or another financial asset from or at the direction of the grantor for the construction or upgrade services provided. Such financial assets are measured at fair value upon initial recognition. Subsequent to initial recognition, the financial assets are measured at amortised cost.
If the Group is paid for the construction services partly by a financial asset and partly by an intangible asset, then each component of the consideration is accounted for separately and is recognised initially at the fair value of the consideration (see also note 3.5).
Available-for-sale financial assets
Available-for-sale financial assets are non-derivative financial assets that are designated as available-for-sale or are not classified in any of the above categories of financial assets. Available-for-sale financial assets are recognised initially at fair value plus any directly attributable transaction costs. Subsequent to initial recognition, they are measured at fair value and changes therein, other than impairment losses and foreign currency differences on available-for-sale debt instruments, are recognised in other comprehensive income and presented in the fair value reserve in equity. When an investment is derecognised, the gain or loss accumulated in equity is reclassified to profit or loss.
Sustainable Solutions For a Better Tomorrow
67
Notes to the Financial Statements
Non-derivative financial liabilities
The Group initially recognised debt securities issued and subordinated liabilities on the date that they are originated. Financial liabilities for contingent consideration payable in a business combination are recognised at the acquisition date. All other financial liabilities (including liabilities designated at fair value through profit or loss) are recognised initially on the trade date, which is the date that the Group becomes a party to the contractual provisions of the instrument.
The Group derecognises a financial liability when its contractual obligations are discharged, cancelled or expired.
Financial assets and liabilities are offset and the net amount presented in the statement of financial position when, and only when, the Group has a legal right to offset the amounts and intends either to settle on a net basis or to realise the asset and settle the liability simultaneously.
The Group classifies non-derivative financial liabilities into the other financial liabilities category. Such financial liabilities are recognised initially at fair value plus any directly attributable transaction costs. Subsequent to initial recognition, these financial liabilities are measured at amortised cost using the effective interest method.
Other financial liabilities comprise loans and borrowings, and trade and other payables.
Intra-group financial guarantees
Financial guarantees are financial instruments issued by the Group that require the issuer to make specified payments to reimburse the holder for the loss it incurs because a specified debtor fails to meet payment when due in accordance with the original or modified terms of a debt instrument.
Financial guarantee contracts are accounted for as insurance contracts and treated as contingent liabilities until such time as they become probable that the Company will be required to make a payment under the guarantee. A provision is recognised based on the Group’s estimate of the ultimate cost of settling all claims incurred but unpaid at the balance sheet date. The provision is assessed by reviewing individual claims and tested for adequacy by comparing the amount recognised and the amount that would be required to settle the guarantee contract.
Share capital
Ordinary shares
Ordinary shares are classified as equity. Incremental costs directly attributable to the issue of ordinary shares and share options are recognised as a deduction from equity, net of any tax effects.
Preference share capital
Preference share capital is classified as equity as it is non-redeemable, or redeemable only at the Company’s option, and any dividends are discretionary. Discretionary dividends thereon are recognised as distributions within equity upon approval by the Board of Directors.
Perpetual capital securities
The perpetual capital securities do not have a maturity date and the Company is able to elect to defer making a distribution subject to the terms and conditions of the securities issue. Accordingly, the Company is not considered to have a contractual obligation to make principal repayments or distributions in respect of its perpetual capital securities issue and the perpetual capital securities are presented within equity. Distributions are treated as dividends which will be directly debited from equity. Costs directly attributable to the issue of the perpetual capital securities are deducted against the proceeds from the issue.
Hyflux LtdAnnual Report 2014
68
Notes to the Financial Statements
Repurchase, disposal and reissue of share capital (treasury shares)
When share capital recognised as equity is repurchased, the amount of the consideration paid, which includes directly attributable costs, net of any tax effects, is recognised as a deduction from equity. Repurchased shares are classified as treasury shares and are presented in the reserve for own share account. When treasury shares are sold or reissued subsequently, the amount received is recognised as an increase in equity, and the resulting surplus or deficit on the transaction is transferred to/from retained earnings.
Derivative financial instruments, including hedge accounting
The Group holds derivative financial instruments to hedge its foreign currency and interest rate risk exposures. Embedded derivatives are separated from the host contract and accounted for separately if the economic characteristics and risks of the host contract and the embedded derivative are not closely related, a separate instrument with the same terms as the embedded derivative would meet the definition of a derivative, and the combined instrument is not measured at fair value through profit or loss.
On initial designation of the derivative as the hedging instrument, the Group formally documents the relationship between the hedging instrument and the hedged item, including the risk management objectives and strategy in undertaking the hedge transaction and the hedged risk, together with the methods that will be used to assess the effectiveness of the hedging relationship. The Group makes an assessment, both at the inception of the hedge relationship as well as on an ongoing basis, of whether the hedging instruments are expected to be “highly effective” in offsetting the changes in the fair value or cash flows of the respective hedged items attributable to the hedged risk, and whether the actual results of each hedge are within a range of 80% - 125%. For a cash flow hedge of a forecast transaction, the transaction should be highly probable to occur and should present an exposure to variations in cash flows that could ultimately affect reported profit or loss.
Derivativesarerecognisedinitiallyatfairvalue;attributabletransactioncostsarerecognisedinprofitorlossasincurred.Subsequent to initial recognition, derivatives are measured at fair value, and changes therein are accounted for as described below.
Cash flow hedges
When a derivative is designated as the hedging instrument in a hedge of the variability in cash flows attributable to a particular risk associated with a recognised asset or liability or a highly probable forecast transaction that could affect profit or loss, the effective portion of changes in the fair value of the derivative is recognised in other comprehensive income and presented in the hedging reserve in equity. Any ineffective portion of changes in the fair value of the derivative is recognised immediately in profit or loss.
When the hedged item is a non-financial asset, the amount accumulated in equity is included in the carrying amount of the asset when the asset is recognised. In other cases, the amount accumulated in equity is reclassified to profit or loss in the same period that the hedged item affects profit or loss. If the hedging instrument no longer meets the criteria for hedge accounting, expires or is sold, terminated or exercised, or the designation is revoked, then hedge accounting is discontinued prospectively. If the forecast transaction is no longer expected to occur, then the balance in equity is reclassified to profit or loss.
Separable embedded derivatives
Changes in the fair value of separated embedded derivatives are recognised immediately in profit or loss.
Other non-trading derivatives
When a derivative financial instrument is not designated in a hedge relationship that qualifies for hedge accounting, all changes in its fair value are recognised immediately in profit or loss.
Sustainable Solutions For a Better Tomorrow
69
Notes to the Financial Statements
3.4 Property, plant and equipment
Recognition and measurement
Items of property, plant and equipment are measured at cost less accumulated depreciation and accumulated impairment losses.
Cost includes expenditure that is directly attributable to the acquisition of the asset. The cost of self-constructed assets includes the cost of materials and direct labour, any other costs directly attributable to bringing the assets to a working condition for their intended use, when the Group has an obligation to move the asset or restore the site, an estimate of the costs of dismantling and removing the items and restoring the site on which they are located, and capitalised borrowing costs.
Cost may also include transfers from equity of any gain or loss on qualifying cash flow hedges of foreign currency purchases of property, plant and equipment.
Purchased software that is integral to the functionality of the related equipment is capitalised as part of that equipment.
When parts of an item of property, plant and equipment have different useful lives, they are accounted for as separate items (major components) of property, plant and equipment.
The gain and loss on disposal of an item of property, plant and equipment is determined by comparing the proceeds from disposal with the carrying amount of property, plant and equipment, and is recognised net within other income/expenses in profit or loss.
Subsequent costs
The cost of replacing a component of an item of property, plant and equipment is recognised in the carrying amount of the item if it is probable that the future economic benefits embodied within the component will flow to the Group, and its cost can be measured reliably. The carrying amount of the replaced component is derecognised. The costs of the day-to-day servicing of property, plant and equipment are recognised in profit or loss as incurred.
Depreciation
Depreciation is based on the cost of an asset, less its residual value. Significant components of individual assets are assessed and if a component has a useful life that is different from the remainder of that asset, that component is depreciated separately.
Depreciation is recognised in profit or loss on a straight-line basis over the estimated useful lives of each component of an item of property, plant and equipment, since this most closely reflects the expected pattern of consumption of the future economic benefits embodied in the asset. Leased assets are depreciated over the shorter of the lease term and their useful lives unless it is reasonably certain that the Group will obtain ownership by the end of the lease term. Construction-in-progress is not depreciated.
Depreciation is recognised from the date that the property, plant and equipment are installed and are ready for use, or in respect of internally constructed assets, from the date that the asset is completed and ready for use.
Hyflux LtdAnnual Report 2014
70
Notes to the Financial Statements
The estimated useful lives for the current and comparative years are as follows:
Plant and machinery – 4 to 10 yearsMotor vehicles – 4 to 5 yearsComputers – 1 to 5 yearsOffice equipment – 4 to 5 yearsLeasehold properties and improvements – 4 to 5 years or over the lease period ranging from 5 to 30 yearsFurniture and fittings – 4 to 5 years
Depreciation methods, useful lives and residual values are reviewed at the end of each reporting period and adjusted if appropriate.
3.5 Intangible assets
Goodwill
Goodwill that arises upon the acquisition of subsidiaries is included in intangible assets. The Group measures goodwill at the acquisition date as:
• thefairvalueoftheconsiderationtransferred;plus• therecognisedamountofanynon-controllinginterestsintheacquiree;plus• if the business combination is achieved in stages, the fair value of the existing equity interest in the acquiree,
over the net recognised amount (generally fair value) of the identifiable assets acquired and liabilities assumed.
When the excess is negative, a bargain purchase gain is recognised immediately in profit or loss.
Subsequent measurement
Goodwill is measured at cost less accumulated impairment losses. In respect of equity-accounted investees, the carrying amount of goodwill is included in the carrying amount of the investment, and an impairment loss on such an investment is not allocated to any asset, including goodwill, that forms part of the carrying amount of the equity-accounted investee.
Research and development
Expenditure on research activities, undertaken with the prospect of gaining new scientific or technical knowledge and understanding, is recognised in profit or loss as incurred.
Development activities involve a plan or design for the production of new or substantially improved products and processes. Development expenditure is capitalised only if development costs can be measured reliably, the product or process is technically and commercially feasible, future economic benefits are probable, and the Group intends to and has sufficient resources to complete development and to use or sell the asset. The expenditure capitalised includes the cost of materials, direct labour, overhead costs that are directly attributable to preparing the asset for its intended use, and capitalised borrowing costs. Other development expenditure is recognised in profit or loss as incurred.
Capitalised development expenditure is measured at cost less accumulated amortisation and accumulated impairment losses.
Sustainable Solutions For a Better Tomorrow
71
Notes to the Financial Statements
Service concession arrangements
The Group recognises an intangible asset arising from a service concession arrangement when it has a right to charge for usage of the concession infrastructure. An intangible asset received as consideration for providing construction or upgrade services in a service concession arrangement is measured at fair value upon initial recognition by reference to the fair value of the services provided. Subsequent to initial recognition the intangible asset is measured at cost, which includes capitalised borrowing costs, less accumulated amortisation and accumulated impairment losses.
Other intangible assets
Other intangible assets that are acquired by the Group and have finite useful lives are measured at cost less accumulated amortisation and accumulated impairment losses.
Subsequent expenditure
Subsequent expenditure is capitalised only when it increases the future economic benefits embodied in the specific asset to which it relates. All other expenditure, including expenditure on internally generated goodwill and brands, is recognised in profit or loss as incurred.
Amortisation
Amortisation is calculated based on the cost of the asset, less its residual value.
Amortisation is recognised in profit or loss on a straight-line basis over the estimated useful lives of intangible assets, other than goodwill, from the date that they are available for use, since this most closely reflects the expected pattern of consumption of the future economic benefits embodied in the asset. The estimated useful lives for the current and comparative years are as follows:
Intellectual property rights – 10 yearsCapitalised development costs – 8 yearsLicensing fees – 10 to 20 yearsService concession arrangements – 20 to 30 years
Amortisation methods, useful lives and residual values are reviewed at the end of each reporting period and adjusted if appropriate.
The estimated useful life of an intangible asset in a service concession arrangement is the period from when the Group is able to charge for the use of the infrastructure to the end of the concession period.
3.6 Leased assets
Leases in which the Group assumes substantially all the risks and rewards of ownership are classified as finance leases. Upon initial recognition, the leased asset is measured at an amount equal to the lower of its fair value and the present value of the minimum lease payments. Subsequent to initial recognition, the asset is accounted for in accordance with the accounting policy applicable to that asset.
Other leases are operating leases and are not recognised in the Group’s statement of financial position.
Hyflux LtdAnnual Report 2014
72
Notes to the Financial Statements
3.7 Inventories
Inventories are measured at the lower of cost and net realisable value. The cost of inventories is based on the weighted average cost principle, and includes expenditure incurred in acquiring the inventories, production or conversion costs and other costs incurred in bringing them to their existing location and condition. In the case of manufactured inventories and work in progress, the use of standard costing includes an appropriate share of production overheads based on normal operating capacity. Cost may also include transfers from equity of any gain or loss on qualifying cash flow hedges of foreign currency purchases of inventories.
Net realisable value is the estimated selling price in the ordinary course of business, less the estimated costs of completion and selling expenses.
3.8 Gross amounts due for contract work
Gross amounts due for contract work represent the gross unbilled amount expected to be collected from customers for contract work performed to date. It is measured at cost plus profit recognised to date less progress billings and recognised losses. Cost includes all expenditure related directly to specific projects and an allocation of fixed and variable overheads incurred in the Group’s contract activities based on normal operating capacity.
Gross amounts due for contract work are presented as part of assets in the statement of financial position for all contracts in which costs incurred plus recognised profits exceed progress billings. If progress billings exceed costs incurred plus recognised profits, the difference is presented as part of trade and other payables in the statement of financial position.
3.9 Impairment
Non-derivative financial assets
A financial asset not carried at fair value through profit or loss is assessed at the end of each reporting period to determine whether there is objective evidence that it is impaired. A financial asset is impaired if objective evidence indicates that a loss event has occurred after the initial recognition of the asset, and that the loss event had a negative effect on the estimated future cash flows of that asset that can be estimated reliably.
Objective evidence that financial assets are impaired can include default or delinquency by a debtor, restructuring of an amount due to the Group on terms that the Group would not consider otherwise, and indications that a debtor will enter bankruptcy.
Loans and receivables
The Group considers evidence of impairment for loans and receivables at both a specific asset and collective level. All individually significant loans and receivables are assessed for specific impairment. All individually significant receivables found not to be specifically impaired are then collectively assessed for any impairment that has been incurred but not yet identified. Loans and receivables that are not individually significant are collectively assessed for impairment by grouping together loans and receivables with similar risk characteristics.
In assessing collective impairment, the Group uses historical trends of the probability of default, the timing of recoveries and the amount of loss incurred, adjusted for management’s judgement as to whether current economic and credit conditions are such that the actual losses are likely to be greater or less than suggested by historical trends.
Sustainable Solutions For a Better Tomorrow
73
Notes to the Financial Statements
An impairment loss in respect of a financial asset measured at amortised cost is calculated as the difference between its carrying amount and the present value of the estimated future cash flows, discounted at the asset’s original effective interest rate. Losses are recognised in profit or loss and reflected in an allowance account against loans and receivables. Interest on the impaired asset continues to be recognised. When a subsequent event causes the amount of impairment loss to decrease, the decrease in impairment loss is reversed through profit or loss.
Available-for-sale financial assets
Impairment losses on available-for-sale investment securities are recognised by reclassifying the losses accumulated in the fair value reserve in equity to profit or loss. The cumulative loss that is reclassified from equity to profit or loss is the difference between the acquisition cost, net of any principal repayment and amortisation, and the current fair value, less any impairment loss previously recognised in profit or loss. Changes in cumulative impairment provisions attributable to time value are reflected as a component of interest income. If, in a subsequent period, the fair value of an impaired available-for-sale debt security increases and the increase can be related objectively to an event occurring after the impairment loss was recognised, then the impairment loss is reversed. The amount of the reversal is recognised in profit or loss. However, any subsequent recovery in the fair value of an impaired available-for-sale equity security is recognised in other comprehensive income.
An impairment loss in respect of an associate or a joint arrangement is measured by comparing the recoverable amount of the investment with its carrying amount in accordance with the section below. An impairment loss is recognised in profit or loss. An impairment loss is reversed if there has been favourable change in the estimates used to determine the recoverable amount.
Non-financial assets
The carrying amounts of the Group’s non-financial assets are reviewed at each reporting date to determine whether there is any indication of impairment. If any such indication exists, then the asset’s recoverable amount is estimated. For goodwill and intangible assets that have indefinite useful lives or that are not yet available for use, the recoverable amount is estimated each year at the same time. An impairment loss is recognised if the carrying amount of an asset or its related cash-generating unit (CGU) exceeds its estimated recoverable amount.
The recoverable amount of an asset or CGU is the greater of its value in use and its fair value less costs to sell. In assessing value in use, the estimated future cash flows are discounted to their present value using a pre-tax discount rate that reflects current market assessments of the time value of money and the risks specific to the asset or CGU. For the purpose of impairment testing, assets that cannot be tested individually are grouped together into the smallest group of assets that generates cash inflows from continuing use that are largely independent of the cash inflows of other assets or CGU. Subject to an operating segment ceiling test, for the purposes of goodwill impairment testing, CGUs to which goodwill has been allocated are aggregated so that the level at which impairment testing is performed reflects the lowest level at which goodwill is monitored for internal reporting purposes. Goodwill acquired in a business combination is allocated to groups of CGUs that are expected to benefit from the synergies of the combination.
The Group’s corporate assets do not generate separate cash inflows and are utilised by more than one CGU. Corporate assets are allocated to CGUs on a reasonable and consistent basis and tested for impairment as part of the testing of the CGU to which the corporate asset is allocated.
Impairment losses are recognised in profit or loss. Impairment losses recognised in respect of CGUs are allocated first to reduce the carrying amount of any goodwill allocated to the CGU (group of CGUs), and then to reduce the carrying amounts of the other assets in the CGU (group of CGUs) on a pro rata basis.

Hyflux LtdAnnual Report 2014
74
Notes to the Financial Statements
An impairment loss in respect of goodwill is not reversed. In respect of other assets, impairment losses recognised in prior periods are assessed at each reporting date for any indications that the loss has decreased or no longer exists. An impairment loss is reversed if there has been a change in the estimates used to determine the recoverable amount. An impairment loss is reversed only to the extent that the asset’s carrying amount does not exceed the carrying amount that would have been determined, net of depreciation or amortisation, if no impairment loss had been recognised.
Goodwill that forms part of the carrying amount of an investment in an associate and joint venture is not recognised separately, and therefore is not tested for impairment separately. Instead, the entire amount of the investment in an associate and joint venture is tested for impairment as a single asset when there is objective evidence that the investment in an associate or joint venture may be impaired.
3.10 Non-current assets held for sale
Non-current assets, or disposal groups comprising assets and liabilities, that are expected to be recovered primarily through sale rather than through continuing use, are classified as held for sale. Immediately before classification as held for sale, the assets, or components of a disposal group, are remeasured in accordance with the Group’s accounting policies. Thereafter, generally the assets, or disposal group, are generally measured at the lower of their carrying amount and fair value less costs to sell. Any impairment loss on a disposal group is first allocated to goodwill, and then to remaining assets and liabilities on a pro rata basis, except that no loss is allocated to inventories, financial assets, deferred tax assets, employee benefit assets, and investment property, which continue to be measured in accordance with the Group’s accounting policies. Impairment losses on initial classification as held for sale, and subsequent gains or losses on remeasurement, are recognised in profit or loss. Gains are not recognised in excess of any cumulative impairment loss.
Intangible assets and property, plant and equipment once classified as held for sale are not amortised or depreciated. In addition, equity accounting of associates and joint ventures ceases once classified as held for sale.
3.11 Employee benefits
Defined contribution plans
A defined contribution plan is a post-employment benefit plan under which an entity pays fixed contributions into a separate entity and will have no legal or constructive obligation to pay further amounts. Obligations for contributions to defined contribution pension plans are recognised as an employee benefit expense in profit or loss in the periods during which related services are rendered by employees.
Short-term employee benefits
Short-term employee benefit obligations are measured on an undiscounted basis and are expensed as the related service is provided. A liability is recognised for the amount expected to be paid under short-term cash bonus or profit-sharing plans if the Group has a present legal or constructive obligation to pay this amount as a result of past service provided by the employee, and the obligation can be estimated reliably.
Share-based payment transactions
The grant date fair value of share-based payment awards granted to employees is recognised as an employee expense, with a corresponding increase in equity, over the period that the employees unconditionally become entitled to the awards. The amount recognised as an expense is adjusted to reflect the number of awards for which the related service and non-market performance conditions are expected to be met, such that the amount ultimately recognised as an expense is based on the number of awards that do meet the related service and non-market performance conditions at the vesting date. For share-based payment awards with non-vesting conditions, the grant date fair value of the share-based payment is measured to reflect such conditions and there is no true-up for differences between expected and actual outcomes.
Sustainable Solutions For a Better Tomorrow
75
Notes to the Financial Statements
The fair value of the amount payable to employees in respect of share appreciation rights, which are settled in cash, is recognised as an expense with a corresponding increase in liabilities, over the period that the employees become unconditionally entitled to payment. The liability is remeasured at each reporting date and at settlement date. Any changes in the fair value of the liability are recognised as personnel expense in profit or loss.
Share-based payment arrangements in which the Group receives goods or services as consideration for its own equity instruments are accounted for as equity-settled share-based payment transactions, regardless of how the equity instruments are obtained by the Group.
3.12 Provisions
A provision is recognised if, as a result of a past event, the Group has a present legal or constructive obligation that can be estimated reliably, and it is probable that an outflow of economic benefits will be required to settle the obligation. Provisions are determined by discounting the expected future cash flows at a pre-tax rate that reflects current market assessments of the time value of money and the risks specific to the liability. The unwinding of the discount is recognised as finance cost.
3.13 Revenue
Construction revenue - Construction contracts and sale of plants under service concession arrangements
Contract revenue includes the initial amount agreed in the contract plus any variations in contract work, claims and incentive payments, to the extent that it is probable that they will result in revenue and can be measured reliably. As soon as the outcome of a construction contract can be estimated reliably, contract revenue is recognised in profit or loss in proportion to the stage of completion of the contract. Contract expenses are recognised as incurred unless they create an asset related to future contract activity.
The stage of completion is assessed by reference to the proportion that contract costs incurred for work performed to date bear to the estimated total contract costs. When the outcome of a construction contract cannot be estimated reliably, contract revenue is recognised only to the extent of contract costs incurred that are likely to be recoverable. An expected loss on a contract is recognised immediately in profit or loss. Net revenue from the sale of plants under service concession arrangements previously not recognised as construction revenue under the service concession arrangements is recognised when significant risks and rewards of ownership have been transferred to the buyer, recovery of the consideration is probable, the associated costs can be estimated reliably, and the amount of revenue can be measured reliably.
Revenue relating to construction or upgrade services under a service concession arrangement is recognised based on the stage of completion of the work performed, consistent with the Group’s accounting policy on recognising revenue on construction contract (see above). Operation or service revenue is recognised in the period in which the services are provided by the Group. When the Group provides more than one service in a service concession arrangement, the consideration received is allocated by reference to the relative fair values of the services delivered.
Operating and maintenance income
Revenue from the provision of operating and maintenance services is recognised when the services are rendered.
Hyflux LtdAnnual Report 2014
76
Notes to the Financial Statements
Sale of goods
Revenue from the sale of goods in the course of ordinary activities is measured at the fair value of the consideration received or receivable, net of returns, trade discounts and volume rebates. Revenue is recognised when significant risks and rewards of ownership have been transferred to the customer, recovery of the consideration is probable, the associated costs and possible return of goods can be estimated reliably, there is no continuing management involvement with the goods, and the amount of revenue can be measured reliably. If it is probable that discounts will be granted and the amount can be measured reliably, the discount is recognised as a reduction of revenue as the sales are recognised.
Transfers of risks and rewards occur upon delivery to customers.
Finance income
Finance income represents the interest income on the financial receivable arising from a service concession arrangement, and is recognised in profit or loss using the effective interest method.
Others
Rental income from investment property is recognised in profit or loss on a straight-line basis over the term of the lease. Lease incentives granted are recognised as an integral part of the total rental income, over the term of the lease.
Interest income from funds invested (including available-for-sale financial assets) is recognised as it accrues as other income in profit or loss, using the effective interest method.
3.14 Government grants
Government grants are deducted against the carrying amounts of the assets when there is reasonable assurance that government grants will be received to compensate the Group for the cost of an asset and the Group will comply with the conditions associated with the grant. Grants that compensate the Group for expenses incurred are recognised in profit or loss as other income.
3.15 Lease payments
Payments made under operating leases are recognised in profit or loss on a straight-line basis over the term of the lease. Lease incentives received are recognised as an integral part of the total lease expense, over the term of the lease.
Minimum lease payments made under finance leases are apportioned between the finance expense and the reduction of the outstanding liability. The finance expense is allocated to each period during the lease term so as to produce a constant periodic rate of interest on the remaining balance of the liability.
Contingent lease payments are accounted for by revising the minimum lease payments over the remaining term of the lease when the lease adjustment is confirmed.
Determining whether an arrangement contains a lease
At inception of an arrangement, the Group determines whether such an arrangement is or contains a lease. A specific asset is the subject of a lease if fulfilment of the arrangement is dependent on the use of that specified asset. An arrangement conveys the right to use the asset if the arrangement conveys to the Group the right to control the use of the underlying asset.
Sustainable Solutions For a Better Tomorrow
77
Notes to the Financial Statements
3.16 Finance costs
Finance costs comprise interest expense on borrowings that are recognised in profit or loss. Borrowing costs that are not directly attributable to the acquisition, construction or production of a qualifying asset are recognised in profit or loss using the effective interest method.
3.17 Tax
Tax expense comprises current and deferred tax. Current tax and deferred tax are recognised in profit or loss except to the extent that it relates to a business combination, or items recognised directly in equity or in other comprehensive income.
Current tax is the expected tax payable or receivable on the taxable income or loss for the year, using tax rates enacted or substantively enacted at the reporting date, and any adjustment to tax payable in respect of previous years.
Deferred tax is recognised in respect of temporary differences between the carrying amounts of assets and liabilities for financial reporting purposes and the amounts used for taxation purposes. Deferred tax is not recognised for:
• temporary differences on the initial recognition of assets or liabilities in a transaction that is not a business combinationandthataffectsneitheraccountingnortaxableprofitorloss;
• temporary differences related to investments in subsidiaries and jointly controlled entities to the extent that the Group is able to control the timing of reversal of the temporary difference and it is probable that they will not reverseintheforeseeablefuture;and
• taxable temporary differences arising on the initial recognition of goodwill.
The measurement of deferred taxes reflects the tax consequences that would follow the manner in which the Group expects, at the end of the reporting period, to recover or settle the carrying amount of its assets and liabilities. Deferred tax is measured at the tax rates that are expected to be applied to temporary differences when they reverse, based on the laws that have been enacted or substantively enacted by the reporting date.
Deferred tax assets and liabilities are offset if there is a legally enforceable right to offset current tax liabilities and assets, and they relate to taxes levied by the same tax authority on the same taxable entity, or on different tax entities, but they intend to settle current tax liabilities and assets on a net basis or their tax assets and liabilities will be realised simultaneously.
A deferred tax asset is recognised for unused tax losses, tax credits and deductible temporary differences, to the extent that it is probable that future taxable profits will be available against which they can be utilised. Deferred tax assets are reviewed at each reporting date and are reduced to the extent that it is no longer probable that the related tax benefit will be realised.
In determining the amount of current and deferred tax, the Group takes into account the impact of uncertain tax positions and whether additional taxes and interest may be due. The Group believes that its accruals for tax liabilities are adequate for all open tax years based on its assessment of many factors, including interpretations of tax law and prior experience. This assessment relies on estimates and assumptions and may involve a series of judgements about future events. New information may become available that causes the Group to change its judgement regarding the adequacy of existing tax liabilities. Such changes to tax liabilities will impact tax expense in the period that such a determination is made.
Hyflux LtdAnnual Report 2014
78
Notes to the Financial Statements
3.18 Earnings per share
The Group presents basic and diluted earnings per share (EPS) data for its ordinary shares. Basic EPS is calculated by dividing the profit or loss attributable to ordinary shareholders of the Company by the weighted average number of ordinary shares outstanding during the year, adjusted for own shares held. Diluted EPS is determined by adjusting the profit or loss attributable to ordinary shareholders and the weighted average number of ordinary shares outstanding, adjusted for own shares held for the effects of all dilutive potential ordinary shares, which comprise share options granted to employees and directors. Share options have a dilutive effect only when the average market price of ordinary shares during the period exceeds the exercise price of the share options (i.e. they are ‘in the money’). Both basic and diluted EPS of the Group are adjusted for the effect of any provision for dividends on preference shares and perpetual capital securities.
3.19 Segment reporting
An operating segment is a component of the Group that engages in business activities from which it may earn revenues and incur expenses, including revenues and expenses that relate to transactions with any of the Group’s other components. All operating segments’ operating results are reviewed regularly by the Group’s CEO (the chief operating decision maker) to make decisions about resources to be allocated to the segment and assess its performance, and for which discrete financial information is available.
Segment results that are reported to the Group’s CEO include items directly attributable to a segment as well as those that can be allocated on a reasonable basis. Unallocated items comprise mainly corporate assets and liabilities, head office expenses, and tax assets and liabilities.
Segment capital expenditure is the total cost incurred during the year to acquire property, plant and equipment, and intangible assets other than goodwill.
3.20 New standards and interpretations not yet adopted
A number of new standards, amendments to standards and interpretations are effective for annual periods beginning after 1 January 2014, and have not been applied in preparing these financial statements. None of these are expected to have a significant effect on the financial statements of the Group and the Company.
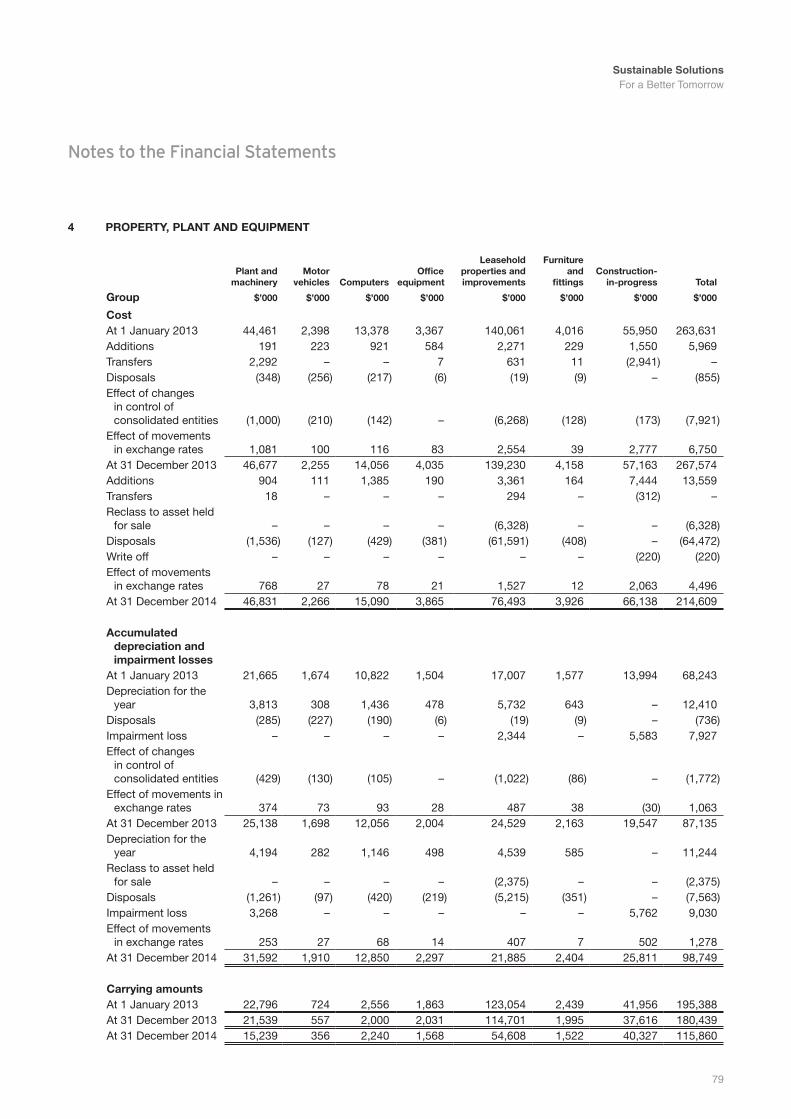
Sustainable Solutions For a Better Tomorrow
79
Notes to the Financial Statements
4 propertY, pLAnt AnD equipment
plant andmachinery
motorvehicles computers
office equipment
Leaseholdproperties andimprovements
Furnitureand
fittingsconstruction-
in-progress total
Group $’000 $’000 $’000 $’000 $’000 $’000 $’000 $’000
costAt 1 January 2013 44,461 2,398 13,378 3,367 140,061 4,016 55,950 263,631Additions 191 223 921 584 2,271 229 1,550 5,969Transfers 2,292 – – 7 631 11 (2,941) –Disposals (348) (256) (217) (6) (19) (9) – (855)Effect of changes
in control of consolidated entities (1,000) (210) (142) – (6,268) (128) (173) (7,921)
Effect of movements in exchange rates 1,081 100 116 83 2,554 39 2,777 6,750
At 31 December 2013 46,677 2,255 14,056 4,035 139,230 4,158 57,163 267,574Additions 904 111 1,385 190 3,361 164 7,444 13,559Transfers 18 – – – 294 – (312) –Reclass to asset held
for sale – – – – (6,328) – – (6,328)Disposals (1,536) (127) (429) (381) (61,591) (408) – (64,472)Write off – – – – – – (220) (220)Effect of movements
in exchange rates 768 27 78 21 1,527 12 2,063 4,496At 31 December 2014 46,831 2,266 15,090 3,865 76,493 3,926 66,138 214,609
Accumulated depreciation and impairment losses
At 1 January 2013 21,665 1,674 10,822 1,504 17,007 1,577 13,994 68,243Depreciation for the
year 3,813 308 1,436 478 5,732 643 – 12,410Disposals (285) (227) (190) (6) (19) (9) – (736)Impairment loss – – – – 2,344 – 5,583 7,927Effect of changes
in control of consolidated entities (429) (130) (105) – (1,022) (86) – (1,772)
Effect of movements in exchange rates 374 73 93 28 487 38 (30) 1,063
At 31 December 2013 25,138 1,698 12,056 2,004 24,529 2,163 19,547 87,135Depreciation for the
year 4,194 282 1,146 498 4,539 585 – 11,244Reclass to asset held
for sale – – – – (2,375) – – (2,375)Disposals (1,261) (97) (420) (219) (5,215) (351) – (7,563)Impairment loss 3,268 – – – – – 5,762 9,030Effect of movements
in exchange rates 253 27 68 14 407 7 502 1,278At 31 December 2014 31,592 1,910 12,850 2,297 21,885 2,404 25,811 98,749
carrying amountsAt 1 January 2013 22,796 724 2,556 1,863 123,054 2,439 41,956 195,388At 31 December 2013 21,539 557 2,000 2,031 114,701 1,995 37,616 180,439At 31 December 2014 15,239 356 2,240 1,568 54,608 1,522 40,327 115,860
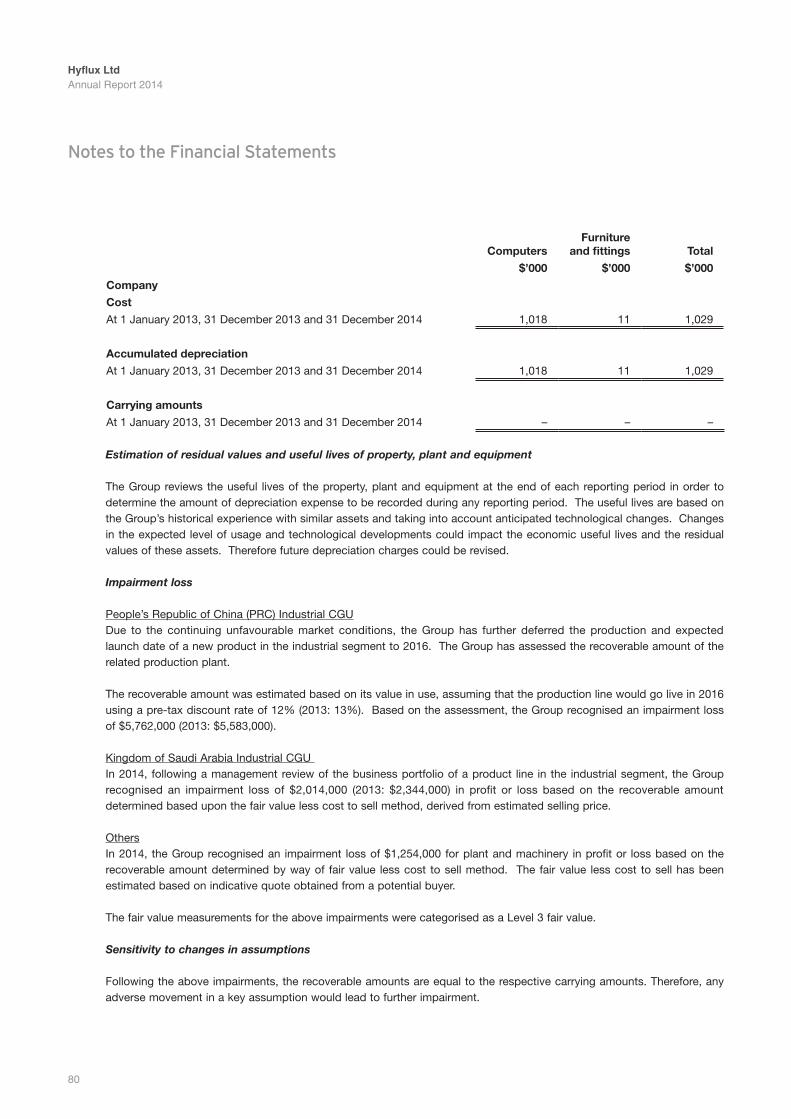
Hyflux LtdAnnual Report 2014
80
Notes to the Financial Statements
computersFurniture
and fittings total
$’000 $’000 $’000
company
cost
At 1 January 2013, 31 December 2013 and 31 December 2014 1,018 11 1,029
Accumulated depreciation
At 1 January 2013, 31 December 2013 and 31 December 2014 1,018 11 1,029
carrying amounts
At 1 January 2013, 31 December 2013 and 31 December 2014 – – –
Estimation of residual values and useful lives of property, plant and equipment
The Group reviews the useful lives of the property, plant and equipment at the end of each reporting period in order to determine the amount of depreciation expense to be recorded during any reporting period. The useful lives are based on the Group’s historical experience with similar assets and taking into account anticipated technological changes. Changes in the expected level of usage and technological developments could impact the economic useful lives and the residual values of these assets. Therefore future depreciation charges could be revised.
Impairment loss
People’s Republic of China (PRC) Industrial CGUDue to the continuing unfavourable market conditions, the Group has further deferred the production and expected launch date of a new product in the industrial segment to 2016. The Group has assessed the recoverable amount of the related production plant.
The recoverable amount was estimated based on its value in use, assuming that the production line would go live in 2016 using a pre-tax discount rate of 12% (2013: 13%). Based on the assessment, the Group recognised an impairment loss of $5,762,000 (2013: $5,583,000).
Kingdom of Saudi Arabia Industrial CGU In 2014, following a management review of the business portfolio of a product line in the industrial segment, the Group recognised an impairment loss of $2,014,000 (2013: $2,344,000) in profit or loss based on the recoverable amount determined based upon the fair value less cost to sell method, derived from estimated selling price.
OthersIn 2014, the Group recognised an impairment loss of $1,254,000 for plant and machinery in profit or loss based on the recoverable amount determined by way of fair value less cost to sell method. The fair value less cost to sell has been estimated based on indicative quote obtained from a potential buyer.
The fair value measurements for the above impairments were categorised as a Level 3 fair value.
Sensitivity to changes in assumptions
Following the above impairments, the recoverable amounts are equal to the respective carrying amounts. Therefore, any adverse movement in a key assumption would lead to further impairment.
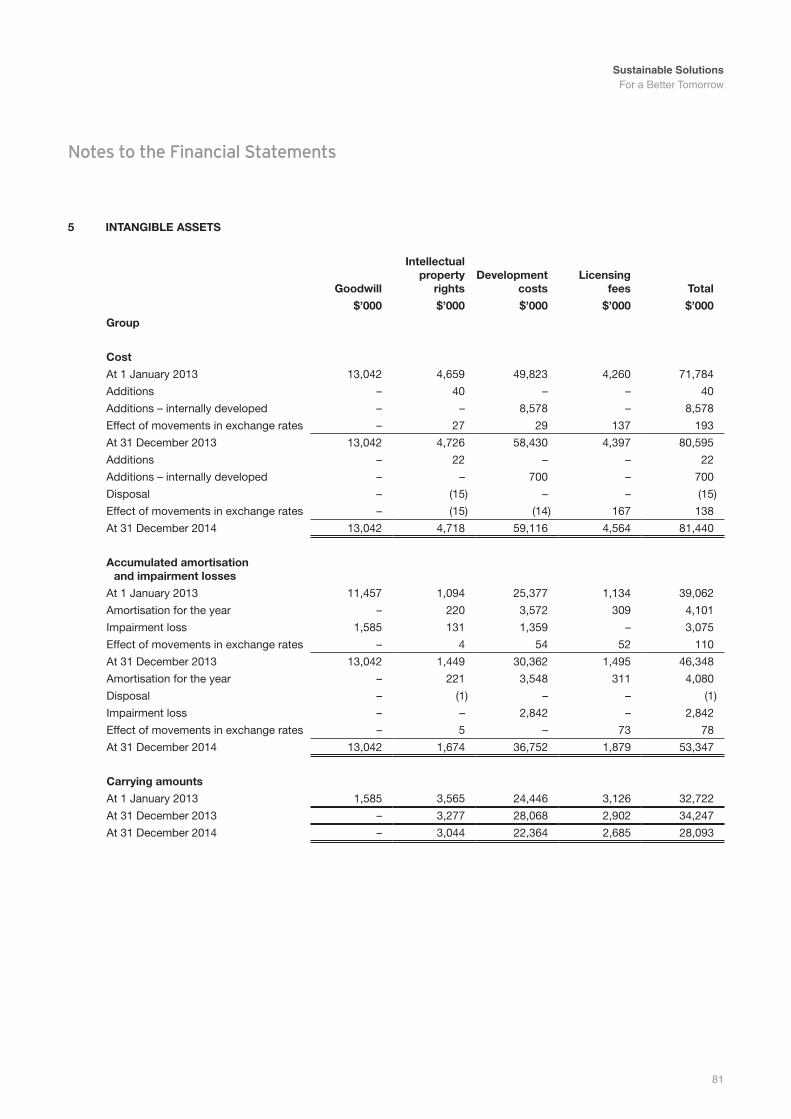
Sustainable Solutions For a Better Tomorrow
81
Notes to the Financial Statements
5 intAnGiBLe Assets
Goodwill
intellectual property
rights Development
costsLicensing
fees total
$’000 $’000 $’000 $’000 $’000
Group
cost
At 1 January 2013 13,042 4,659 49,823 4,260 71,784
Additions – 40 – – 40
Additions – internally developed – – 8,578 – 8,578
Effect of movements in exchange rates – 27 29 137 193
At 31 December 2013 13,042 4,726 58,430 4,397 80,595
Additions – 22 – – 22
Additions – internally developed – – 700 – 700
Disposal – (15) – – (15)
Effect of movements in exchange rates – (15) (14) 167 138
At 31 December 2014 13,042 4,718 59,116 4,564 81,440
Accumulated amortisation and impairment losses
At 1 January 2013 11,457 1,094 25,377 1,134 39,062
Amortisation for the year – 220 3,572 309 4,101
Impairment loss 1,585 131 1,359 – 3,075
Effect of movements in exchange rates – 4 54 52 110
At 31 December 2013 13,042 1,449 30,362 1,495 46,348
Amortisation for the year – 221 3,548 311 4,080
Disposal – (1) – – (1)
Impairment loss – – 2,842 – 2,842
Effect of movements in exchange rates – 5 – 73 78
At 31 December 2014 13,042 1,674 36,752 1,879 53,347
carrying amounts
At 1 January 2013 1,585 3,565 24,446 3,126 32,722
At 31 December 2013 – 3,277 28,068 2,902 34,247
At 31 December 2014 – 3,044 22,364 2,685 28,093
Hyflux LtdAnnual Report 2014
82
Notes to the Financial Statements
Capitalisation of development costs
Initial capitalisation of development costs is based on management’s judgement that technological and economic feasibility has been confirmed, usually when a product development project has reached a defined milestone according to an established project management model.
Recoverability of development costs
The recoverable amounts of the cash-generating units are estimated based on their value in use. When value in use calculations are undertaken, management estimates the expected future cash flows from the cash-generating unit and chooses a suitable discount rate in order to calculate the present value of those cash flows. The recoverable amounts were estimated to be higher than the carrying amounts of the units, and no impairment was required, except for the amounts discussed below.
Impairment loss on development costs
Annually, management performs specific review on the development projects to identify projects that no longer meet the recognition criteria set forth in the FRS.
Accordingly, in 2014, taking into consideration the changes in the Group’s business plan, an impairment loss of $2,842,000 (2013: $1,359,000) was recognised in profit or loss.
Estimation of useful lives of development costs
Significant judgement is required in estimating the useful lives of development projects, which are affected by various factors, such as technological developments.
Impairment testing for cash-generating units (CGUs) containing goodwill
Goodwill was previously allocated to the Group’s operating divisions which represent the lowest level within the Group at which the goodwill was monitored for internal management purposes, which was not higher than the Group’s operating segments as reported in note 28. The aggregate carrying amount of goodwill allocated to Kingdom of Saudi Arabia (KSA) Industrial CGU was $1,585,000. In 2013, following a management review of the business portfolio, impairment losses of $1,585,000 in relation to KSA Industrial CGU was recognised in profit or loss.
The recoverable amount of the KSA Industrial CGU was determined based upon the fair value less cost to sell method, estimated based on indicative quotes obtained from potential buyers. The fair value measurement was categorised as Level 3 fair value.
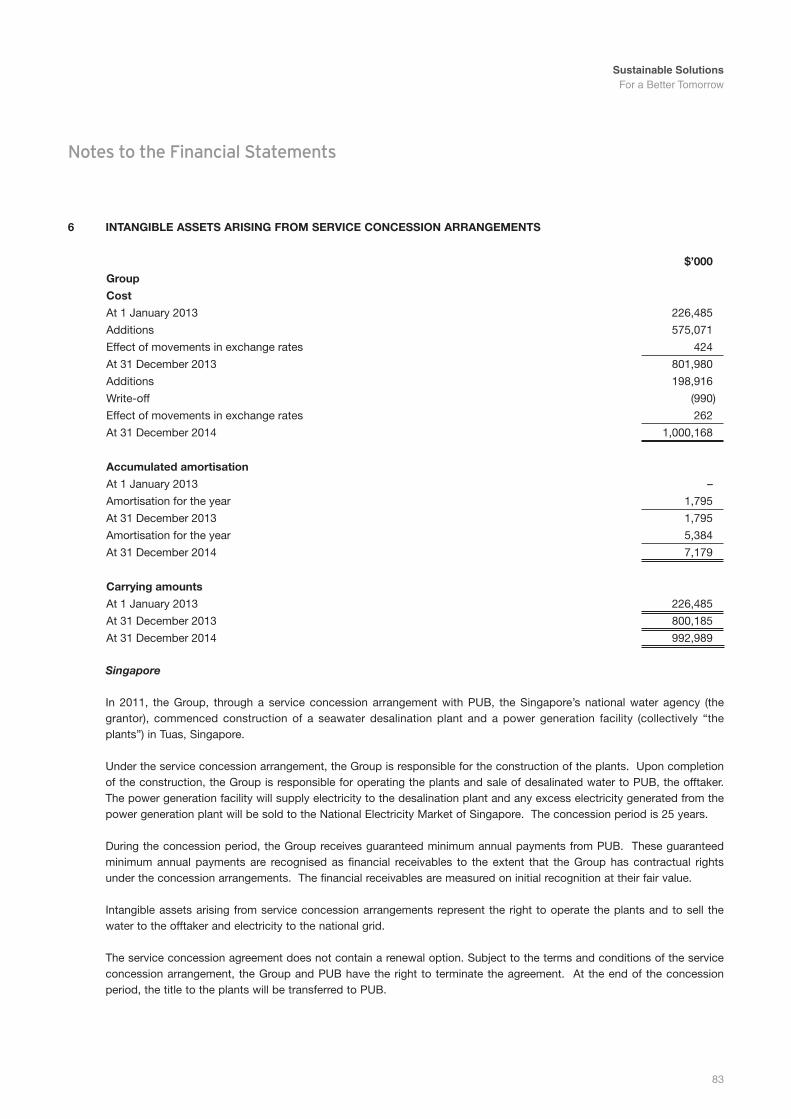
Sustainable Solutions For a Better Tomorrow
83
Notes to the Financial Statements
6 intAnGiBLe Assets ArisinG From service concession ArrAnGements
$’000
Group
cost
At 1 January 2013 226,485
Additions 575,071
Effect of movements in exchange rates 424
At 31 December 2013 801,980
Additions 198,916
Write-off (990)
Effect of movements in exchange rates 262
At 31 December 2014 1,000,168
Accumulated amortisation
At 1 January 2013 –
Amortisation for the year 1,795
At 31 December 2013 1,795
Amortisation for the year 5,384
At 31 December 2014 7,179
carrying amounts
At 1 January 2013 226,485
At 31 December 2013 800,185
At 31 December 2014 992,989
Singapore
In 2011, the Group, through a service concession arrangement with PUB, the Singapore’s national water agency (the grantor), commenced construction of a seawater desalination plant and a power generation facility (collectively “the plants”) in Tuas, Singapore.
Under the service concession arrangement, the Group is responsible for the construction of the plants. Upon completion of the construction, the Group is responsible for operating the plants and sale of desalinated water to PUB, the offtaker. The power generation facility will supply electricity to the desalination plant and any excess electricity generated from the power generation plant will be sold to the National Electricity Market of Singapore. The concession period is 25 years.
During the concession period, the Group receives guaranteed minimum annual payments from PUB. These guaranteed minimum annual payments are recognised as financial receivables to the extent that the Group has contractual rights under the concession arrangements. The financial receivables are measured on initial recognition at their fair value.
Intangible assets arising from service concession arrangements represent the right to operate the plants and to sell the water to the offtaker and electricity to the national grid.
The service concession agreement does not contain a renewal option. Subject to the terms and conditions of the service concession arrangement, the Group and PUB have the right to terminate the agreement. At the end of the concession period, the title to the plants will be transferred to PUB.
Hyflux LtdAnnual Report 2014
84
Notes to the Financial Statements
Amortisation of the intangible asset had commenced in 2013 when construction of the seawater desalination plant was completed.
Included in the carrying amount was capitalised net borrowing costs related to the construction of the plants amounting to $17,522,000 (2013: $11,945,000), with a capitalisation rate of 3.1% (2013: 2.1%).
PRC
Additionally, the Group owns water plants in PRC, including water treatment plants (WTPs) and wastewater treatment plants (WWTPs), through the special purpose companies (SPCs) incorporated in PRC. The principal activities of the SPCs are development and operation of WTPs and WWTPs, as well as sales of treated and recycled water. Each of these SPCs has entered into service concession arrangements with the respective local municipals (the grantor), via either Transfer-Operate-Transfer (TOT) or Build-Operate-Transfer (BOT) arrangements.
Under the TOT arrangements, the rights of use of the water plants were transferred to the Group and the Group is responsible for any upgrading services to bring the water plants into proper working conditions. Under the BOT arrangements, the Group is responsible for the construction of the water plants. Upon completion of the construction, the Group is responsible for operating the water plants and sale of the treated and recycled water to the industrial or domestic customers. The concession periods range from 20 years to 30 years.
During the concession period, the Group received the right to charge the offtakers for the sale of water. Additionally, some of the service concession arrangements provide the Group a guaranteed minimum annual payment for the initial years of the concession period, ranging from 3 years to 30 years. These guaranteed minimum annual payments are recognised as financial receivables to the extent that the Group has contractual rights under the concession arrangements (see note 11). The financial receivables are measured on initial recognition at their fair value.
Intangible assets arising from service concession arrangements represent the right to operate the water plants and to sell the water to the offtakers.
Subject to the terms and conditions of the service concession arrangement, the Group and grantors have the right to terminate the agreement. At the end of the concession period, the water plants will be transferred to the grantors.
During the year, the Group recorded the following construction revenue, representing the fair value of the construction services provided in respect of its service concession arrangements:
2014 2013
$’000 $’000
Construction revenue arising from service concession arrangements 187,234 432,593
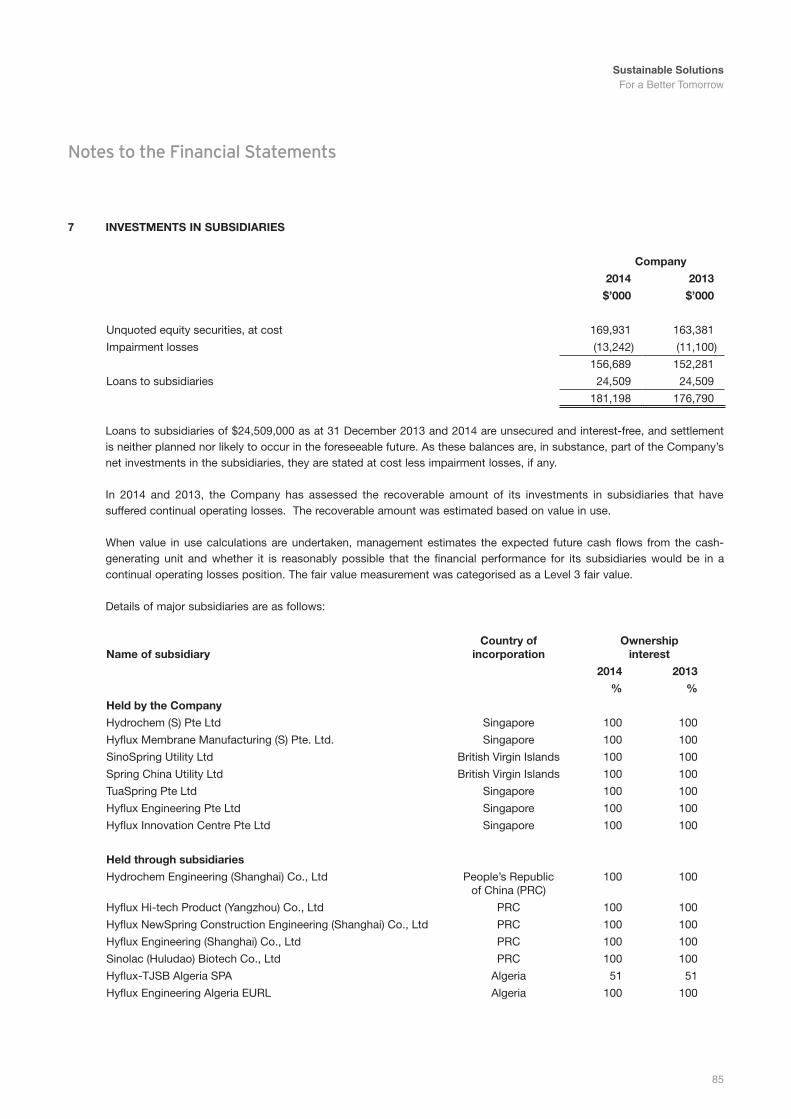
Sustainable Solutions For a Better Tomorrow
85
Notes to the Financial Statements
7 investments in suBsiDiAries
company
2014 2013
$’000 $’000
Unquoted equity securities, at cost 169,931 163,381
Impairment losses (13,242) (11,100)
156,689 152,281
Loans to subsidiaries 24,509 24,509
181,198 176,790
Loans to subsidiaries of $24,509,000 as at 31 December 2013 and 2014 are unsecured and interest-free, and settlement is neither planned nor likely to occur in the foreseeable future. As these balances are, in substance, part of the Company’s net investments in the subsidiaries, they are stated at cost less impairment losses, if any.
In 2014 and 2013, the Company has assessed the recoverable amount of its investments in subsidiaries that have suffered continual operating losses. The recoverable amount was estimated based on value in use.
When value in use calculations are undertaken, management estimates the expected future cash flows from the cash-generating unit and whether it is reasonably possible that the financial performance for its subsidiaries would be in a continual operating losses position. The fair value measurement was categorised as a Level 3 fair value.
Details of major subsidiaries are as follows:
name of subsidiarycountry of
incorporationownership
interest
2014 2013
% %
held by the company
Hydrochem (S) Pte Ltd Singapore 100 100
Hyflux Membrane Manufacturing (S) Pte. Ltd. Singapore 100 100
SinoSpring Utility Ltd British Virgin Islands 100 100
Spring China Utility Ltd British Virgin Islands 100 100
TuaSpring Pte Ltd Singapore 100 100
Hyflux Engineering Pte Ltd Singapore 100 100
Hyflux Innovation Centre Pte Ltd Singapore 100 100
held through subsidiaries
Hydrochem Engineering (Shanghai) Co., Ltd People’s Republic of China (PRC)
100 100
Hyflux Hi-tech Product (Yangzhou) Co., Ltd PRC 100 100
Hyflux NewSpring Construction Engineering (Shanghai) Co., Ltd PRC 100 100
Hyflux Engineering (Shanghai) Co., Ltd PRC 100 100
Sinolac (Huludao) Biotech Co., Ltd PRC 100 100
Hyflux-TJSB Algeria SPA Algeria 51 51
Hyflux Engineering Algeria EURL Algeria 100 100
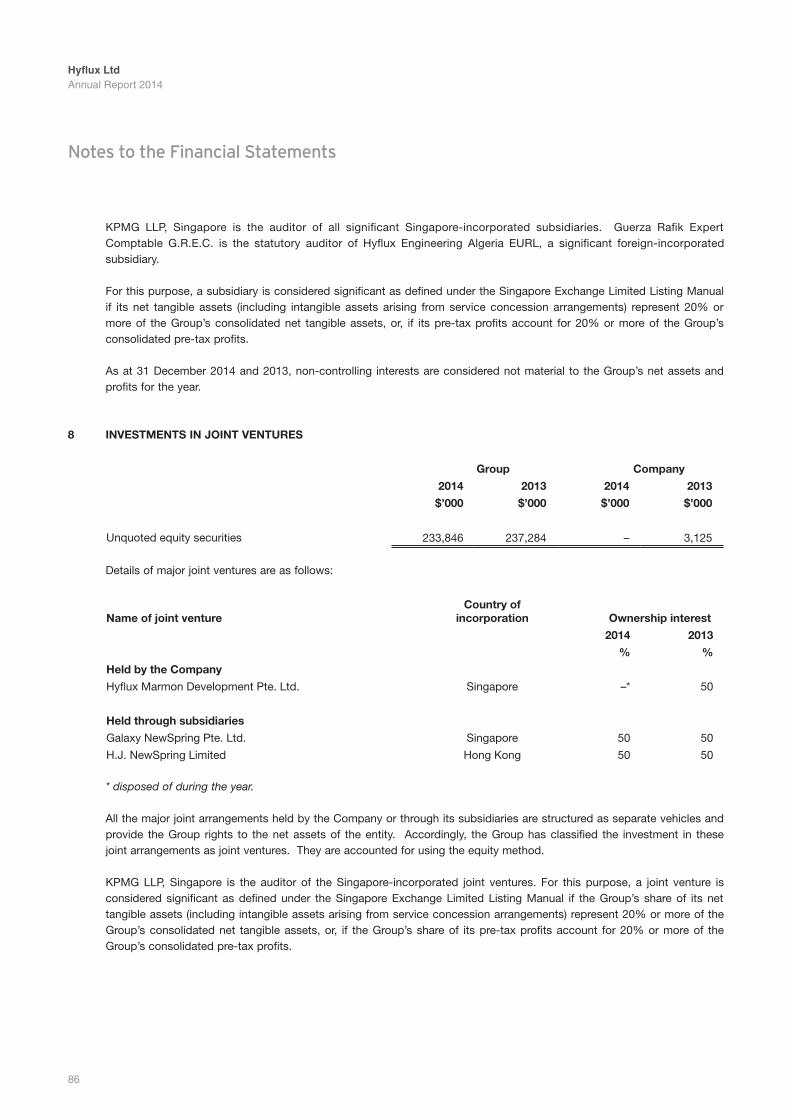
Hyflux LtdAnnual Report 2014
86
Notes to the Financial Statements
KPMG LLP, Singapore is the auditor of all significant Singapore-incorporated subsidiaries. Guerza Rafik Expert Comptable G.R.E.C. is the statutory auditor of Hyflux Engineering Algeria EURL, a significant foreign-incorporated subsidiary.
For this purpose, a subsidiary is considered significant as defined under the Singapore Exchange Limited Listing Manual if its net tangible assets (including intangible assets arising from service concession arrangements) represent 20% or more of the Group’s consolidated net tangible assets, or, if its pre-tax profits account for 20% or more of the Group’s consolidated pre-tax profits.
As at 31 December 2014 and 2013, non-controlling interests are considered not material to the Group’s net assets and profits for the year.
8 investments in Joint ventures
Group company
2014 2013 2014 2013
$’000 $’000 $’000 $’000
Unquoted equity securities 233,846 237,284 – 3,125
Details of major joint ventures are as follows:
name of joint venturecountry of
incorporation ownership interest
2014 2013
% %
held by the company
Hyflux Marmon Development Pte. Ltd. Singapore –* 50
held through subsidiaries
Galaxy NewSpring Pte. Ltd. Singapore 50 50
H.J. NewSpring Limited Hong Kong 50 50
* disposed of during the year.
All the major joint arrangements held by the Company or through its subsidiaries are structured as separate vehicles and provide the Group rights to the net assets of the entity. Accordingly, the Group has classified the investment in these joint arrangements as joint ventures. They are accounted for using the equity method.
KPMG LLP, Singapore is the auditor of the Singapore-incorporated joint ventures. For this purpose, a joint venture is considered significant as defined under the Singapore Exchange Limited Listing Manual if the Group’s share of its net tangible assets (including intangible assets arising from service concession arrangements) represent 20% or more of the Group’s consolidated net tangible assets, or, if the Group’s share of its pre-tax profits account for 20% or more of the Group’s consolidated pre-tax profits.
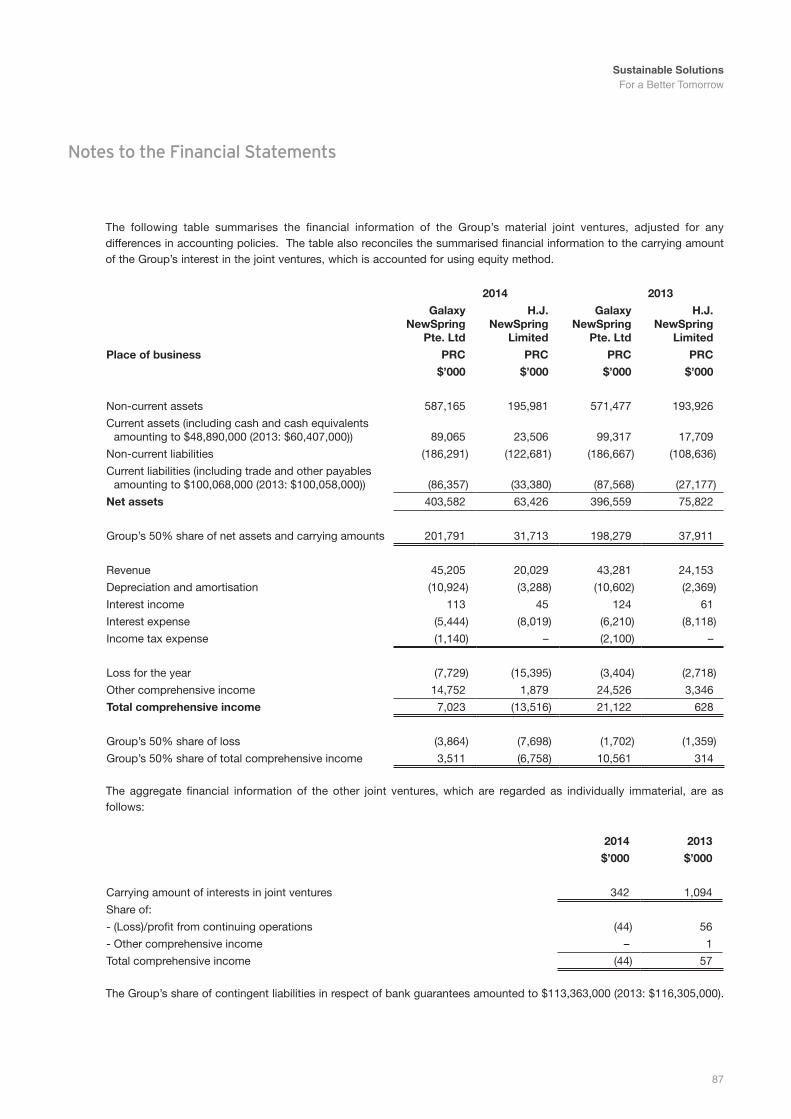
Sustainable Solutions For a Better Tomorrow
87
Notes to the Financial Statements
The following table summarises the financial information of the Group’s material joint ventures, adjusted for any differences in accounting policies. The table also reconciles the summarised financial information to the carrying amount of the Group’s interest in the joint ventures, which is accounted for using equity method.
2014 2013
Galaxy newspring
pte. Ltd
h.J. newspring
Limited
Galaxy newspring
pte. Ltd
h.J. newspring
Limited
place of business prc prc prc prc
$’000 $’000 $’000 $’000
Non-current assets 587,165 195,981 571,477 193,926
Current assets (including cash and cash equivalents amounting to $48,890,000 (2013: $60,407,000)) 89,065 23,506 99,317 17,709
Non-current liabilities (186,291) (122,681) (186,667) (108,636)
Current liabilities (including trade and other payables amounting to $100,068,000 (2013: $100,058,000)) (86,357) (33,380) (87,568) (27,177)
net assets 403,582 63,426 396,559 75,822
Group’s 50% share of net assets and carrying amounts 201,791 31,713 198,279 37,911
Revenue 45,205 20,029 43,281 24,153
Depreciation and amortisation (10,924) (3,288) (10,602) (2,369)
Interest income 113 45 124 61
Interest expense (5,444) (8,019) (6,210) (8,118)
Income tax expense (1,140) – (2,100) –
Loss for the year (7,729) (15,395) (3,404) (2,718)
Other comprehensive income 14,752 1,879 24,526 3,346
total comprehensive income 7,023 (13,516) 21,122 628
Group’s 50% share of loss (3,864) (7,698) (1,702) (1,359)
Group’s 50% share of total comprehensive income 3,511 (6,758) 10,561 314
The aggregate financial information of the other joint ventures, which are regarded as individually immaterial, are as follows:
2014 2013
$’000 $’000
Carrying amount of interests in joint ventures 342 1,094
Share of:
- (Loss)/profit from continuing operations (44) 56
- Other comprehensive income – 1
Total comprehensive income (44) 57
The Group’s share of contingent liabilities in respect of bank guarantees amounted to $113,363,000 (2013: $116,305,000).
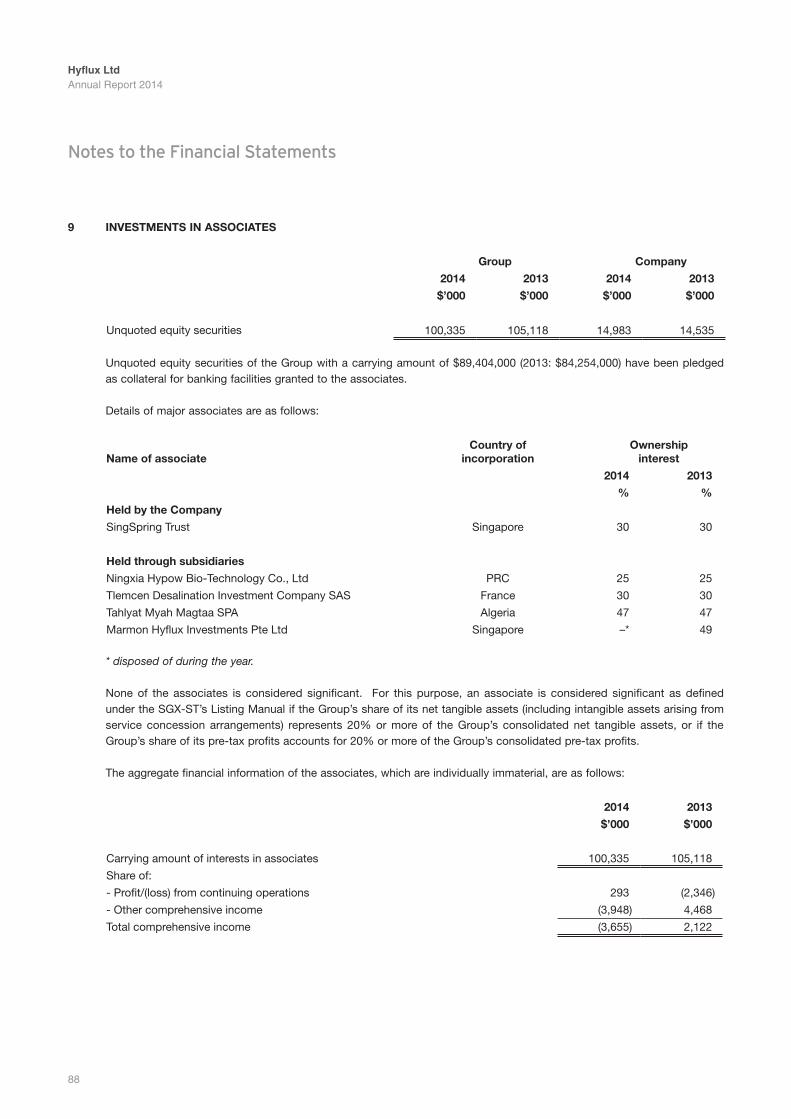
Hyflux LtdAnnual Report 2014
88
Notes to the Financial Statements
9 investments in AssociAtes
Group company
2014 2013 2014 2013
$’000 $’000 $’000 $’000
Unquoted equity securities 100,335 105,118 14,983 14,535
Unquoted equity securities of the Group with a carrying amount of $89,404,000 (2013: $84,254,000) have been pledged as collateral for banking facilities granted to the associates.
Details of major associates are as follows:
name of associatecountry of
incorporationownership
interest
2014 2013
% %
held by the company
SingSpring Trust Singapore 30 30
held through subsidiaries
Ningxia Hypow Bio-Technology Co., Ltd PRC 25 25
Tlemcen Desalination Investment Company SAS France 30 30
Tahlyat Myah Magtaa SPA Algeria 47 47
Marmon Hyflux Investments Pte Ltd Singapore –* 49
* disposed of during the year.
None of the associates is considered significant. For this purpose, an associate is considered significant as defined under the SGX-ST’s Listing Manual if the Group’s share of its net tangible assets (including intangible assets arising from service concession arrangements) represents 20% or more of the Group’s consolidated net tangible assets, or if the Group’s share of its pre-tax profits accounts for 20% or more of the Group’s consolidated pre-tax profits.
The aggregate financial information of the associates, which are individually immaterial, are as follows:
2014 2013
$’000 $’000
Carrying amount of interests in associates 100,335 105,118
Share of:
- Profit/(loss) from continuing operations 293 (2,346)
- Other comprehensive income (3,948) 4,468
Total comprehensive income (3,655) 2,122
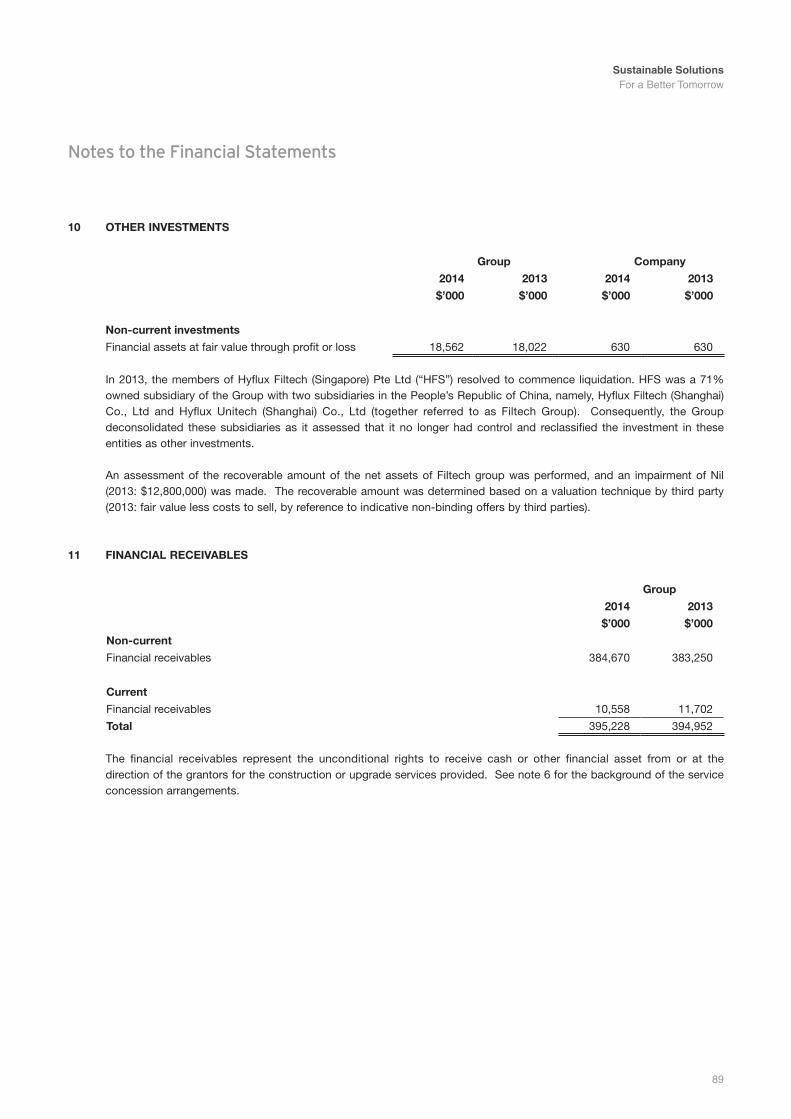
Sustainable Solutions For a Better Tomorrow
89
Notes to the Financial Statements
10 other investments
Group company
2014 2013 2014 2013
$’000 $’000 $’000 $’000
non-current investments
Financial assets at fair value through profit or loss 18,562 18,022 630 630
In 2013, the members of Hyflux Filtech (Singapore) Pte Ltd (“HFS”) resolved to commence liquidation. HFS was a 71% owned subsidiary of the Group with two subsidiaries in the People’s Republic of China, namely, Hyflux Filtech (Shanghai) Co., Ltd and Hyflux Unitech (Shanghai) Co., Ltd (together referred to as Filtech Group). Consequently, the Group deconsolidated these subsidiaries as it assessed that it no longer had control and reclassified the investment in these entities as other investments.
An assessment of the recoverable amount of the net assets of Filtech group was performed, and an impairment of Nil (2013: $12,800,000) was made. The recoverable amount was determined based on a valuation technique by third party (2013: fair value less costs to sell, by reference to indicative non-binding offers by third parties).
11 FinAnciAL receivABLes
Group
2014 2013
$’000 $’000
non-current
Financial receivables 384,670 383,250
current
Financial receivables 10,558 11,702
total 395,228 394,952
The financial receivables represent the unconditional rights to receive cash or other financial asset from or at the direction of the grantors for the construction or upgrade services provided. See note 6 for the background of the service concession arrangements.

Hyflux LtdAnnual Report 2014
90
Notes to the Financial Statements
12 trADe AnD other receivABLes
Group company
2014 2013 2014 2013
$’000 $’000 $’000 $’000
non-current
Amounts due from:
- subsidiaries (non-trade) – – 791,173 526,963
- a joint venture (non-trade) 19,041 – – –
- an associate (non-trade) – 15,139 – –
19,041 15,139 791,173 526,963
current
Trade receivables 106,848 92,870 – –
Prepayments 14,733 12,140 1,283 2,454
Deposits 5,553 3,900 – –
Advances to suppliers 9,601 12,999 – –
Staff advances 110 176 – –
Other receivables 8,870 6,403 234 84
Amounts due from:
- subsidiaries (trade) – – 13,239 16,372
- subsidiaries (non-trade) – – 748,551 694,865
- joint ventures (trade) 60,116 57,464 – –
- joint ventures (non-trade) 3,536 3,888 535 529
- associates (trade) 7,598 19,384 – –
- associates (non-trade) 24,319 24,369 5,510 5,289
241,284 233,593 769,352 719,593
total 260,325 248,732 1,560,525 1,246,556
the Group
As at 31 December 2014, trade receivables for the Group included a retention sum of $4,930,000 (2013: $4,834,000) relating to construction contracts in progress.
Included in current trade receivables of the Group as at 31 December 2014 were note receivables of $2,101,000 (2013: $1,412,000) relating to bank promissory notes for payment within the next six months.
The non-current non-trade amount due from a joint venture bears interest at rate of 6.55% per annum and is expected to be repayable in 2019.
The non-current non-trade amount due from an associate bears interest at rate of 5.94% (2013: 5.94%) per annum and is expected to be repayable on demand.
the company
Outstanding balances with subsidiaries, joint ventures and associates are unsecured. Except for an allowance for doubtful debts of $29,212,000 (2013: Nil), there is no other allowance for doubtful debts arising from the outstanding balances.
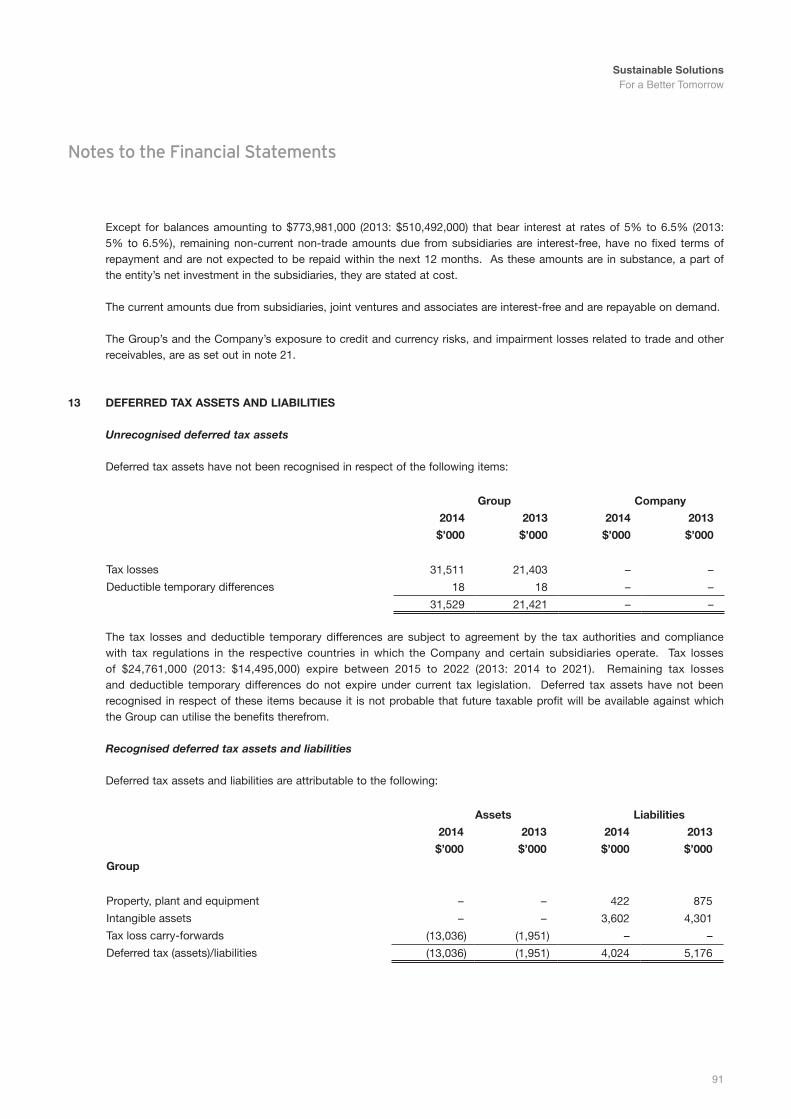
Sustainable Solutions For a Better Tomorrow
91
Notes to the Financial Statements
Except for balances amounting to $773,981,000 (2013: $510,492,000) that bear interest at rates of 5% to 6.5% (2013: 5% to 6.5%), remaining non-current non-trade amounts due from subsidiaries are interest-free, have no fixed terms of repayment and are not expected to be repaid within the next 12 months. As these amounts are in substance, a part of the entity’s net investment in the subsidiaries, they are stated at cost.
The current amounts due from subsidiaries, joint ventures and associates are interest-free and are repayable on demand.
The Group’s and the Company’s exposure to credit and currency risks, and impairment losses related to trade and other receivables, are as set out in note 21.
13 DeFerreD tAx Assets AnD LiABiLities
Unrecognised deferred tax assets
Deferred tax assets have not been recognised in respect of the following items:
Group company
2014 2013 2014 2013
$’000 $’000 $’000 $’000
Tax losses 31,511 21,403 – –
Deductible temporary differences 18 18 – –
31,529 21,421 – –
The tax losses and deductible temporary differences are subject to agreement by the tax authorities and compliance with tax regulations in the respective countries in which the Company and certain subsidiaries operate. Tax losses of $24,761,000 (2013: $14,495,000) expire between 2015 to 2022 (2013: 2014 to 2021). Remaining tax losses and deductible temporary differences do not expire under current tax legislation. Deferred tax assets have not been recognised in respect of these items because it is not probable that future taxable profit will be available against which the Group can utilise the benefits therefrom.
Recognised deferred tax assets and liabilities
Deferred tax assets and liabilities are attributable to the following:
Assets Liabilities
2014 2013 2014 2013
$’000 $’000 $’000 $’000
Group
Property, plant and equipment – – 422 875
Intangible assets – – 3,602 4,301
Tax loss carry-forwards (13,036) (1,951) – –
Deferred tax (assets)/liabilities (13,036) (1,951) 4,024 5,176
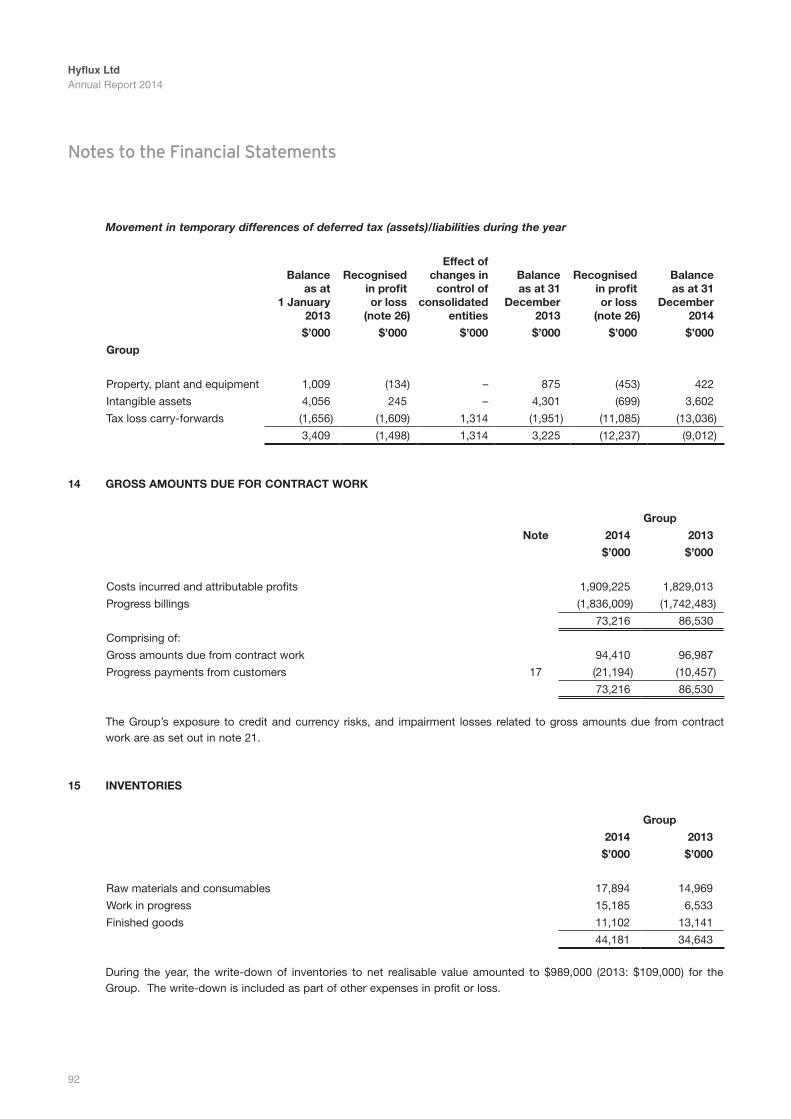
Hyflux LtdAnnual Report 2014
92
Notes to the Financial Statements
Movement in temporary differences of deferred tax (assets)/liabilities during the year
Balance as at
1 January 2013
recognisedin profit or loss
(note 26)
effect ofchanges in
control ofconsolidated
entities
Balance as at 31
December2013
recognisedin profit or loss
(note 26)
Balanceas at 31
December2014
$’000 $’000 $’000 $’000 $’000 $’000
Group
Property, plant and equipment 1,009 (134) – 875 (453) 422
Intangible assets 4,056 245 – 4,301 (699) 3,602
Tax loss carry-forwards (1,656) (1,609) 1,314 (1,951) (11,085) (13,036)
3,409 (1,498) 1,314 3,225 (12,237) (9,012)
14 Gross Amounts Due For contrAct WorK
Group
note 2014 2013
$’000 $’000
Costs incurred and attributable profits 1,909,225 1,829,013
Progress billings (1,836,009) (1,742,483)
73,216 86,530
Comprising of:
Gross amounts due from contract work 94,410 96,987
Progress payments from customers 17 (21,194) (10,457)
73,216 86,530
The Group’s exposure to credit and currency risks, and impairment losses related to gross amounts due from contract work are as set out in note 21.
15 inventories
Group
2014 2013
$’000 $’000
Raw materials and consumables 17,894 14,969
Work in progress 15,185 6,533
Finished goods 11,102 13,141
44,181 34,643
During the year, the write-down of inventories to net realisable value amounted to $989,000 (2013: $109,000) for the Group. The write-down is included as part of other expenses in profit or loss.
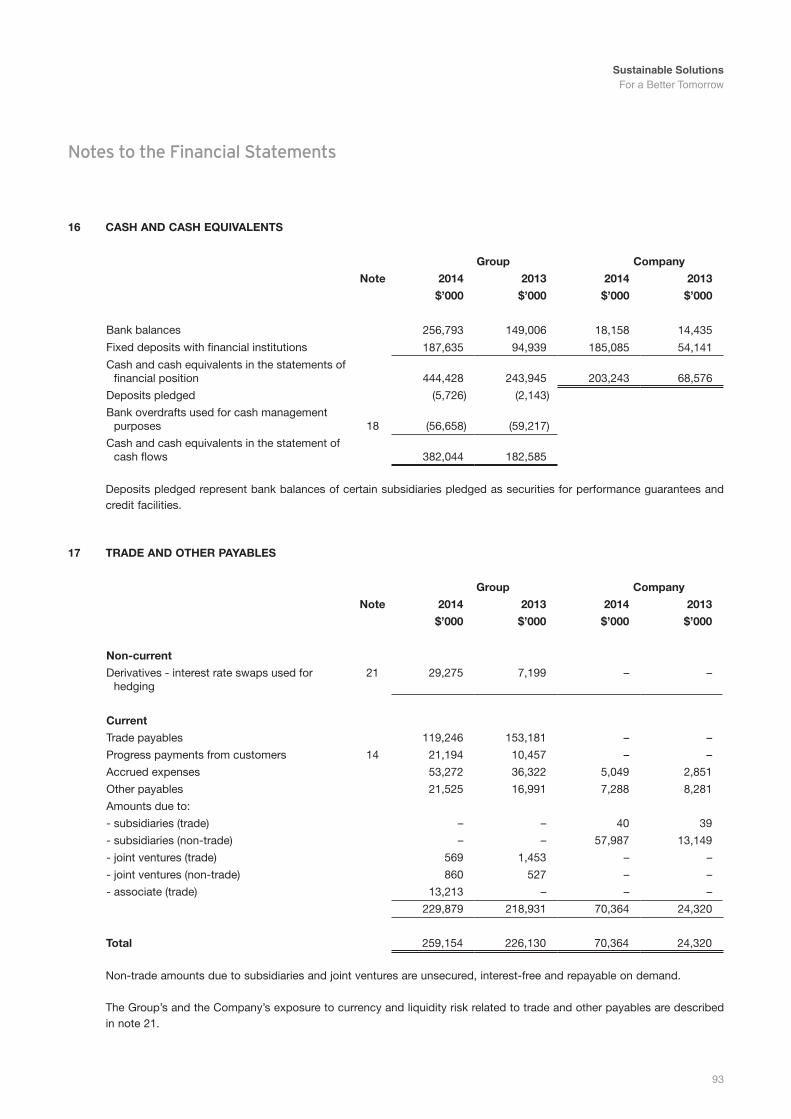
Sustainable Solutions For a Better Tomorrow
93
Notes to the Financial Statements
16 cAsh AnD cAsh equivALents
Group company
note 2014 2013 2014 2013
$’000 $’000 $’000 $’000
Bank balances 256,793 149,006 18,158 14,435
Fixed deposits with financial institutions 187,635 94,939 185,085 54,141
Cash and cash equivalents in the statements of financial position 444,428 243,945 203,243 68,576
Deposits pledged (5,726) (2,143)
Bank overdrafts used for cash management purposes 18 (56,658) (59,217)
Cash and cash equivalents in the statement of cash flows 382,044 182,585
Deposits pledged represent bank balances of certain subsidiaries pledged as securities for performance guarantees and credit facilities.
17 trADe AnD other pAYABLes
Group company
note 2014 2013 2014 2013
$’000 $’000 $’000 $’000
non-current
Derivatives - interest rate swaps used for hedging
21 29,275 7,199 – –
current
Trade payables 119,246 153,181 – –
Progress payments from customers 14 21,194 10,457 – –
Accrued expenses 53,272 36,322 5,049 2,851
Other payables 21,525 16,991 7,288 8,281
Amounts due to:
- subsidiaries (trade) – – 40 39
- subsidiaries (non-trade) – – 57,987 13,149
- joint ventures (trade) 569 1,453 – –
- joint ventures (non-trade) 860 527 – –
- associate (trade) 13,213 – – –
229,879 218,931 70,364 24,320
total 259,154 226,130 70,364 24,320
Non-trade amounts due to subsidiaries and joint ventures are unsecured, interest-free and repayable on demand. The Group’s and the Company’s exposure to currency and liquidity risk related to trade and other payables are described
in note 21.
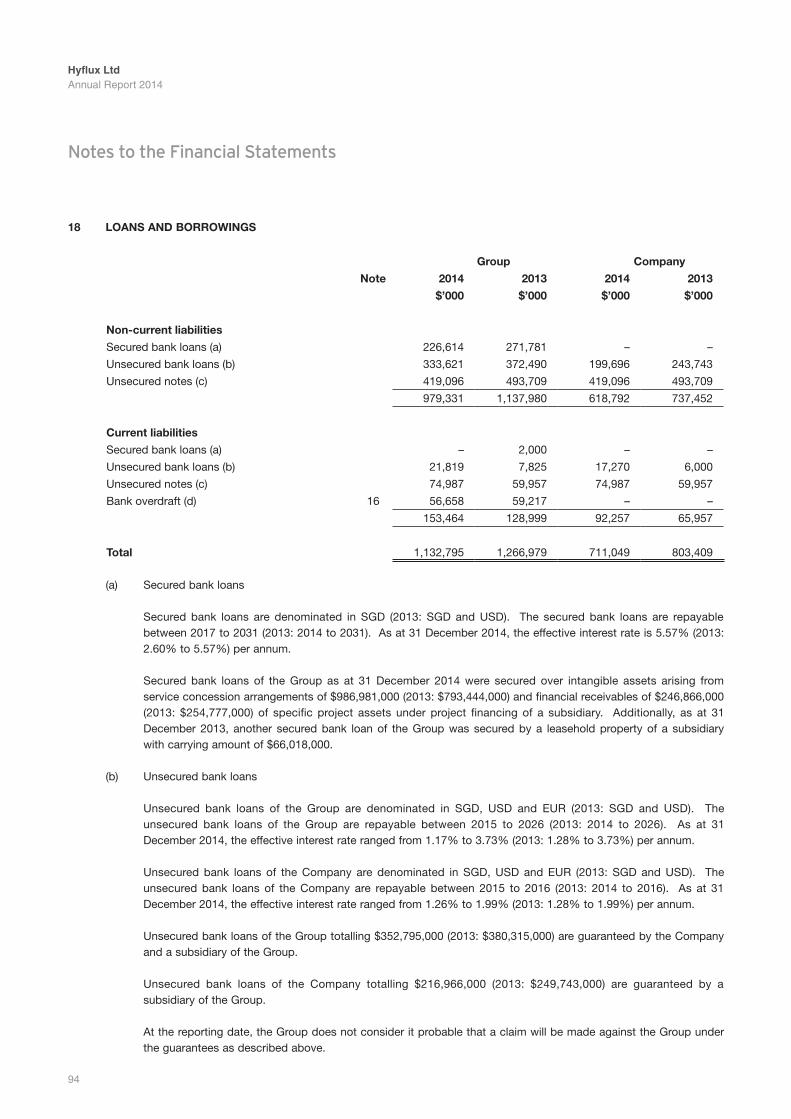
Hyflux LtdAnnual Report 2014
94
Notes to the Financial Statements
18 LoAns AnD BorroWinGs
Group company
note 2014 2013 2014 2013
$’000 $’000 $’000 $’000
non-current liabilities
Secured bank loans (a) 226,614 271,781 – –
Unsecured bank loans (b) 333,621 372,490 199,696 243,743
Unsecured notes (c) 419,096 493,709 419,096 493,709
979,331 1,137,980 618,792 737,452
current liabilities
Secured bank loans (a) – 2,000 – –
Unsecured bank loans (b) 21,819 7,825 17,270 6,000
Unsecured notes (c) 74,987 59,957 74,987 59,957
Bank overdraft (d) 16 56,658 59,217 – –
153,464 128,999 92,257 65,957
total 1,132,795 1,266,979 711,049 803,409
(a) Secured bank loans
Secured bank loans are denominated in SGD (2013: SGD and USD). The secured bank loans are repayable between 2017 to 2031 (2013: 2014 to 2031). As at 31 December 2014, the effective interest rate is 5.57% (2013: 2.60% to 5.57%) per annum.
Secured bank loans of the Group as at 31 December 2014 were secured over intangible assets arising from service concession arrangements of $986,981,000 (2013: $793,444,000) and financial receivables of $246,866,000 (2013: $254,777,000) of specific project assets under project financing of a subsidiary. Additionally, as at 31 December 2013, another secured bank loan of the Group was secured by a leasehold property of a subsidiary with carrying amount of $66,018,000.
(b) Unsecured bank loans
Unsecured bank loans of the Group are denominated in SGD, USD and EUR (2013: SGD and USD). The unsecured bank loans of the Group are repayable between 2015 to 2026 (2013: 2014 to 2026). As at 31 December 2014, the effective interest rate ranged from 1.17% to 3.73% (2013: 1.28% to 3.73%) per annum.
Unsecured bank loans of the Company are denominated in SGD, USD and EUR (2013: SGD and USD). The unsecured bank loans of the Company are repayable between 2015 to 2016 (2013: 2014 to 2016). As at 31 December 2014, the effective interest rate ranged from 1.26% to 1.99% (2013: 1.28% to 1.99%) per annum.
Unsecured bank loans of the Group totalling $352,795,000 (2013: $380,315,000) are guaranteed by the Company and a subsidiary of the Group.
Unsecured bank loans of the Company totalling $216,966,000 (2013: $249,743,000) are guaranteed by a subsidiary of the Group.
At the reporting date, the Group does not consider it probable that a claim will be made against the Group under the guarantees as described above.
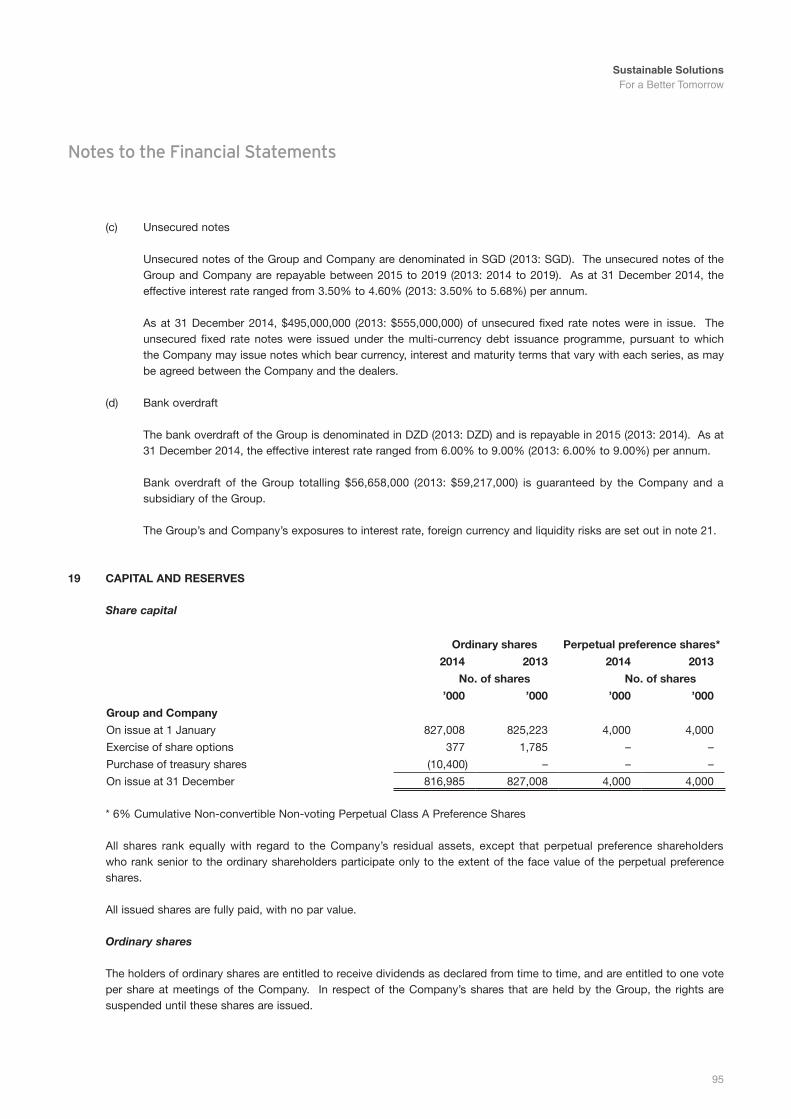
Sustainable Solutions For a Better Tomorrow
95
Notes to the Financial Statements
(c) Unsecured notes
Unsecured notes of the Group and Company are denominated in SGD (2013: SGD). The unsecured notes of the Group and Company are repayable between 2015 to 2019 (2013: 2014 to 2019). As at 31 December 2014, the effective interest rate ranged from 3.50% to 4.60% (2013: 3.50% to 5.68%) per annum.
As at 31 December 2014, $495,000,000 (2013: $555,000,000) of unsecured fixed rate notes were in issue. The unsecured fixed rate notes were issued under the multi-currency debt issuance programme, pursuant to which the Company may issue notes which bear currency, interest and maturity terms that vary with each series, as may be agreed between the Company and the dealers.
(d) Bank overdraft
The bank overdraft of the Group is denominated in DZD (2013: DZD) and is repayable in 2015 (2013: 2014). As at 31 December 2014, the effective interest rate ranged from 6.00% to 9.00% (2013: 6.00% to 9.00%) per annum.
Bank overdraft of the Group totalling $56,658,000 (2013: $59,217,000) is guaranteed by the Company and a subsidiary of the Group.
The Group’s and Company’s exposures to interest rate, foreign currency and liquidity risks are set out in note 21.
19 cApitAL AnD reserves
Share capital
ordinary shares perpetual preference shares*
2014 2013 2014 2013
no. of shares no. of shares
’000 ’000 ’000 ’000
Group and company
On issue at 1 January 827,008 825,223 4,000 4,000
Exercise of share options 377 1,785 – –
Purchase of treasury shares (10,400) – – –
On issue at 31 December 816,985 827,008 4,000 4,000
* 6% Cumulative Non-convertible Non-voting Perpetual Class A Preference Shares
All shares rank equally with regard to the Company’s residual assets, except that perpetual preference shareholders who rank senior to the ordinary shareholders participate only to the extent of the face value of the perpetual preference shares.
All issued shares are fully paid, with no par value.
Ordinary shares
The holders of ordinary shares are entitled to receive dividends as declared from time to time, and are entitled to one vote per share at meetings of the Company. In respect of the Company’s shares that are held by the Group, the rights are suspended until these shares are issued.
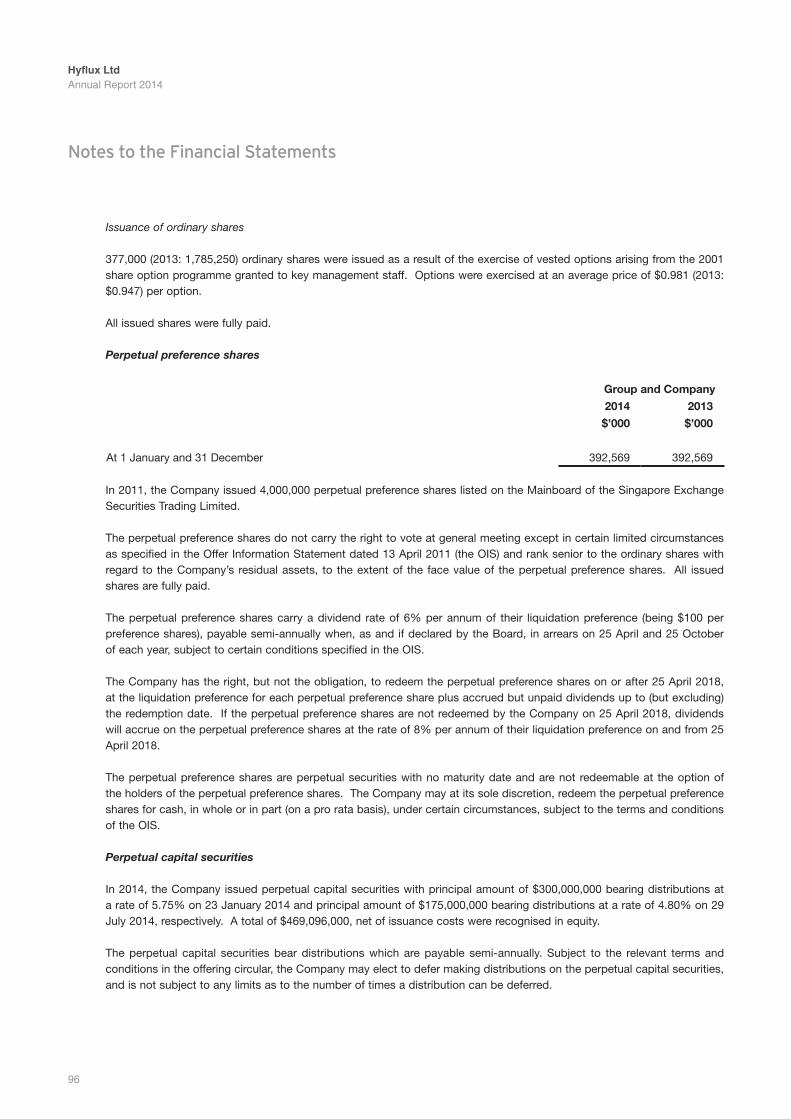
Hyflux LtdAnnual Report 2014
96
Notes to the Financial Statements
Issuance of ordinary shares
377,000 (2013: 1,785,250) ordinary shares were issued as a result of the exercise of vested options arising from the 2001 share option programme granted to key management staff. Options were exercised at an average price of $0.981 (2013: $0.947) per option.
All issued shares were fully paid.
Perpetual preference shares
Group and company
2014 2013
$’000 $’000
At 1 January and 31 December 392,569 392,569
In 2011, the Company issued 4,000,000 perpetual preference shares listed on the Mainboard of the Singapore Exchange Securities Trading Limited.
The perpetual preference shares do not carry the right to vote at general meeting except in certain limited circumstances as specified in the Offer Information Statement dated 13 April 2011 (the OIS) and rank senior to the ordinary shares with regard to the Company’s residual assets, to the extent of the face value of the perpetual preference shares. All issued shares are fully paid.
The perpetual preference shares carry a dividend rate of 6% per annum of their liquidation preference (being $100 per preference shares), payable semi-annually when, as and if declared by the Board, in arrears on 25 April and 25 October of each year, subject to certain conditions specified in the OIS.
The Company has the right, but not the obligation, to redeem the perpetual preference shares on or after 25 April 2018, at the liquidation preference for each perpetual preference share plus accrued but unpaid dividends up to (but excluding) the redemption date. If the perpetual preference shares are not redeemed by the Company on 25 April 2018, dividends will accrue on the perpetual preference shares at the rate of 8% per annum of their liquidation preference on and from 25 April 2018.
The perpetual preference shares are perpetual securities with no maturity date and are not redeemable at the option of the holders of the perpetual preference shares. The Company may at its sole discretion, redeem the perpetual preference shares for cash, in whole or in part (on a pro rata basis), under certain circumstances, subject to the terms and conditions of the OIS.
Perpetual capital securities
In 2014, the Company issued perpetual capital securities with principal amount of $300,000,000 bearing distributions at a rate of 5.75% on 23 January 2014 and principal amount of $175,000,000 bearing distributions at a rate of 4.80% on 29 July 2014, respectively. A total of $469,096,000, net of issuance costs were recognised in equity.
The perpetual capital securities bear distributions which are payable semi-annually. Subject to the relevant terms and conditions in the offering circular, the Company may elect to defer making distributions on the perpetual capital securities, and is not subject to any limits as to the number of times a distribution can be deferred.
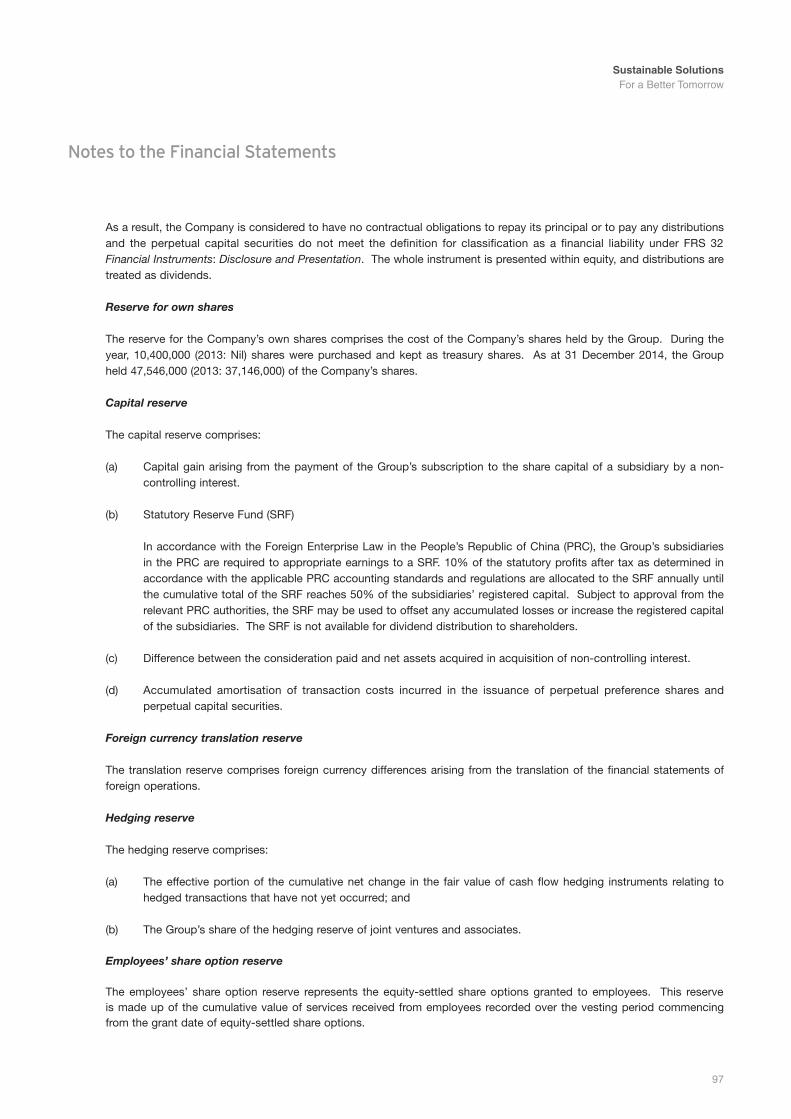
Sustainable Solutions For a Better Tomorrow
97
Notes to the Financial Statements
As a result, the Company is considered to have no contractual obligations to repay its principal or to pay any distributions and the perpetual capital securities do not meet the definition for classification as a financial liability under FRS 32 Financial Instruments: Disclosure and Presentation. The whole instrument is presented within equity, and distributions are treated as dividends.
Reserve for own shares
The reserve for the Company’s own shares comprises the cost of the Company’s shares held by the Group. During the year, 10,400,000 (2013: Nil) shares were purchased and kept as treasury shares. As at 31 December 2014, the Group held 47,546,000 (2013: 37,146,000) of the Company’s shares.
Capital reserve
The capital reserve comprises:
(a) Capital gain arising from the payment of the Group’s subscription to the share capital of a subsidiary by a non-controlling interest.
(b) Statutory Reserve Fund (SRF)
In accordance with the Foreign Enterprise Law in the People’s Republic of China (PRC), the Group’s subsidiaries in the PRC are required to appropriate earnings to a SRF. 10% of the statutory profits after tax as determined in accordance with the applicable PRC accounting standards and regulations are allocated to the SRF annually until the cumulative total of the SRF reaches 50% of the subsidiaries’ registered capital. Subject to approval from the relevant PRC authorities, the SRF may be used to offset any accumulated losses or increase the registered capital of the subsidiaries. The SRF is not available for dividend distribution to shareholders.
(c) Difference between the consideration paid and net assets acquired in acquisition of non-controlling interest.
(d) Accumulated amortisation of transaction costs incurred in the issuance of perpetual preference shares and perpetual capital securities.
Foreign currency translation reserve
The translation reserve comprises foreign currency differences arising from the translation of the financial statements of foreign operations.
Hedging reserve
The hedging reserve comprises:
(a) The effective portion of the cumulative net change in the fair value of cash flow hedging instruments relating to hedgedtransactionsthathavenotyetoccurred;and
(b) The Group’s share of the hedging reserve of joint ventures and associates.
Employees’ share option reserve
The employees’ share option reserve represents the equity-settled share options granted to employees. This reserve is made up of the cumulative value of services received from employees recorded over the vesting period commencing from the grant date of equity-settled share options.

Hyflux LtdAnnual Report 2014
98
Notes to the Financial Statements
Dividends
The following dividends were declared and paid by the Group and the Company:
For the year ended 31 December
Group and company
2014 2013
$’000 $’000
Final tax-exempt dividend paid of 1.60 cents (2013: 2.50 cents) per share in respect of previous financial year 13,234 20,651
Interim tax-exempt dividend paid of 0.70 cents (2013: 0.70 cents) per share in respect of current financial year 5,792 5,786
6% (2013: 6%) per annum of perpetual preference shares 24,000 24,000
Dividends for perpetual capital securities 8,553 –
51,579 50,437
After the respective reporting dates, the following dividends were proposed by the directors. As at the respective year end, the dividends were not provided for and there were no income tax consequences.
Group and company
2014 2013
$’000 $’000
Final proposed tax-exempt dividend of 1.60 cents (2013: 1.60 cents) per share 13,072* 13,232
* based on issued ordinary shares as at 31 December 2014.
20 shAre-BAseD pAYment
Description of the share-based payment arrangements
As at 31 December 2014, the Group has the following share-based payment arrangements.
Share option scheme (equity-settled)
On 27 April 2011, the members of the Company have approved the implementation of a new share option scheme (the Scheme) to replace the 2001 Scheme that expired on 26 September 2011 and allowed Olivia Lum Ooi Lin, Executive Chairman and Group CEO, a substantial shareholder of the Company, to participate in the 2011 Scheme. The implementation of the Scheme and replacement of the expired scheme do not affect the rights of holders of the options under the expired scheme. The maximum entitlement of Olivia Lum Ooi Lin is 10% of the total number of shares which may be issued by the Company under the Scheme. The aggregate number of scheme shares available to Olivia Lum Ooi Lin and her associates (as defined in SGX-ST’s Listing Manual) shall not exceed 25% of the total number of scheme shares available under the Scheme. It has been in force since 27 September 2011 and shall expire on 26 September 2021.
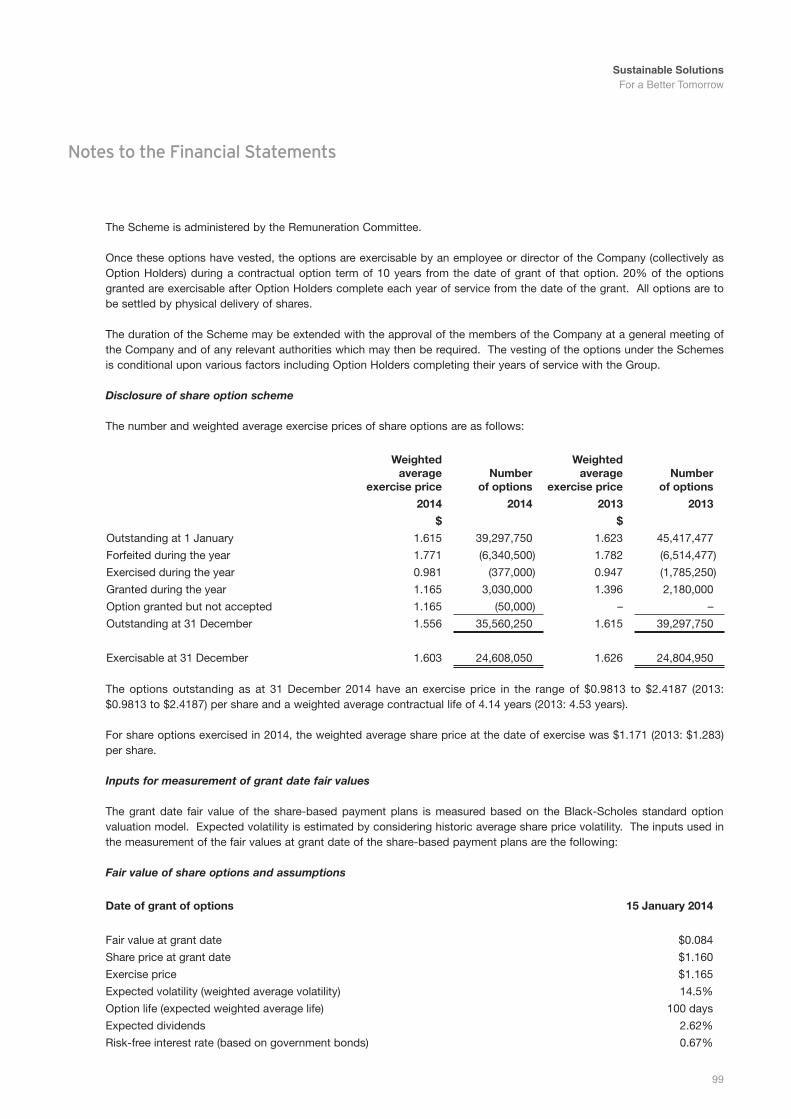
Sustainable Solutions For a Better Tomorrow
99
Notes to the Financial Statements
The Scheme is administered by the Remuneration Committee.
Once these options have vested, the options are exercisable by an employee or director of the Company (collectively as Option Holders) during a contractual option term of 10 years from the date of grant of that option. 20% of the options granted are exercisable after Option Holders complete each year of service from the date of the grant. All options are to be settled by physical delivery of shares.
The duration of the Scheme may be extended with the approval of the members of the Company at a general meeting of the Company and of any relevant authorities which may then be required. The vesting of the options under the Schemes is conditional upon various factors including Option Holders completing their years of service with the Group.
Disclosure of share option scheme
The number and weighted average exercise prices of share options are as follows:
Weightedaverage
exercise pricenumber
of options
Weightedaverage
exercise pricenumber
of options
2014 2014 2013 2013
$ $
Outstanding at 1 January 1.615 39,297,750 1.623 45,417,477
Forfeited during the year 1.771 (6,340,500) 1.782 (6,514,477)
Exercised during the year 0.981 (377,000) 0.947 (1,785,250)
Granted during the year 1.165 3,030,000 1.396 2,180,000
Option granted but not accepted 1.165 (50,000) – –
Outstanding at 31 December 1.556 35,560,250 1.615 39,297,750
Exercisable at 31 December 1.603 24,608,050 1.626 24,804,950
The options outstanding as at 31 December 2014 have an exercise price in the range of $0.9813 to $2.4187 (2013: $0.9813 to $2.4187) per share and a weighted average contractual life of 4.14 years (2013: 4.53 years).
For share options exercised in 2014, the weighted average share price at the date of exercise was $1.171 (2013: $1.283) per share.
Inputs for measurement of grant date fair values
The grant date fair value of the share-based payment plans is measured based on the Black-Scholes standard option valuation model. Expected volatility is estimated by considering historic average share price volatility. The inputs used in the measurement of the fair values at grant date of the share-based payment plans are the following:
Fair value of share options and assumptions
Date of grant of options 15 January 2014
Fair value at grant date $0.084
Share price at grant date $1.160
Exercise price $1.165
Expected volatility (weighted average volatility) 14.5%
Option life (expected weighted average life) 100 days
Expected dividends 2.62%
Risk-free interest rate (based on government bonds) 0.67%
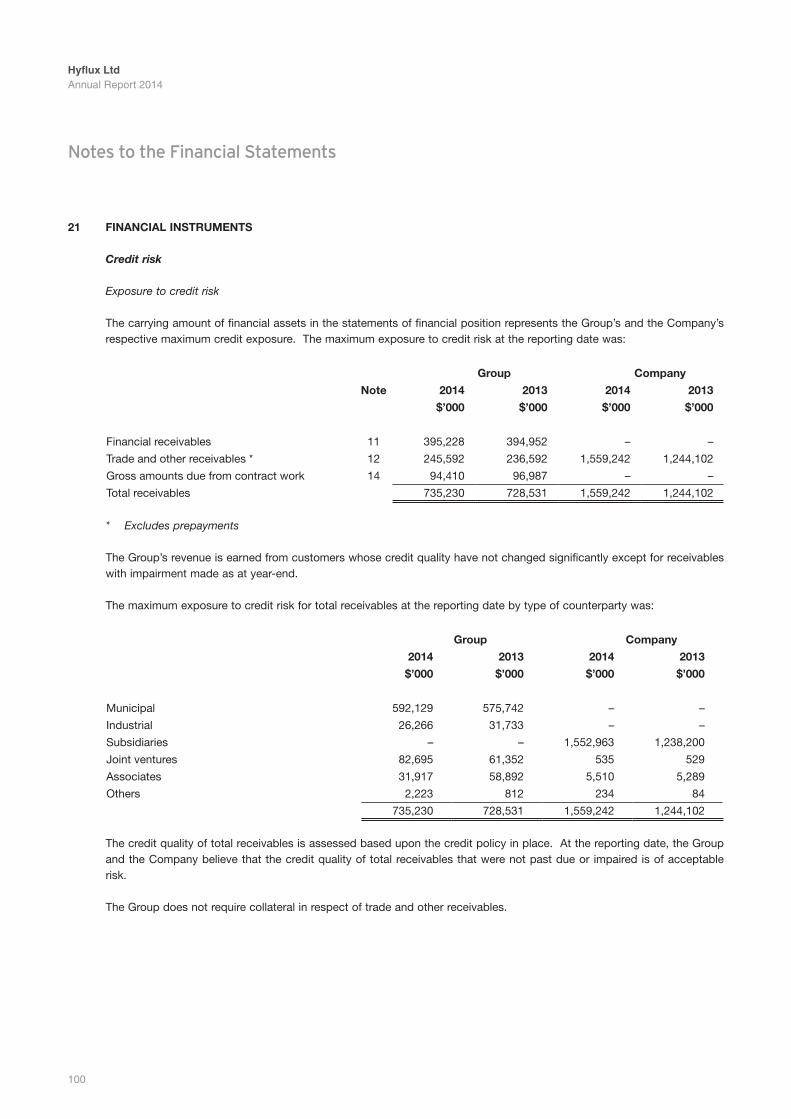
Hyflux LtdAnnual Report 2014
100
Notes to the Financial Statements
21 FinAnciAL instruments
Credit risk
Exposure to credit risk
The carrying amount of financial assets in the statements of financial position represents the Group’s and the Company’s respective maximum credit exposure. The maximum exposure to credit risk at the reporting date was:
Group company
note 2014 2013 2014 2013
$’000 $’000 $’000 $’000
Financial receivables 11 395,228 394,952 – –
Trade and other receivables * 12 245,592 236,592 1,559,242 1,244,102
Gross amounts due from contract work 14 94,410 96,987 – –
Total receivables 735,230 728,531 1,559,242 1,244,102
* Excludes prepayments
The Group’s revenue is earned from customers whose credit quality have not changed significantly except for receivables with impairment made as at year-end.
The maximum exposure to credit risk for total receivables at the reporting date by type of counterparty was:
Group company
2014 2013 2014 2013
$’000 $’000 $’000 $’000
Municipal 592,129 575,742 – –
Industrial 26,266 31,733 – –
Subsidiaries – – 1,552,963 1,238,200
Joint ventures 82,695 61,352 535 529
Associates 31,917 58,892 5,510 5,289
Others 2,223 812 234 84
735,230 728,531 1,559,242 1,244,102
The credit quality of total receivables is assessed based upon the credit policy in place. At the reporting date, the Group and the Company believe that the credit quality of total receivables that were not past due or impaired is of acceptable risk.
The Group does not require collateral in respect of trade and other receivables.
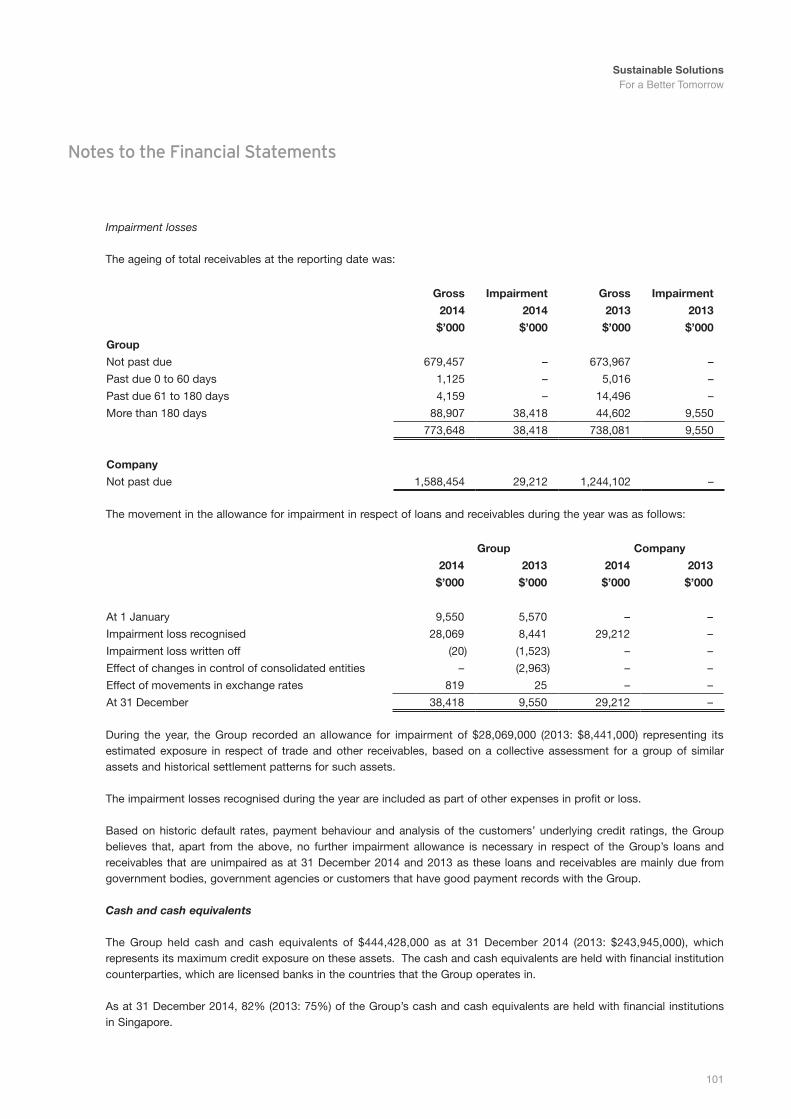
Sustainable Solutions For a Better Tomorrow
101
Notes to the Financial Statements
Impairment losses
The ageing of total receivables at the reporting date was:
Gross impairment Gross impairment
2014 2014 2013 2013
$’000 $’000 $’000 $’000
Group
Not past due 679,457 – 673,967 –
Past due 0 to 60 days 1,125 – 5,016 –
Past due 61 to 180 days 4,159 – 14,496 –
More than 180 days 88,907 38,418 44,602 9,550
773,648 38,418 738,081 9,550
company
Not past due 1,588,454 29,212 1,244,102 –
The movement in the allowance for impairment in respect of loans and receivables during the year was as follows:
Group company
2014 2013 2014 2013
$’000 $’000 $’000 $’000
At 1 January 9,550 5,570 – –
Impairment loss recognised 28,069 8,441 29,212 –
Impairment loss written off (20) (1,523) – –
Effect of changes in control of consolidated entities – (2,963) – –
Effect of movements in exchange rates 819 25 – –
At 31 December 38,418 9,550 29,212 –
During the year, the Group recorded an allowance for impairment of $28,069,000 (2013: $8,441,000) representing its estimated exposure in respect of trade and other receivables, based on a collective assessment for a group of similar assets and historical settlement patterns for such assets.
The impairment losses recognised during the year are included as part of other expenses in profit or loss.
Based on historic default rates, payment behaviour and analysis of the customers’ underlying credit ratings, the Group believes that, apart from the above, no further impairment allowance is necessary in respect of the Group’s loans and receivables that are unimpaired as at 31 December 2014 and 2013 as these loans and receivables are mainly due from government bodies, government agencies or customers that have good payment records with the Group.
Cash and cash equivalents
The Group held cash and cash equivalents of $444,428,000 as at 31 December 2014 (2013: $243,945,000), which represents its maximum credit exposure on these assets. The cash and cash equivalents are held with financial institution counterparties, which are licensed banks in the countries that the Group operates in.
As at 31 December 2014, 82% (2013: 75%) of the Group’s cash and cash equivalents are held with financial institutions in Singapore.
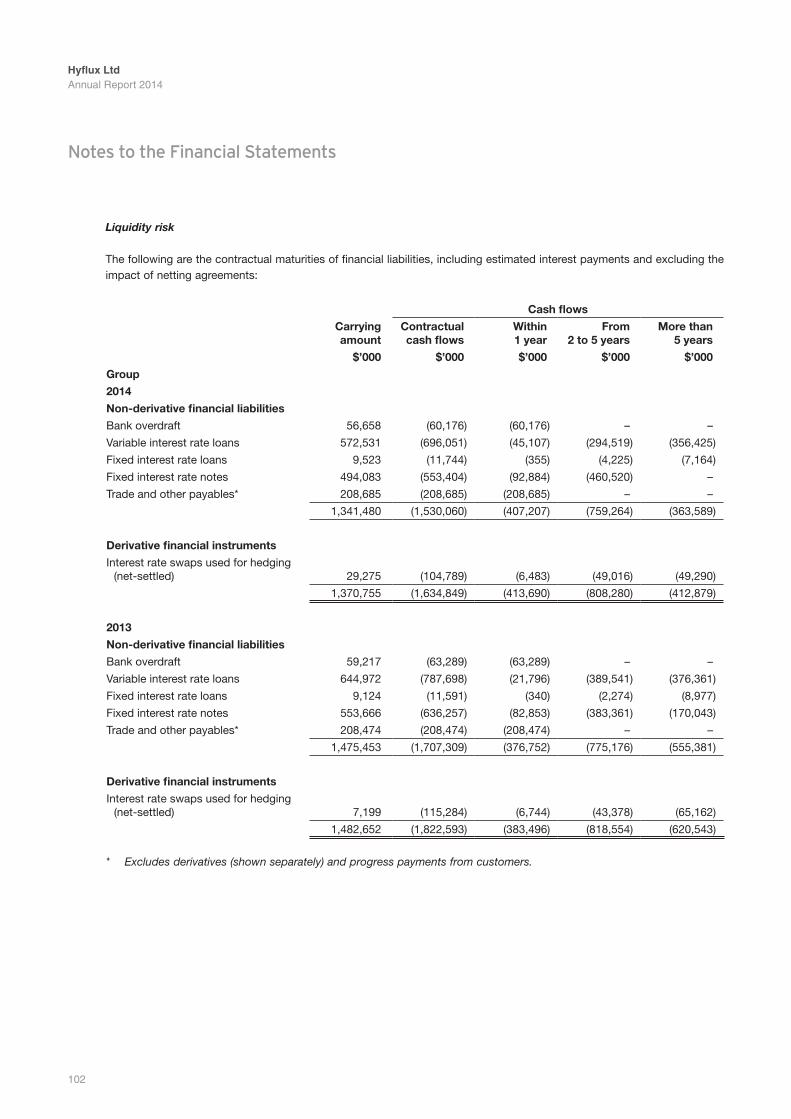
Hyflux LtdAnnual Report 2014
102
Notes to the Financial Statements
Liquidity risk
The following are the contractual maturities of financial liabilities, including estimated interest payments and excluding the impact of netting agreements:
cash flows
carrying amount
contractualcash flows
Within1 year
From2 to 5 years
more than5 years
$’000 $’000 $’000 $’000 $’000
Group
2014
non-derivative financial liabilities
Bank overdraft 56,658 (60,176) (60,176) – –
Variable interest rate loans 572,531 (696,051) (45,107) (294,519) (356,425)
Fixed interest rate loans 9,523 (11,744) (355) (4,225) (7,164)
Fixed interest rate notes 494,083 (553,404) (92,884) (460,520) –
Trade and other payables* 208,685 (208,685) (208,685) – –
1,341,480 (1,530,060) (407,207) (759,264) (363,589)
Derivative financial instruments
Interest rate swaps used for hedging (net-settled) 29,275 (104,789) (6,483) (49,016) (49,290)
1,370,755 (1,634,849) (413,690) (808,280) (412,879)
2013
non-derivative financial liabilities
Bank overdraft 59,217 (63,289) (63,289) – –
Variable interest rate loans 644,972 (787,698) (21,796) (389,541) (376,361)
Fixed interest rate loans 9,124 (11,591) (340) (2,274) (8,977)
Fixed interest rate notes 553,666 (636,257) (82,853) (383,361) (170,043)
Trade and other payables* 208,474 (208,474) (208,474) – –
1,475,453 (1,707,309) (376,752) (775,176) (555,381)
Derivative financial instruments
Interest rate swaps used for hedging (net-settled) 7,199 (115,284) (6,744) (43,378) (65,162)
1,482,652 (1,822,593) (383,496) (818,554) (620,543)
* Excludes derivatives (shown separately) and progress payments from customers.
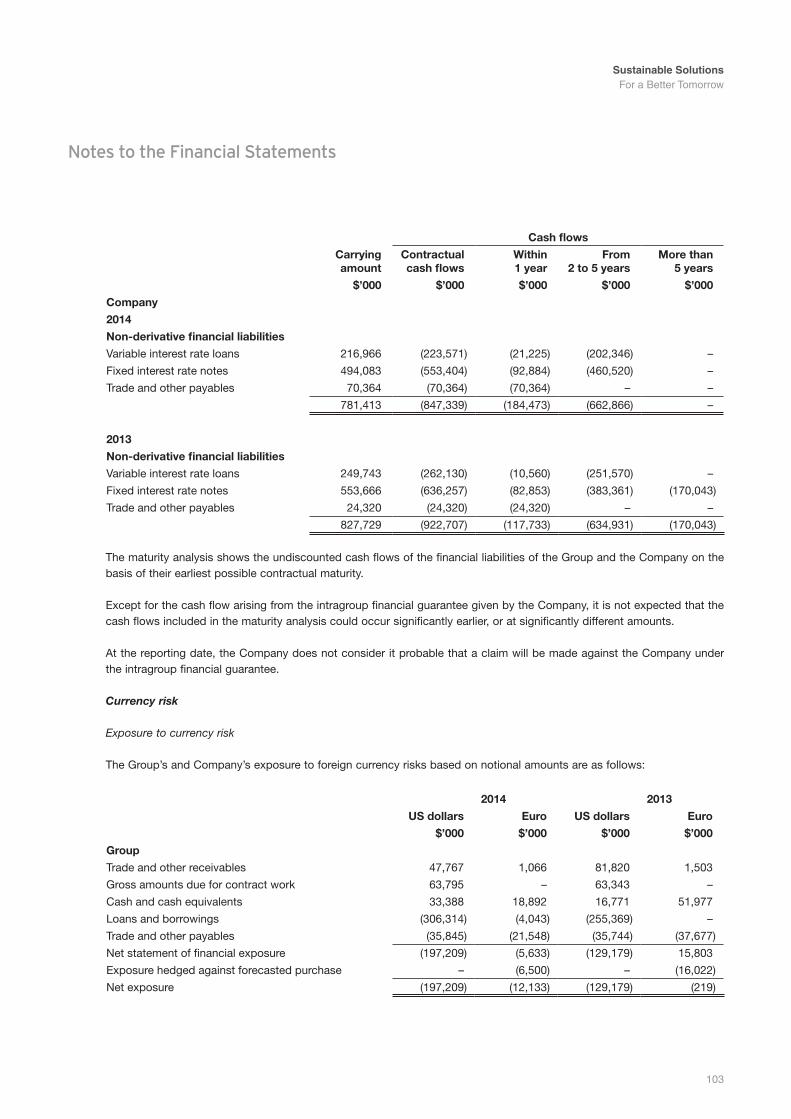
Sustainable Solutions For a Better Tomorrow
103
Notes to the Financial Statements
cash flows
carrying amount
contractualcash flows
Within1 year
From2 to 5 years
more than5 years
$’000 $’000 $’000 $’000 $’000
company
2014
non-derivative financial liabilities
Variable interest rate loans 216,966 (223,571) (21,225) (202,346) –
Fixed interest rate notes 494,083 (553,404) (92,884) (460,520) –
Trade and other payables 70,364 (70,364) (70,364) – –
781,413 (847,339) (184,473) (662,866) –
2013
non-derivative financial liabilities
Variable interest rate loans 249,743 (262,130) (10,560) (251,570) –
Fixed interest rate notes 553,666 (636,257) (82,853) (383,361) (170,043)
Trade and other payables 24,320 (24,320) (24,320) – –
827,729 (922,707) (117,733) (634,931) (170,043)
The maturity analysis shows the undiscounted cash flows of the financial liabilities of the Group and the Company on the basis of their earliest possible contractual maturity.
Except for the cash flow arising from the intragroup financial guarantee given by the Company, it is not expected that the cash flows included in the maturity analysis could occur significantly earlier, or at significantly different amounts.
At the reporting date, the Company does not consider it probable that a claim will be made against the Company under the intragroup financial guarantee.
Currency risk
Exposure to currency risk
The Group’s and Company’s exposure to foreign currency risks based on notional amounts are as follows:
2014 2013
us dollars euro us dollars euro
$’000 $’000 $’000 $’000
Group
Trade and other receivables 47,767 1,066 81,820 1,503
Gross amounts due for contract work 63,795 – 63,343 –
Cash and cash equivalents 33,388 18,892 16,771 51,977
Loans and borrowings (306,314) (4,043) (255,369) –
Trade and other payables (35,845) (21,548) (35,744) (37,677)
Net statement of financial exposure (197,209) (5,633) (129,179) 15,803
Exposure hedged against forecasted purchase – (6,500) – (16,022)
Net exposure (197,209) (12,133) (129,179) (219)
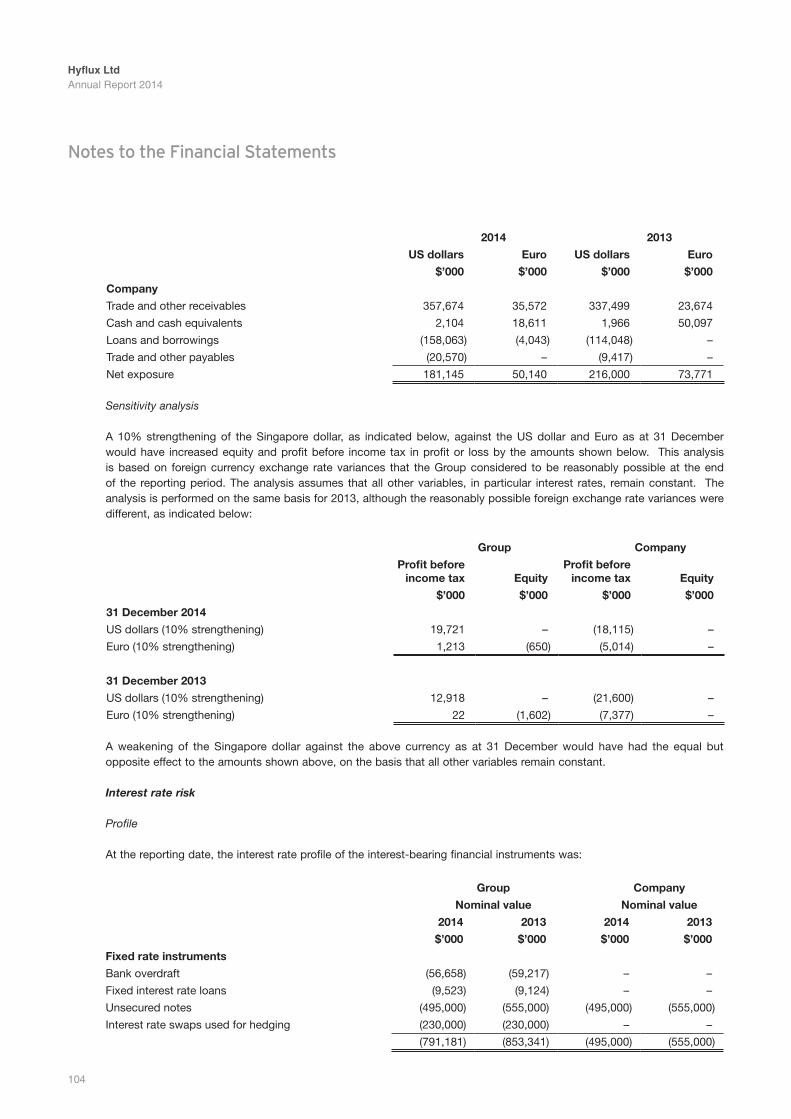
Hyflux LtdAnnual Report 2014
104
Notes to the Financial Statements
2014 2013
us dollars euro us dollars euro
$’000 $’000 $’000 $’000
company
Trade and other receivables 357,674 35,572 337,499 23,674
Cash and cash equivalents 2,104 18,611 1,966 50,097
Loans and borrowings (158,063) (4,043) (114,048) –
Trade and other payables (20,570) – (9,417) –
Net exposure 181,145 50,140 216,000 73,771
Sensitivity analysis
A 10% strengthening of the Singapore dollar, as indicated below, against the US dollar and Euro as at 31 December would have increased equity and profit before income tax in profit or loss by the amounts shown below. This analysis is based on foreign currency exchange rate variances that the Group considered to be reasonably possible at the end of the reporting period. The analysis assumes that all other variables, in particular interest rates, remain constant. The analysis is performed on the same basis for 2013, although the reasonably possible foreign exchange rate variances were different, as indicated below:
Group company
profit before income tax equity
profit before income tax equity
$’000 $’000 $’000 $’000
31 December 2014
US dollars (10% strengthening) 19,721 – (18,115) –
Euro (10% strengthening) 1,213 (650) (5,014) –
31 December 2013
US dollars (10% strengthening) 12,918 – (21,600) –
Euro (10% strengthening) 22 (1,602) (7,377) –
A weakening of the Singapore dollar against the above currency as at 31 December would have had the equal but opposite effect to the amounts shown above, on the basis that all other variables remain constant.
Interest rate risk
Profile
At the reporting date, the interest rate profile of the interest-bearing financial instruments was:
Group company
nominal value nominal value
2014 2013 2014 2013
$’000 $’000 $’000 $’000
Fixed rate instruments
Bank overdraft (56,658) (59,217) – –
Fixed interest rate loans (9,523) (9,124) – –
Unsecured notes (495,000) (555,000) (495,000) (555,000)
Interest rate swaps used for hedging (230,000) (230,000) – –
(791,181) (853,341) (495,000) (555,000)
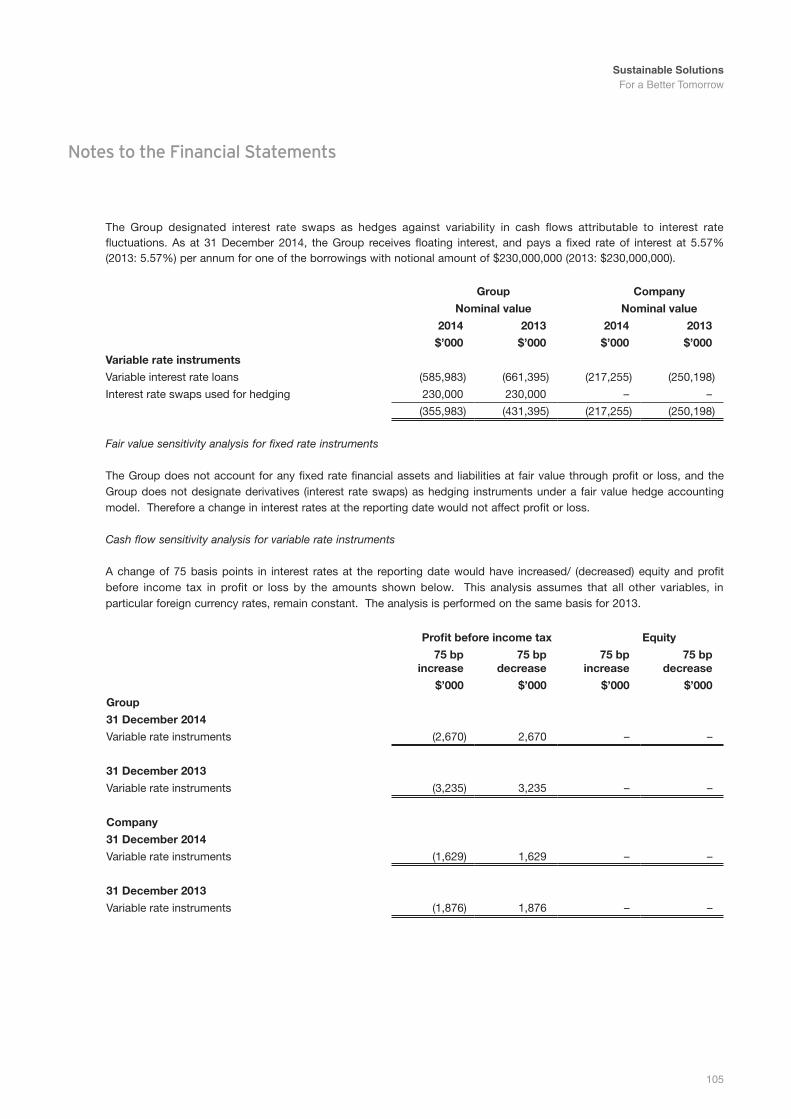
Sustainable Solutions For a Better Tomorrow
105
Notes to the Financial Statements
The Group designated interest rate swaps as hedges against variability in cash flows attributable to interest rate fluctuations. As at 31 December 2014, the Group receives floating interest, and pays a fixed rate of interest at 5.57% (2013: 5.57%) per annum for one of the borrowings with notional amount of $230,000,000 (2013: $230,000,000).
Group company
nominal value nominal value
2014 2013 2014 2013
$’000 $’000 $’000 $’000
variable rate instruments
Variable interest rate loans (585,983) (661,395) (217,255) (250,198)
Interest rate swaps used for hedging 230,000 230,000 – –
(355,983) (431,395) (217,255) (250,198)
Fair value sensitivity analysis for fixed rate instruments
The Group does not account for any fixed rate financial assets and liabilities at fair value through profit or loss, and the Group does not designate derivatives (interest rate swaps) as hedging instruments under a fair value hedge accounting model. Therefore a change in interest rates at the reporting date would not affect profit or loss.
Cash flow sensitivity analysis for variable rate instruments
A change of 75 basis points in interest rates at the reporting date would have increased/ (decreased) equity and profit before income tax in profit or loss by the amounts shown below. This analysis assumes that all other variables, in particular foreign currency rates, remain constant. The analysis is performed on the same basis for 2013.
profit before income tax equity
75 bp increase
75 bp decrease
75 bp increase
75 bp decrease
$’000 $’000 $’000 $’000
Group
31 December 2014
Variable rate instruments (2,670) 2,670 – –
31 December 2013
Variable rate instruments (3,235) 3,235 – –
company
31 December 2014
Variable rate instruments (1,629) 1,629 – –
31 December 2013
Variable rate instruments (1,876) 1,876 – –
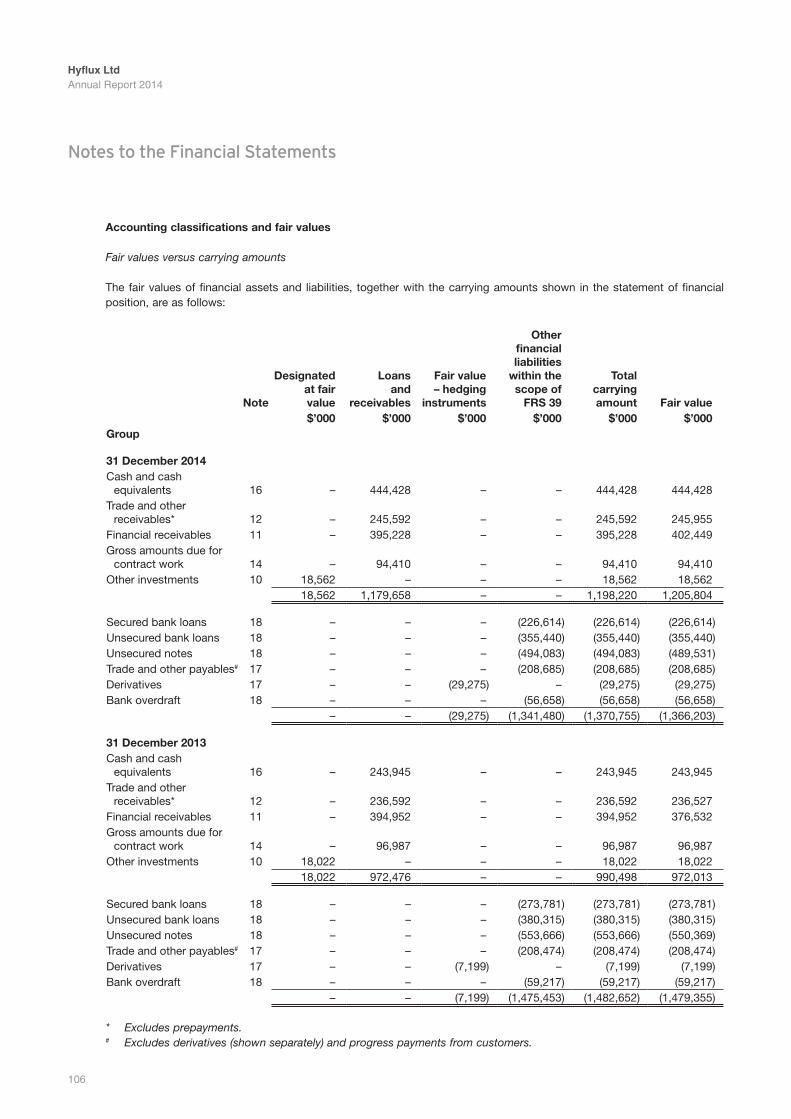
Hyflux LtdAnnual Report 2014
106
Notes to the Financial Statements
Accounting classifications and fair values
Fair values versus carrying amounts
The fair values of financial assets and liabilities, together with the carrying amounts shown in the statement of financial position, are as follows:
note
Designated at fair value
Loansand
receivables
Fair value– hedging
instruments
otherfinancialliabilities
within thescope of
Frs 39
total carryingamount Fair value
$’000 $’000 $’000 $’000 $’000 $’000Group
31 December 2014Cash and cash
equivalents 16 – 444,428 – – 444,428 444,428Trade and other
receivables* 12 – 245,592 – – 245,592 245,955Financial receivables 11 – 395,228 – – 395,228 402,449Gross amounts due for
contract work 14 – 94,410 – – 94,410 94,410Other investments 10 18,562 – – – 18,562 18,562
18,562 1,179,658 – – 1,198,220 1,205,804
Secured bank loans 18 – – – (226,614) (226,614) (226,614)Unsecured bank loans 18 – – – (355,440) (355,440) (355,440)Unsecured notes 18 – – – (494,083) (494,083) (489,531)Trade and other payables# 17 – – – (208,685) (208,685) (208,685)Derivatives 17 – – (29,275) – (29,275) (29,275)Bank overdraft 18 – – – (56,658) (56,658) (56,658)
– – (29,275) (1,341,480) (1,370,755) (1,366,203)
31 December 2013Cash and cash
equivalents 16 – 243,945 – – 243,945 243,945Trade and other
receivables* 12 – 236,592 – – 236,592 236,527Financial receivables 11 – 394,952 – – 394,952 376,532Gross amounts due for
contract work 14 – 96,987 – – 96,987 96,987Other investments 10 18,022 – – – 18,022 18,022
18,022 972,476 – – 990,498 972,013
Secured bank loans 18 – – – (273,781) (273,781) (273,781)Unsecured bank loans 18 – – – (380,315) (380,315) (380,315)Unsecured notes 18 – – – (553,666) (553,666) (550,369)Trade and other payables# 17 – – – (208,474) (208,474) (208,474)Derivatives 17 – – (7,199) – (7,199) (7,199)Bank overdraft 18 – – – (59,217) (59,217) (59,217)
– – (7,199) (1,475,453) (1,482,652) (1,479,355)
* Excludes prepayments.# Excludes derivatives (shown separately) and progress payments from customers.
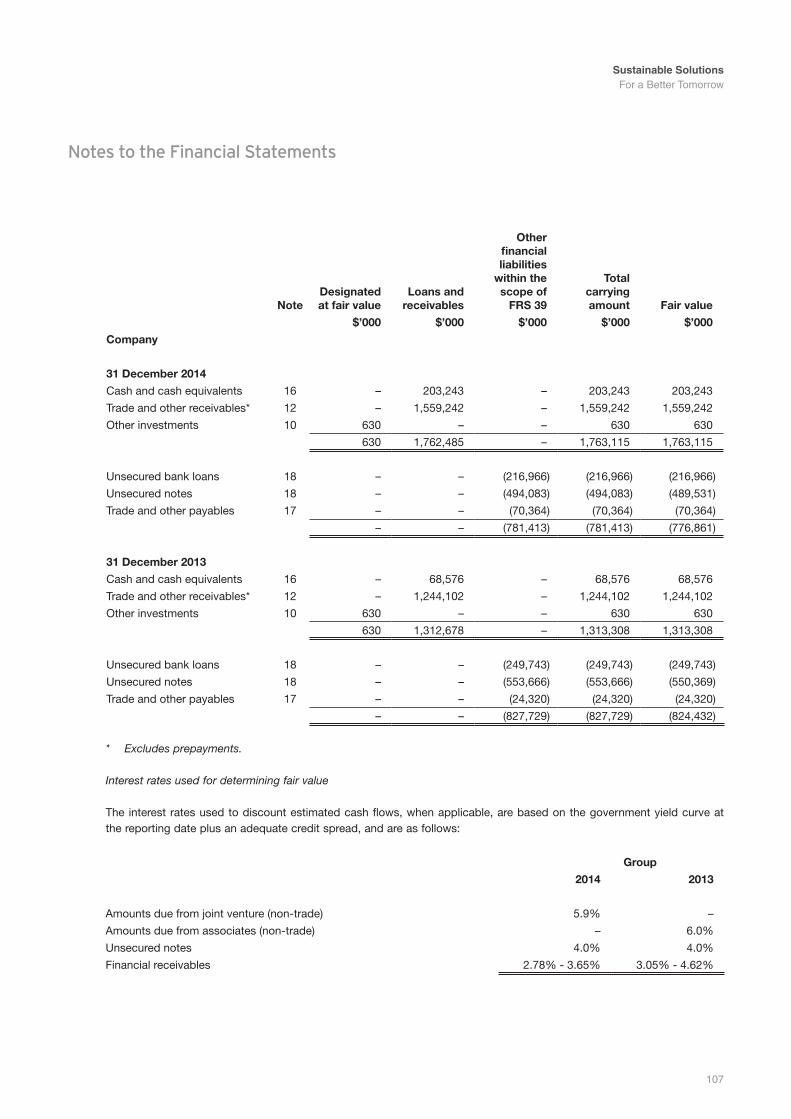
Sustainable Solutions For a Better Tomorrow
107
Notes to the Financial Statements
noteDesignated at fair value
Loans andreceivables
other financialliabilities
within thescope of
Frs 39
total carryingamount Fair value
$’000 $’000 $’000 $’000 $’000
company
31 December 2014
Cash and cash equivalents 16 – 203,243 – 203,243 203,243
Trade and other receivables* 12 – 1,559,242 – 1,559,242 1,559,242
Other investments 10 630 – – 630 630
630 1,762,485 – 1,763,115 1,763,115
Unsecured bank loans 18 – – (216,966) (216,966) (216,966)
Unsecured notes 18 – – (494,083) (494,083) (489,531)
Trade and other payables 17 – – (70,364) (70,364) (70,364)
– – (781,413) (781,413) (776,861)
31 December 2013
Cash and cash equivalents 16 – 68,576 – 68,576 68,576
Trade and other receivables* 12 – 1,244,102 – 1,244,102 1,244,102
Other investments 10 630 – – 630 630
630 1,312,678 – 1,313,308 1,313,308
Unsecured bank loans 18 – – (249,743) (249,743) (249,743)
Unsecured notes 18 – – (553,666) (553,666) (550,369)
Trade and other payables 17 – – (24,320) (24,320) (24,320)
– – (827,729) (827,729) (824,432)
* Excludes prepayments.
Interest rates used for determining fair value
The interest rates used to discount estimated cash flows, when applicable, are based on the government yield curve at the reporting date plus an adequate credit spread, and are as follows:
Group
2014 2013
Amounts due from joint venture (non-trade) 5.9% –
Amounts due from associates (non-trade) – 6.0%
Unsecured notes 4.0% 4.0%
Financial receivables 2.78% - 3.65% 3.05% - 4.62%
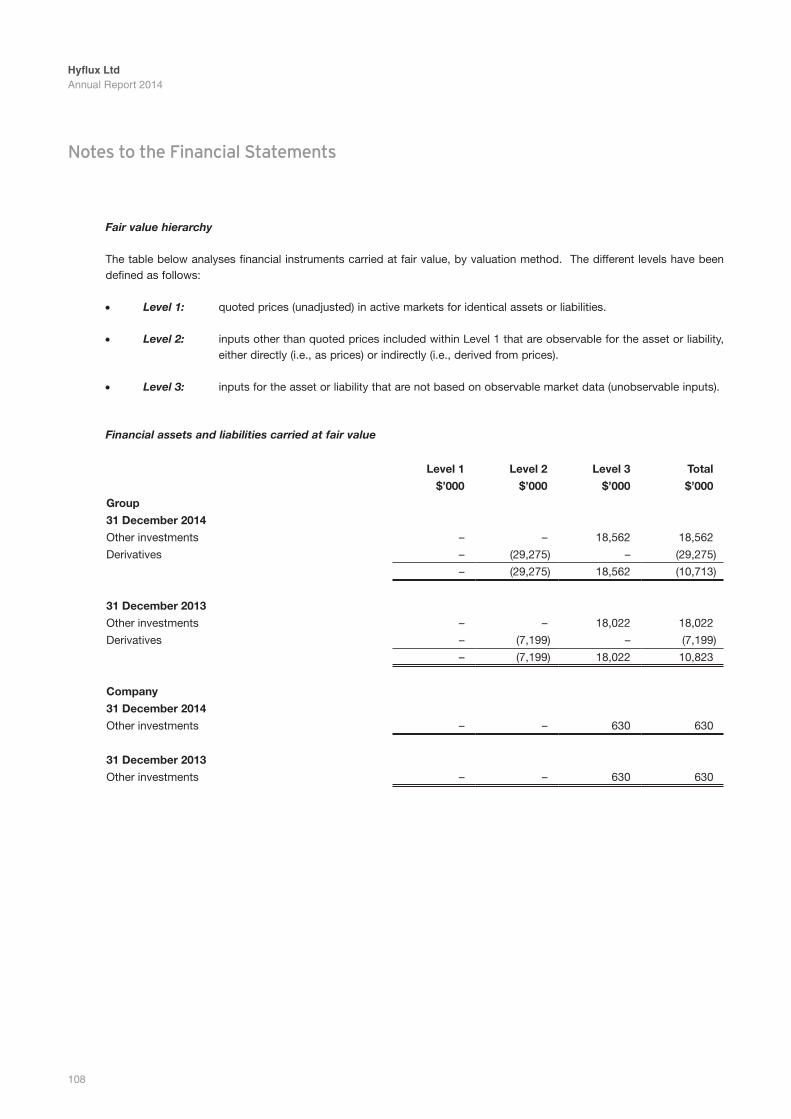
Hyflux LtdAnnual Report 2014
108
Notes to the Financial Statements
Fair value hierarchy
The table below analyses financial instruments carried at fair value, by valuation method. The different levels have been defined as follows:
• Level 1: quoted prices (unadjusted) in active markets for identical assets or liabilities.
• Level 2: inputs other than quoted prices included within Level 1 that are observable for the asset or liability, either directly (i.e., as prices) or indirectly (i.e., derived from prices).
• Level 3: inputs for the asset or liability that are not based on observable market data (unobservable inputs).
Financial assets and liabilities carried at fair value
Level 1 Level 2 Level 3 total
$’000 $’000 $’000 $’000
Group
31 December 2014
Other investments – – 18,562 18,562
Derivatives – (29,275) – (29,275)
– (29,275) 18,562 (10,713)
31 December 2013
Other investments – – 18,022 18,022
Derivatives – (7,199) – (7,199)
– (7,199) 18,022 10,823
company
31 December 2014
Other investments – – 630 630
31 December 2013
Other investments – – 630 630
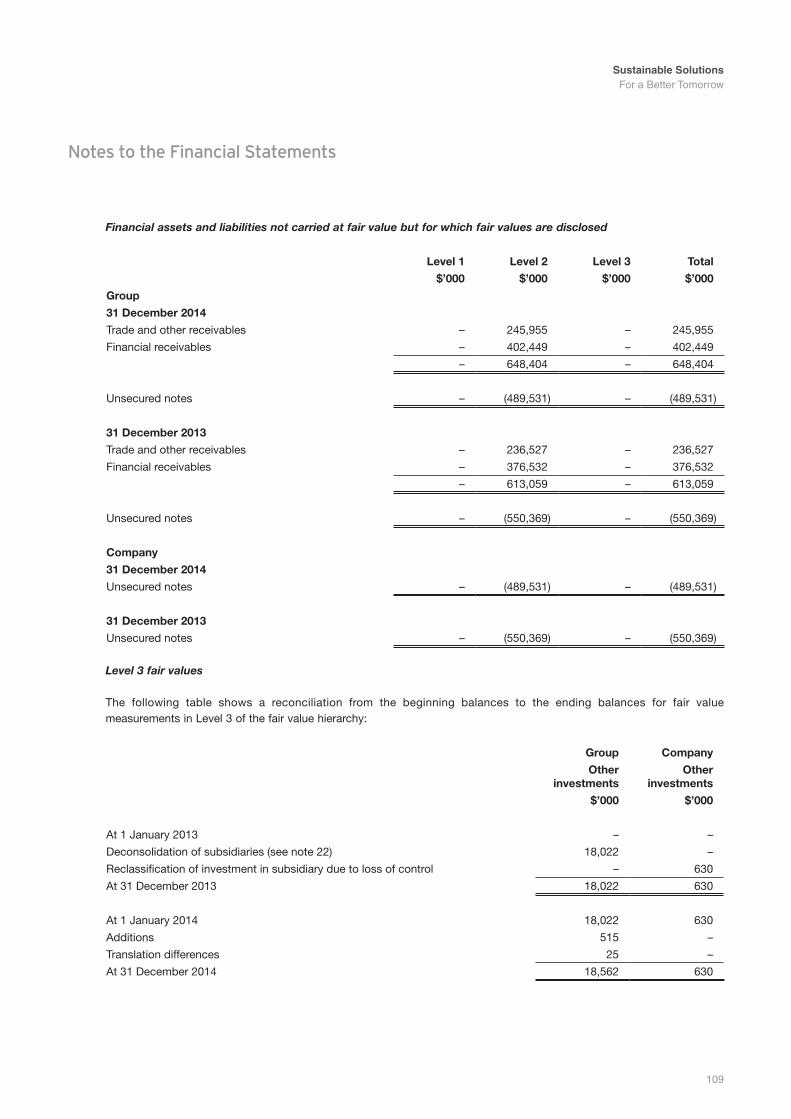
Sustainable Solutions For a Better Tomorrow
109
Notes to the Financial Statements
Financial assets and liabilities not carried at fair value but for which fair values are disclosed
Level 1 Level 2 Level 3 total
$’000 $’000 $’000 $’000
Group
31 December 2014
Trade and other receivables – 245,955 – 245,955
Financial receivables – 402,449 – 402,449
– 648,404 – 648,404
Unsecured notes – (489,531) – (489,531)
31 December 2013
Trade and other receivables – 236,527 – 236,527
Financial receivables – 376,532 – 376,532
– 613,059 – 613,059
Unsecured notes – (550,369) – (550,369)
company
31 December 2014
Unsecured notes – (489,531) – (489,531)
31 December 2013
Unsecured notes – (550,369) – (550,369)
Level 3 fair values
The following table shows a reconciliation from the beginning balances to the ending balances for fair value measurements in Level 3 of the fair value hierarchy:
Group company
other investments
other investments
$’000 $’000
At 1 January 2013 – –
Deconsolidation of subsidiaries (see note 22) 18,022 –
Reclassification of investment in subsidiary due to loss of control – 630
At 31 December 2013 18,022 630
At 1 January 2014 18,022 630
Additions 515 –
Translation differences 25 –
At 31 December 2014 18,562 630
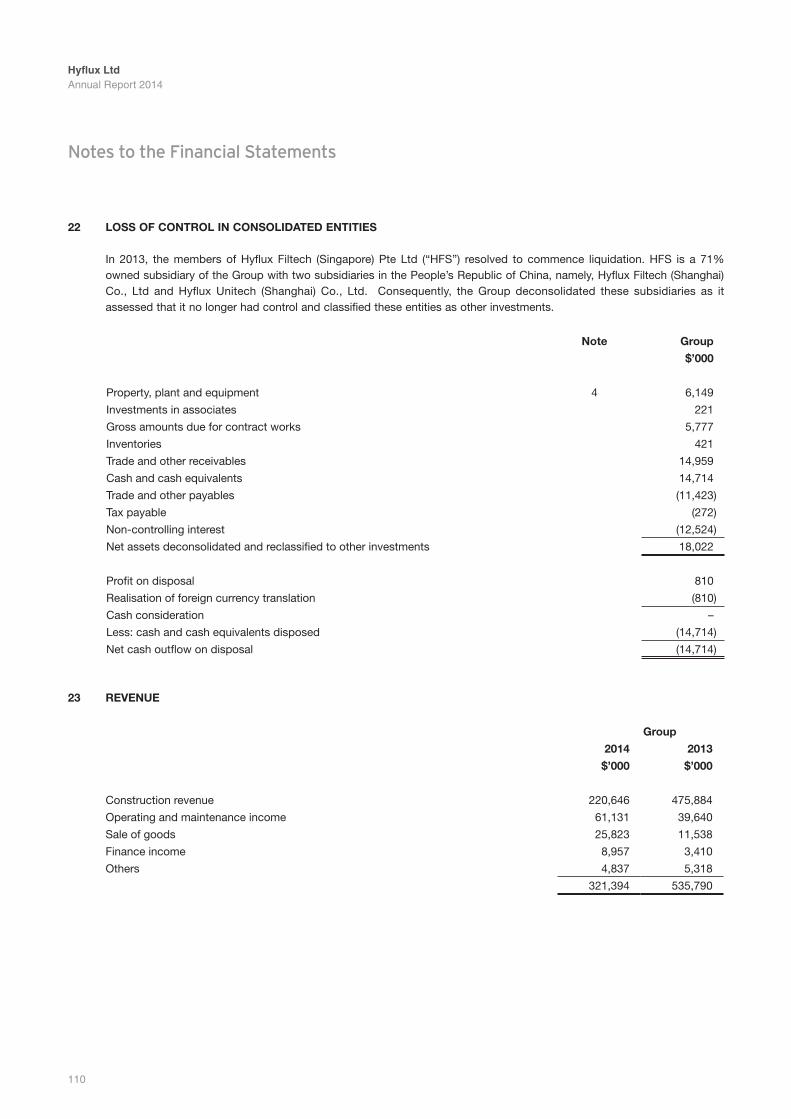
Hyflux LtdAnnual Report 2014
110
Notes to the Financial Statements
22 Loss oF controL in consoLiDAteD entities
In 2013, the members of Hyflux Filtech (Singapore) Pte Ltd (“HFS”) resolved to commence liquidation. HFS is a 71% owned subsidiary of the Group with two subsidiaries in the People’s Republic of China, namely, Hyflux Filtech (Shanghai) Co., Ltd and Hyflux Unitech (Shanghai) Co., Ltd. Consequently, the Group deconsolidated these subsidiaries as it assessed that it no longer had control and classified these entities as other investments.
note Group
$’000
Property, plant and equipment 4 6,149
Investments in associates 221
Gross amounts due for contract works 5,777
Inventories 421
Trade and other receivables 14,959
Cash and cash equivalents 14,714
Trade and other payables (11,423)
Tax payable (272)
Non-controlling interest (12,524)
Net assets deconsolidated and reclassified to other investments 18,022
Profit on disposal 810
Realisation of foreign currency translation (810)
Cash consideration –
Less: cash and cash equivalents disposed (14,714)
Net cash outflow on disposal (14,714)
23 revenue
Group
2014 2013
$’000 $’000
Construction revenue 220,646 475,884
Operating and maintenance income 61,131 39,640
Sale of goods 25,823 11,538
Finance income 8,957 3,410
Others 4,837 5,318
321,394 535,790
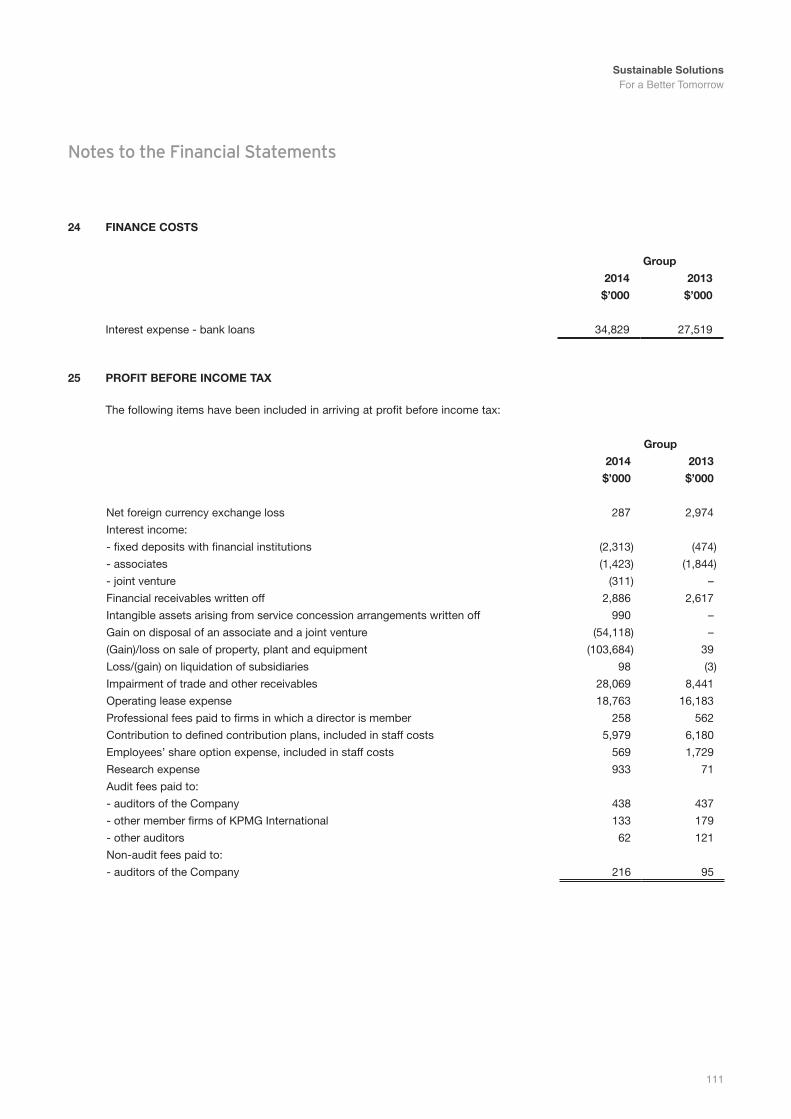
Sustainable Solutions For a Better Tomorrow
111
Notes to the Financial Statements
24 FinAnce costs
Group
2014 2013
$’000 $’000
Interest expense - bank loans 34,829 27,519
25 proFit BeFore income tAx
The following items have been included in arriving at profit before income tax:
Group
2014 2013
$’000 $’000
Net foreign currency exchange loss 287 2,974
Interest income:
- fixed deposits with financial institutions (2,313) (474)
- associates (1,423) (1,844)
- joint venture (311) –
Financial receivables written off 2,886 2,617
Intangible assets arising from service concession arrangements written off 990 –
Gain on disposal of an associate and a joint venture (54,118) –
(Gain)/loss on sale of property, plant and equipment (103,684) 39
Loss/(gain) on liquidation of subsidiaries 98 (3)
Impairment of trade and other receivables 28,069 8,441
Operating lease expense 18,763 16,183
Professional fees paid to firms in which a director is member 258 562
Contribution to defined contribution plans, included in staff costs 5,979 6,180
Employees’ share option expense, included in staff costs 569 1,729
Research expense 933 71
Audit fees paid to:
- auditors of the Company 438 437
- other member firms of KPMG International 133 179
- other auditors 62 121
Non-audit fees paid to:
- auditors of the Company 216 95
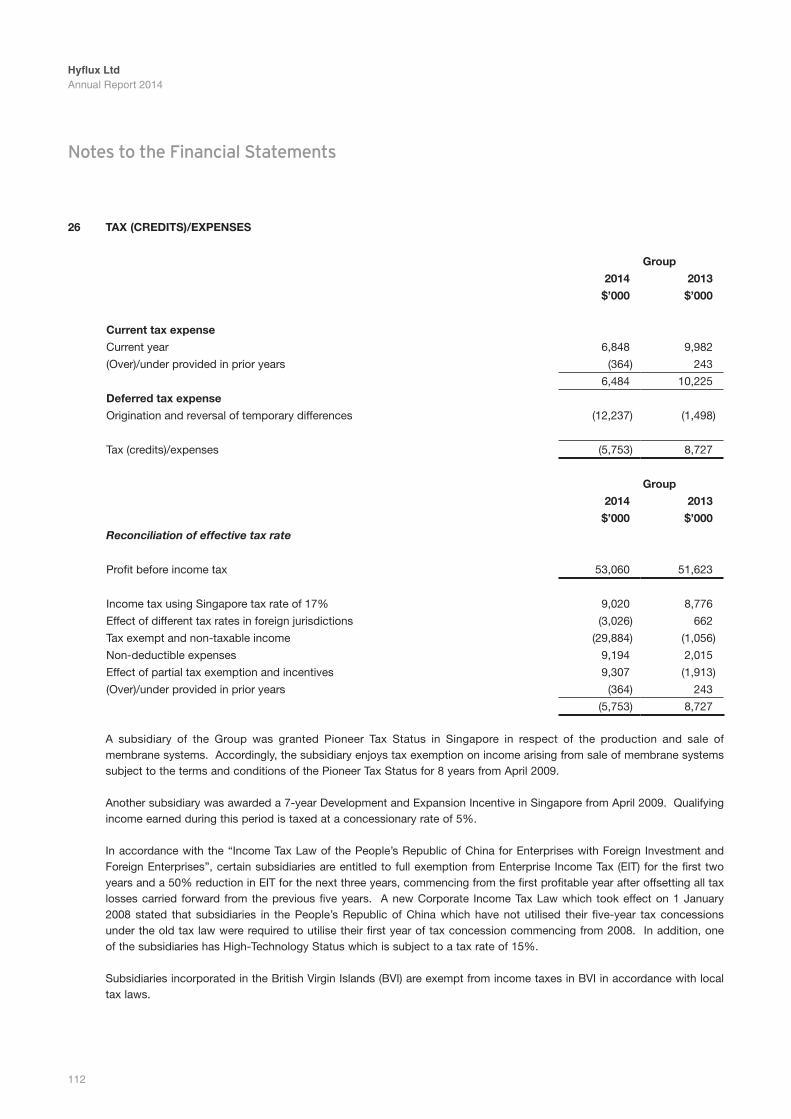
Hyflux LtdAnnual Report 2014
112
Notes to the Financial Statements
26 tAx (creDits)/expenses
Group
2014 2013
$’000 $’000
current tax expense
Current year 6,848 9,982
(Over)/under provided in prior years (364) 243
6,484 10,225
Deferred tax expense
Origination and reversal of temporary differences (12,237) (1,498)
Tax (credits)/expenses (5,753) 8,727
Group
2014 2013
$’000 $’000
Reconciliation of effective tax rate
Profit before income tax 53,060 51,623
Income tax using Singapore tax rate of 17% 9,020 8,776
Effect of different tax rates in foreign jurisdictions (3,026) 662
Tax exempt and non-taxable income (29,884) (1,056)
Non-deductible expenses 9,194 2,015
Effect of partial tax exemption and incentives 9,307 (1,913)
(Over)/under provided in prior years (364) 243
(5,753) 8,727
A subsidiary of the Group was granted Pioneer Tax Status in Singapore in respect of the production and sale of membrane systems. Accordingly, the subsidiary enjoys tax exemption on income arising from sale of membrane systems subject to the terms and conditions of the Pioneer Tax Status for 8 years from April 2009.
Another subsidiary was awarded a 7-year Development and Expansion Incentive in Singapore from April 2009. Qualifying income earned during this period is taxed at a concessionary rate of 5%.
In accordance with the “Income Tax Law of the People’s Republic of China for Enterprises with Foreign Investment and Foreign Enterprises”, certain subsidiaries are entitled to full exemption from Enterprise Income Tax (EIT) for the first two years and a 50% reduction in EIT for the next three years, commencing from the first profitable year after offsetting all tax losses carried forward from the previous five years. A new Corporate Income Tax Law which took effect on 1 January 2008 stated that subsidiaries in the People’s Republic of China which have not utilised their five-year tax concessions under the old tax law were required to utilise their first year of tax concession commencing from 2008. In addition, one of the subsidiaries has High-Technology Status which is subject to a tax rate of 15%.
Subsidiaries incorporated in the British Virgin Islands (BVI) are exempt from income taxes in BVI in accordance with local tax laws.
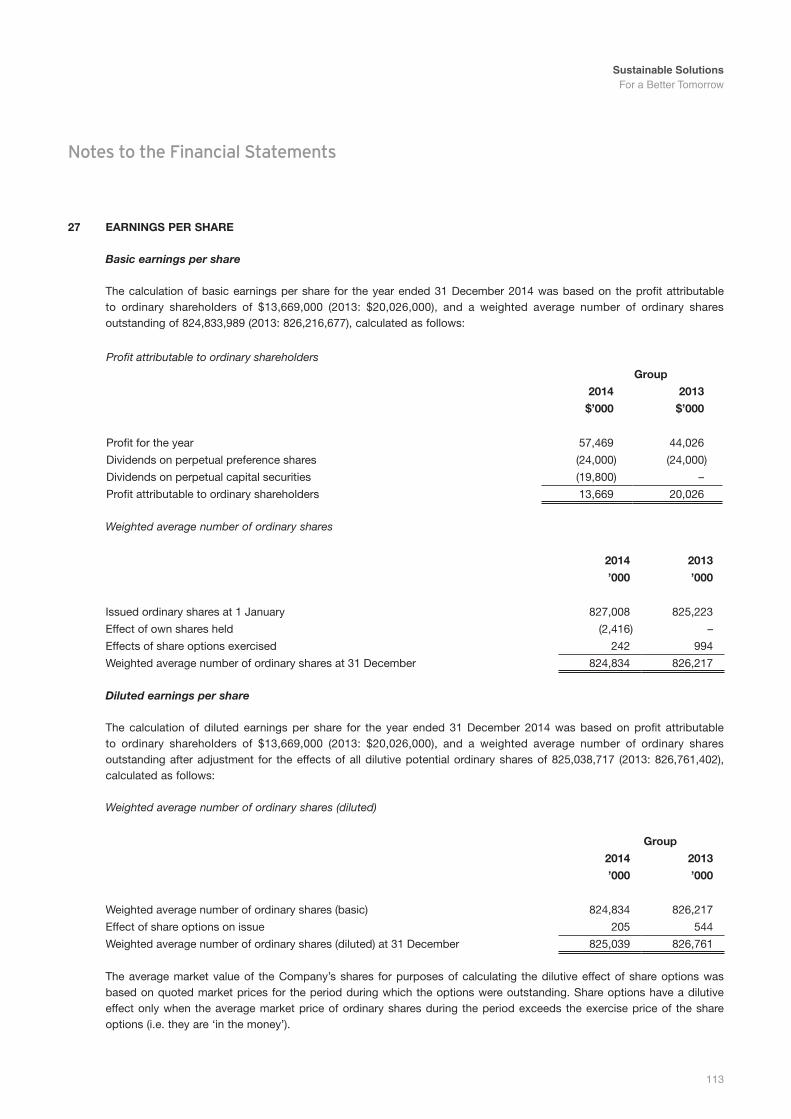
Sustainable Solutions For a Better Tomorrow
113
Notes to the Financial Statements
27 eArninGs per shAre
Basic earnings per share
The calculation of basic earnings per share for the year ended 31 December 2014 was based on the profit attributable to ordinary shareholders of $13,669,000 (2013: $20,026,000), and a weighted average number of ordinary shares outstanding of 824,833,989 (2013: 826,216,677), calculated as follows:
Profit attributable to ordinary shareholders
Group
2014 2013
$’000 $’000
Profit for the year 57,469 44,026
Dividends on perpetual preference shares (24,000) (24,000)
Dividends on perpetual capital securities (19,800) –
Profit attributable to ordinary shareholders 13,669 20,026
Weighted average number of ordinary shares
2014 2013
’000 ’000
Issued ordinary shares at 1 January 827,008 825,223
Effect of own shares held (2,416) –
Effects of share options exercised 242 994
Weighted average number of ordinary shares at 31 December 824,834 826,217
Diluted earnings per share
The calculation of diluted earnings per share for the year ended 31 December 2014 was based on profit attributable to ordinary shareholders of $13,669,000 (2013: $20,026,000), and a weighted average number of ordinary shares outstanding after adjustment for the effects of all dilutive potential ordinary shares of 825,038,717 (2013: 826,761,402), calculated as follows:
Weighted average number of ordinary shares (diluted)
Group
2014 2013
’000 ’000
Weighted average number of ordinary shares (basic) 824,834 826,217
Effect of share options on issue 205 544
Weighted average number of ordinary shares (diluted) at 31 December 825,039 826,761
The average market value of the Company’s shares for purposes of calculating the dilutive effect of share options was based on quoted market prices for the period during which the options were outstanding. Share options have a dilutive effect only when the average market price of ordinary shares during the period exceeds the exercise price of the share options (i.e. they are ‘in the money’).
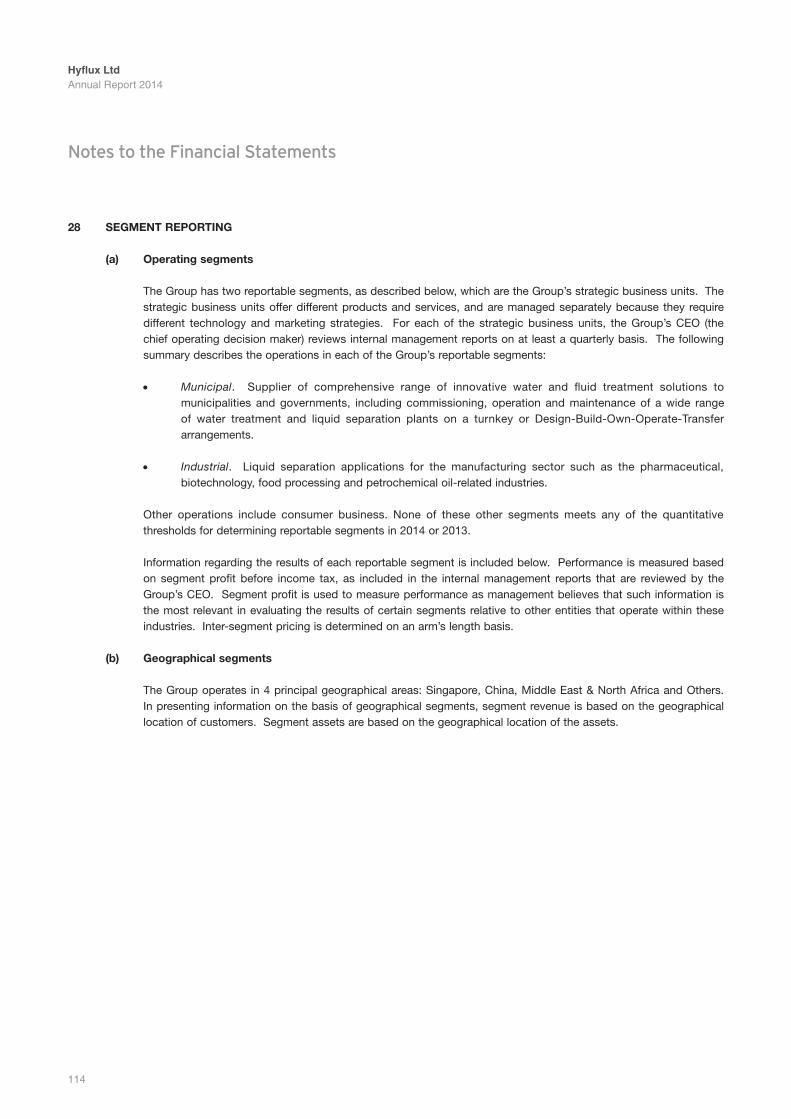
Hyflux LtdAnnual Report 2014
114
Notes to the Financial Statements
28 seGment reportinG
(a) operating segments
The Group has two reportable segments, as described below, which are the Group’s strategic business units. The strategic business units offer different products and services, and are managed separately because they require different technology and marketing strategies. For each of the strategic business units, the Group’s CEO (the chief operating decision maker) reviews internal management reports on at least a quarterly basis. The following summary describes the operations in each of the Group’s reportable segments:
• Municipal. Supplier of comprehensive range of innovative water and fluid treatment solutions to municipalities and governments, including commissioning, operation and maintenance of a wide range of water treatment and liquid separation plants on a turnkey or Design-Build-Own-Operate-Transfer arrangements.
• Industrial. Liquid separation applications for the manufacturing sector such as the pharmaceutical, biotechnology, food processing and petrochemical oil-related industries.
Other operations include consumer business. None of these other segments meets any of the quantitative thresholds for determining reportable segments in 2014 or 2013.
Information regarding the results of each reportable segment is included below. Performance is measured based on segment profit before income tax, as included in the internal management reports that are reviewed by the Group’s CEO. Segment profit is used to measure performance as management believes that such information is the most relevant in evaluating the results of certain segments relative to other entities that operate within these industries. Inter-segment pricing is determined on an arm’s length basis.
(b) Geographical segments
The Group operates in 4 principal geographical areas: Singapore, China, Middle East & North Africa and Others. In presenting information on the basis of geographical segments, segment revenue is based on the geographical location of customers. Segment assets are based on the geographical location of the assets.
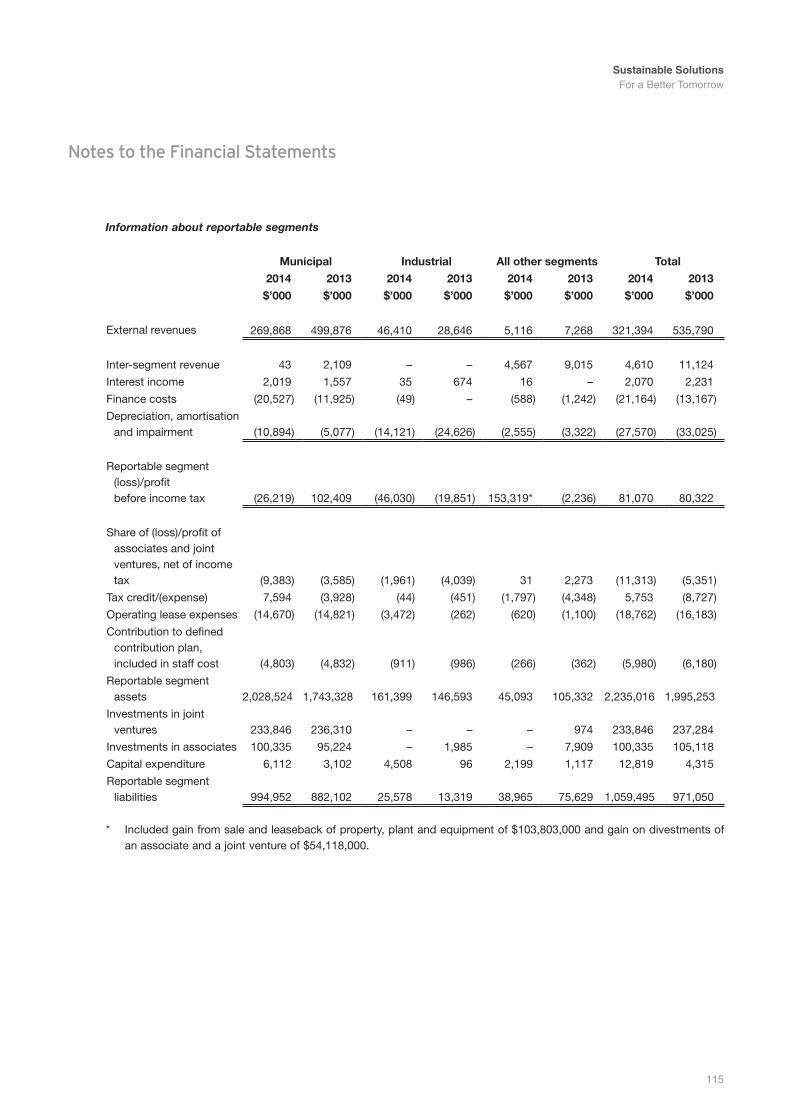
Sustainable Solutions For a Better Tomorrow
115
Notes to the Financial Statements
Information about reportable segments
municipal industrial All other segments total
2014 2013 2014 2013 2014 2013 2014 2013
$’000 $’000 $’000 $’000 $’000 $’000 $’000 $’000
External revenues 269,868 499,876 46,410 28,646 5,116 7,268 321,394 535,790
Inter-segment revenue 43 2,109 – – 4,567 9,015 4,610 11,124
Interest income 2,019 1,557 35 674 16 – 2,070 2,231
Finance costs (20,527) (11,925) (49) – (588) (1,242) (21,164) (13,167)
Depreciation, amortisation and impairment (10,894) (5,077) (14,121) (24,626) (2,555) (3,322) (27,570) (33,025)
Reportable segment (loss)/profit before income tax (26,219) 102,409 (46,030) (19,851) 153,319* (2,236) 81,070 80,322
Share of (loss)/profit of associates and joint ventures, net of income tax (9,383) (3,585) (1,961) (4,039) 31 2,273 (11,313) (5,351)
Tax credit/(expense) 7,594 (3,928) (44) (451) (1,797) (4,348) 5,753 (8,727)
Operating lease expenses (14,670) (14,821) (3,472) (262) (620) (1,100) (18,762) (16,183)
Contribution to defined contribution plan, included in staff cost (4,803) (4,832) (911) (986) (266) (362) (5,980) (6,180)
Reportable segment assets 2,028,524 1,743,328 161,399 146,593 45,093 105,332 2,235,016 1,995,253
Investments in joint ventures 233,846 236,310 – – – 974 233,846 237,284
Investments in associates 100,335 95,224 – 1,985 – 7,909 100,335 105,118
Capital expenditure 6,112 3,102 4,508 96 2,199 1,117 12,819 4,315
Reportable segment liabilities 994,952 882,102 25,578 13,319 38,965 75,629 1,059,495 971,050
* Included gain from sale and leaseback of property, plant and equipment of $103,803,000 and gain on divestments of an associate and a joint venture of $54,118,000.
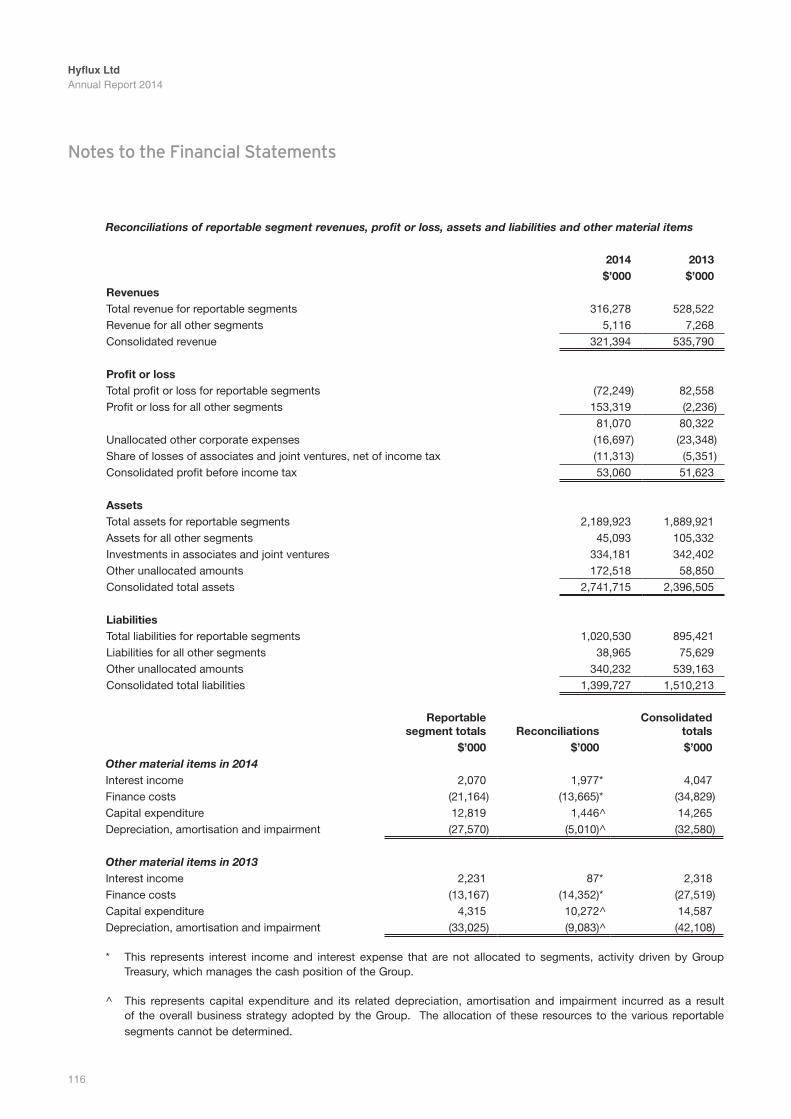
Hyflux LtdAnnual Report 2014
116
Notes to the Financial Statements
Reconciliations of reportable segment revenues, profit or loss, assets and liabilities and other material items
2014 2013$’000 $’000
revenuesTotal revenue for reportable segments 316,278 528,522Revenue for all other segments 5,116 7,268Consolidated revenue 321,394 535,790
profit or lossTotal profit or loss for reportable segments (72,249) 82,558Profit or loss for all other segments 153,319 (2,236)
81,070 80,322Unallocated other corporate expenses (16,697) (23,348)Share of losses of associates and joint ventures, net of income tax (11,313) (5,351)Consolidated profit before income tax 53,060 51,623
AssetsTotal assets for reportable segments 2,189,923 1,889,921Assets for all other segments 45,093 105,332Investments in associates and joint ventures 334,181 342,402Other unallocated amounts 172,518 58,850Consolidated total assets 2,741,715 2,396,505
LiabilitiesTotal liabilities for reportable segments 1,020,530 895,421Liabilities for all other segments 38,965 75,629Other unallocated amounts 340,232 539,163Consolidated total liabilities 1,399,727 1,510,213
reportable segment totals reconciliations
consolidated totals
$’000 $’000 $’000Other material items in 2014Interest income 2,070 1,977* 4,047Finance costs (21,164) (13,665)* (34,829)Capital expenditure 12,819 1,446^ 14,265Depreciation, amortisation and impairment (27,570) (5,010)^ (32,580)
Other material items in 2013 Interest income 2,231 87* 2,318Finance costs (13,167) (14,352)* (27,519)Capital expenditure 4,315 10,272^ 14,587Depreciation, amortisation and impairment (33,025) (9,083)^ (42,108)
* This represents interest income and interest expense that are not allocated to segments, activity driven by Group Treasury, which manages the cash position of the Group.
^ This represents capital expenditure and its related depreciation, amortisation and impairment incurred as a result of the overall business strategy adopted by the Group. The allocation of these resources to the various reportable segments cannot be determined.
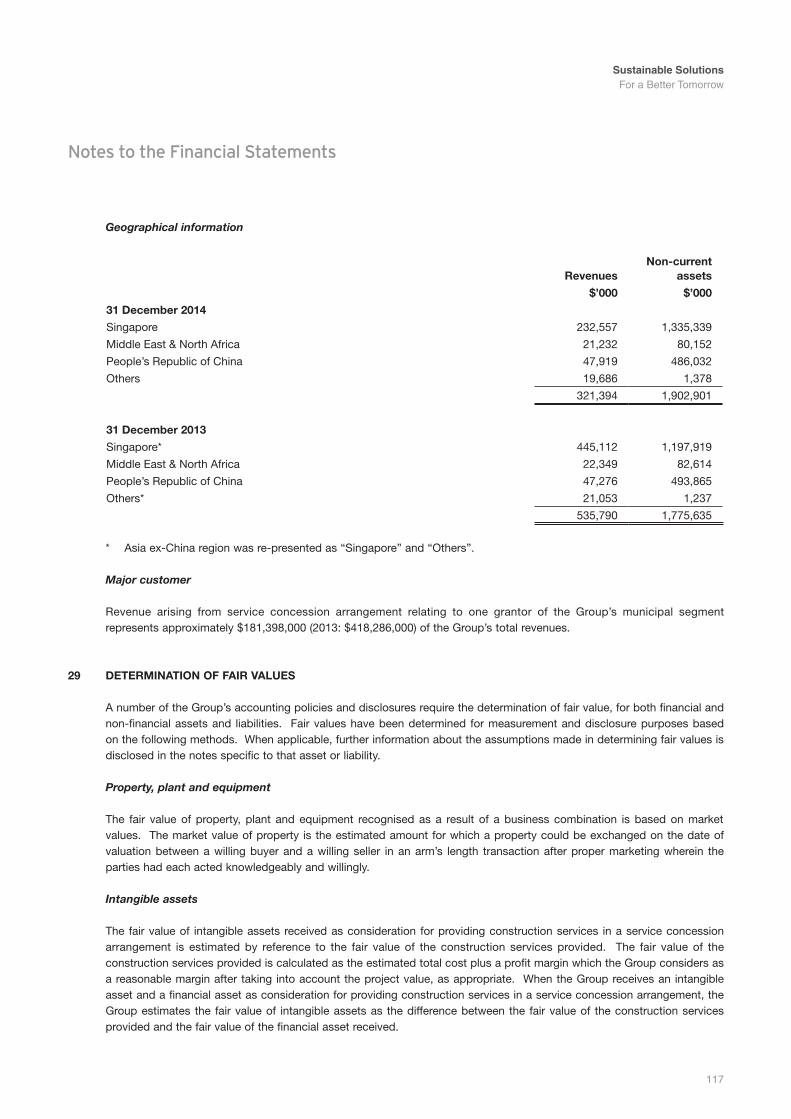
Sustainable Solutions For a Better Tomorrow
117
Notes to the Financial Statements
Geographical information
revenuesnon-current
assets
$’000 $’000
31 December 2014
Singapore 232,557 1,335,339
Middle East & North Africa 21,232 80,152
People’s Republic of China 47,919 486,032
Others 19,686 1,378
321,394 1,902,901
31 December 2013
Singapore* 445,112 1,197,919
Middle East & North Africa 22,349 82,614
People’s Republic of China 47,276 493,865
Others* 21,053 1,237
535,790 1,775,635
* Asia ex-China region was re-presented as “Singapore” and “Others”.
Major customer
Revenue arising from service concession arrangement relating to one grantor of the Group’s municipal segment represents approximately $181,398,000 (2013: $418,286,000) of the Group’s total revenues.
29 DeterminAtion oF FAir vALues
A number of the Group’s accounting policies and disclosures require the determination of fair value, for both financial and non-financial assets and liabilities. Fair values have been determined for measurement and disclosure purposes based on the following methods. When applicable, further information about the assumptions made in determining fair values is disclosed in the notes specific to that asset or liability.
Property, plant and equipment
The fair value of property, plant and equipment recognised as a result of a business combination is based on market values. The market value of property is the estimated amount for which a property could be exchanged on the date of valuation between a willing buyer and a willing seller in an arm’s length transaction after proper marketing wherein the parties had each acted knowledgeably and willingly.
Intangible assets
The fair value of intangible assets received as consideration for providing construction services in a service concession arrangement is estimated by reference to the fair value of the construction services provided. The fair value of the construction services provided is calculated as the estimated total cost plus a profit margin which the Group considers as a reasonable margin after taking into account the project value, as appropriate. When the Group receives an intangible asset and a financial asset as consideration for providing construction services in a service concession arrangement, the Group estimates the fair value of intangible assets as the difference between the fair value of the construction services provided and the fair value of the financial asset received.

Hyflux LtdAnnual Report 2014
118
Notes to the Financial Statements
The fair value of other intangible assets is based on the discounted cash flows expected to be derived from the use and eventual sale of the assets.
Other investments
The fair value of other investments is determined using a valuation technique, or if available by reference to indicative non-binding offer by third parties. Valuation techniques employed include market multiples and discounted cash flow analysis using contractual or expected future cash flows as applicable, and a market-related discount rate.
Trade and other receivables
The fair value of trade and other receivables, including service concession receivables, is estimated as the present value of future cash flows, discounted at the market rate of interest at the reporting date.
Non-derivative financial liabilities
Fair value, which is determined for disclosure purposes, is calculated based on the present value of future principal and interest cash flows, discounted at the market rate of interest at the reporting date. For finance leases, the market rate of interest is determined by reference to similar lease agreements.
Derivatives
The fair value of forward exchange contracts and interest rate swaps are based on their quoted price, if available. If a quoted price is not available, then fair value is estimated by discounting the difference between the contractual forward price and the current forward price for the residual maturity of the contract using a credit-adjusted risk-free interest rate (based on government bonds).
Share-based payment transactions
The fair value of the employees’ share options is measured using the Black-Scholes standard option valuation model. Measurement inputs include share price on measurement date, exercise price of the instrument, expected volatility (based on weighted average historic volatility adjusted for changes expected due to publicly available information), weighted average expected life of the instruments (based on historical experience and general option holder behaviour), expected dividends, and the risk-free interest rate (based on government bonds). Service and non-market performance conditions attached to the grants are not taken into account in determining the fair value of the options.
30 FinAnciAL risK mAnAGement
The Group has exposure to the following risks from its use of financial instruments:
• credit risk• liquidity risk• market risk
This note presents information about the Group’s exposure to each of the above risks, the Group’s objectives, policies and processes for measuring and managing risk, and the Group’s management of capital. Further quantitative disclosures are included throughout these financial statements.
Sustainable Solutions For a Better Tomorrow
119
Notes to the Financial Statements
Risk management framework
The Board of Directors has overall responsibility for the establishment and oversight of the Group’s risk management framework. The Board has established the Risk Management Committee, which is responsible for developing and monitoring the Group’s risk management policies. The committee reports regularly to the Board of Directors on its activities.
The Group’s risk management policies are established to identify and analyse the risks faced by the Group, to set appropriate risk limits and controls, and to monitor risks and adherence to limits. Risk management policies and systems are reviewed regularly to reflect changes in market conditions and the Group’s activities.
The Audit Committee oversees how management monitors compliance with the Group’s risk management policies and procedures, and reviews the adequacy of the risk management framework in relation to the risks faced by the Group. The Audit Committee is assisted in its oversight role by Internal Audit. Internal Audit undertakes regular reviews of risk management controls and procedures, the results of which are reported to the Audit Committee.
Credit risk
Credit risk is the risk of financial loss to the Group if a customer or counterparty to a financial instrument fails to meet its contractual obligations, and arises principally from the Group’s receivables from customers.
Loan and other receivables
The Group’s exposure to credit risk is influenced mainly by the individual characteristics of each customer. However, management also considers the demographics of the Group’s customer base, including the default risk of the industry and country in which customers operate, as these factors may have an influence on credit risk.
The Group has a credit policy in place which establishes credit limits for all customers and monitors their balances on an ongoing basis.
The Group establishes an allowance for impairment that represents its estimate of incurred losses in respect of loan and other receivables. The main components of this allowance are a specific loss component that relates to individually significant exposures, and a collective loss component established for groups of similar assets in respect of losses that have been incurred but not yet identified. The collective loss allowance is determined based on historical data of payment statistics for similar financial assets.
Intra-group financial guarantees
The Group’s policy is to provide financial guarantees only to subsidiaries and joint ventures.
The credit risk associated with the financial guarantees represents the loss that would be recognised upon a default by the parties to which the guarantees were given on behalf of. To mitigate these risks, management continually monitors the risks and has established processes including performing credit evaluations of the parties it is providing the guarantee on behalf of.
The Company granted intra-group corporate guarantees to financial institutions in respect of banking facilities provided to its subsidiaries. These financial guarantees will expire when the loans have been repaid and discharged and/or when the banking facilities are no longer available.
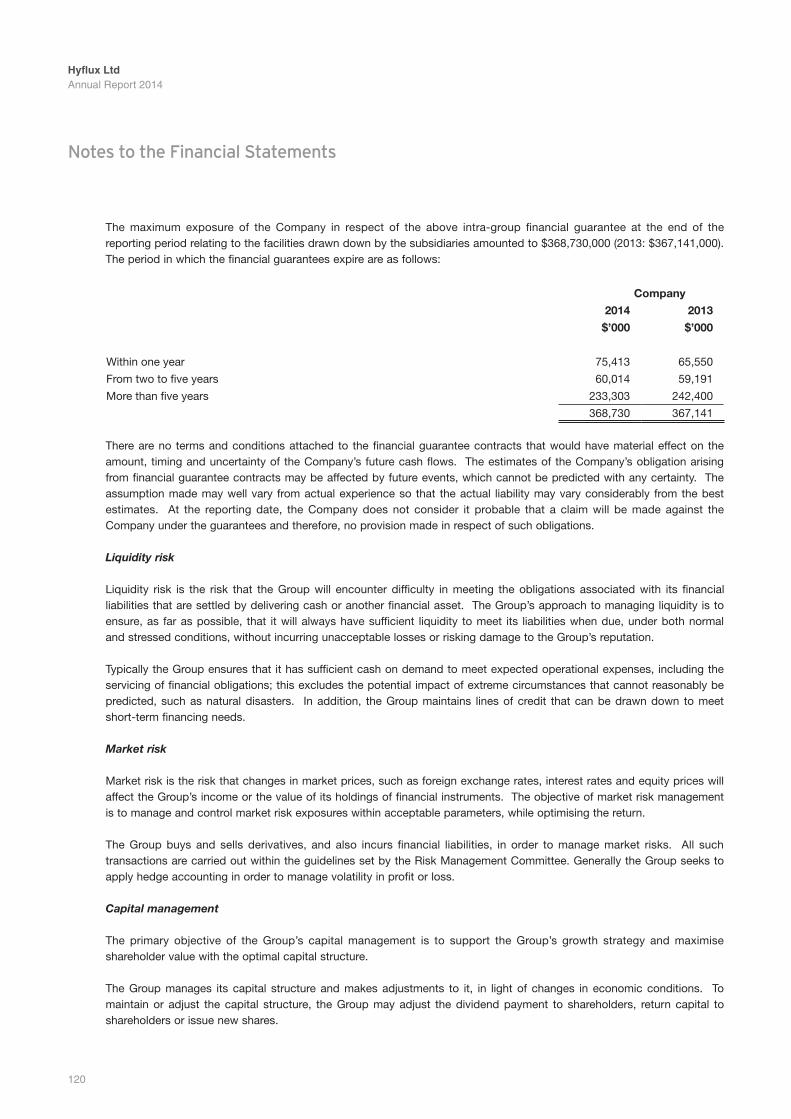
Hyflux LtdAnnual Report 2014
120
Notes to the Financial Statements
The maximum exposure of the Company in respect of the above intra-group financial guarantee at the end of the reporting period relating to the facilities drawn down by the subsidiaries amounted to $368,730,000 (2013: $367,141,000). The period in which the financial guarantees expire are as follows:
company
2014 2013
$’000 $’000
Within one year 75,413 65,550
From two to five years 60,014 59,191
More than five years 233,303 242,400
368,730 367,141
There are no terms and conditions attached to the financial guarantee contracts that would have material effect on the amount, timing and uncertainty of the Company’s future cash flows. The estimates of the Company’s obligation arising from financial guarantee contracts may be affected by future events, which cannot be predicted with any certainty. The assumption made may well vary from actual experience so that the actual liability may vary considerably from the best estimates. At the reporting date, the Company does not consider it probable that a claim will be made against the Company under the guarantees and therefore, no provision made in respect of such obligations.
Liquidity risk
Liquidity risk is the risk that the Group will encounter difficulty in meeting the obligations associated with its financial liabilities that are settled by delivering cash or another financial asset. The Group’s approach to managing liquidity is to ensure, as far as possible, that it will always have sufficient liquidity to meet its liabilities when due, under both normal and stressed conditions, without incurring unacceptable losses or risking damage to the Group’s reputation.
Typically the Group ensures that it has sufficient cash on demand to meet expected operational expenses, including the servicingoffinancialobligations;thisexcludesthepotentialimpactofextremecircumstancesthatcannotreasonablybepredicted, such as natural disasters. In addition, the Group maintains lines of credit that can be drawn down to meet short-term financing needs.
Market risk
Market risk is the risk that changes in market prices, such as foreign exchange rates, interest rates and equity prices will affect the Group’s income or the value of its holdings of financial instruments. The objective of market risk management is to manage and control market risk exposures within acceptable parameters, while optimising the return.
The Group buys and sells derivatives, and also incurs financial liabilities, in order to manage market risks. All such transactions are carried out within the guidelines set by the Risk Management Committee. Generally the Group seeks to apply hedge accounting in order to manage volatility in profit or loss.
Capital management
The primary objective of the Group’s capital management is to support the Group’s growth strategy and maximise shareholder value with the optimal capital structure.
The Group manages its capital structure and makes adjustments to it, in light of changes in economic conditions. To maintain or adjust the capital structure, the Group may adjust the dividend payment to shareholders, return capital to shareholders or issue new shares.
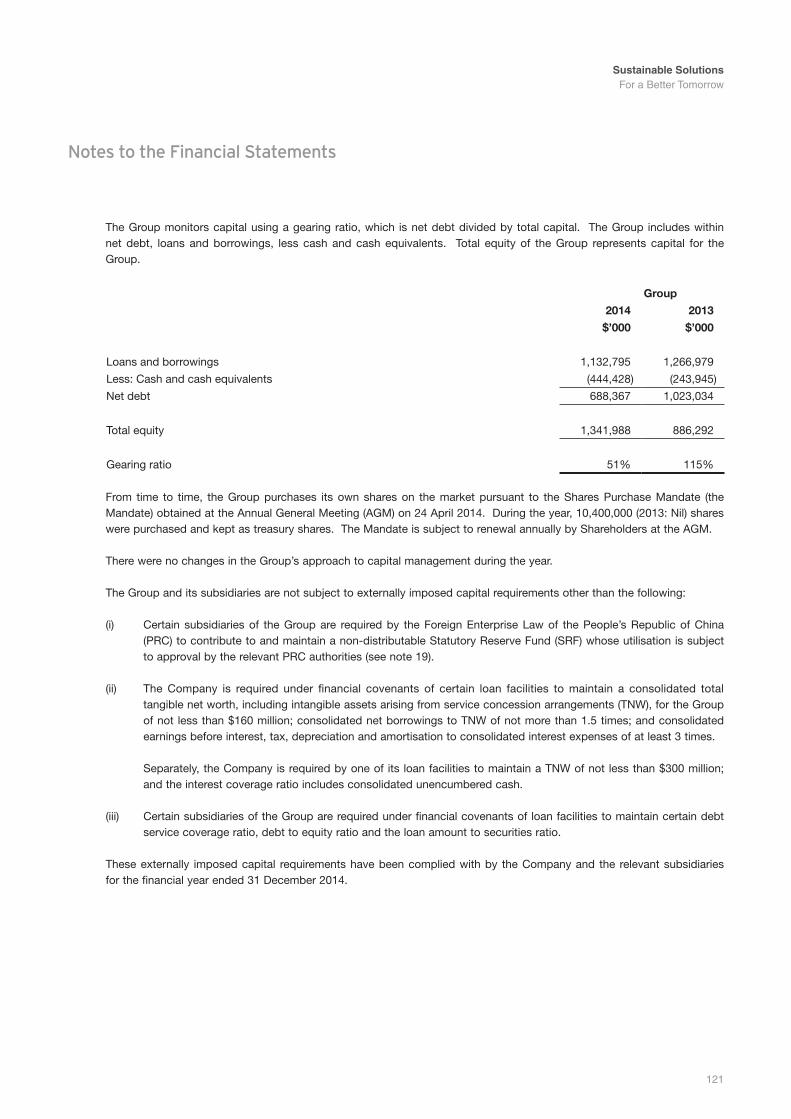
Sustainable Solutions For a Better Tomorrow
121
Notes to the Financial Statements
The Group monitors capital using a gearing ratio, which is net debt divided by total capital. The Group includes within net debt, loans and borrowings, less cash and cash equivalents. Total equity of the Group represents capital for the Group.
Group
2014 2013
$’000 $’000
Loans and borrowings 1,132,795 1,266,979
Less: Cash and cash equivalents (444,428) (243,945)
Net debt 688,367 1,023,034
Total equity 1,341,988 886,292
Gearing ratio 51% 115%
From time to time, the Group purchases its own shares on the market pursuant to the Shares Purchase Mandate (the Mandate) obtained at the Annual General Meeting (AGM) on 24 April 2014. During the year, 10,400,000 (2013: Nil) shares were purchased and kept as treasury shares. The Mandate is subject to renewal annually by Shareholders at the AGM.
There were no changes in the Group’s approach to capital management during the year.
The Group and its subsidiaries are not subject to externally imposed capital requirements other than the following:
(i) Certain subsidiaries of the Group are required by the Foreign Enterprise Law of the People’s Republic of China (PRC) to contribute to and maintain a non-distributable Statutory Reserve Fund (SRF) whose utilisation is subject to approval by the relevant PRC authorities (see note 19).
(ii) The Company is required under financial covenants of certain loan facilities to maintain a consolidated total tangible net worth, including intangible assets arising from service concession arrangements (TNW), for the Group ofnot lessthan$160million;consolidatednetborrowingstoTNWofnotmorethan1.5times;andconsolidatedearnings before interest, tax, depreciation and amortisation to consolidated interest expenses of at least 3 times.
Separately,theCompanyisrequiredbyoneof itsloanfacilitiestomaintainaTNWofnotlessthan$300million;and the interest coverage ratio includes consolidated unencumbered cash.
(iii) Certain subsidiaries of the Group are required under financial covenants of loan facilities to maintain certain debt service coverage ratio, debt to equity ratio and the loan amount to securities ratio.
These externally imposed capital requirements have been complied with by the Company and the relevant subsidiaries for the financial year ended 31 December 2014.
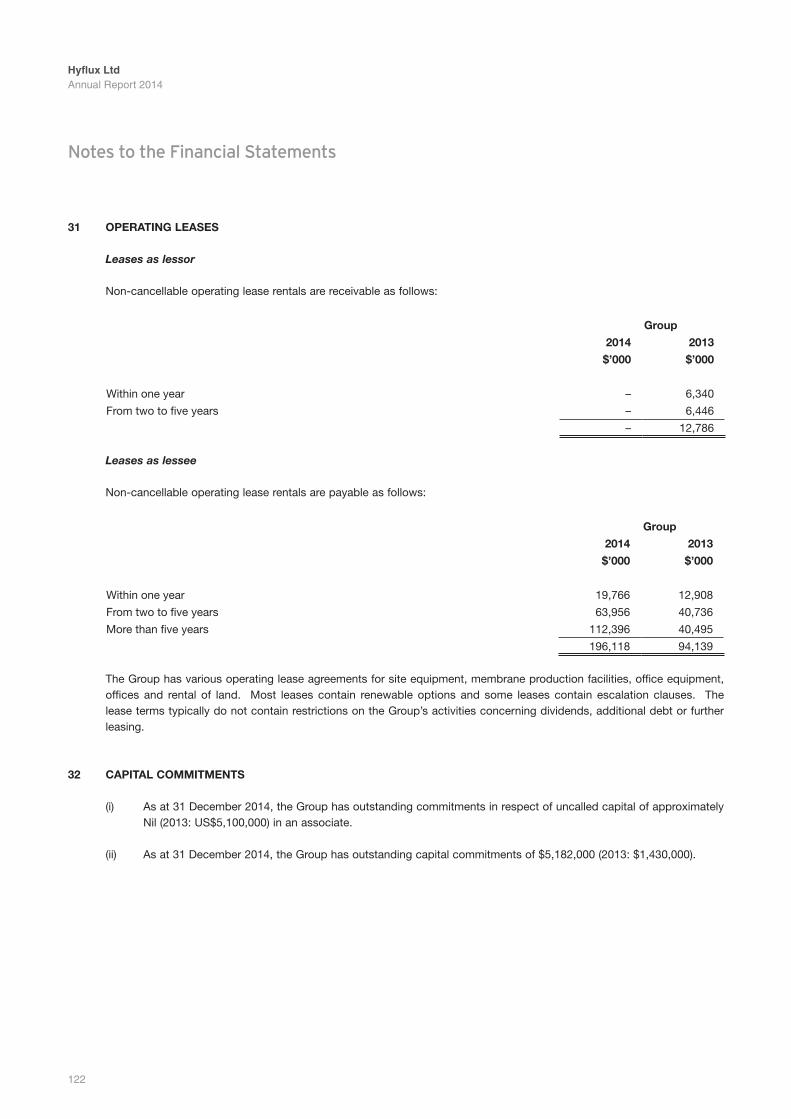
Hyflux LtdAnnual Report 2014
122
Notes to the Financial Statements
31 operAtinG LeAses
Leases as lessor
Non-cancellable operating lease rentals are receivable as follows:
Group
2014 2013
$’000 $’000
Within one year – 6,340
From two to five years – 6,446
– 12,786
Leases as lessee
Non-cancellable operating lease rentals are payable as follows:
Group
2014 2013
$’000 $’000
Within one year 19,766 12,908
From two to five years 63,956 40,736
More than five years 112,396 40,495
196,118 94,139
The Group has various operating lease agreements for site equipment, membrane production facilities, office equipment, offices and rental of land. Most leases contain renewable options and some leases contain escalation clauses. The lease terms typically do not contain restrictions on the Group’s activities concerning dividends, additional debt or further leasing.
32 cApitAL commitments
(i) As at 31 December 2014, the Group has outstanding commitments in respect of uncalled capital of approximately Nil (2013: US$5,100,000) in an associate.
(ii) As at 31 December 2014, the Group has outstanding capital commitments of $5,182,000 (2013: $1,430,000).
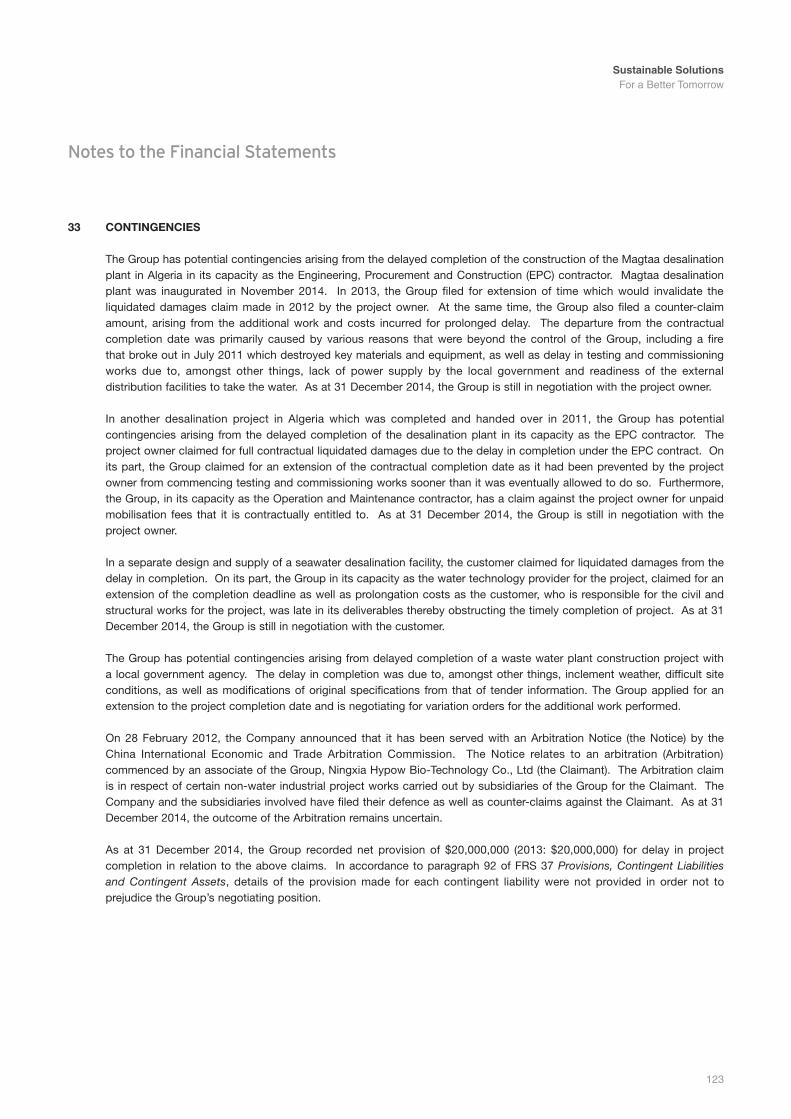
Sustainable Solutions For a Better Tomorrow
123
Notes to the Financial Statements
33 continGencies
The Group has potential contingencies arising from the delayed completion of the construction of the Magtaa desalination plant in Algeria in its capacity as the Engineering, Procurement and Construction (EPC) contractor. Magtaa desalination plant was inaugurated in November 2014. In 2013, the Group filed for extension of time which would invalidate the liquidated damages claim made in 2012 by the project owner. At the same time, the Group also filed a counter-claim amount, arising from the additional work and costs incurred for prolonged delay. The departure from the contractual completion date was primarily caused by various reasons that were beyond the control of the Group, including a fire that broke out in July 2011 which destroyed key materials and equipment, as well as delay in testing and commissioning works due to, amongst other things, lack of power supply by the local government and readiness of the external distribution facilities to take the water. As at 31 December 2014, the Group is still in negotiation with the project owner.
In another desalination project in Algeria which was completed and handed over in 2011, the Group has potential contingencies arising from the delayed completion of the desalination plant in its capacity as the EPC contractor. The project owner claimed for full contractual liquidated damages due to the delay in completion under the EPC contract. On its part, the Group claimed for an extension of the contractual completion date as it had been prevented by the project owner from commencing testing and commissioning works sooner than it was eventually allowed to do so. Furthermore, the Group, in its capacity as the Operation and Maintenance contractor, has a claim against the project owner for unpaid mobilisation fees that it is contractually entitled to. As at 31 December 2014, the Group is still in negotiation with the project owner.
In a separate design and supply of a seawater desalination facility, the customer claimed for liquidated damages from the delay in completion. On its part, the Group in its capacity as the water technology provider for the project, claimed for an extension of the completion deadline as well as prolongation costs as the customer, who is responsible for the civil and structural works for the project, was late in its deliverables thereby obstructing the timely completion of project. As at 31 December 2014, the Group is still in negotiation with the customer.
The Group has potential contingencies arising from delayed completion of a waste water plant construction project with a local government agency. The delay in completion was due to, amongst other things, inclement weather, difficult site conditions, as well as modifications of original specifications from that of tender information. The Group applied for an extension to the project completion date and is negotiating for variation orders for the additional work performed.
On 28 February 2012, the Company announced that it has been served with an Arbitration Notice (the Notice) by the China International Economic and Trade Arbitration Commission. The Notice relates to an arbitration (Arbitration) commenced by an associate of the Group, Ningxia Hypow Bio-Technology Co., Ltd (the Claimant). The Arbitration claim is in respect of certain non-water industrial project works carried out by subsidiaries of the Group for the Claimant. The Company and the subsidiaries involved have filed their defence as well as counter-claims against the Claimant. As at 31 December 2014, the outcome of the Arbitration remains uncertain.
As at 31 December 2014, the Group recorded net provision of $20,000,000 (2013: $20,000,000) for delay in project completion in relation to the above claims. In accordance to paragraph 92 of FRS 37 Provisions, Contingent Liabilities and Contingent Assets, details of the provision made for each contingent liability were not provided in order not to prejudice the Group’s negotiating position.
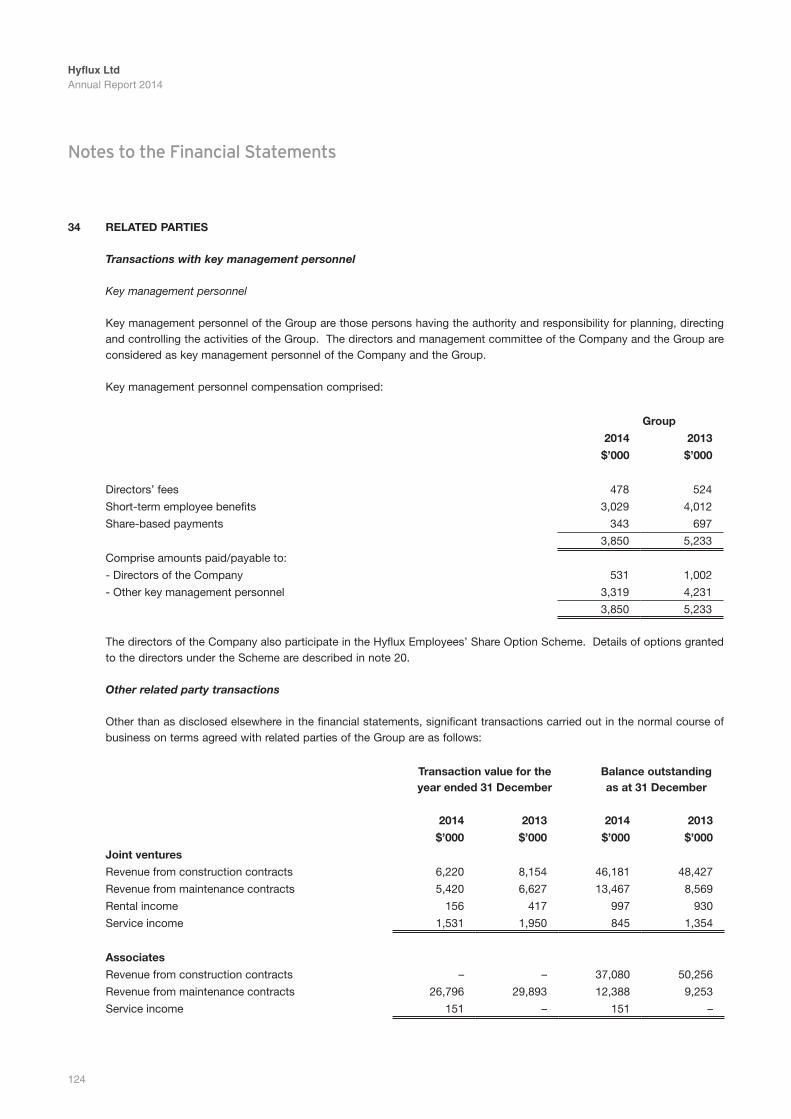
Hyflux LtdAnnual Report 2014
124
Notes to the Financial Statements
34 reLAteD pArties
Transactions with key management personnel
Key management personnel
Key management personnel of the Group are those persons having the authority and responsibility for planning, directing and controlling the activities of the Group. The directors and management committee of the Company and the Group are considered as key management personnel of the Company and the Group.
Key management personnel compensation comprised:
Group
2014 2013
$’000 $’000
Directors’ fees 478 524
Short-term employee benefits 3,029 4,012
Share-based payments 343 697
3,850 5,233
Comprise amounts paid/payable to:
- Directors of the Company 531 1,002
- Other key management personnel 3,319 4,231
3,850 5,233
The directors of the Company also participate in the Hyflux Employees’ Share Option Scheme. Details of options granted to the directors under the Scheme are described in note 20.
Other related party transactions
Other than as disclosed elsewhere in the financial statements, significant transactions carried out in the normal course of business on terms agreed with related parties of the Group are as follows:
transaction value for the year ended 31 December
Balance outstanding as at 31 December
2014 2013 2014 2013
$’000 $’000 $’000 $’000
Joint ventures
Revenue from construction contracts 6,220 8,154 46,181 48,427
Revenue from maintenance contracts 5,420 6,627 13,467 8,569
Rental income 156 417 997 930
Service income 1,531 1,950 845 1,354
Associates
Revenue from construction contracts – – 37,080 50,256
Revenue from maintenance contracts 26,796 29,893 12,388 9,253
Service income 151 – 151 –
Sustainable Solutions For a Better Tomorrow
125
Notes to the Financial Statements
35 suBsequent events
• In 2014, the Group entered into conditional sale and purchase agreements to dispose of a leasehold building to a third party. The leasehold building, with a carrying value of $3,953,000 was classified as asset held for sale as at 31 December 2014. Subsequent to year-end, the Group finalised the disposal of the building upon satisfaction of terms and conditions pursuant to the sale and purchase agreements.
• In January 2015, the Company purchased 10,108,300 of its own shares amounting to $9,297,000 pursuant to the share buyback mandate approved by shareholders during the Annual General Meeting held on 24 April 2014. The shares were bought out of profits and are kept as treasury shares of the Company.
• On 13 January 2015, the Company commenced a consent solicitation exercise seeking approval from the holders of each of Series 006, 007, 008, 009 and 010 unsecured notes issued under the $800,000,000 Multicurrency Debt Issuance Programme to amend certain financial covenants of the unsecured notes issued.
The purpose of the proposed amendments was to (i) raise the threshold for the minimum consolidated tangible networthto$300,000,000;(ii)tobroadentheinterestcovercovenanttoincludetheunencumberedcashpositionoftheGroup;(iii)minorchangestoupdatethedefinitionsofconsolidatedtangiblenetworth,consolidatedEBITDAandconsolidated interestexpense;and (iv)align the frequencyofprovidingcertaincompliancecertificatesonasemi-annual basis instead of the current quarterly basis with the reporting frequency of the Group’s other facilities.
On 5 February 2015, the Company obtained approval from the holders of the unsecured notes of each of the series to the financial covenants. A third supplemental trust deed was entered into on the same day.
• On 12 March 2015, the Company granted 5,920,000 share options pursuant to Hyflux Employees’ Share Option Scheme 2011 at an exercise price of $0.858 per share. The validity period of options granted is from 12 March 2015 to 11 March 2025.
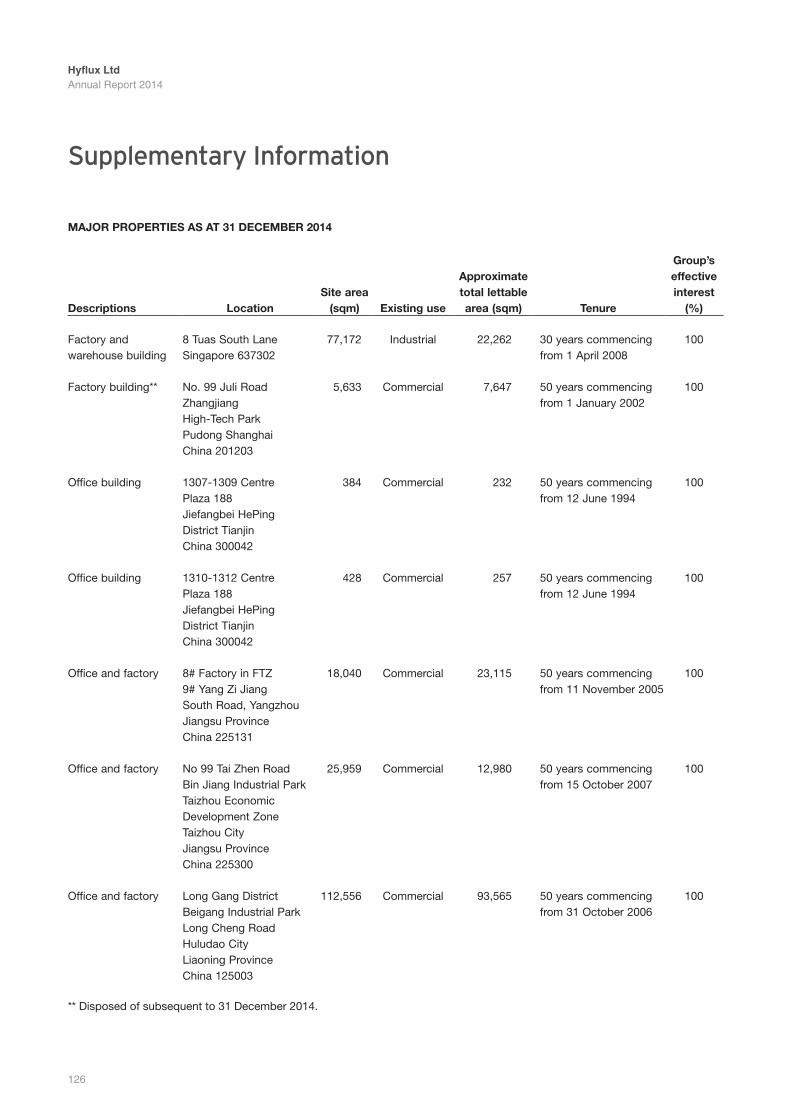
Hyflux LtdAnnual Report 2014
126
Supplementary Information
mAJor properties As At 31 DecemBer 2014
Descriptions Locationsite area
(sqm) existing use
Approximatetotal lettablearea (sqm) tenure
Group’seffectiveinterest
(%)
Factory andwarehouse building
8 Tuas South LaneSingapore 637302
77,172 Industrial 22,262 30 years commencingfrom 1 April 2008
100
Factory building** No. 99 Juli RoadZhangjiangHigh-Tech ParkPudong ShanghaiChina 201203
5,633 Commercial 7,647 50 years commencingfrom 1 January 2002
100
Office building 1307-1309 CentrePlaza 188Jiefangbei HePingDistrict TianjinChina 300042
384 Commercial 232 50 years commencingfrom 12 June 1994
100
Office building 1310-1312 CentrePlaza 188Jiefangbei HePingDistrict TianjinChina 300042
428 Commercial 257 50 years commencingfrom 12 June 1994
100
Office and factory 8# Factory in FTZ9# Yang Zi JiangSouth Road, YangzhouJiangsu ProvinceChina 225131
18,040 Commercial 23,115 50 years commencingfrom 11 November 2005
100
Office and factory No 99 Tai Zhen RoadBin Jiang Industrial ParkTaizhou EconomicDevelopment ZoneTaizhou City Jiangsu ProvinceChina 225300
25,959 Commercial 12,980 50 years commencingfrom 15 October 2007
100
Office and factory Long Gang DistrictBeigang Industrial ParkLong Cheng RoadHuludao CityLiaoning ProvinceChina 125003
112,556 Commercial 93,565 50 years commencingfrom 31 October 2006
100
** Disposed of subsequent to 31 December 2014.
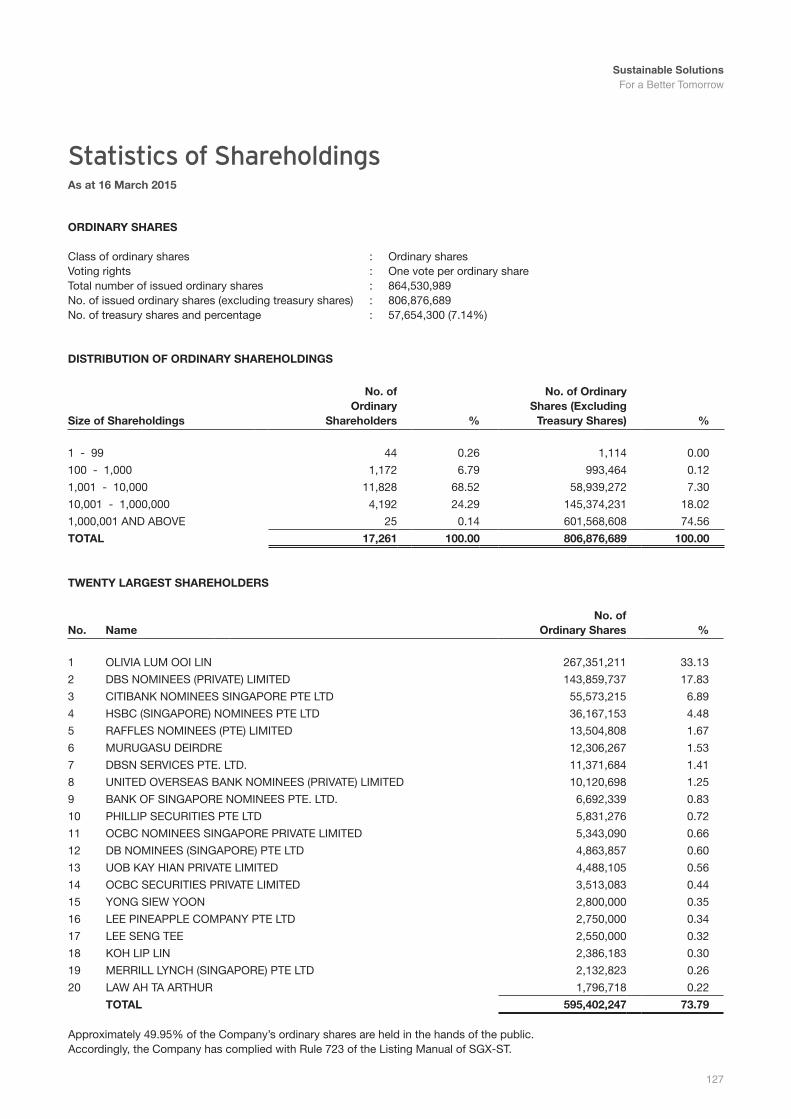
Sustainable Solutions For a Better Tomorrow
127
Statistics of ShareholdingsAs at 16 march 2015
orDinArY shAres Class of ordinary shares : Ordinary sharesVoting rights : One vote per ordinary shareTotal number of issued ordinary shares : 864,530,989No. of issued ordinary shares (excluding treasury shares) : 806,876,689No. of treasury shares and percentage : 57,654,300 (7.14%)
DistriBution oF orDinArY shArehoLDinGs
size of shareholdings
no. ofordinary
shareholders %
no. of ordinaryshares (excluding
treasury shares) %
1 - 99 44 0.26 1,114 0.00
100 - 1,000 1,172 6.79 993,464 0.12
1,001 - 10,000 11,828 68.52 58,939,272 7.30
10,001 - 1,000,000 4,192 24.29 145,374,231 18.02
1,000,001 AND ABOVE 25 0.14 601,568,608 74.56
totAL 17,261 100.00 806,876,689 100.00
tWentY LArGest shArehoLDers
no. nameno. of
ordinary shares %
1 OLIVIA LUM OOI LIN 267,351,211 33.13
2 DBS NOMINEES (PRIVATE) LIMITED 143,859,737 17.83
3 CITIBANK NOMINEES SINGAPORE PTE LTD 55,573,215 6.89
4 HSBC (SINGAPORE) NOMINEES PTE LTD 36,167,153 4.48
5 RAFFLES NOMINEES (PTE) LIMITED 13,504,808 1.67
6 MURUGASU DEIRDRE 12,306,267 1.53
7 DBSN SERVICES PTE. LTD. 11,371,684 1.41
8 UNITED OVERSEAS BANK NOMINEES (PRIVATE) LIMITED 10,120,698 1.25
9 BANK OF SINGAPORE NOMINEES PTE. LTD. 6,692,339 0.83
10 PHILLIP SECURITIES PTE LTD 5,831,276 0.72
11 OCBC NOMINEES SINGAPORE PRIVATE LIMITED 5,343,090 0.66
12 DB NOMINEES (SINGAPORE) PTE LTD 4,863,857 0.60
13 UOB KAY HIAN PRIVATE LIMITED 4,488,105 0.56
14 OCBC SECURITIES PRIVATE LIMITED 3,513,083 0.44
15 YONG SIEW YOON 2,800,000 0.35
16 LEE PINEAPPLE COMPANY PTE LTD 2,750,000 0.34
17 LEE SENG TEE 2,550,000 0.32
18 KOH LIP LIN 2,386,183 0.30
19 MERRILL LYNCH (SINGAPORE) PTE LTD 2,132,823 0.26
20 LAW AH TA ARTHUR 1,796,718 0.22
totAL 595,402,247 73.79
Approximately 49.95% of the Company’s ordinary shares are held in the hands of the public. Accordingly, the Company has complied with Rule 723 of the Listing Manual of SGX-ST.
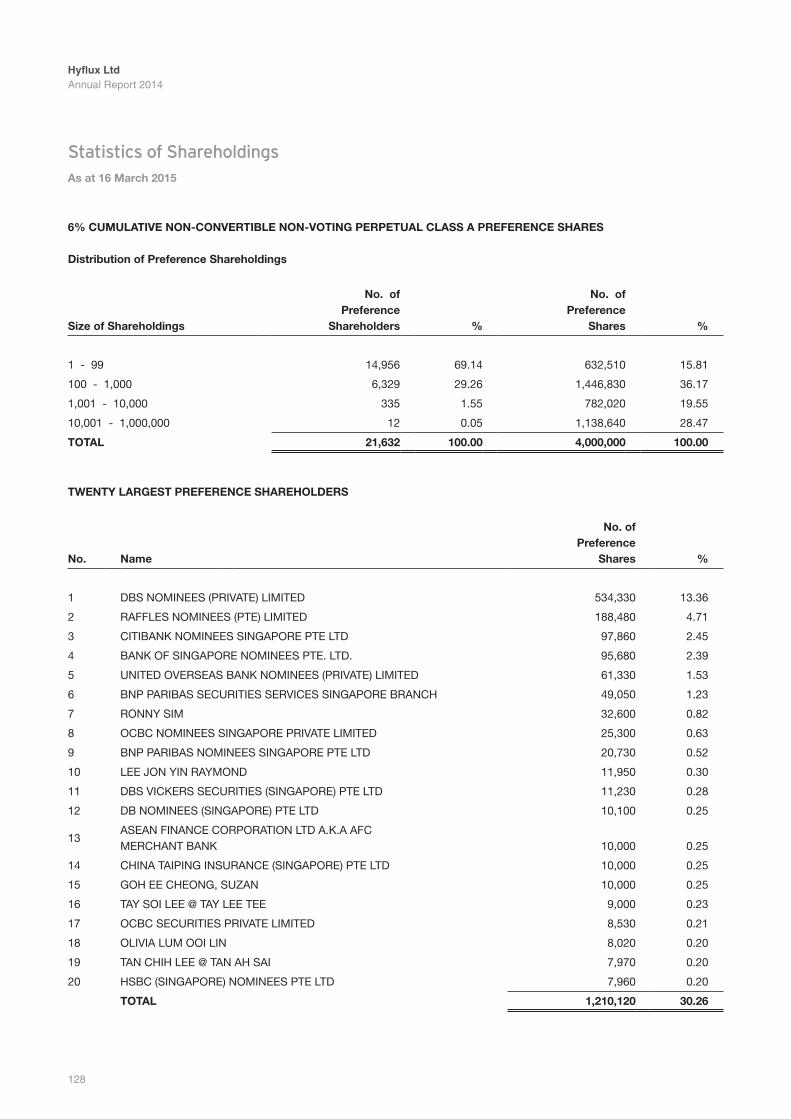
Hyflux LtdAnnual Report 2014
128
6% cumuLAtive non-convertiBLe non-votinG perpetuAL cLAss A preFerence shAres
Distribution of preference shareholdings
size of shareholdings
no. of preference
shareholders %
no. of preference
shares %
1 - 99 14,956 69.14 632,510 15.81
100 - 1,000 6,329 29.26 1,446,830 36.17
1,001 - 10,000 335 1.55 782,020 19.55
10,001 - 1,000,000 12 0.05 1,138,640 28.47
totAL 21,632 100.00 4,000,000 100.00
tWentY LArGest preFerence shArehoLDers
no. name
no. ofpreference
shares %
1 DBS NOMINEES (PRIVATE) LIMITED 534,330 13.36
2 RAFFLES NOMINEES (PTE) LIMITED 188,480 4.71
3 CITIBANK NOMINEES SINGAPORE PTE LTD 97,860 2.45
4 BANK OF SINGAPORE NOMINEES PTE. LTD. 95,680 2.39
5 UNITED OVERSEAS BANK NOMINEES (PRIVATE) LIMITED 61,330 1.53
6 BNP PARIBAS SECURITIES SERVICES SINGAPORE BRANCH 49,050 1.23
7 RONNY SIM 32,600 0.82
8 OCBC NOMINEES SINGAPORE PRIVATE LIMITED 25,300 0.63
9 BNP PARIBAS NOMINEES SINGAPORE PTE LTD 20,730 0.52
10 LEE JON YIN RAYMOND 11,950 0.30
11 DBS VICKERS SECURITIES (SINGAPORE) PTE LTD 11,230 0.28
12 DB NOMINEES (SINGAPORE) PTE LTD 10,100 0.25
13ASEAN FINANCE CORPORATION LTD A.K.A AFC MERCHANT BANK 10,000 0.25
14 CHINA TAIPING INSURANCE (SINGAPORE) PTE LTD 10,000 0.25
15 GOH EE CHEONG, SUZAN 10,000 0.25
16 TAY SOI LEE @ TAY LEE TEE 9,000 0.23
17 OCBC SECURITIES PRIVATE LIMITED 8,530 0.21
18 OLIVIA LUM OOI LIN 8,020 0.20
19 TAN CHIH LEE @ TAN AH SAI 7,970 0.20
20 HSBC (SINGAPORE) NOMINEES PTE LTD 7,960 0.20
totAL 1,210,120 30.26
Statistics of ShareholdingsAs at 16 march 2015
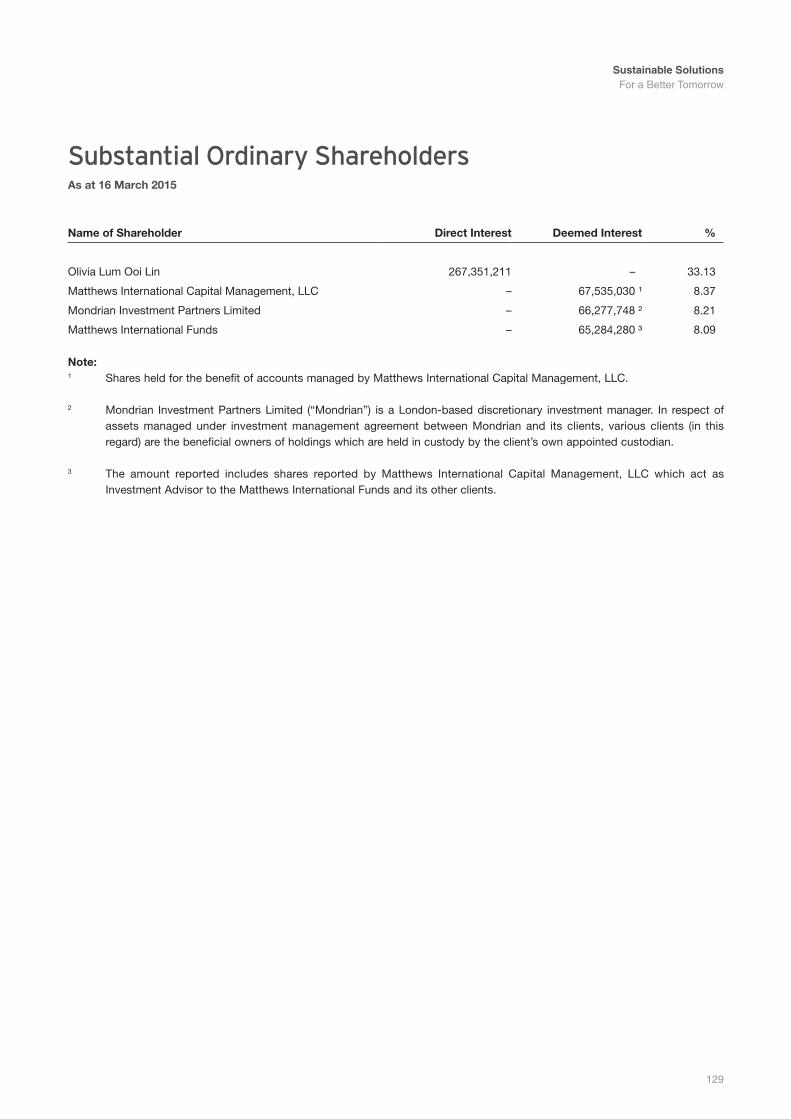
Sustainable Solutions For a Better Tomorrow
129
Substantial Ordinary Shareholders As at 16 march 2015
name of shareholder Direct interest Deemed interest %
Olivia Lum Ooi Lin 267,351,211 – 33.13
Matthews International Capital Management, LLC – 67,535,030 ¹ 8.37
Mondrian Investment Partners Limited – 66,277,748 ² 8.21
Matthews International Funds – 65,284,280 ³ 8.09
note: 1 Shares held for the benefit of accounts managed by Matthews International Capital Management, LLC.
2 Mondrian Investment Partners Limited (“Mondrian”) is a London-based discretionary investment manager. In respect of assets managed under investment management agreement between Mondrian and its clients, various clients (in this regard) are the beneficial owners of holdings which are held in custody by the client’s own appointed custodian.
3 The amount reported includes shares reported by Matthews International Capital Management, LLC which act as Investment Advisor to the Matthews International Funds and its other clients.
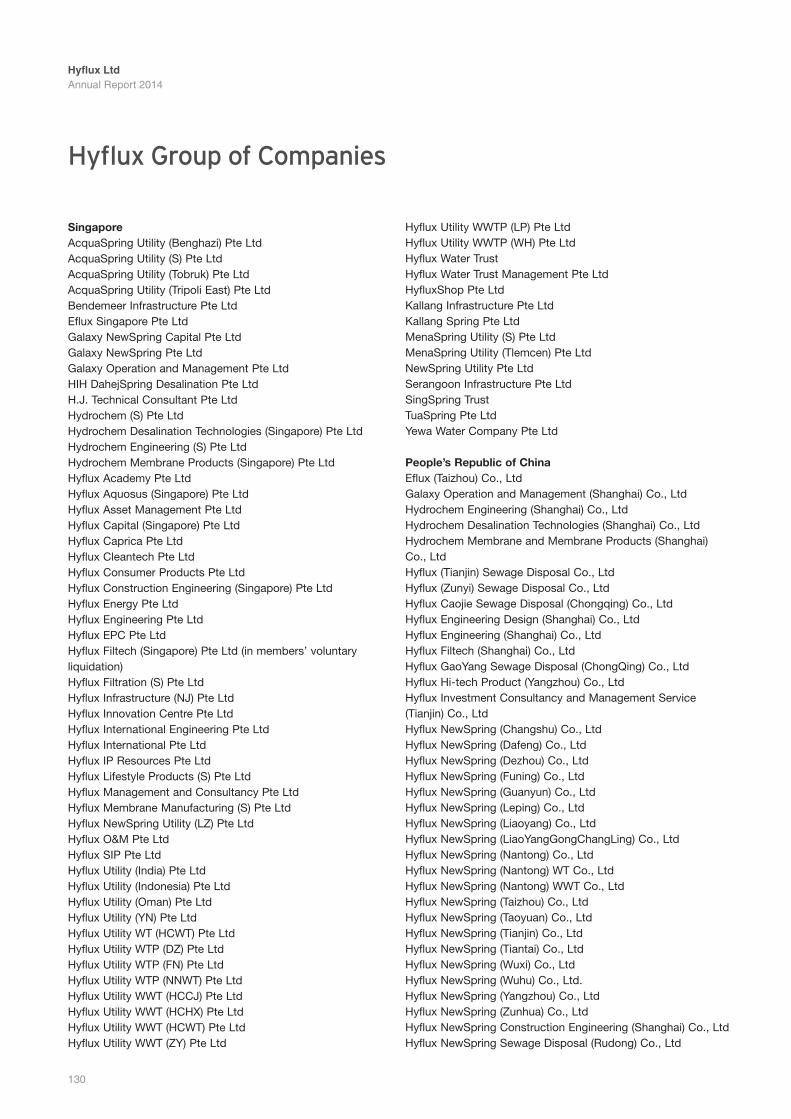
Hyflux LtdAnnual Report 2014
130
Hyflux Group of Companies
singaporeAcquaSpring Utility (Benghazi) Pte LtdAcquaSpring Utility (S) Pte Ltd AcquaSpring Utility (Tobruk) Pte LtdAcquaSpring Utility (Tripoli East) Pte LtdBendemeer Infrastructure Pte Ltd Eflux Singapore Pte LtdGalaxy NewSpring Capital Pte Ltd Galaxy NewSpring Pte Ltd Galaxy Operation and Management Pte LtdHIH DahejSpring Desalination Pte LtdH.J. Technical Consultant Pte LtdHydrochem (S) Pte LtdHydrochem Desalination Technologies (Singapore) Pte LtdHydrochem Engineering (S) Pte LtdHydrochem Membrane Products (Singapore) Pte LtdHyflux Academy Pte LtdHyflux Aquosus (Singapore) Pte LtdHyflux Asset Management Pte LtdHyflux Capital (Singapore) Pte LtdHyflux Caprica Pte LtdHyflux Cleantech Pte LtdHyflux Consumer Products Pte LtdHyflux Construction Engineering (Singapore) Pte LtdHyflux Energy Pte LtdHyflux Engineering Pte LtdHyflux EPC Pte LtdHyflux Filtech (Singapore) Pte Ltd (in members’ voluntary liquidation)Hyflux Filtration (S) Pte LtdHyflux Infrastructure (NJ) Pte LtdHyflux Innovation Centre Pte LtdHyflux International Engineering Pte LtdHyflux International Pte LtdHyflux IP Resources Pte LtdHyflux Lifestyle Products (S) Pte LtdHyflux Management and Consultancy Pte LtdHyflux Membrane Manufacturing (S) Pte LtdHyflux NewSpring Utility (LZ) Pte LtdHyflux O&M Pte LtdHyflux SIP Pte LtdHyflux Utility (India) Pte LtdHyflux Utility (Indonesia) Pte LtdHyflux Utility (Oman) Pte LtdHyflux Utility (YN) Pte LtdHyflux Utility WT (HCWT) Pte LtdHyflux Utility WTP (DZ) Pte LtdHyflux Utility WTP (FN) Pte LtdHyflux Utility WTP (NNWT) Pte LtdHyflux Utility WWT (HCCJ) Pte LtdHyflux Utility WWT (HCHX) Pte LtdHyflux Utility WWT (HCWT) Pte LtdHyflux Utility WWT (ZY) Pte Ltd
Hyflux Utility WWTP (LP) Pte LtdHyflux Utility WWTP (WH) Pte LtdHyflux Water TrustHyflux Water Trust Management Pte LtdHyfluxShop Pte LtdKallang Infrastructure Pte LtdKallang Spring Pte LtdMenaSpring Utility (S) Pte LtdMenaSpring Utility (Tlemcen) Pte LtdNewSpring Utility Pte LtdSerangoon Infrastructure Pte LtdSingSpring TrustTuaSpring Pte LtdYewa Water Company Pte Ltd
people’s republic of chinaEflux (Taizhou) Co., LtdGalaxy Operation and Management (Shanghai) Co., LtdHydrochem Engineering (Shanghai) Co., LtdHydrochem Desalination Technologies (Shanghai) Co., LtdHydrochem Membrane and Membrane Products (Shanghai) Co., LtdHyflux (Tianjin) Sewage Disposal Co., LtdHyflux (Zunyi) Sewage Disposal Co., LtdHyflux Caojie Sewage Disposal (Chongqing) Co., LtdHyflux Engineering Design (Shanghai) Co., LtdHyflux Engineering (Shanghai) Co., LtdHyflux Filtech (Shanghai) Co., LtdHyflux GaoYang Sewage Disposal (ChongQing) Co., LtdHyflux Hi-tech Product (Yangzhou) Co., LtdHyflux Investment Consultancy and Management Service (Tianjin) Co., LtdHyflux NewSpring (Changshu) Co., LtdHyflux NewSpring (Dafeng) Co., LtdHyflux NewSpring (Dezhou) Co., LtdHyflux NewSpring (Funing) Co., LtdHyflux NewSpring (Guanyun) Co., LtdHyflux NewSpring (Leping) Co., LtdHyflux NewSpring (Liaoyang) Co., LtdHyflux NewSpring (LiaoYangGongChangLing) Co., LtdHyflux NewSpring (Nantong) Co., LtdHyflux NewSpring (Nantong) WT Co., LtdHyflux NewSpring (Nantong) WWT Co., LtdHyflux NewSpring (Taizhou) Co., LtdHyflux NewSpring (Taoyuan) Co., LtdHyflux NewSpring (Tianjin) Co., LtdHyflux NewSpring (Tiantai) Co., LtdHyflux NewSpring (Wuxi) Co., LtdHyflux NewSpring (Wuhu) Co., Ltd.Hyflux NewSpring (Yangzhou) Co., LtdHyflux NewSpring (Zunhua) Co., LtdHyflux NewSpring Construction Engineering (Shanghai) Co., LtdHyflux NewSpring Sewage Disposal (Rudong) Co., Ltd
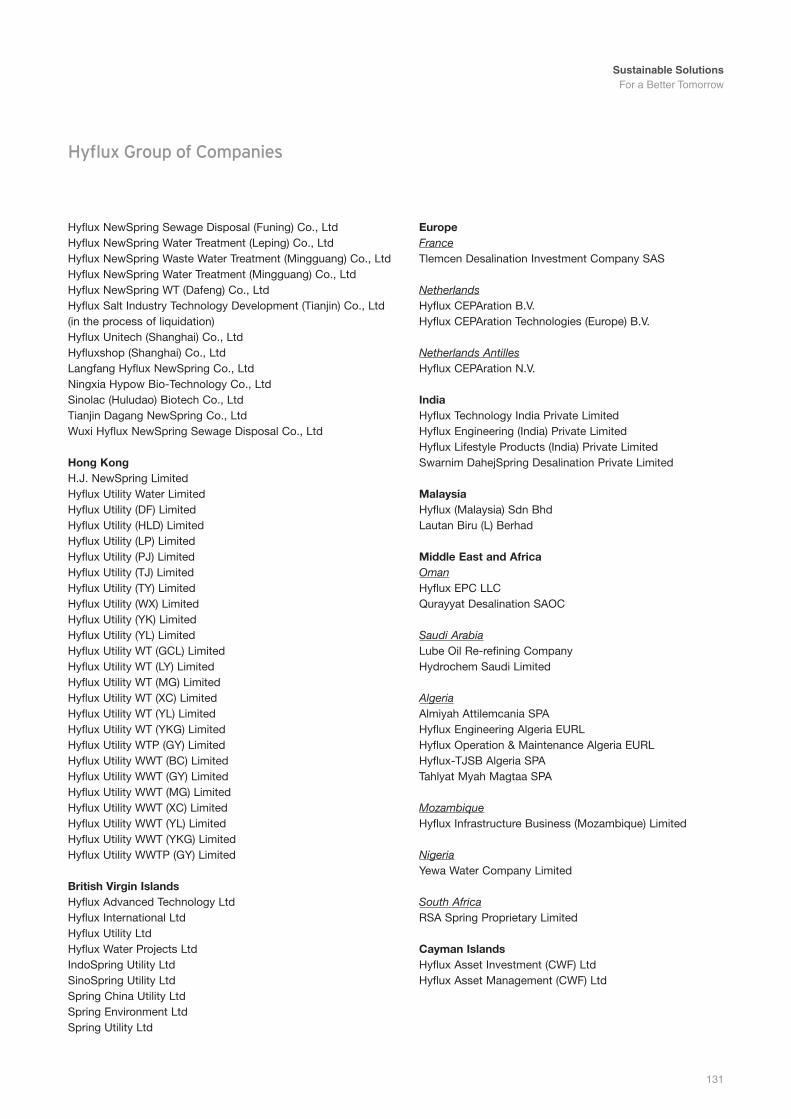
Sustainable Solutions For a Better Tomorrow
131
Hyflux NewSpring Sewage Disposal (Funing) Co., LtdHyflux NewSpring Water Treatment (Leping) Co., LtdHyflux NewSpring Waste Water Treatment (Mingguang) Co., LtdHyflux NewSpring Water Treatment (Mingguang) Co., LtdHyflux NewSpring WT (Dafeng) Co., LtdHyflux Salt Industry Technology Development (Tianjin) Co., Ltd (in the process of liquidation)Hyflux Unitech (Shanghai) Co., LtdHyfluxshop (Shanghai) Co., LtdLangfang Hyflux NewSpring Co., LtdNingxia Hypow Bio-Technology Co., LtdSinolac (Huludao) Biotech Co., LtdTianjin Dagang NewSpring Co., LtdWuxi Hyflux NewSpring Sewage Disposal Co., Ltd
hong KongH.J. NewSpring LimitedHyflux Utility Water Limited Hyflux Utility (DF) LimitedHyflux Utility (HLD) LimitedHyflux Utility (LP) Limited Hyflux Utility (PJ) LimitedHyflux Utility (TJ) LimitedHyflux Utility (TY) LimitedHyflux Utility (WX) Limited Hyflux Utility (YK) Limited Hyflux Utility (YL) LimitedHyflux Utility WT (GCL) Limited Hyflux Utility WT (LY) Limited Hyflux Utility WT (MG) Limited Hyflux Utility WT (XC) LimitedHyflux Utility WT (YL) LimitedHyflux Utility WT (YKG) LimitedHyflux Utility WTP (GY) Limited Hyflux Utility WWT (BC) LimitedHyflux Utility WWT (GY) LimitedHyflux Utility WWT (MG) LimitedHyflux Utility WWT (XC) Limited Hyflux Utility WWT (YL) LimitedHyflux Utility WWT (YKG) LimitedHyflux Utility WWTP (GY) Limited
British virgin islandsHyflux Advanced Technology LtdHyflux International LtdHyflux Utility LtdHyflux Water Projects LtdIndoSpring Utility LtdSinoSpring Utility LtdSpring China Utility LtdSpring Environment LtdSpring Utility Ltd
europeFranceTlemcen Desalination Investment Company SAS
NetherlandsHyflux CEPAration B.V.Hyflux CEPAration Technologies (Europe) B.V.
Netherlands AntillesHyflux CEPAration N.V.
indiaHyflux Technology India Private Limited Hyflux Engineering (India) Private LimitedHyflux Lifestyle Products (India) Private LimitedSwarnim DahejSpring Desalination Private Limited
malaysiaHyflux (Malaysia) Sdn BhdLautan Biru (L) Berhad
middle east and AfricaOmanHyflux EPC LLCQurayyat Desalination SAOC
Saudi ArabiaLube Oil Re-refining Company Hydrochem Saudi Limited
AlgeriaAlmiyah Attilemcania SPAHyflux Engineering Algeria EURLHyflux Operation & Maintenance Algeria EURLHyflux-TJSB Algeria SPATahlyat Myah Magtaa SPA
MozambiqueHyflux Infrastructure Business (Mozambique) Limited
NigeriaYewa Water Company Limited
South AfricaRSA Spring Proprietary Limited
cayman islandsHyflux Asset Investment (CWF) LtdHyflux Asset Management (CWF) Ltd
Hyflux Group of Companies
Hyflux LtdAnnual Report 2014
132
Corporate Information
BoArD oF DirectorsOlivia Lum Ooi Lin (Executive Chairman and Group CEO)Teo Kiang Kok (Lead Independent Director)Lee Joo Hai (Non-Executive Independent Director)Gay Chee Cheong (Non-Executive Independent Director)Christopher Murugasu (Non-Executive Independent Director)Simon Tay (Non-Executive Independent Director)Lau Wing Tat (Non-Executive Independent Director)Gary Kee Eng Kwee (Executive Director)
KeY mAnAGement committee Olivia Lum Ooi Lin (Chairman)Gary Kee Eng KweeWinnifred HeapLim Suat WahWong Lup Wai
compAnY secretArYLim Poh Fong
reGistereD oFFiceHyflux Innovation Centre80 Bendemeer RoadSingapore 339949Tel : 65 6214 0777Fax : 65 6214 1211
AuDitorsKPMG LLP16 Raffles Quay #22-00Hong Leong Building Singapore 048581
Partner-in-charge (since 2010):Lau Kam Yuen
reGistrAr Boardroom Corporate & Advisory Services Pte Ltd50 Raffles Place#32-01 Singapore Land TowerSingapore 048623
BoArD committees:
Audit committeeLee Joo Hai (Chairman)Gay Chee CheongTeo Kiang KokLau Wing Tat
nominating committeeTeo Kiang Kok (Chairman)Olivia Lum Ooi LinGay Chee CheongChristopher Murugasu
remuneration committeeGay Chee Cheong (Chairman)Teo Kiang KokChristopher Murugasu
risk management committeeLau Wing Tat (Chairman)Lee Joo Hai Teo Kiang KokSimon Tay Christopher Murugasu
investment committeeOlivia Lum Ooi Lin (Chairman)Gay Chee CheongGary Kee Eng KweeSimon Tay
Sustainable Solutions For a Better Tomorrow
133
BAnKersAgricultural Bank of China Limited,Singapore Branch7 Temasek Boulevard#30-01/02/03 Suntec Tower 1Singapore 038987
Arab Bank Plc, Singapore80 Raffles Place#32-20 UOB Plaza 2Singapore 048624
Arab Banking Corporation (B.S.C)9 Raffles Place#60-03 Republic PlazaSingapore 048619
Australia and New ZealandBanking Group Limited, Singapore Branch10 Collyer Quay,#30-00 Ocean Financial CentreSingapore 049315
Bangkok Bank Public Company Limited180 Cecil StreetBangkok Bank BuildingSingapore 069546
Bank of China Limited, Singapore Branch4 Battery Road, 15th FloorBank of China BuildingSingapore 049908
Bank of Communications Co., Ltd,Singapore Branch50 Raffles Place#18-01 Singapore TowerSingapore 048623
Bank of Taiwan, Singapore Branch80 Raffles Place#28-20 UOB Plaza 2Singapore 048624
BNP Paribas, Singapore Branch10 Collyer Quay #34-01Ocean Financial CentreSingapore 049315
Chang Hwa Commercial Bank Ltd,Singapore BranchNo. 1 Finlayson Green, #08-00Singapore 049246
CTBC Bank Co., Ltd,Singapore Branch8 Marina View #33-02Asia Square Tower OneSingapore 018960
Citibank, N.A.8 Marina View#21-01 Asia Square Tower 1Singapore 018960
DBS Bank Ltd12 Marina BoulevardDBS Asia Central @ Marina Bay Financial Centre Tower 3 Singapore 018982
First Commercial Bank, Singapore Branch77 Robinson Road #01-01Singapore 068896
ICICI Bank Limited9 Raffles Place #50-01Republic PlazaSingapore 048619
ING Bank N.V., Singapore Branch9 Raffles Place, #19-02 Republic Plaza,Singapore 048619
The Hongkong and Shanghai Banking Corporation Limited21 Collyer Quay #01-00 HSBC BuildingSingapore 049320
Japan Bank for International Cooperation9 Raffles Place #51-02Republic PlazaSingapore 048619
KfW IPEX-Bank GmbH6 Shenton Way, OUE Downtown 2#20-11Singapore 068809
Land Bank of Taiwan, Singapore Branch80 Raffles Place#34-01 UOB Plaza 1Singapore 048624
Malayan Banking Berhad2 Battery Road #16-01Maybank Tower Singapore 049907
Mega International Commercial Bank Co.,Ltd., Singapore Branch80 Raffles Place#23-20 UOB Plaza IISingapore 048624
Mizuho Bank, Ltd.,Singapore Branch168 Robinson RoadCapital Tower #13-00Singapore 068912
Natixis, Singapore Branch50 Raffles Place#41-01 Singapore Land TowerSingapore 048623
Norddeutsche Landesbank Girozentrale,Singapore Branch6 Shenton Way #16-00DBS Building Tower 2Singapore 068809
Oversea-Chinese Banking Corporation Limited65 Chulia Street #10-00OCBC CentreSingapore 049513
Standard Chartered Bank8 Marina Boulevard, Level 24Marina Bay Financial Centre (Tower 1)Singapore 018981
Sumitomo Mitsui Banking Corporation, Singapore Branch3 Temasek Avenue #06-01Centennial TowerSingapore 039190
The Bank of East Asia Limited,Singapore Branch137 Market StreetBEA BuildingSingapore 048943
The Bank of Tokyo-Mitsubishi UFJ, LtdSingapore Branch9 Raffles Place #01-01Republic PlazaSingapore 048619
United Overseas Bank Limited1 Raffles PlaceOUB CentreSingapore 048616
Corporate Information

Hyflux LtdHyflux Innovation Centre80 Bendemeer RoadSingapore 339949
Company reg. no.: 200002722Z www.hyflux.com
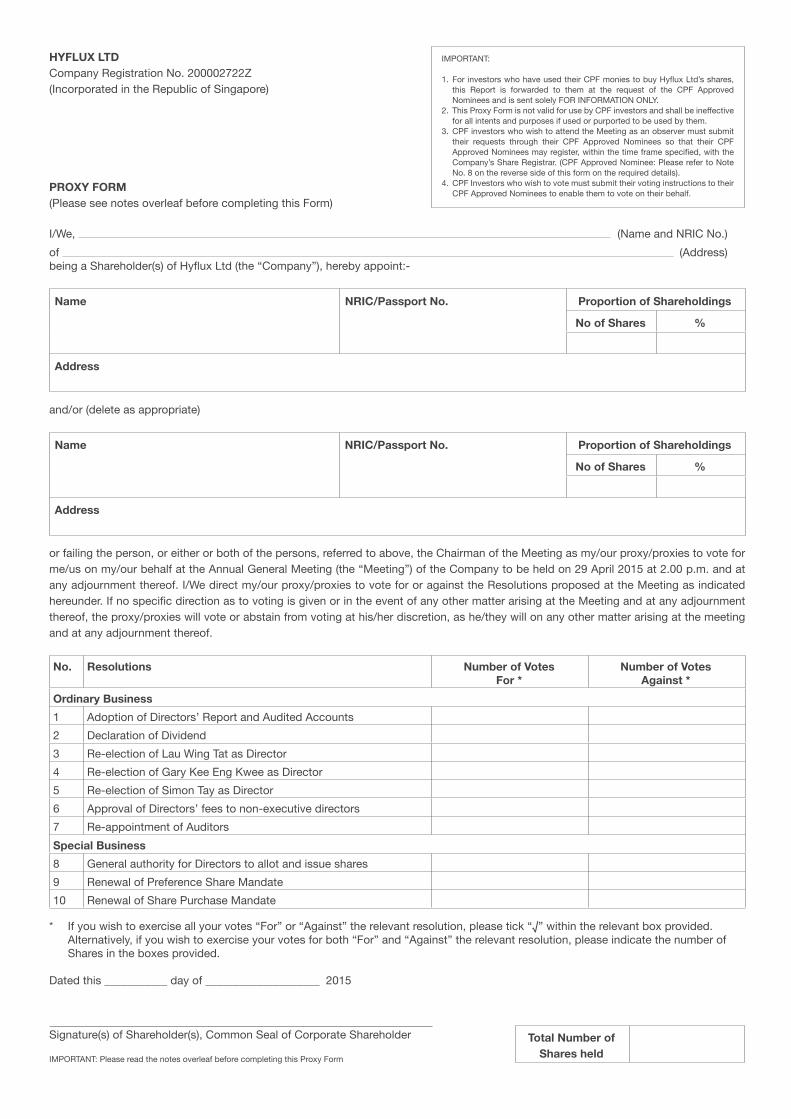
HYFLUX LTDCompany Registration No. 200002722Z(Incorporated in the Republic of Singapore)
PROXY FORM(Please see notes overleaf before completing this Form)
I/We, (Name and NRIC No.)of (Address)being a Shareholder(s) of Hyflux Ltd (the “Company”), hereby appoint:-
Name NRIC/Passport No. Proportion of Shareholdings
No of Shares %
Address
and/or (delete as appropriate)
Name NRIC/Passport No. Proportion of Shareholdings
No of Shares %
Address
or failing the person, or either or both of the persons, referred to above, the Chairman of the Meeting as my/our proxy/proxies to vote for me/us on my/our behalf at the Annual General Meeting (the “Meeting”) of the Company to be held on 29 April 2015 at 2.00 p.m. and at any adjournment thereof. I/We direct my/our proxy/proxies to vote for or against the Resolutions proposed at the Meeting as indicated hereunder. If no specific direction as to voting is given or in the event of any other matter arising at the Meeting and at any adjournment thereof, the proxy/proxies will vote or abstain from voting at his/her discretion, as he/they will on any other matter arising at the meeting and at any adjournment thereof.
No. Resolutions Number of VotesFor *
Number of VotesAgainst *
Ordinary Business1 Adoption of Directors’ Report and Audited Accounts2 Declaration of Dividend3 Re-election of Lau Wing Tat as Director4 Re-election of Gary Kee Eng Kwee as Director5 Re-election of Simon Tay as Director6 Approval of Directors’ fees to non-executive directors7 Re-appointment of AuditorsSpecial Business8 General authority for Directors to allot and issue shares9 Renewal of Preference Share Mandate10 Renewal of Share Purchase Mandate
* If you wish to exercise all your votes “For” or “Against” the relevant resolution, please tick “√” within the relevant box provided. Alternatively, if you wish to exercise your votes for both “For” and “Against” the relevant resolution, please indicate the number of Shares in the boxes provided.
Dated this ___________ day of ____________________ 2015
Signature(s) of Shareholder(s), Common Seal of Corporate Shareholder
IMPORTANT: Please read the notes overleaf before completing this Proxy Form
Total Number of Shares held
IMPORTANT:
1. For investors who have used their CPF monies to buy Hyflux Ltd’s shares, this Report is forwarded to them at the request of the CPF Approved Nominees and is sent solely FOR INFORMATION ONLY.
2. This Proxy Form is not valid for use by CPF investors and shall be ineffective for all intents and purposes if used or purported to be used by them.
3. CPF investors who wish to attend the Meeting as an observer must submit their requests through their CPF Approved Nominees so that their CPF Approved Nominees may register, within the time frame specified, with the Company’s Share Registrar. (CPF Approved Nominee: Please refer to Note No. 8 on the reverse side of this form on the required details).
4. CPF Investors who wish to vote must submit their voting instructions to their CPF Approved Nominees to enable them to vote on their behalf.
5. A corporation which is a Shareholder may authorise, by resolution of its directors or other governing body, such person as it thinks fit to act as its representative at the Annual General Meeting, in accordance with Section 179 of the Companies Act, Chapter 50 of Singapore.
6. The Company shall be entitled to reject the instrument appointing a proxy or proxies if it is incomplete, improperly completed or illegible or where the true intentions of the appointor are not ascertainable from the instructions of the appointor specified in the instrument appointing a proxy or proxies. In addition, in the case of Shareholders whose Shares are entered in the Depository Register, the Company may reject any instrument appointing a proxy or proxies lodged if such Shareholders are not shown to have Shares entered against their name in the Depository Register 48 hours before the time appointed for the holding of the Annual General Meeting, as certified by The Central Depository (Pte) Limited to the Company.
7. Completion and return of this instrument appointing a proxy shall preclude a member from attending and voting at the Meeting. Any appointment of a proxy or proxies shall be deemed to be revoked if a member attends the meeting in person, and in such an event, the Company reserves the right to refuse to admit any person or persons appointed under the instrument of proxy to the Meeting.
8. CPF Approved Nominees acting on the request of the CPF Investors who wish to attend the Annual General Meeting as observers are requested to submit in writing, a list with details of the CPF Investors’ names, NRIC/Passport numbers, addresses and number of Shares held. The list, signed by an authorized signatory of the CPF Approved nominee, should reach the Company’s Share Registrar, Boardroom Corporate & Advisory Services Pte Ltd, at 50 Raffles Place, #32-01, Singapore Land Tower, Singapore 048623, at least 48 hours before the time fixed for the Annual General Meeting.
PERSONAL DATA PRIVACYBy submitting an instrument appointing a proxy(ies) and/or representative(s), the member accepts and agrees to the personal data privacy terms set out in the Notice of Annual General Meeting dated 10 April 2015.
The Company SecretaryHYFLUX LTD
Hyflux Innovation Centre80 Bendemeer RoadSingapore 339949
fold along this line (2)
fold along this line (1)
AffixPostageStamp
NOTES:1. Please insert the total number of shares held by you. If you have Shares entered against your name in the Depository Register (as defined in
Section 130A of the Companies Act, Chapter 50 of Singapore), you should insert that number of Shares. If you only have Shares registered in your name in the Register of Members, you should insert that number of Shares. However, if you have Shares entered against your name in the Depository Register and Shares registered in your name in the Register of Members, you should insert the aggregate number of Shares entered against your name in the Depository Register and registered in your name in the Register of Members. If no number is inserted, the instrument appointing a proxy or proxies shall be deemed to relate to all the Shares held by you.
2. A Shareholder of the Company entitled to attend and vote at a meeting of the Company is entitled to appoint one or two proxies to attend and vote instead of him. A proxy need not to be a Shareholder of the Company. Where a Shareholder appoints two proxies, the proportion of the shareholding concerned to be represented by each proxy shall be specified in the proxy form. If no percentage is specified, the first named proxy shall be deemed to represent 100 percent of the shareholding and the second named proxy shall be deemed to be an alternate to the first named proxy.
3. The instrument appointing a proxy or proxies must be deposited at the registered office of the Company at Hyflux Innovation Centre, 80 Bendemeer Road, Singapore 339949 not less than 48 hours before the time appointed for the Meeting.
4. The instrument appointing a proxy or proxies must be executed under the hand of the appointor or of his attorney duly authorised in writing. Where the instrument appointing a proxy or proxies is executed by a corporation, it must be executed either under its seal or under the hand of an officer or attorney duly authorised. Where an instrument appointing a proxy is signed on behalf of the appointor by an attorney, the letter or power of attorney or a duly certified copy thereof must (unless previously registered with the Company) be lodged with the instrument of proxy, failing which, the instrument may be treated as invalid.
1
Hyflux Ltd Annual Report 2014
Notice of Annual General Meeting
NOTICE IS HEREBY GIVEN that the Annual General Meeting of Hyflux Ltd (the “Company”) will be held at Hyflux Innovation Centre, 80 Bendemeer Road, Singapore 339949 on 29 April 2015 at 2.00 p.m. for the following purposes:
AS ORDINARY BUSINESS
Resolution 1
To receive and adopt the Directors’ Report and the Audited Accounts for the year ended 31 December 2014 together with the Auditors’ Report thereon.
Resolution 2
To declare a final dividend of 1.6 Singapore cents per ordinary share (one-tier tax exempt) for the year ended 31 December 2014 (previous year: 1.6 Singapore cents per ordinary share).
Resolution 3
To re-elect Mr. Lau Wing Tat who retires in accordance with Article 88 of the Company’s Articles of Association and who, being eligible, offers himself for re-election.
Resolution 4
To re-elect Mr. Gary Kee Eng Kwee who retires in accordance with Article 89 of the Company’s Articles of Association and who, being eligible, offers himself for re-election.
Resolution 5
To re-elect Mr. Simon Tay who retires in accordance with Article 89 of the Company’s Articles of Association and who, being eligible, offers himself for re-election.
Resolution 6
To approve the payment of Directors’ fees of S$478,301 for the year ended 31 December 2014 (previous year: S$524,384).
Resolution 7
To re-appoint Messrs KPMG LLP as external auditors and to authorise the Directors to fix their remuneration.
AS SPECIAL BUSINESS
To consider and if thought fit, to pass the following resolutions as Ordinary Resolutions, with or without any modifications:
2
Hyflux Ltd Annual Report 2014
Notice of Annual General Meeting (cont’d)
Resolution 8
That pursuant to Section 161 of the Companies Act, Cap. 50 of Singapore and Rule 806 of the Listing Manual of the Singapore Exchange Securities Trading Limited (the “Listing Manual”), the Directors be authorised and empowered to:
(a) (1) issue ordinary shares in the Company whether by way of rights, bonus or otherwise; and/or
(2) make or grant offers, agreements or options (collectively, “Instruments”) that might or would require shares to be issued, including but not limited to the creation and issue of (as well as adjustments to) options, warrants, debentures or other instruments convertible into ordinary shares,
at any time and upon such terms and conditions and for such purposes and to such persons as the Directors may in their absolute discretion deem fit; and
(b) issue ordinary shares in pursuance of any Instruments made or granted by the Directors while this Resolution was in force (notwithstanding the authority conferred by this Resolution may have ceased to be in force), provided that:
(1) the aggregate number of ordinary shares (including ordinary shares to be issued in pursuance of the Instruments, made or granted pursuant to this Resolution) and Instruments to be issued pursuant to this Resolution shall not exceed fifty per cent (50%) of the issued ordinary shares in the capital of the Company (as calculated in accordance with sub-paragraph (2) below), of which the aggregate number of ordinary shares and Instruments to be issued other than on a pro rata basis to existing shareholders of the Company shall not exceed twenty per cent (20%) of the issued ordinary shares in the capital of the Company (as calculated in accordance with sub-paragraph (2) below);
(2) (subject to such calculation as may be prescribed by the Singapore Exchange Securities Trading Limited) for the purpose of determining the aggregate number of ordinary shares and Instruments that may be issued under sub-paragraph (1) above, the percentage of issued ordinary shares and Instruments shall be based on the number of issued ordinary shares in the capital of the Company (excluding treasury shares) at the time of the passing of this Resolution, after adjusting for:
(i) new ordinary shares arising from the conversion or exercise of the Instruments or any convertible securities;
(ii) new ordinary shares arising from the exercising of share options or vesting of share awards outstanding and subsisting at the time of the passing of this Resolution; and
(iii) any subsequent bonus issue consolidation or subdivision of ordinary shares.
3
Hyflux Ltd Annual Report 2014
Notice of Annual General Meeting (cont’d)
(3) in exercising the authority conferred by this Resolution, the Company shall comply with the provisions of the Listing Manual for the time being in force (unless such compliance has been waived by the Singapore Exchange Securities Trading Limited) and the Articles of Association of the Company; and
(4) unless revoked or varied by the Company in a general meeting, such authority shall continue in force (i) until the conclusion of the next Annual General Meeting of the Company or the date by which the next Annual General Meeting of the Company is required by law to be held, whichever is earlier or (ii) in the case of ordinary shares to be issued in pursuance of the Instruments, made or granted pursuant to this Resolution, until the issuance of such ordinary shares in accordance with the terms of the Instruments.
Resolution 9
That:
(a) authority be and is hereby given to the Directors to:
(1) allot and issue preference shares referred to in Articles 8C and 8E of the Articles of Association of the Company in the capital of the Company whether by way of rights, bonus or otherwise; and/or
(2) make or grant offers, agreements or options that might or would require preference shares referred to in sub-paragraph (1) above to be issued, not being ordinary shares to which the authority referred to in Resolution 8 above relates,
at any time and upon such terms and conditions and for such purposes and to such persons as the Directors may in their absolute discretion deem fit, and (notwithstanding the authority conferred by this Resolution may have ceased to be in force) issue preference shares referred to in sub-paragraph (1) above in pursuance of any offers, agreements or options made or granted by the Directors while this Resolution was in force; and
(b) (unless revoked or varied by the Company in a general meeting) the authority conferred by this Resolution shall continue in force until the conclusion of the next Annual General Meeting of the Company or the date by which the next Annual General Meeting of the Company is required by law to be held, whichever is earlier.
Resolution 10
That the Directors of the Company be and are hereby authorised to exercise all the powers of the Company to make purchases of or otherwise acquire issued and fully-paid ordinary shares in the capital of the Company from time to time (whether by way of market
4
Hyflux Ltd Annual Report 2014
Notice of Annual General Meeting (cont’d)
purchases or off-market purchases on an equal access scheme) of up to ten per cent (10%) of the issued ordinary shares in the capital of the Company (ascertained as at the date of the passing of this Resolution, unless the Company has effected a reduction of the share capital of the Company in accordance with the applicable provisions of the Companies Act, Chapter 50 of Singapore (“Companies Act”), at any time during the Relevant Period (as defined below), in which event the issued ordinary share capital of the Company shall be taken to be the amount of the issued ordinary share capital of the Company as altered, but excluding any shares held by the Company as treasury shares from time to time) at the price of up to but not exceeding the Maximum Price (as defined in Appendix 2 to this Notice of Annual General Meeting (“Appendix 2”)) and in accordance with the Guidelines on Share Purchase set out in Appendix 2 (read with Appendix 1 to this Notice of Annual General Meeting) and otherwise in accordance with all other provisions of the Companies Act and the Listing Manual of the Singapore Exchange Securities Trading Limited as may from time to time be applicable, and this mandate shall, unless revoked or varied by the Company in general meeting, continue in force until the date on which the next Annual General Meeting of the Company is held or is required by law to be held (the “Relevant Period”), or the date on which the share purchases are carried out to the full extent mandated, whichever is earlier. To transact any other ordinary business which may properly be transacted at an Annual General Meeting.
By Order of the Board
Lim Poh FongCompany SecretarySingapore, 10 April 2015
5
Hyflux Ltd Annual Report 2014
Notice of Annual General Meeting (cont’d)
Explanatory Notes:
(1) A member entitled to attend and vote at the Annual General Meeting (the “Meeting”) is entitled to appoint a proxy to attend and vote in his/her stead. A proxy need not be a member of the Company. The instrument appointing a proxy must be deposited at the Registered Office of the Company at Hyflux Innovation Centre, 80 Bendemeer Road, Singapore 339949 not less than 48 hours before the time appointed for holding the Meeting.
(2) In relation to Resolution 3, Mr. Lau Wing Tat, will upon re-election as a Director of the Company, remain as Chairman of the Risk Management Committee and a member of the Audit Committee. Mr. Lau is considered a non-executive and independent director.
(3) In relation to Resolution 4, Mr. Gary Kee Eng Kwee, will upon re-election as a Director of the Company, remain as a member of the Investment Committee. Mr. Kee is considered an executive director.
(4) In relation to Resolution 5, Mr. Simon Tay, will upon re-election as a Director of the Company, remain as a member of the Risk Management Committee and Investment Committee. Mr. Tay is considered a non-executive and independent director.
(5) Ordinary Resolution 8 has been proposed for voting annually at the Company’s Annual General Meeting since 2002. Pursuant to Section 161 of the Companies Act, Cap. 50 and Rule 806 of the Listing Manual of the Singapore Exchange Securities Trading Limited, and upon passing of this Ordinary Resolution 8, the Directors will be empowered from the date of this Meeting until the date of the next Annual General Meeting, or the date by which the next Annual General Meeting is required by law to be held or such authority is varied or revoked by the Company in a general meeting, whichever is the earliest, to issue ordinary shares, make or grant instruments convertible into ordinary shares and to issue ordinary shares pursuant to such instruments, up to a number not exceeding, in total, 50% of the issued ordinary shares in the capital of the Company, of which up to 20% may be issued other than on a pro rata basis to existing shareholders. In determining the aggregate number of ordinary shares that may be issued, the percentage of issued ordinary shares in the capital of the Company will be calculated based on the issued ordinary shares in the capital of the Company at the time this Ordinary Resolution 8 is passed after adjusting for new ordinary shares arising from the conversion or exercise of the instruments or any convertible securities, the exercise of share options or the vesting of share awards outstanding or subsisting at the time when this Ordinary Resolution 8 is passed and any subsequent bonus issue, consolidation or subdivision of ordinary shares.
(6) Ordinary Resolution 9 relates to the renewal of the preference share issue mandate, which was originally approved by the shareholders at the Extraordinary General Meeting held on 31 March 2011. Upon passing of this Ordinary Resolution 9, the
6
Hyflux Ltd Annual Report 2014
Explanatory Notes (cont’d)
Directors will be empowered from the date of this Meeting until the date of the next Annual General Meeting, or the date by which the next Annual General Meeting is required by law to be held or such authority is varied or revoked by the Company in a general meeting, whichever is the earliest, to issue new preference shares and/or make or grant offers, agreements or options that might or would require such preference shares to be issued, provided that the aggregate number of preference shares does not exceed 20% of the total number of issued shares (excluding treasury shares) in the capital of the Company at the time of passing of this Ordinary Resolution 9 and such issue be on such other terms and condition as the Directors may deem fit.
(7) Ordinary Resolution 10 relates to the renewal of the share purchase mandate, which was originally approved by the shareholders at the Extraordinary General Meeting held on 25 April 2008 and last renewed at the Annual General Meeting held on 24 April 2014. Ordinary Resolution 10, if passed, will empower the Directors of the Company from the date of this Meeting until the next Annual General Meeting, or the date by which the next Annual General Meeting is required by law to be held, whichever is earlier, to purchase ordinary shares of the Company by way of market purchases or off-market purchases of up to 10% of the total number of issued ordinary shares in the capital of the Company at the Maximum Price as defined in Appendix 2. Please refer to Appendix 1 and Appendix 2 of this Notice of Annual General Meeting for further details.
PERSONAL DATA PRIVACY Where a member of the Company submits an instrument appointing a proxy(ies) and/or representative(s) to attend, speak and vote at the Annual General Meeting and/or any adjournment thereof, a member of the Company (i) consents to the collection, use and disclosure of the member’s personal data by the Company (or its agents) for the purpose of the processing and administration by the Company (or its agents) of proxies and representatives appointed for the Annual General Meeting (including any adjournment thereof) and the preparation and compilation of the attendance lists, proxy lists, minutes and other documents relating to the Annual General Meeting (including any adjournment thereof), and in order for the Company (or its agents) to comply with any applicable law, listing rules, regulations and/or guidelines (collectively, the “Purposes”); (ii) warrants that where the member discloses the personal data of the member’s proxy(ies) and/or representative (s) to the Company (or its agents), the member has obtained the prior consent of such proxy(ies) and/or representative(s) for the collection, use and disclosure by the Company (or its agents) of the Personal data of such proxy(ies) and/or representative(s) for the Purposes.
7
Hyflux Ltd Annual Report 2014
Notice of Book Closure
NOTICE IS HEREBY GIVEN that the Share Transfer Books and Register of Members of Hyflux Ltd (the “Company”) will be closed on 12 May 2015 for the preparation of dividend warrants.
Duly completed registrable transfers of ordinary shares received by the Company’s Share Registrar, Boardroom Corporate & Advisory Services Pte. Ltd., 50 Raffles Place, #32-01, Singapore Land Tower, Singapore 048623 up to 5.00 p.m. on 11 May 2015 will be registered to determine ordinary shareholders’ entitlements to the said dividend. Members whose Securities Accounts with The Central Depository (Pte) Limited are credited with the Company’s ordinary shares at 5.00 p.m. on 11 May 2015 will be entitled to the proposed dividend.
Payment of the dividend, if approved by the members at the Annual General Meeting to be held on 29 April 2015, will be made on 25 May 2015.
8
Hyflux Ltd Annual Report 2014
Appendix 1
SUMMARY SHEET FOR RENEWAL OF SHARES PURCHASE MANDATE
The Singapore Exchange Securities Trading Limited (the “SGX-ST”) assumes no responsibility for the correctness of any of the statements made, reports contained or opinions expressed in this Appendix. If you are in doubt as to the action that you should take, you should consult your stockbroker or other professional adviser immediately.
(A) SHARES PURCHASED IN THE PREVIOUS TWELVE MONTHS
Pursuant to the Share Purchase Mandate obtained at the annual general meeting on 24 April 2014, as at 16 March 2015 (the “Latest Practicable Date”), Hyflux Ltd (the “Company”, and together with its subsidiaries, the “Group”) had purchased by way of market acquisition an aggregate of 20,508,300 ordinary shares in the capital of the Company (the “Shares”), which are held in treasury (such Shares held in treasury, “Treasury Shares”). The total consideration paid for the purchases was S$19,749,337 (inclusive of brokerage and clearing fee of S$40,069). The highest price paid for the purchases was S$1.01 per Share, and the lowest price paid for the purchases was S$0.84 per Share.
(B) RENEWAL OF THE SHARES PURCHASE MANDATE The Ordinary Resolution No. 10, if passed at the Annual General Meeting, will renew
the Shares Purchase Mandate approved by the shareholders of the Company from the date of the Annual General Meeting until the date that the next annual general meeting of the Company is held or is required by law to be held, or the time when the Shares Purchase Mandate is revoked or varied by an ordinary resolution of the shareholders of the Company in general meeting, whichever is the earlier, unless prior thereto, Shares purchases are carried out to the full extent mandated.
(C) RATIONALE FOR THE SHARES PURCHASE MANDATE
Short-term speculation may at times cause the market price of the Company’s Shares to be depressed below the true value of the Company and the Group. The proposed Shares Purchase Mandate will provide the Directors with the means to restore investors’ confidence and to protect existing shareholders’ investments in the Company in a depressed share-price situation through judicious Shares purchases to enhance the earnings per Share and/or the net asset value per Share. The Shares purchases will enhance the net asset value per Share if the Shares purchases are made at a price below the net asset value per Share.
The proposed Shares Purchase Mandate will also provide the Company with an expedient and cost-effective mechanism to facilitate the return of surplus cash reserves to the shareholders.
The Directors will only make a Shares purchase as and when the circumstances permit and only if the Directors are of the view that such purchases are in the best
9
Hyflux Ltd Annual Report 2014
Appendix 1 (cont’d)
interests of the Company and the shareholders. The Directors will decide whether to purchase Shares only after taking into account, among other things, the market conditions at such time and the Company’s financial condition. Shares purchases will only be made if the Directors believe that such purchases are likely to benefit the Company and increase economic value for shareholders. For the avoidance of doubt, share purchases will not be made if the Directors believe that such purchases will adversely affect the financial condition of the Company.
The Directors will ensure that the Shares purchases will not have any effect on the listing of the Company’s securities, including the Shares listed on the SGX-ST. Rule 723 of the Listing Manual of the SGX-ST requires at least ten per cent (10%) of any class of a company’s listed securities to be held by the public at all times. The Directors shall safeguard the interests of public shareholders before undertaking any Shares purchases. Before exercising the Shares Purchase Mandate, the Directors shall at all times take due cognisance of (a) the then shareholding spread of the Company in respect of the number of Shares held by substantial shareholders and by non-substantial shareholders and (b) the volume of trading on the SGX-ST in respect of the Shares immediately before the exercise of any Shares purchase.
As at the Latest Practicable Date, 403,062,232 Shares (49.95%) of a total of 806,876,689 Shares issued by the Company are held by 17,253 public shareholders. The Company is of the view that there is a sufficient number of Shares in issue held by public shareholders which would permit the Company to undertake Shares purchases of up to ten per cent (10%) of its issued ordinary share capital without affecting the listing status of the Shares on the SGX-ST. The Company will ensure that the Shares purchases will not cause market illiquidity or affect orderly trade.
(D) FINANCIAL IMPACT OF THE PROPOSED SHARES PURCHASES
1. The purchased Shares shall be cancelled immediately on purchase or acquisition unless held in treasury in accordance with Section 76H of the Companies Act (Cap. 50) (the “Act”). Section 76H of the Act allows purchased Shares to be:
(i) held by the Company; or
(ii) dealt with, at any time, in accordance with Section 76K of the Act, as Treasury Shares.
Section 76K of the Act allows the Company to, inter alia:
(i) sell the Shares (or any of them) for cash;
(ii) transfer the Shares (or any of them) for the purposes of or pursuant to an employees’ share scheme;
10
Hyflux Ltd Annual Report 2014
Appendix 1 (cont’d)
(iii) transfer the Shares (or any of them) as consideration for the acquisition of shares in or assets of another company or assets of a person; or
(iv) cancel the Shares (or any of them). The aggregate number of Shares held as Treasury Shares shall not at any time
exceed ten per cent (10%) of the total number of Shares at that time. Any Shares in excess of this limit shall be disposed of or cancelled in accordance with Section 76K of the Act within six (6) months.
Any Shares purchase will:
(i) reduce the amount of the Company’s share capital where the Shares were purchased or acquired out of the capital of the Company;
(ii) reduce the amount of the Company’s profits where the Shares were purchased or acquired out of the profits of the Company; or
(iii) reduce the amount of the Company’s share capital and profits proportionately where the Shares were purchased or acquired out of both the capital and the profits of the Company;
by the total amount of the purchase price paid by the Company for the Shares cancelled.
The Company cannot exercise any right in respect of Treasury Shares. In particular, the Company cannot exercise any right to attend or vote at meetings and for the purposes of the Act, the Company shall be treated as having no right to vote and the Treasury Shares will be treated as having no voting rights.
2. The financial effects on the Company and the Group arising from the proposed purchases of the Company’s Shares which may be made pursuant to the proposed Shares Purchase Mandate will depend on, inter alia, the aggregate number of Shares purchased and the consideration paid at the relevant time.
3. Based on the existing issued and paid-up share capital of the Company as at the Latest Practicable Date, the proposed purchases by the Company of up to a maximum of ten per cent (10%) of its issued share capital (excluding Treasury Shares) under the Shares Purchase Mandate will result in the purchase of 80,687,669 Shares.
4. An illustration of the impact of Shares purchases by the Company pursuant to the Shares Purchase Mandate on the Group’s and the Company’s financial position is set out below based on the following assumptions:
(a) audited accounts of the Group and the Company as at 31 December 2014;
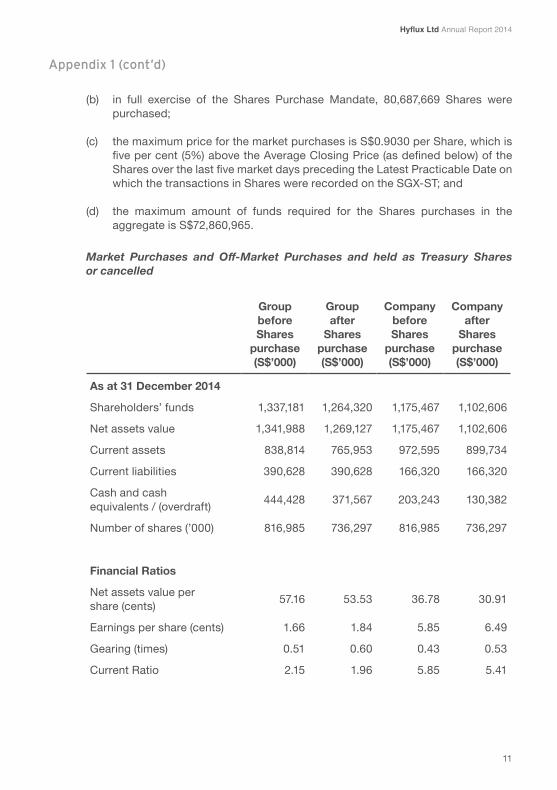
11
Hyflux Ltd Annual Report 2014
Appendix 1 (cont’d)
(b) in full exercise of the Shares Purchase Mandate, 80,687,669 Shares were purchased;
(c) the maximum price for the market purchases is S$0.9030 per Share, which is five per cent (5%) above the Average Closing Price (as defined below) of the Shares over the last five market days preceding the Latest Practicable Date on which the transactions in Shares were recorded on the SGX-ST; and
(d) the maximum amount of funds required for the Shares purchases in the aggregate is S$72,860,965.
Market Purchases and Off-Market Purchases and held as Treasury Shares or cancelled
Group before Shares
purchase(S$’000)
Group after
Shares purchase(S$’000)
Company before Shares
purchase(S$’000)
Company after
Shares purchase(S$’000)
As at 31 December 2014
Shareholders’ funds 1,337,181 1,264,320 1,175,467 1,102,606
Net assets value 1,341,988 1,269,127 1,175,467 1,102,606
Current assets 838,814 765,953 972,595 899,734
Current liabilities 390,628 390,628 166,320 166,320
Cash and cash equivalents / (overdraft) 444,428 371,567 203,243 130,382
Number of shares (’000) 816,985 736,297 816,985 736,297
Financial Ratios
Net assets value per share (cents) 57.16 53.53 36.78 30.91
Earnings per share (cents) 1.66 1.84 5.85 6.49
Gearing (times) 0.51 0.60 0.43 0.53
Current Ratio 2.15 1.96 5.85 5.41

12
Hyflux Ltd Annual Report 2014
Appendix 1 (cont’d)
5. Shareholders should note that the financial effects set out above are based on the audited financial accounts of the Group and the Company for the financial year ended 31 December 2014 and are for illustration only. The results of the Group and the Company for the financial year ended 31 December 2014 may not be representative of future performance.
6. The Company intends to use its internal sources of funds to finance its purchases of the Shares. The Company does not intend to obtain or incur any borrowings to finance its purchases of the Shares. The Directors do not propose to exercise the Shares Purchase Mandate in a manner and to such extent that the working capital requirements of the Group would be materially affected.
7. The Company will take into account both financial and non-financial factors, among other things, the market conditions at such time, the Company’s financial condition, the performance of the Shares and whether such Shares purchases would represent the most efficient and cost-effective approach to enhance the Share value. Shares purchases will only be made if the Board believes that such purchases are likely to benefit the Company and increase economic value for shareholders.
(E) CONSEQUENCES OF SHARES PURCHASES UNDER THE SINGAPORE CODE ON TAKE-OVERS AND MERGERS
1. In accordance with The Singapore Code on Take-overs and Mergers (the “Take-over Code”), a person will be required to make a general offer for a public company if:
(a) he acquires 30 per cent (30%) or more of the voting rights of the company; or
(b) he already holds between 30 per cent (30%) and 50 per cent (50%) of the voting rights of the company, and he increases his voting rights in the company by more than one per cent (1%) in any six-month period.
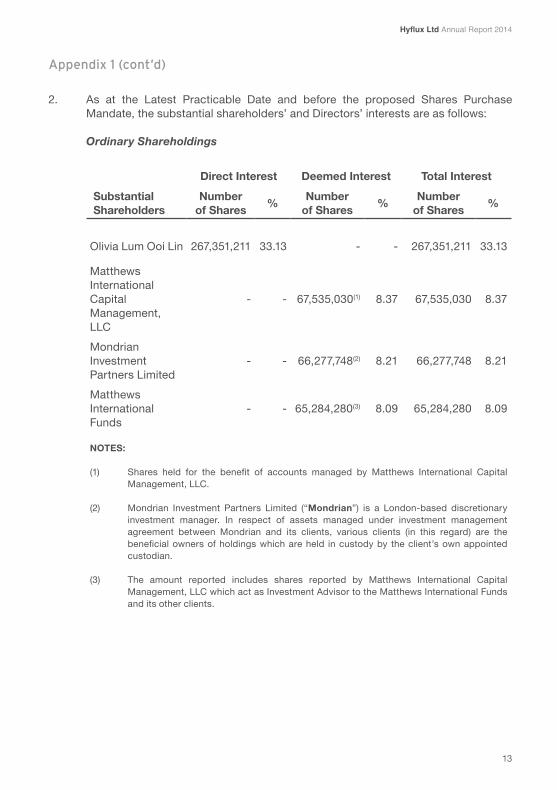
13
Hyflux Ltd Annual Report 2014
Appendix 1 (cont’d)
2. As at the Latest Practicable Date and before the proposed Shares Purchase Mandate, the substantial shareholders’ and Directors’ interests are as follows:
Ordinary Shareholdings
Direct Interest Deemed Interest Total InterestSubstantial Shareholders
Number of Shares % Number
of Shares % Number of Shares %
Olivia Lum Ooi Lin 267,351,211 33.13 - - 267,351,211 33.13
Matthews International Capital Management, LLC
- - 67,535,030(1) 8.37 67,535,030 8.37
Mondrian Investment Partners Limited
- - 66,277,748(2) 8.21 66,277,748 8.21
Matthews International Funds
- - 65,284,280(3) 8.09 65,284,280 8.09
NOTES:
(1) Shares held for the benefit of accounts managed by Matthews International Capital Management, LLC.
(2) Mondrian Investment Partners Limited (“Mondrian”) is a London-based discretionary investment manager. In respect of assets managed under investment management agreement between Mondrian and its clients, various clients (in this regard) are the beneficial owners of holdings which are held in custody by the client’s own appointed custodian.
(3) The amount reported includes shares reported by Matthews International Capital Management, LLC which act as Investment Advisor to the Matthews International Funds and its other clients.
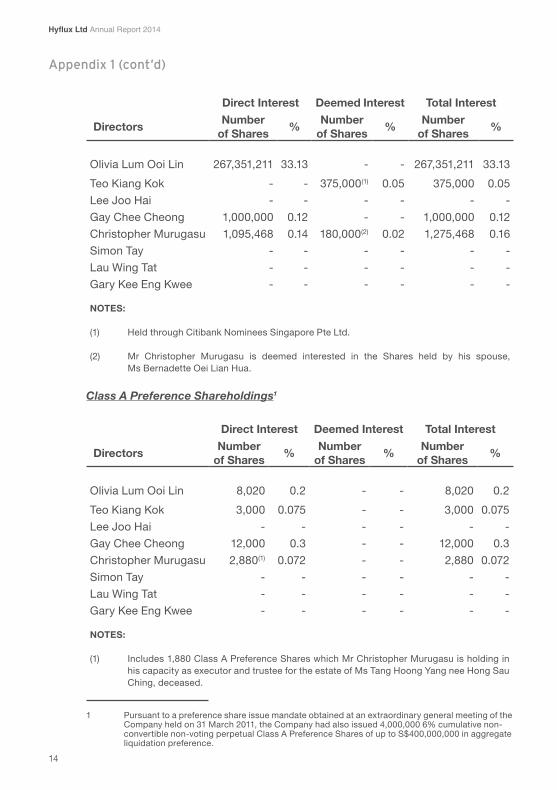
14
Hyflux Ltd Annual Report 2014
Appendix 1 (cont’d)
Direct Interest Deemed Interest Total Interest
Directors Number of Shares % Number
of Shares % Number of Shares %
Olivia Lum Ooi Lin 267,351,211 33.13 - - 267,351,211 33.13Teo Kiang Kok - - 375,000(1) 0.05 375,000 0.05Lee Joo Hai - - - - - -Gay Chee Cheong 1,000,000 0.12 - - 1,000,000 0.12Christopher Murugasu 1,095,468 0.14 180,000(2) 0.02 1,275,468 0.16Simon Tay - - - - - -Lau Wing Tat - - - - - -Gary Kee Eng Kwee - - - - - -
NOTES:
(1) Held through Citibank Nominees Singapore Pte Ltd.
(2) Mr Christopher Murugasu is deemed interested in the Shares held by his spouse, Ms Bernadette Oei Lian Hua.
Class A Preference Shareholdings1
Direct Interest Deemed Interest Total Interest
Directors Number of Shares % Number
of Shares % Number of Shares %
Olivia Lum Ooi Lin 8,020 0.2 - - 8,020 0.2Teo Kiang Kok 3,000 0.075 - - 3,000 0.075Lee Joo Hai - - - - - -Gay Chee Cheong 12,000 0.3 - - 12,000 0.3Christopher Murugasu 2,880(1) 0.072 - - 2,880 0.072Simon Tay - - - - - -Lau Wing Tat - - - - - -Gary Kee Eng Kwee - - - - - -
NOTES:
(1) Includes 1,880 Class A Preference Shares which Mr Christopher Murugasu is holding in his capacity as executor and trustee for the estate of Ms Tang Hoong Yang nee Hong Sau Ching, deceased.
1 Pursuant to a preference share issue mandate obtained at an extraordinary general meeting of the Company held on 31 March 2011, the Company had also issued 4,000,000 6% cumulative non- convertible non-voting perpetual Class A Preference Shares of up to S$400,000,000 in aggregate liquidation preference.
15
Hyflux Ltd Annual Report 2014
Appendix 1 (cont’d)
In the event the Company undertakes Shares purchases of up to ten per cent (10%) of the issued share capital of the Company as permitted by the Shares Purchase Mandate, the shareholdings and voting rights of Ms Olivia Lum Ooi Lin may be increased from 33.13% to 36.81%. Ms Olivia Lum Ooi Lin’s shareholdings and voting rights may thus be increased by more than one per cent (1%) within a six-month period. Accordingly, Ms Olivia Lum Ooi Lin may be required to make a general offer to the other shareholders under Rule 14.1(b) of the Take-over Code.
3. Pursuant to paragraph 3(a) of Appendix 2 to the Take-over Code, Ms Olivia Lum Ooi Lin and parties acting in concert with her will be exempted from the requirement to make a general offer under Rule 14.1(b) of the Take-over Code after any Shares purchase, subject to the following conditions:
(a) this Appendix contains advice to the effect that by voting for the resolution to approve the Shares Purchase Mandate, shareholders are waiving their right to a general offer at the required price from Ms Olivia Lum Ooi Lin and parties acting in concert with her, if any; and the names of Ms Olivia Lum Ooi Lin and her concert parties, if any, and the voting rights of such persons at the time of the resolution and after the proposed Shares Purchases are disclosed in this Appendix;
(b) the resolution to approve the Shares Purchase Mandate is approved by a majority of those shareholders present and voting at the meeting on a poll who could not become obliged to make an offer for the Company as a result of the Shares Purchase;
(c) Ms Olivia Lum Ooi Lin and her concert parties, if any, do not vote for and/or recommend shareholders to vote in favour of the resolution to approve the Shares Purchase Mandate;
(d) within 7 days after the passing of the resolution to approve the Shares Purchase Mandate, Ms Olivia Lum Ooi Lin to submit to the Council a duly signed form as prescribed by the Council; and
(e) Ms Olivia Lum Ooi Lin and her concert parties, if any, have not acquired and will not acquire any Shares between the date on which they know that the announcement of the approval of the Shares Purchase Mandate is imminent and the earlier of:
(i) the date on which the Shares Purchase Mandate expires; and
(ii) the date the Company announces that it has bought back such number of Shares as authorised under the Shares Purchase Mandate or the date the Company decides to cease buying back its Shares, as the case may be
16
Hyflux Ltd Annual Report 2014
Appendix 1 (cont’d)
if such acquisitions, taken together with shares bought by the Company under the Shares Purchase Mandate, would cause their aggregate voting rights in the Company to increase by more than 1% in the any six–month period.
The Directors hereby confirm that the substantial shareholders are not acting in concert with any other person to assist any shareholder (or his concert party or parties) to obtain or consolidate control of the Company and that the proposed Shares Purchases are not for any such purpose.
It should be noted that approving the Shares Purchase Mandate will constitute a waiver by the shareholders in respect of their rights to receive a general offer by the substantial shareholders and parties acting in concert with the substantial shareholders at the required price, which shall be determined in accordance with the relevant provisions of the Take-over Code.
For the purpose of the Shares Purchase Mandate, parties acting in concert comprise individuals or companies who, pursuant to an agreement or understanding (whether formal or informal), cooperate, through the acquisition by any of them of shares in the Company, to obtain or consolidate effective control of the Company.
(F) MISCELLANEOUS
1. Any Shares purchases undertaken by the Company shall be at a price of up to but not exceeding the Maximum Price. The Maximum Price is a sum which shall not exceed the sum constituting five per cent (5%) above the average closing price of the Shares over the period of five (5) trading days in which transactions in the Shares on the SGX-ST were recorded, in the case of a Market Purchase, before the day on which such purchase is made, and, in the case of an Off-Market Purchase, immediately preceding the date of offer by the Company, as the case may be, and adjusted for any corporate action that occurs after the relevant five (5) day period (the “Average Closing Price”).
2. In making Share purchases, the Company will comply with the requirements of the SGX-ST Listing Manual, in particular, Rule 886 with respect to notification to the SGX-ST of any Shares purchases. Rule 886 is reproduced below:
“(1) An issuer must notify the Exchange of any share buy-back as follows:
(a) In the case of a market acquisition, by 9.00 am on the market day following the day on which it purchased shares,
(b) In the case of an off market acquisition under an equal access scheme, by 9.00 am on the second market day after the close of acceptances of the offer.
17
Hyflux Ltd Annual Report 2014
Appendix 1 (cont’d)
(2) Notification must be in the form of Appendix 8.3.1 (or 8.3.2 for an issuer with a dual listing on another stock exchange).”
3. Shares purchases will be made in accordance with the “Guidelines on Shares Purchases” as set out in Appendix 1 of the Company’s Circular to shareholders dated 4 April 2008, a copy of which is annexed hereto as Appendix 2. All information required under the Act relating to the Shares Purchase Mandate is contained in the said Guidelines. With reference to:
(a) Paragraph 1(b) of Appendix 2, the Shares Purchase Mandate will expire on the earliest of any of the circumstances set out in sub-paragraphs (i) to (iii) unless prior thereto, Shares purchases are carried out to the full extent mandated;
(b) Paragraph 6(a) of Appendix 2, the offer document to be issued to all Shareholders in the case of an Off-Market Purchase shall also contain information on whether the Shares purchased by the Company will be cancelled or kept as treasury shares; and
(c) Paragraph 10(b) of Appendix 2, for the avoidance of doubt, as the Company is required to announce quarterly financial statements, the Company may not effect any repurchases of Shares on the SGX-ST during the period commencing two weeks before the announcement of the Company’s financial statements for each of the first three quarters of its financial year, or one month before the full financial year, as the case may be, and ending on the date of announcement of the relevant results.
4. The SGX-ST Listing Manual does not expressly prohibit any purchase of shares by a listed company during any particular time or times. However, as a listed company would be considered an “insider” in relation to any proposed purchase or acquisition of its shares, the Company will undertake not to purchase or acquire Shares pursuant to the proposed Share Purchase Mandate at any time after a price sensitive development has occurred or has been the subject of a decision until the price sensitive information has been publicly announced. In particular, the Company will not purchase or acquire any Shares during the period commencing two weeks before the announcement of the Company’s financial statements for each of the first three quarters of its financial year, or one month before the full financial year, as the case may be, and ending on the date of announcement of the relevant results.
18
Hyflux Ltd Annual Report 2014
Appendix 1 (cont’d)
(G) DIRECTORS’ RESPONSIBILITY STATEMENT
The Directors collectively and individually accept full responsibility for the accuracy of the information given in this Appendix and confirm after making all reasonable enquiries that, to the best of their knowledge and belief, this Appendix constitutes full and true disclosure of all material facts about the Shares Purchase Mandate, the Company and its subsidiaries, and the Directors are not aware of any facts the omission of which would make any statement in this Appendix misleading. Where information in this Appendix has been extracted from published or otherwise publicly available sources or obtained from a named source, the sole responsibility of the Directors has been to ensure that such information has been accurately and correctly extracted from those sources and/or reproduced in this Appendix in its proper form and context.
(H) SHAREHOLDERS WHO WILL ABSTAIN FROM VOTING
Ms Olivia Lum Ooi Lin and her concert parties will abstain from voting at the Annual General Meeting in respect of Ordinary Resolution 10 relating to the Shares Purchase Mandate, and will not act as proxies in respect of Ordinary Resolution 10 unless voting instructions have been given by the appointing Shareholder(s).
(I) DIRECTORS’ RECOMMENDATION
The Directors of the Company, other than Ms Olivia Lum Ooi Lin who has abstained from making any recommendation, are of the opinion that the renewal of the proposed Shares Purchase Mandate is in the best interests of the Company. Accordingly, the Directors of the Company recommend that shareholders vote in favour of Ordinary Resolution 10.
(J) TAXATION
Shareholders who are in doubt as to their respective tax positions or any tax implications, or who may be subject to tax in a jurisdiction outside Singapore, should consult their own professional tax advisers.
(K) DOCUMENTS FOR INSPECTION
Copies of the following documents may be inspected at the registered office of the Company at Hyflux Innovation Centre, 80 Bendemeer Road, Hyflux Innovation Centre, Singapore 339949 during normal business hours up to and including the date of the Annual General Meeting:
(a) the Memorandum and Articles of Association of the Company; and
(b) the audited financial statements of the Company for the financial year ended 31 December 2014.
19
Hyflux Ltd Annual Report 2014
Appendix 2
GUIDELINES ON SHARES PURCHASES
1. SHAREHOLDERS’ APPROVAL
(a) Purchases of Shares by the Company must be approved in advance by the Shareholders at a general meeting of the Company, by way of a general mandate.
(b) A general mandate authorising the purchase of Shares by the Company representing up to ten per cent (10%) of the issued ordinary shares in the capital of the Company (excluding any Shares held as Treasury Shares) will expire on the earlier of:
(i) the conclusion of the next annual general meeting of the Company;
(ii) the expiration of the period within which the next annual general meeting of the Company is required by law to be held; or
(iii) the time when such mandate is revoked or varied by an ordinary resolution of the Shareholders of the Company in general meeting.
(c) The authority conferred on the Directors by the Shares Purchase Mandate to
purchase Shares shall be renewed at the next annual general meeting of the Company.
(d) When seeking Shareholders’ approval for the renewal of the Shares Purchase Mandate, the Company shall disclose details pertaining to the purchases of Shares made during the previous 12 months, including the total number of Shares purchased, the purchase price per Share or the highest and lowest price for such purchases of Shares, where relevant, and the total consideration paid for such purchases.
2. MODE OF PURCHASE
Shares Purchases can be effected by the Company in either one of the following two ways or both:
(a) by way of market purchases of Shares on the Official List of SGX-ST, which means a purchase transacted through the ready market; or
(b) by way of off-market acquisitions on an equal access scheme in accordance with Section 76C of the Act.
20
Hyflux Ltd Annual Report 2014
Appendix 2 (cont’d)
3. FUNDING OF SHARES PURCHASES
(a) In purchasing the Shares, the Company may only apply funds legally permitted for such purchase in accordance with its Articles of Association, and the relevant laws and regulations enacted or prescribed by the relevant competent authorities in Singapore.
(b) Any purchase by the Company may be made out of capital or profits that are available for distribution as dividends, so long as the Company is solvent (as defined by Section 76F(4) of the Act) .
(c) The Company may not purchase its Shares on the Official List of SGX-ST for a consideration other than cash or for settlement otherwise than in accordance with the trading rules of SGX-ST.
4. TRADING RESTRICTIONS
The number of Shares which can be purchased pursuant to the Shares Purchase Mandate is such number of Shares which represents up to a maximum of ten per cent (10%) of the issued ordinary shares in the capital of the Company (excluding Treasury Shares) as at date of the last annual general meeting of the Company.
5. PRICE RESTRICTIONS
Any Shares Purchase undertaken by the Company shall be at the price of up to but not exceeding the Maximum Price.
“Maximum Price” means the maximum price at which the Shares can be purchased pursuant to the Shares Purchase Mandate, which shall not exceed the sum constituting five per cent (5%) above the average closing price of the Shares over the period of five (5) trading days in which transactions in the Shares on SGX-ST were recorded, in the case of a Market Purchase, before the day on which such purchase is made, and, in the case of an Off-Market Purchase, immediately preceding the date of offer by the Company, as the case may be, and adjusted for any corporate action that occurs after the relevant five (5) day period.
6. OFF-MARKET PURCHASES
(a) For purchases of Shares made by way of an Off-Market Purchase, the Company shall issue an offer document to all Shareholders. The offer document shall contain, inter alia, the following information:
21
Hyflux Ltd Annual Report 2014
Appendix 2 (cont’d)
(i) the terms and conditions of the offer;
(ii) the period and procedures for acceptances;
iii) the reasons for the proposed Shares Purchase;
(iv) the consequences, if any, of Shares purchased by the Company that will arise under the Take-overs and Mergers or any other applicable take-over rules;
(v) whether the purchase of Shares, if made, would have any effect on the listing of the Company’s securities on the Official List of SGX-ST; and
(vi) details of any purchase of Shares made by the Company in the previous 12 months whether through Market Purchases or Off-Market Purchases, including the total number of Shares purchased, the purchase price per Share or the highest and lowest prices paid for such purchases of Shares, where relevant, and the total consideration paid for such purchases.
(b) All Offeree Shareholders shall be given a reasonable opportunity to accept any offer made by the Company to purchase their Shares under the Shares Purchase Mandate.
(c) The Company may offer to purchase Shares from time to time under the Shares Purchase Mandate subject to the requirement that the terms of any offer to purchase Shares by the Company shall be pari passu in respect of all Offeree Shareholders save under the following circumstances:
(i) where there are differences in consideration attributable to the fact that an offer relates to Shares with different dividend entitlements;
(ii) where there are differences in consideration attributable to the fact that an offer relates to Shares with different amounts remaining unpaid; and
(iii) where there are differences in an offer introduced solely to ensure that every Shareholder is left with a whole number of Shares in board lots of 1,000 Shares after the Shares Purchases, in the event there are Offeree Shareholders holding odd numbers of Shares.
22
Hyflux Ltd Annual Report 2014
Appendix 2 (cont’d)
7. STATUS OF PURCHASED SHARES
The purchased Shares shall be cancelled immediately on purchase or acquisition unless held in treasury in accordance with Section 76H of the Act. Section 76H of the Act allows purchased Shares to be:
(i) held by the Company; or
(ii) dealt with, at any time, in accordance with Section 76K of the Act, as Treasury Shares.
Section 76K of the Act allows the Company to:
(i) sell the Shares (or any of them) for cash;
(ii) transfer the Shares (or any of them) for the purposes of or pursuant to an employees’ share scheme;
(iii) transfer the Shares (or any of them) as consideration for the acquisition of shares in or assets of another company or assets of a person; or
(iv) cancel the Shares (or any of them).
The aggregate number of Shares held as Treasury Shares shall not at any time exceed ten per cent (10%) of the total number of Shares at that time. Any Shares in excess of this limit shall be disposed of or cancelled in accordance with Section 76K of the Act within six (6) months.
Any Shares Purchase will:
(i) reduce the amount of the issued shares in the capital of the Company where the Shares were purchased or acquired out of the capital of the Company;
(ii) reduce the amount of the Company’s profits where the Shares were purchased or acquired out of the profits of the Company; or
(iii) reduce the amount of the Company’s share capital and profits proportionately where the Shares were purchased or acquired out of both the capital and the profits of the Company;
23
Hyflux Ltd Annual Report 2014
Appendix 2 (cont’d)
by the total amount of the purchase price paid by the Company for the Shares cancelled.
The Company cannot exercise any right in respect of Treasury Shares. In particular, the Company cannot exercise any right to attend or vote at meetings and for the purposes of the Act, the Company shall be treated as having no right to vote and the Treasury Shares will be treated as having no voting rights.
8. NOTIFICATION TO ACCOUNTING AND CORPORATE REGULATORY AUTHORITY (“ACRA”)
(a) Within thirty (30) days of the passing of a Shareholders’ resolution to approve any purchase of Shares, the Company shall lodge a copy of such resolution with ACRA.
(b) The Company shall notify ACRA within thirty (30) days of a purchase of Shares. Such notification shall include details of the date of the purchase, the total number and nominal value of Shares purchased by the Company, the issued shares in the capital of the Company as at the date of the Shareholders’ resolution approving the purchase, the Company’s issued shares in the capital after the purchase and the amount of consideration paid by the Company for the purchase.
9. NOTIFICATION TO THE SGX-ST
(a) For purchases of Shares made by way of an Off-Market Purchase, the Company shall notify the SGX-ST in respect of any acquisition or purchase of Shares in the relevant form prescribed by the SGX-ST from time to time, not later than 9.00 a.m. on the second trading day after the close of acceptances of an offer, or within such time period that may be prescribed by the SGX-ST from time to time.
(b) For purchases of Shares made by way of a Market Purchase, the Company shall notify the SGX-ST in respect of any acquisition or purchase of Shares in the relevant form prescribed by the SGX-ST from time to time, not later than 9.00 a.m. on the trading day following the date of market acquisition by the Company, or within such time period that may be prescribed by the SGX-ST from time to time.
10. SUSPENSION OF PURCHASE
(a) The Company may not undertake any Shares Purchase prior to the announcement of any price-sensitive information by the Company, until such time as the price sensitive information has been publicly announced or disseminated in accordance with the requirements of the Listing Manual.

24
Hyflux Ltd Annual Report 2014
Appendix 2 (cont’d)
(b) The Company may not effect any repurchases of Shares on the SGX-ST during the period commencing two weeks before the announcement of the Company’s financial statements for each of the first three quarters of its financial year, or one month before half year or financial year, as the case may be, and ending on the date of announcement of the relevant results.