Embed Size (px)
Citation preview

Sustainable Energy Management Approaches in Wastewater Treatment
Facilities
Preconference Workshop
Saturday, October 13, 2007
Color Slides
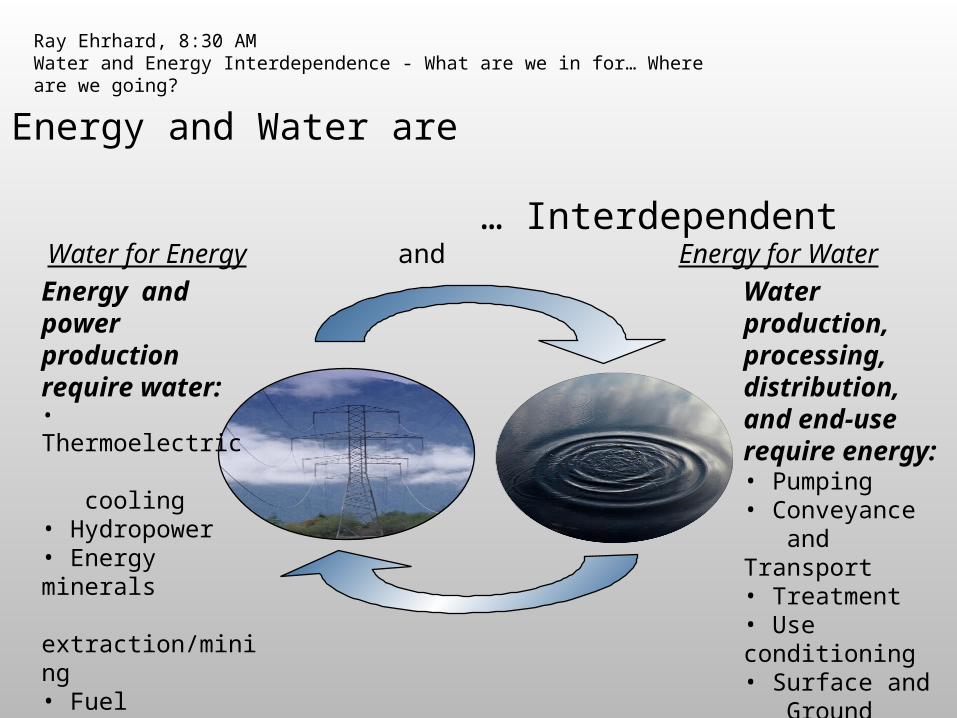
Energy and Water are … Interdependent
Water for Energy and Energy for Water
Energy and power production require water:• Thermoelectric cooling• Hydropower• Energy minerals extraction/mining• Fuel Production (fossil fuels, H2, biofuels)• Emission control
Water production, processing, distribution, and end-use require energy:• Pumping• Conveyance and Transport• Treatment• Use conditioning• Surface and Ground water
Ray Ehrhard, 8:30 AMWater and Energy Interdependence - What are we in for… Where are we going?

Why Do We Care?
• For wastewater - energy represents
25-30% of the total plant O&M– Raw sewage pumping = 12%– Aeration = 52%– Solid handling = 30%– Lighting, heating, AC, and masc. = 6%
Jim Wheeler, 9:25 AMRenewable Energy for the Wastewater Industry: the Office of Water Perspective

Modeling Water Systems
• Detailed fresh and waste water flows and technologies
William Horak, et al 8:50 AMThe Energy-Water Nexus (EWN): a New York City Pilot Study

Single Parameter ComparisonsWastewater Treatment Plants
AwwaRF Survey, 2004 Data, 300 observations
0
10
20
30
40
50
60
0 25 50 75 100 125 150 175 200 225 250 275 300 325 350 375 400 425 450
Annual Energy Cost ($/MG)
Nu
mb
er
of
Pla
nts
Wastewater Treatment PlantsAwwaRF Survey, 2004 Data, 279 observations
0
5
10
15
20
25
30
Annual Electricity Use (kWh/MG)
Nu
mb
er
of
Pla
nts
Steven Carlson, P.E., 10:30 AMDevelopment of a Utility Energy Index

Katy Hatcher, USEPA Energy StarFocusing on Energy Efficiency for theDrinking Water and Wastewater Industries Portfolio Manager:
Facility Summary View

One of NY’s Energy Champions: Albany North WWTP
0
5000
10000
15000
20000
25000
30000
35000
40000
1
Average KWH's/Day North Plant 1990-2003
1990 1991 1992 1993 1994 1995 1996 1997 1998 1999 2000 2001 2002 2003
Fine bubble aeration
2006 2007-2011
VFDs; SCADA system
Enhancement to furnace control; add’l VFDs; add’l premium efficiency motors; building improvements
Premium efficiency motors; add’l VFDs
Waste heat recovery
Kathleen O’Connor, 11:00 AMWe’re Here to Serve: How Your State Energy Agency Can Improve Your Bottom Line
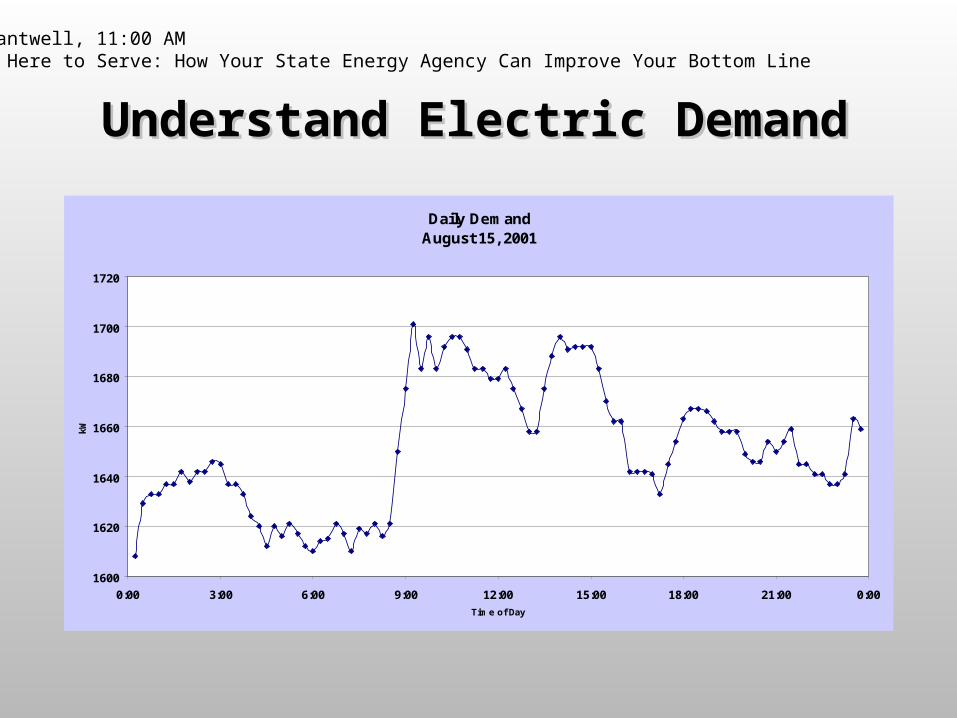
Daily DemandAugust 15, 2001
1600
1620
1640
1660
1680
1700
1720
0:00 3:00 6:00 9:00 12:00 15:00 18:00 21:00 0:00
Time of Day
kW
Understand Electric DemandUnderstand Electric Demand
Joe Cantwell, 11:00 AMWe’re Here to Serve: How Your State Energy Agency Can Improve Your Bottom Line

Energy Efficiency Projects Generally Four Categories
Conservation Less Consumption
Efficiency -- Focus on Increasing Equipment & Process Efficiency
DO Probes in the ASPEfficient Pumps, Blowers, MotorsReplacement of Existing Diffusers with Energy
Efficient Membrane Diffusion SystemMotors with High Efficiency Motors and VFDSCoarse Bubble Diffusers with Fine Bubble DiffusersHigh Efficiency Motors, Microturbines, and Energy
Recovery SystemsPrimary Treatment Modifications
Generation -- Using Waste FuelsDG, Use of Digester Gas for CHP
Load Shifting -- Shifting Pumping Load to Off-Peak Hours by Increasing Storage Volume, Pumping
Capacity, Installing better pumping controls systems
Shahid Chaudhry, 11:00 AMWe’re Here to Serve: How Your State Energy Agency Can Improve Your Bottom Line

50%
41%
Pumping
25%
25%
42%
17%
Aeration
Diffuse
Electrical energyBiogas energySludgedryer
Heatingboilers
Flare
Lars Gunnarsson, et al, 2:30 PM Cost effective energy usage at Himmerfjärdsverket sewage treatment plant in Sweden

Tom Jenkins, Vikram Pattarkine, Mike StenstromEnergy Conservation by Optimizing Aeration Systems
Terminology• Efficiency
– Standard oxygen transfer efficiency (SOTE) (percent oxygen transferred)– Standard oxygen transfer rate (SOTR) (mass transferred per unit time)– Standard aeration efficiency (SAE) (mass transferred per unit time per unit
power)
• All “standard” terminologies defined for clean water such as tap water (secondary process effluent is never suitable for clean water testing)
• Process Conditions (OTE, OTR, AE)– Adjustment formulas based upon driving force, temperature, barometric
pressure, water quality, saturation concentration, etc.– Driving force and water quality the most significant
– Driving force = (DOS – DO)/DOS
– Water quality – alpha factor, 0 to 1 !– Total correction can result in process water transfer of only 30 to 80% of clean
water transfer

Diffuser Summary• Fine pore systems generally, but not always
offer the best energy conservation• Fine pore systems require a dedication to
maintenance; otherwise, select different alternatives
• Reputable manufactures have valuable experience with piping and assembly – Listen to them!
• The consultant or process engineer must define the efficiency – Require this information from them!
Tom Jenkins, Vikram Pattarkine, Mike StenstromEnergy Conservation by Optimizing Aeration Systems

Tom Jenkins, Vikram Pattarkine, Mike StenstromEnergy Conservation by Optimizing Aeration Systems
Energy Conservation:Blower Upgrades / Revamps
All Blower TypesProvide proper maintenance – filters, seals, diffuser cleaning
Change to energy efficient motors
Add smaller blowers to achieve turndown
Combine air use for other functions (Post-Aeration, Channel Aeration, etc.)
Update Controls

Tom Jenkins, Vikram Pattarkine, Mike StenstromEnergy Conservation by Optimizing Aeration Systems
Energy Conservation:Control System Techniques
All Blower Types
Automatic DO Control to match air rates to process demand
Use MOV Control to minimize pressure
Automatic starting and stopping of blowers
Parallel control instead of cascade control
Design Control System for Reasonable Payback – 2 to 5 years
Include Process Improvement in Evaluation

Robert Ostapczuk, P.E., 3:30 PMGloversville-Johnstown Joint Wastewater Treatment Facility Energy Conservation Program Case Study
Priority 1Aeration System Improvements Cont’d
• Overall project cost $1,500,000
• Total cost for new blower, Dissolved Oxygen (DO) automatic control, and more efficient diffusers ~ $1,000,000
• Energy savings with new system: 30% electricity decline immediately
• 1.3 M kwh saved annually

Robert Ostapczuk, P.E., 3:30 PMGloversville-Johnstown Joint Wastewater Treatment Facility Energy Conservation Program Case Study
Priority 2Anaerobic Digester Improvements
• Biogas Handling Piping– Plugged– Corroded
• Gas Mixing System– No mixing in Secondary
Digester– Poor mixing in Primary
Digester• Plugged lances• Inoperable valves
• Safety Handling Equipment– Inoperable Flare– Inoperable PRVs
Robert Ostapczuk, P.E., 3:30 PMGloversville-Johnstown Joint Wastewater Treatment Facility Energy Conservation Program Case Study
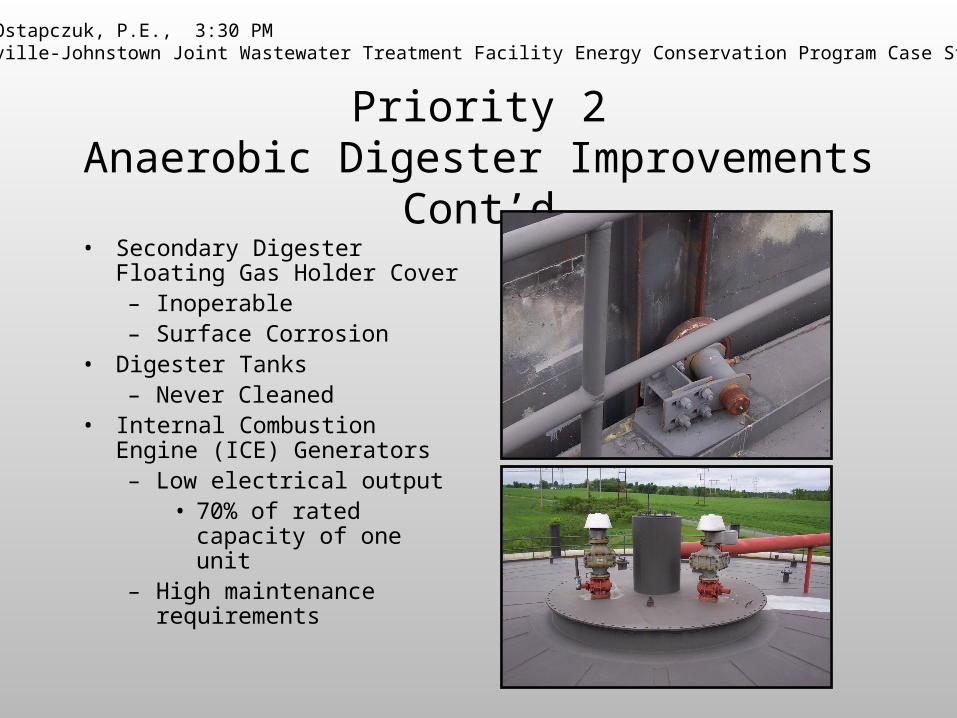
Priority 2Anaerobic Digester Improvements Cont’d
• Secondary Digester Floating Gas Holder Cover– Inoperable– Surface Corrosion
• Digester Tanks– Never Cleaned
• Internal Combustion Engine (ICE) Generators– Low electrical output
• 70% of rated capacity of one unit
– High maintenance requirements

Robert Ostapczuk, P.E., 3:30 PMGloversville-Johnstown Joint Wastewater Treatment Facility Energy Conservation Program Case Study
Priority 2Anaerobic Digester Improvements Cont’d
• Phase I (2002)– Flushed sediment and scale
from biogas piping and existing mixing system
– Overhauled ICE generators• Phase II (2005)
– Converted the existing floating gas holder to a fixed cover with a dual membrane gas holder
– Replaced biogas safety equipment
• Flare• Pressure relief valves

Priority 2Anaerobic Digester Improvements Cont’d
• Phase II (con’t)– Replaced sediment traps– Replaced DIP biogas piping
with SS• Replaced gas mixing system with
a confined gas mixer in both the primary and secondary digesters
• Phase III (2006)– 90,000 gallon acid whey
equalization tank– Acid whey feed system– 2-inch Ø HDPE acid whey
forcemain
Robert Ostapczuk, P.E., 3:30 PMGloversville-Johnstown Joint Wastewater Treatment Facility Energy Conservation Program Case Study

Engine or Turbine-based CHP
Tom Frankiewicz, 9:25 AMCHP for Wastewater Treatment Facilities – where efficiency and renewables meet

Biogas Use: Part of an Integrated Energy System
Electricity
HeatGasFuelFuelFuelFuel
Recovered Recovered HeatHeat
Recovered Recovered HeatHeat
Generated ElectricityGenerated ElectricityGenerated ElectricityGenerated Electricity
ImportImportImportImport
ExportExportExportExportPlant DemandPlant DemandPlant DemandPlant Demand
DigestersDigestersDigestersDigestersWaste GasWaste Gas
FlaresFlaresWaste GasWaste Gas
FlaresFlares BoilersBoilersBoilersBoilers
Digester Digester GasGas
Digester Digester GasGas
SupplementalSupplementalHeatHeat
SupplementalSupplementalHeatHeat
Natural Natural GasGas
Natural Natural GasGas
EffluentEffluentHeatHeat
RejectionRejection
EffluentEffluentHeatHeat
RejectionRejection
PlantPlantHeatHeat
DemandDemand
PlantPlantHeatHeat
DemandDemandOrganicOrganicWasteWasteOrganicOrganicWasteWaste
UtilityUtility
Vehicle FuelVehicle FuelVehicle FuelVehicle Fuel
Dave Parry, 2:00 PMRenewable Biogas Options

Dave Parry, 2:00 PMRenewable Biogas Options
Biogas Treatment Needed for Various Options
IronSponge
Heat Exchangeand Separator
Blower
ActivatedCarbon
ParticulateFilter
H2SReduction
Moisture Reduction PressureBoosting
SiloxaneReduction
ParticulateReduction
From
Digester
To
Beneficial Use
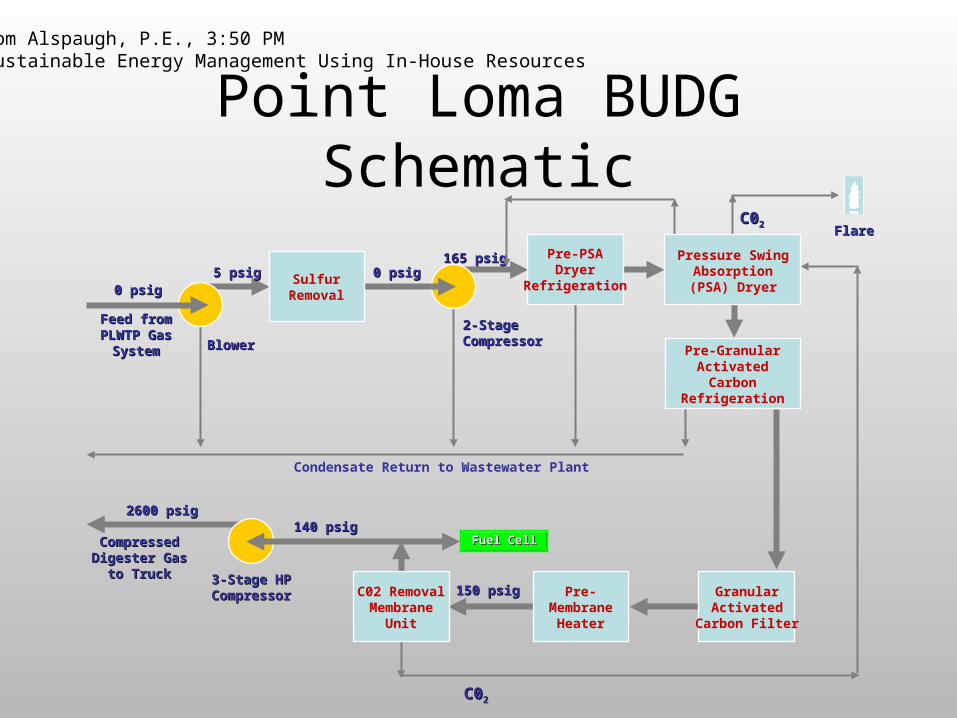
Point Loma BUDG Schematic
CompressedCompressedDigester GasDigester Gas
to Truckto Truck 3-Stage HP3-Stage HPCompressorCompressor
Feed fromFeed fromPLWTP GasPLWTP Gas
SystemSystem
FlareFlare
0 psig0 psig5 psig5 psig 0 psig0 psig
165 psig165 psig
BlowerBlower
Pre-PSADryer
Refrigeration
Pressure SwingAbsorption(PSA) Dryer
2-Stage2-StageCompressorCompressor
Pre-GranularActivatedCarbon
Refrigeration
GranularActivated
Carbon Filter
Pre-Membrane
Heater
150 psig150 psig
140 psig140 psig2600 psig2600 psig
C02 RemovalMembrane
Unit
Condensate Return to Wastewater Plant
C0C022
C0C022
SulfurRemoval
Fuel CellFuel Cell
Tom Alspaugh, P.E., 3:50 PMSustainable Energy Management Using In-House Resources

MWWD 30kW Photovoltaic System at MOC III
• 30 kW rooftop system at MOC III
• Under directive from Metro Commission, innovative rooftop mounting system and semiconductor technology were chosen
Tom Alspaugh, P.E., 3:50 PMSustainable Energy Management Using In-House Resources