Embed Size (px)
Citation preview

REPORT NO. 2044
SUSTAINABILITY OF NZ'S DEEPWATER FISHERIES FROM AN ENERGETICS PERSPECTIVE - AN UPDATE


CAWTHRON INSTITUTE | REPORT NO. 2044 NOVEMBER 2011
iii
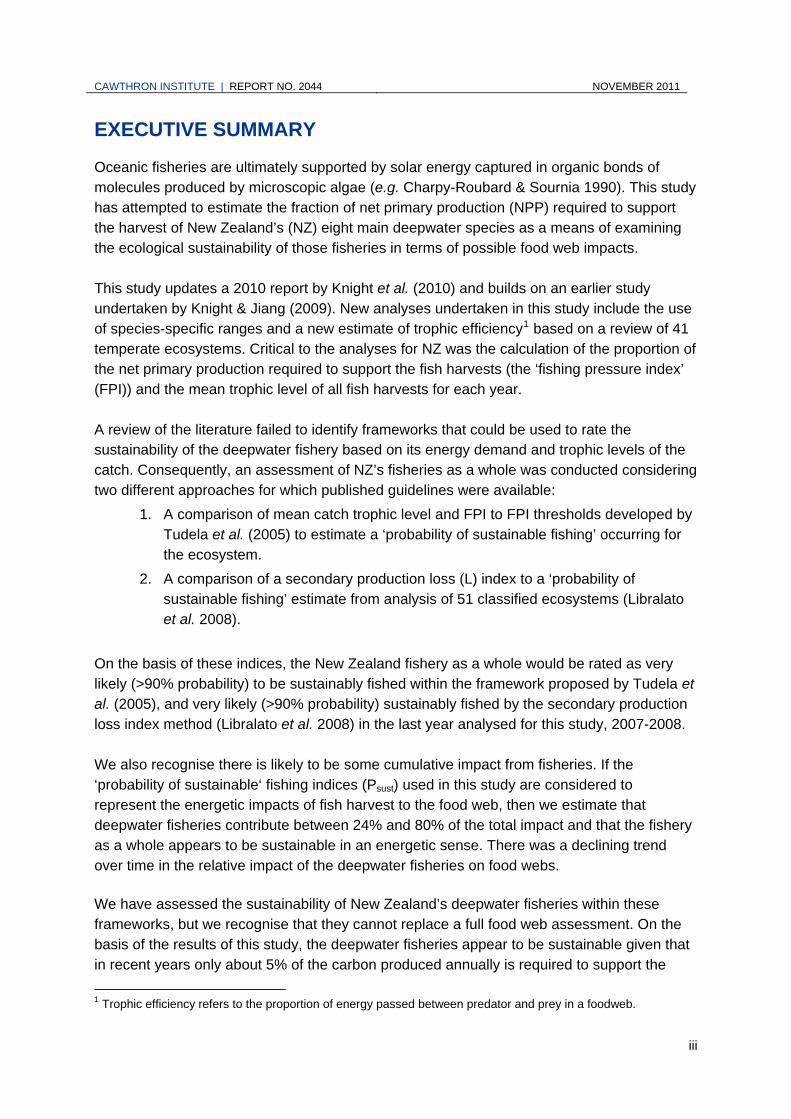
EXECUTIVE SUMMARY
Oceanic fisheries are ultimately supported by solar energy captured in organic bonds of molecules produced by microscopic algae (e.g. Charpy-Roubard & Sournia 1990). This study has attempted to estimate the fraction of net primary production (NPP) required to support the harvest of New Zealand’s (NZ) eight main deepwater species as a means of examining the ecological sustainability of those fisheries in terms of possible food web impacts. This study updates a 2010 report by Knight et al. (2010) and builds on an earlier study undertaken by Knight & Jiang (2009). New analyses undertaken in this study include the use of species-specific ranges and a new estimate of trophic efficiency1 based on a review of 41 temperate ecosystems. Critical to the analyses for NZ was the calculation of the proportion of the net primary production required to support the fish harvests (the ‘fishing pressure index’ (FPI)) and the mean trophic level of all fish harvests for each year. A review of the literature failed to identify frameworks that could be used to rate the sustainability of the deepwater fishery based on its energy demand and trophic levels of the catch. Consequently, an assessment of NZ’s fisheries as a whole was conducted considering two different approaches for which published guidelines were available:
1. A comparison of mean catch trophic level and FPI to FPI thresholds developed by Tudela et al. (2005) to estimate a ‘probability of sustainable fishing’ occurring for the ecosystem.
2. A comparison of a secondary production loss (L) index to a ‘probability of sustainable fishing’ estimate from analysis of 51 classified ecosystems (Libralato et al. 2008).
On the basis of these indices, the New Zealand fishery as a whole would be rated as very likely (>90% probability) to be sustainably fished within the framework proposed by Tudela et al. (2005), and very likely (>90% probability) sustainably fished by the secondary production loss index method (Libralato et al. 2008) in the last year analysed for this study, 2007-2008. We also recognise there is likely to be some cumulative impact from fisheries. If the ‘probability of sustainable‘ fishing indices (Psust) used in this study are considered to represent the energetic impacts of fish harvest to the food web, then we estimate that deepwater fisheries contribute between 24% and 80% of the total impact and that the fishery as a whole appears to be sustainable in an energetic sense. There was a declining trend over time in the relative impact of the deepwater fisheries on food webs. We have assessed the sustainability of New Zealand’s deepwater fisheries within these frameworks, but we recognise that they cannot replace a full food web assessment. On the basis of the results of this study, the deepwater fisheries appear to be sustainable given that in recent years only about 5% of the carbon produced annually is required to support the
1 Trophic efficiency refers to the proportion of energy passed between predator and prey in a foodweb.

NOVEMBER 2011 REPORT NO. 2044 | CAWTHRON INSTITUTE
iv
deepwater fish harvests. The deepwater fisheries contribute to the cumulative energetic pressures on the wider ecosystem from all fisheries, which require an estimated 7% of the carbon produced annually. Although the ecological parameters used to estimate the ‘probability of sustainable fishing’ are not able to explain all of the sustainability classifications, they do provide a useful metric for comparing New Zealand’s deepwater fisheries to a range of other fisheries from around the world. Based on the metrics and frameworks used in this study, the available evidence suggests that the wider fishery is likely to be classified as sustainably fished when compared to key ecological parameters from other systems.

CAWTHRON INSTITUTE | REPORT NO. 2044 NOVEMBER 2011
v
TABLE OF CONTENTS
EXECUTIVE SUMMARY.........................................................................................................III 1. PREFACE.........................................................................................................................1 2. INTRODUCTION ..............................................................................................................1 3. METHODS........................................................................................................................4 3.1. Net primary production estimation from ocean colour .................................................................................... 5 3.2. Determination of primary production required to support catch ...................................................................... 8 3.3. Calculation of fisheries pressure indices and implications for sustainable management.............................. 10 3.3.1. The Fishing Pressure Index .................................................................................................................... 11 3.3.2. Comparison of harvested carbon to carbon produced............................................................................. 11 3.3.3. The framework approach of Tudela et al. (2005). ................................................................................... 12 3.3.4. A loss of secondary production approach ............................................................................................... 13 4. RESULTS AND DISCUSSION .......................................................................................15 5. CONCLUSIONS..............................................................................................................21 6. ACKNOWLEDGEMENTS...............................................................................................24 7. REFERENCES ...............................................................................................................25 8. APPENDICES.................................................................................................................28 LIST OF FIGURES
Figure 1. New Zealand Exclusive Economic Zone and fisheries catch area statistical divisions ...... 3 Figure 2. Mean production for the NZ EEZ for three NPP algorithms and the average value from
the two VGPM algorithms used as a basis for the study. ................................................... 6 Figure 3. Example carbon production map, showing data used to estimate total yearly carbon
production over a given NABIS region................................................................................ 7 Figure 4. Merged NABIS area for all the eight deepwater species analysed in this study. ............... 8 Figure 5. Number of studies with quoted estimates of trophic efficiency for temperate and shelf
sea regions and including two New Zealand estimates.................................................... 10 Figure 6. Framework showing an example ‘threshold’ FPI curve for a given Psust .......................... 13 Figure 7. Relationship between the estimate of the secondary production loss index (L) and the
probability that an ecosystem is sustainably fished (Psust) ............................................... 14 Figure 8. Contribution of individual catch towards the loss in secondary production (L) index for
the eight deepwater species analysed in the 2008-2009 fishing year.............................. 20 LIST OF TABLES
Table 1. Eight species assessed in this study and their scientific names, species codes and trophic level estimates. ....................................................................................................... 2
Table 2. Ratio of wet weight catch carbon to net primary production carbon for deepwater and total fish catch ................................................................................................................... 16
Table 3. Fishing pressure index calculated for each fishing year ................................................... 17 Table 4. Fishing pressure index thresholds calculated for 50%, 70% and 90% probability of
sustainable fishing (Psust) ................................................................................................. 18 Table 5. Summary of sustainability indices for eight deepwater species analysed and all New
Zealand commercially fished species ............................................................................... 19

NOVEMBER 2011 REPORT NO. 2044 | CAWTHRON INSTITUTE
vi
LIST OF APPENDICES
Appendix 1. NABIS areas for each deepwater species ........................................................................ 28 Appendix 2. Aggregated catch, PPR and NPP data for each deepwater species by fishing year. ...... 30 Appendix 3. Updated trophic level calculations for Ling and Hake....................................................... 32 Appendix 4. Lindex data used to derive ‘probability of sustainable fishing’ index ................................ 33

CAWTHRON INSTITUTE | REPORT NO. 2044 NOVEMBER 2011
1
1. PREFACE
This report is an update to the previous Cawthron report, Sustainability of NZ’s Deepwater Fisheries from an Energetics Perspective (Knight et al. 2010). The updated report has been published to reflect revisions made after feedback from the Aquatic Environment Working Group. While the report was being revised, some additional errors were noted, so changes were also made to amend those. Therefore, this report supersedes the original analysis undertaken in Knight et al. (2010).
2. INTRODUCTION
Oceanic fisheries are ultimately supported by solar energy captured in organic bonds of molecules produced by microscopic algae (e.g. Charpy-Roubard & Sournia 1990). Recent advances in optical remote sensing by satellites have offered the ability to estimate rates of oceanic primary production of fixed carbon over large areas at comparatively high temporal and spatial resolution (e.g. Carr et al. 2006). This study utilises these outcomes to derive temporally and spatially explicit estimates of net primary production (NPP) over biologically relevant regions of New Zealand’s oceans and compares this to the primary production required (PPR) to support eight important deepwater fish species harvests. These species are displayed with their common and scientific names, species code and trophic level in Table 1. There is some evidence to suggest that a number of fisheries are becoming constrained by primary production (or ‘bottom-up’) processes, although the many environmental and biological factors affecting production of fish are difficult to identify conclusively. Examples of studies which claim an observed link between primary productivity and fish harvests in commercially fished ecosystems include: fisheries on the west coast of North America (Ware & Thompson 2005); fishing harvests in European eco-regions (Chassot et al. 2007); and global fisheries (Chassot et al. 2005). A review of the literature in this area also shows that global fisheries over the period 1988 to 1991 required about 8% of the global primary production to support catches (Pauly & Christensen 1995). Since this study, other studies have noted trends of declining mean trophic levels of global and local fish catches (e.g. Pauly et al. 1998, 2001) which suggests that, at a global scale, high trophic level fisheries may be over-exploited.

NOVEMBER 2011 REPORT NO. 2044 | CAWTHRON INSTITUTE
2
Table 1. Eight species assessed in this study and their scientific names, species codes and trophic level estimates.
Common Name Scientific Name Species
Code Trophic Level*
Diet Reference
Ling Genypterus blacodes LIN 4.72 (4.34)
Dunn et al. 2010
Orange Roughy Hoplostethus atlanticus ORH 4.3 Bulman &
Koslow 1992
Hoki Macruronus novaezelandiae HOK 4.47
Bulman & Blaber 1986; Clark 1985
Hake Merluccius australis HAK 5.20 (4.45)
Dunn et al. 2010
Scampi Metanephrops challengeri SCI 3.31 Jiang & Gibbs 2005
Southern Blue Whiting Micromesistius australis SBW 3.79 Clark 1985
Southern Arrow Squid
Nototodarus sloanii, N. gouldi SQU 3.31 Jiang & Gibbs
2005 Jack Mackerel
Trachurus declivis, T. murphyi, T. novaezelandiae JMA 3.55 Fishbase 2010
* Values in brackets represent fishbase trophic level estimates derived from diet studies not deemed suitable for the NZ ecosystem, see Appendix 3 for updated trophic level calculations from updated diet information. In a move towards protecting economic and other values of marine ecosystems, nation states are beginning to align their management strategies with the ecosystem-based management objectives of the FAO Code of Conduct for Responsible Fisheries (FAO 1995). These objectives explicitly recognise the “finite nature of their natural resources” (Article 10.1.1) and a need to adopt a “precautionary approach to conservation, management and exploitation of living aquatic resources” (Article 7.5). New Zealand is among the nations adopting this approach and has the ability to control fisheries harvest through total allowable commercial catch (TACC) output controls which restrict the total annual harvests for each species to a predetermined quantity.

CAWTHRON INSTITUTE | REPORT NO. 2044 NOVEMBER 2011
3
Figure 1. New Zealand Exclusive Economic Zone and fisheries catch area statistical divisions,
showing position of major fronts, currents (after Heath 1985) and regions representative of major water bodies (where CTW= Central Tasman Sea Water, STW = Subtropical Water, SAW = Sub Antarctic Water).
Despite the complexity of modelling the linkages and parameterisation of a marine food web, there have been numerous studies undertaken globally (e.g. Cox et al. 2002; Harvey et al. 2003) and within New Zealand (Jiang & Gibbs 2005; Bradford-Grieve et al. 2003) which have utilised ecosystem models to investigate marine resource allocation issues. The complexity of water masses, species migrations and the number of ecosystems located around New Zealand (Figure 1) led Knight & Jiang (2009) to adopt the relatively simple approach of Pauly & Christensen (1995) to assessing the impact of fisheries. Knight & Jiang (2009) assessed New Zealand’s fishery harvests as a proportion of NPP at both coarse and fine spatial scales and compared results with global estimates.

NOVEMBER 2011 REPORT NO. 2044 | CAWTHRON INSTITUTE
4
The coarse-scale analysis was conducted over New Zealand’s exclusive economic zone (EEZ). This analysis allowed comparisons with the global-scale study undertaken by Pauly & Christensen (1995). The results of the New Zealand analysis showed that in 2006 about 8% of NPP was required to support 2006 fisheries harvests, a figure comparable to the global average. Of note was the hoki (Macruronus novaezelandiae) catch which represented about half of the PPR to support all of New Zealand’s fisheries. However, the study relied on a non-biologically relevant boundary, New Zealand’s EEZ, which included regions that commercial fish species did not interact with and used a generic global estimate of trophic efficiency (10%). A fine-scale analysis was also undertaken to assess whether statistical catch reporting areas (Figure 1) provided a more biologically relevant scale for comparison. However, given the migratory nature of New Zealand’s major fish stocks and targeting of spawning aggregations by the fishing industry, this method was not particularly informative. The present study has been designed to assess the energy required by eight of New Zealand’s most economically important deepwater fisheries over more biologically relevant regions than had been undertaken previously (Knight & Jiang , 2009). The regions are provided by the National Aquatic Biodiversity Information System (NABIS – Francis et al. 2002) which describe the known habitat of commercial fish species based on evidence from trawl data and expert knowledge. This study gauges the energetic sustainability of these fisheries by considering the results of the study within available frameworks developed for this purpose (Libralato et al. 2005; Tudela et al. 2005). This analysis aims to provide meaningful metrics for use in a multi-criteria assessment of sustainability for the fisheries.
3. METHODS
Catch and species trophic level data was needed for each species’ (NABIS) region in order to generate the information required to compare primary production required (PPR) for fisheries harvests to net primary production (NPP) data. Spatially explicit monthly mean NPP estimates were provided by Oregon State University from Moderate Resolution Imaging Spectroradiometer (MODIS) sensor satellite data for the 2002 to 2009 period (OSU 2010). Total yearly wet weight catch (WWC) data for New Zealand were provided by the New Zealand Ministry of Fisheries and converted to PPR equivalents using the methods employed by Pauly & Christensen (1995). Catch data for non deepwater species was only available until the end of the 2006 fishing year (30 September 2007) and so comparisons between the deepwater fisheries and the entire fishery were undertaken for the period October 2002 until September 2007

CAWTHRON INSTITUTE | REPORT NO. 2044 NOVEMBER 2011
5
(i.e. 2002 to 2006 fishing years). Methods used to generate data for comparison are described in detail below.
3.1. Net primary production estimation from ocean colour
Generating NPP estimates for large areas of ocean at high temporal resolution is a difficult task which has only become feasible since the development of ocean-observing systems. These systems utilise satellite mounted sensors to capture ocean colour information, which can be compared to in situ measurements to derive estimates of important oceanic properties such as temperature or pigment (chlorophyll-a) concentration. The latter is commonly used as a proxy for phytoplankton biomass. Estimates of depth-integrated NPP are then calculated on the basis of these surface data combined with additional information such as: mixed-layer depths, chlorophyll to carbon stoichiometry and light and temperature dependent phytoplankton growth rates. Many algorithms exist for estimating depth integrated production in the ocean, from which estimation of oceanic productivity at a global scale is possible (see Behrenfeld & Falkowski 1997a for a comprehensive list). The production data utilised in this study were generated by Oregon State University from MODIS-derived ocean data using two production algorithms: the Vertically Generalized Production Model (VGPM) (Behrenfeld & Falkowski 1997b) and VGPMEppley (VGPM utilising a different temperature dependence function - Morel 1991). The VGPM algorithm produced consistently higher NPP estimates than VGPMEppley for the NZ EEZ (Figure 2). In order to remove any bias from the use of a single algorithm, NPP estimates were based on the mean of the two VGPM algorithms.

NOVEMBER 2011 REPORT NO. 2044 | CAWTHRON INSTITUTE
6
Figure 2. Mean production for the NZ EEZ for three NPP algorithms and the average value from
the two VGPM algorithms used as a basis for the study (from Knight & Jiang, 2009). Carbon based production model (CbPM) data were not used due to missing values over winter periods.
Oregon State University MODIS-derived NPP data were converted from averaged production per square metre from the 10 minute resolution cells to total monthly NPP for each NABIS region (e.g. Figure 3). This was undertaken by multiplying the estimated monthly NPP data (in mg C m-2day-1) by the area of each grid cell and the number of days in the month, and then summing over the given region for each month. The calculation of total yearly production for each species’ region excluded the proportion of the NABIS areas that is outside of the EEZ. This was undertaken because the NPP estimate calculated for each species’ region was compared to catch data within the EEZ (Figure 1) and there were no catch data available outside of it. Several different NABIS distributions were available for each species, including seasonal, ‘normal’ (~90%) and ‘full’ (100%) ranges of distribution. These ranges were derived by expert assessment of the areas based on observations from trawls surveys and other available datasets – see Francis et al. (2002) for a full description of the methods used and expert responsible for each species. Normal NABIS regions were considered unsuitable for comparing with fish harvests because the true footprint of resources supporting the fish stocks is likely to be blurred by the foraging of prey species. As resources supporting fish production may extend beyond the boundaries of the habitat of a fished species, a comparison of PPR to NPP should encompass the range of the foraging area of the prey rather than the fished species. It was beyond the scope of this study to account for this effect, so we decided that the full NABIS

CAWTHRON INSTITUTE | REPORT NO. 2044 NOVEMBER 2011
7
ranges would provide the best estimate of the region supporting fish production; it is possible this assumption under or over estimates the primary resources supporting the fishery.
Figure 3. Example carbon production map, showing data used to estimate total yearly carbon
production (in kg/grid cell) over a given NABIS region. These data were totalled over all grid locations to produce a single NPP estimate for a given fishing year and species. This example shows total fixed carbon production over the 2008-2009 fishing year over the hoki NABIS region.
Maps showing all NABIS regions used for each deepwater species are displayed in Appendix 1. A merged NABIS region was created by the union of all deepwater species regions (Figure 4) within the EEZ. This merged region was also used to estimate the production supporting all New Zealand fisheries as it is broadly representative of the habitats of all fished species. However, we note that it could underestimate the spatial extent of fished habitats, and hence the total production supporting the entire fisheries. This may result in an underestimation of the primary production supporting the entire fishery. As with any modelled dataset, uncertainties exist in the estimates of primary production. The degree of uncertainty can be seen in Figure 2 which shows that the difference between the algorithms used to estimate production can be up to about 30%. We have not included a detailed assessment of all the uncertainties present in this study, but we recognise that the underlying NPP data used in this analysis represents an additional source of uncertainty. Despite the limitations of the data, this approach presents the only method available to determine NPP over the temporal and spatial scales used in this study.

NOVEMBER 2011 REPORT NO. 2044 | CAWTHRON INSTITUTE
8
Figure 4. Merged NABIS area for all the eight deepwater species analysed in this study.
3.2. Determination of primary production required to support catch
In order for a given exploited species to replenish, it must have an adequate supply of organic energy. This is defined as primary production required (PPR). Simplistically, this energy originates from solar energy captured by autotrophic species (e.g. phytoplankton), passes to ‘secondary producers’ (e.g. zooplankton, suspension feeders), then to planktivorous species and eventually to predators through this trophic chain. Assuming a linear food chain, at each step only a fraction of any energy (after metabolic and other overheads) is passed on to higher trophic levels for growth of the individual or the population (through gonad development). The fraction that is utilised for growth is termed the trophic efficiency (TE). This efficiency depends on many factors, such as effort required to hunt food, competition with other species and the efficiency of the organism at assimilating organic carbon from their diet. Consequently, calculation of PPR for a given species requires knowledge of the trophic level of that species and assumptions on the efficiency of the trophic levels. Pauly & Christensen (1995) estimated PPR to support a given wet weight catch (WWC) for a species of a given trophic level using the following formula:

CAWTHRON INSTITUTE | REPORT NO. 2044 NOVEMBER 2011
9
( )11 −
⎟⎠⎞
⎜⎝⎛×=
TL
TEWTCWWCPPR (1)
Pauly & Christensen (1995) based their analysis on a wet weight catch to dry weight carbon conversion (WTC) of 1:9 (Strathmann 1967), a mean trophic efficiency estimate of 10% and estimates of trophic levels (TL) of harvested species based on diet composition analysis. It should be noted that this technique bypasses much of the food web complexity (e.g. competition for resources, recycling) and yields a value for PPR which, through the form of this function, is particularly sensitive to both TE and TL. Information is generally available on the diet composition of individual species, so that TL can be estimated to an acceptable degree of accuracy (Table 1). Note that new estimates of TL for NZ species have been calculated for this study using the majority of newly published stomach content data for ling (Genypterus blacodes) and hake (Merluccius australis) (Dunn et al. 2010). However, TL estimates based on diet analysis of stomach contents represent a snapshot of a species diet. The real trophic level may vary through time and new nitrogen isotope analysis currently being undertaken in NZ may in future offer an improved knowledge of mean TL through time (Dr. M. Pinkerton pers comm.). The trophic levels for the eight deepwater species analysed in this report are shown in Table 1. Knight & Jiang (2009) and FishBase (Fishbase, 2010) provide an extended list of trophic level for other New Zealand species. Estimation of a TE value is complex and should take account of food web interactions, such as species’ competition for resources or indirect effects such as microbial recycling of detrital carbon. Due to these complexities, it is therefore much more difficult to ascertain a value for TE than for the TL. The importance of this variable and the associated uncertainty is magnified by the TE exponent (TL-1) in Equation 1 and therefore the species with high trophic levels will be more greatly affected by the choice of TE. In order to ascertain an appropriate value of TE we analysed a summary of 39 temperate ecosystem models provided by Libralato et al. (2008) and two New Zealand estimates provided by Bradford-Grieve et al. (2003) and Jiang & Gibbs (2005) (Figure 5). This analysis provided a median (and mode) TE of 14%, which was used for this study; this differs from the 10% value used by Knight & Jiang (2009). The effect of increasing the TE from the previous estimate of 10% has the effect of decreasing the PPR relative to that study, but appears warranted on the basis of this new analysis. A wide range of values have been estimated for the 41 ecosystems (Figure 5) and further investigation into a suitable value for the New Zealand ecosystem may be warranted in the future.

NOVEMBER 2011 REPORT NO. 2044 | CAWTHRON INSTITUTE
10
Figure 5. Number of studies with quoted estimates of trophic efficiency for temperate and shelf sea
regions (Libralato et al. 2008) and including two New Zealand estimates (Bradford-Grieve et al. 2003; Jiang & Gibbs 2005). The majority of the 41 trophic efficiency estimates were between 10% and 15% with a median of 14%.
To estimate PPR for this study, the PPR formula (1) was applied to wet weight catch data supplied by the Ministry of Fisheries for the eight species analysed. A wet weight catch to carbon ratio of 1:10 was used, based on the conversion used by Bradford-Grieve et al. (2003) for a New Zealand food web study. The catch data was provided as a total for each fishing year (1 October to 30 September) for the entire EEZ (Figure 1). Trophic levels for all eight species were sourced from FishBase (2010) and Jiang & Gibbs (2005) (Appendix 2, Table 2). Where multiple species or families occur in the catch data (e.g. mackerel), the mean of the trophic levels was used. Standard error information is available for the trophic level and trophic efficiency estimates which can enable uncertainties in the PPR estimates to be calculated. Ideally this would be undertaken using bootstrapping or Monte Carlo techniques to assess the uncertainty in the PPR results; however this was beyond the scope of this study. Given the wide range of trophic efficiency values estimated for temperate ecosystems, uncertainties in the estimates of PPR for a given species are likely to be larger than NPP uncertainties.
3.3. Calculation of fisheries pressure indices and implications for sustainable management
Four main approaches are employed here to assess fishing pressure in NZ, building upon the previous simple comparison of NZ EEZ fishing pressure to the global average undertaken by Knight & Jiang (2009). The approaches are: 1. Calculation of fishing pressure index (FPI) to compare trophic scaled catch data to
supporting resources. 2. Comparison of harvested carbon to carbon produced (Link 2005).
CAWTHRON INSTITUTE | REPORT NO. 2044 NOVEMBER 2011
11
3. Comparison of mean trophic level and FPI within the framework of Tudela et al. (2005).
4. Comparison of a loss of secondary production index within the framework of Libralato et al. (2008).
3.3.1. The Fishing Pressure Index
Pauly & Christensen (1995) compared global fisheries catch rate to global production rate and estimated that 8% of the global oceanic primary production was required to support the catch (from 1988-1991). Using this same approach Knight & Jiang (2009) used a fisheries pressure index (FPI) to generate species specific (s) and temporal (t) comparisons of the ratio of PPR to NPP.
t,s
stt,s NPP
PPRFPI ,= (2)
The index may also be expressed as a percentage (FPI% = 100 x FPI, also referred to as PPR% in the literature, e.g. Tudela et al. 2005). This index is intended to display patterns in the relative fishing intensity between areas and times assuming the species are supported by the resources contained within NABIS regions. The analysis assumes that no net export or import of fixed carbon occurs for a given region over the large areas and for the extended time period (of one year) considered in this study. This assumption is considered to be reasonable and also necessary, given the scope of the study. Further research may be helpful in identifying areas that are net importers or exporters of carbon. From a production viewpoint for a single fished species, an index less than one would indicate an energetically sustainable fishery (i.e. that harvests could be sustained in the absence of other species preying on that species).
3.3.2. Comparison of harvested carbon to carbon produced
As an alternative limit, Link (2005) argues that a suitable warning threshold for all catch species within a given ecosystem would be 5% of annual catch to NPP (in comparable units, wet weight or carbon). Recent communication with the author suggests this threshold has since been found to be erroneously high (Link, pers comm.). Notwithstanding questions about the appropriate threshold, the metric itself may prove to be useful in future, as it avoids the uncertainty in the trophic level and efficiency estimates for a system. However, further research is required to develop meaningful thresholds for a range of different ecosystems. A calculation of harvested

NOVEMBER 2011 REPORT NO. 2044 | CAWTHRON INSTITUTE
12
carbon to carbon produced is included here but not used as an assessment parameter.
3.3.3. The framework approach of Tudela et al. (2005).
The comparison of harvested carbon to carbon produced is a relatively simplistic ratio, as it does not explicitly account for differences in the trophic levels and efficiencies of fisheries from different ecosystems. In order to study these effects, detailed food web studies have been undertaken to assess a broader definition of sustainability incorporating other properties of the ecosystem (e.g. Bradford-Grieve et al. 2003; Jiang & Gibbs 2005). These food web studies can be time consuming and expensive to undertake, so there have been other recent studies (e.g. Tudela et al. 2005; Librlato et al. 2008) undertaken to provide more accessible management frameworks for assessing ecological sustainability. These frameworks use simple metrics designed to account for some of the ecological differences in different ecosystems assuming simplified food web structures. A sustainability assessment framework was developed by World Wildlife Fund staff and other scientists (Tudela et al. 2005), which assessed 49 ecosystem models that had previously been classified as ‘overfished’ or ‘sustainably fished’ (Murawski 2000) in relation to a two-dimensional index incorporating the FPI and mean trophic level of harvested species (TLc). By including the mean trophic level in the framework, Tudela et al. (2005) argue the differences in trophic levels in different fisheries can be used to provide a more standardised assessment of sustainability than just FPI (or PPR% in their terminology). The work of Tudela et al. (2005) yielded some simple relationships for estimating threshold FPI% values for a given probability of sustainable fishing based on the mean trophic level for a fished ecosystem. Examples of these relationships for target 70% and 90% probabilities of sustainable fishing (Psust) are:
8543.6%70 0017.0% cTLFPI ⋅= (3)
2825.6%90 0015.0% cTLFPI ⋅= (4)
Where the mean trophic level (TLc) of the whole fishery is defined based on each species (s) wet weight catch (WWC) and trophic level (TL) as:
∑∑
=
=⋅
= m
s s
m
s ssc
WWC
TLWWCTL
1
1 (5)

CAWTHRON INSTITUTE | REPORT NO. 2044 NOVEMBER 2011
13
If the calculated ecosystem FPI (as a percentage) for all fisheries was less than a FPI calculated for a given mean trophic level based on Equations (3) and (4) then the ecosystem is deemed to be sustainably fished (to a given probability) within this framework. This is represented in the diagram below (Figure 6).
Mean trophic level
Overfished
Sustainably fished
FPI (%)
FPI curve
Figure 6. Framework developed by Tudela et al. (2005) showing an example ‘threshold’ FPI curve for a given Psust. The further the calculated FPI is above the threshold the more likely it is overfished.
3.3.4. A loss of secondary production approach
The idea of comparing ecosystem indices to classified ecosystems was further extended by Libralato et al. (2008) using a previously developed metric with a theoretical food web basis. The metric was developed to estimate the loss in secondary production (L) due to fishing assuming a simple linear food chain exists (Libralato et al. 2005). Loss in production is calculated by assuming any biomass removed from low trophic levels has the potential to create a loss in production further up the food chain. This can be calculated two ways: by calculating the loss for each species harvested and summing across all (m) species (equation 6) or, approximated using the FPI, mean trophic level of fisheries catch (TLc) and trophic efficiency (TE) of the system (equation 7).
∑=
−⋅⋅⋅
−=
m
s
TLss TEPPR
TENPPL
1
1 )()ln(
100 (6)
)ln(%
1
TETEFPIL
TLc−
−≅ (7)

NOVEMBER 2011 REPORT NO. 2044 | CAWTHRON INSTITUTE
14
There have been corrections made here to equations 6 and 7, due to an error noted by the author (Libralato, pers comm.). A comparison of this index across 51 food web models led to a relationship between the loss index (L) and the probability of the ecosystem being sustainably fished (Psust) which is used in this study (Figure 7). The raw data used to generate the relationship in Figure 7 is available in Appendix 4.
0
0.1
0.2
0.3
0.4
0.5
0.6
0.7
0.8
0.9
1
0.00 0.02 0.04 0.06 0.08 0.10 0.12 0.14 0.16 0.18 0.20
L index
Psus
t
-sd+sdLindexmodels value
Figure 7. Relationship between the estimate of the secondary production loss index (L) and the probability that an ecosystem is sustainably fished (Psust) based on a study of 51 ecosystems (L index values marked with ‘o’) classified as overfished or sustainably fished (Libralato et al. 2008). Light grey lines represent uncertainty (+/- 1 standard deviation) in Lindex classification to assessed P relationship. sust
In both frameworks presented here (Tudela et al. 2005; Libralato et al. 2008), ecosystem metrics are used to estimate Psust based on a reasonably large sample of classified ecosystem studies. In these frameworks an ecosystem was classified as ‘unsustainable’ if at least one symptom of overexploitation was observed (Murawski 2000). Both studies noted that their frameworks did misclassify a small number of ecosystems. Consequently, although these frameworks offer a relatively simple way of estimating the likelihood of an ecosystem being sustainably fished, the results need to be interpreted with caution and cannot replace more detailed analyses. Additionally, both framework methods are designed to be applied to all fisheries operating in an ecosystem rather than the subset of species that is presented in this study. Given the species analysed here represent over 80% of the aggregated FPI for

CAWTHRON INSTITUTE | REPORT NO. 2044 NOVEMBER 2011
15
New Zealand (e.g. hoki alone represented 51% of the whole fishery FPI in 2006; Knight & Jiang 2009) it seemed appropriate to show the results for the deepwater species studies separately. In calculating L we use the approximation shown in Equation 7. The approximation, rather than the pure L index, was used because Libralato et al. (2008) calculated the relationships seen in Figure 7 using this method. The conversion of the L index to a probability is undertaken by linearly interpolating between the 51 studies shown in Figure 7. As the L index is non-linear and cumulative, we also estimated the L index for the entire fishery so we could see the contribution of the deepwater fishery to the whole fishery performance. This was undertaken by calculating a mean trophic level for all 88 commercially fished species and assuming all species inhabited the same area as the combined NABIS range of all the deepwater species (Figure 4). Commercial catch for shellfish species with trophic levels less than 2.5 (five shellfish species) were excluded from the total fishery FPI analysis and mean trophic level calculations. Shellfish were excluded due to unresolved issues with Psust being overestimated when these species are included in the analysis (Libralato, pers. comm.). New Zealand’s shellfish industry may have an influence on a whole-of-fishery estimate of Psust, for example over 90,000 tonnes of GreenshellTM mussels are harvested annually. This is a large amount given the total fishery harvests are ~400,000 tonnes. Given this species has a low trophic level (2.5; Jiang and Gibbs, 2005), the primary production required to support this harvest is comparatively low and would not have a large effect on the FPI calculations made in this study (increase of ~0.05% assuming the same WTC ratio as fish). Further research may be required on the L-index to enable these species to be included in an assessment. Additionally, no allowance has been made for recreational harvest or bycatch in the overall fishery harvests in this analysis. Addition of these catches to the analysis would potentially increase the L index value (and decrease the probability of sustainable fishing)..
4. RESULTS AND DISCUSSION
A number of different tasks were undertaken to assess the fishery, beginning with aggregation of fisheries catch data (Appendix 2; Table 2). In the 2006/2007 fishing year, the eight deepwater species analysed for this study represented about 64% of the total wet weight fisheries catch2. After aggregating the catch data by fishing year we calculated the NPP produced in the full NABIS species ranges for each fishing year (Appendix 2; Table 2). The total net carbon produced (NPP) in one year over the entire merged NABIS region (e.g. Figure 3) was estimated to be about 300 megatonnes/year (MT/yr). This
2 Note that the comparison of wet weight catch makes no allowance for the trophic level of the fishery.
NOVEMBER 2011 REPORT NO. 2044 | CAWTHRON INSTITUTE
16
is just under half of the carbon production estimate of 650 MT/yr estimated by Knight & Jiang (2009) for the entire EEZ region. For all commercially fished species in New Zealand, the ratio was no more than 0.016% over the period 2002 to 2007 (Table 2). A comparison of wet weight for the eight deepwater species to NPP for the same period showed that the ratio declined from 0.011% to 0.008% (Table 2).
Table 2. Ratio of wet weight catch (WWC) carbon to net primary production carbon (NPP, in carbon units), for deepwater (DW) and total fish catch. The contribution of DW WWC to the total fishery WWC (DW portion) is also shown
Fishing Year (Start year)1
Ratio 2002 2003 2004 2005 2006 2007 20082
DW WWC/NPP 0.011% 0.010% 0.010% 0.009% 0.009% 0.008% 0.008% All WWC/NPP 0.016% 0.015% 0.015% 0.014% 0.013% - DW portion 68% 67% 67% 63% 64% -
1 Fishing year bridges two years from 1 October in the start year to 30 September in the following year 2 Catch data for all species was not available for the 2008/2009 fishing year.
A calculation of the primary production required to support current fisheries (Appendix 2; Table 2) shows the PPR for the deepwater species analysed in this study has decreased from 25.1 MT/yr (in 2002) to 15.6 MT/yr of carbon for the last two years analysed (2007 and 2008 fishing years). When compared to the entire fishery, the deepwater fisheries accounted for about 64% of the carbon required to support all of the New Zealand fisheries in the 2006/2007 fishing year (see ‘DW FPI contribution’, Table 5). The PPR and NPP data were then combined with other ecosystem metrics to estimate the ecological sustainability indices, FPI (Table 3), FPI thresholds (Table 4) and the L index (Table 5) for the deepwater and all commercial New Zealand species using the methods described. Fishing pressure index (FPI = PPR/NPP) analysis (Table 3) shows that hoki requires the largest proportion of NPP to support the yearly harvest, although the amount has fallen considerably, from 7.47% (2002/2003) to 3.58% (for 2008/2009 fishing year) due to a large reduction in the TACC for this species. The FPI estimates for hoki are very similar to those derived by Knight & Jiang (2009), despite the higher trophic efficiency estimate (14% versus 10%) and the reduced NPP estimate (due to a restricted NABIS range) used in this study. Hoki PPR represented approximately 50% of the whole fishery PPR (and FPI) in the 2008 fishing year (see Appendix 2, Table 2), a similar amount to that calculated by Knight & Jiang (2009). The analysis for southern blue whiting (SBW) yielded an FPI estimate of about 2% which suggests that catches for that species may have a greater impact than was

CAWTHRON INSTITUTE | REPORT NO. 2044 NOVEMBER 2011
17
previously estimated by Knight & Jiang (2009). This result is primarily due to the limited, low productivity region delimited by the NABIS range used in this study (see Appendix 1 for the region used). NPP estimated was only about 50 MT/yr compared to the 600 MT/yr estimate for the EEZ that was used in Knight & Jiang (2009). The FPI for this species was still considerably less than hoki for the 2008-2009 fishing year, despite this increased fishing pressure estimate. The total FPI for all deepwater species is about 5.4% for the 2008-2009 fishing year which was based on a comparison to NPP from the merged deepwater NABIS region (Figure 4). If this same region is required to support all of New Zealand’s commercially fished species, and assuming the trophic efficiency is 14%, the total FPI for all New Zealand fisheries was estimated at 7.1% for the 2006-2007 year (‘All FPI’ – Table 5). Throughout the periods available for comparison the eight deepwater species analysed for this study have represented proportionally less of the total FPI over time, from 85% in 2003/2004 to 80% in 2006-2007 (see ‘DW FPI Contribution’ Table 5) mainly because of a reduced hoki TACC. The ecological sustainability of the eight deepwater fisheries was assessed by comparing the fishery FPIs for each year to the FPI thresholds developed by Tudela et al. (2005). The FPI value for all deepwater species (Table 3) was 5.14% in 2008-2009 and is considerably lower than the 90% probability FPI threshold of 20.45% estimated by this method (Table 4). This means that in the hypothetical situation where the deepwater fisheries were the only fisheries operating in this region, the probability they would be classified as being sustainably fished would be greater than 90%.
Table 3. Fishing pressure index (expressed as a percentage) calculated for each fishing year based on the ratio of PPR to NPP.
FPI (%) Fishing Year (Start year) Species 2002 2003 2004 2005 2006 2007 2008 HAK 1.81% 2.16% 2.17% 1.59% 1.66% 0.92% 1.64% HOK 7.47% 5.24% 4.16% 4.16% 3.84% 3.55% 3.58% JMA 0.46% 0.45% 0.62% 0.56% 0.50% 0.63% 0.53% LIN 1.36% 1.32% 1.26% 1.02% 1.13% 1.23% 0.95% ORH 0.81% 0.71% 0.81% 0.84% 0.71% 0.70% 0.61% SBW 1.31% 1.01% 1.43% 1.17% 1.17% 1.42% 1.99% SCI 0.01% 0.01% 0.01% 0.01% 0.01% 0.01% 0.01% SQU 0.25% 0.47% 0.46% 0.39% 0.39% 0.32% 0.27% All DW Species 8.57% 7.23% 6.54% 5.88% 5.69% 5.06% 5.41%

NOVEMBER 2011 REPORT NO. 2044 | CAWTHRON INSTITUTE
18
The FPI framework has been developed to assess the sustainability of entire ecosystems by including all fisheries in a given region. The eight deepwater species analysed here are only a fraction of all species caught commercially and represent less than a quarter of the wet weight catch in the EEZ; therefore the sustainability of the deepwater species analysed can also be assessed by its contribution to pressures of the whole fishery. For all fisheries the FPI is estimated at 7.10% for the 2006-2007 year which is also lower than the 90% probability FPI threshold value of 7.88% (Table 4). Based on this metric, it appears New Zealand’s fisheries have a probability greater than 90% of being classified as sustainably fished according to the framework devised by Tudela et al.(2005) which has analysed 49 ecosystems. The additional catch pressures of the deepwater species contribute to a reduced probability of the ecosystem being assessed as sustainable. Although this cannot be established precisely, as the deepwater species generally have relatively high mean trophic levels (SQU and SCI excluded), their contribution will be less than the FPI contribution (80% in 2006/2007; Table 5).
Table 4. Fishing pressure index (FPI) thresholds calculated for 50%, 70% and 90% probability of sustainable fishing (Psust) based on mean trophic level estimates for the deepwater (DW) and all commercial fisheries as described by Tudela et al. (2005).
Fishing Year (Start year)
Fishery FPI threshold (%) for given Psust
2002 2003 2004 2005 2006 2007 20081
50% 94.55 98.28 97.90 92.87 95.50 85.32 94.6370% 55.07 57.25 57.03 54.10 55.63 49.68 55.12DW
90% 20.43 21.17 21.10 20.10 20.62 18.59 20.4550% 43.36 36.56 34.11 33.52 33.52 - - 70% 25.20 21.24 19.82 19.47 19.47 - - All
90% 9.98 8.53 8.01 7.88 7.88 - - 1 Catch data for all species were not available for the 2008/2009 fishing year at the time of writing.
The L index has been developed to improve the generality of the framework developed by Tudela et al. (2005) and includes trophic efficiency as well as FPI and mean trophic level in the assessment. As with the Tudela et al. (2005) assessment, the framework has been developed to assess whole ecosystems rather than a subset of fisheries. Nevertheless, it is still informative to estimate the probability of the fishery being sustainable if only the eight deepwater species were harvested. For all years analysed (2002 to 2008), the L index for the deepwater species only was calculated at between 0.00405 and 0.00273 (‘DW L index’ Table 5). Based on the assessment of the 51 ecosystem studies by Libralato et al. (2008; Figure 7) and under the hypothetical scenario that these were the only fish harvested from the ecosystem,

CAWTHRON INSTITUTE | REPORT NO. 2044 NOVEMBER 2011
19
this equates to a probability of 97% that the ecosystem would be classified being ‘sustainably fished’, The merged NABIS area does include other fisheries, so an assessment of the entire fishery was also undertaken to establish the contribution from the deepwater species. The L index for the entire New Zealand fishery showed some variations, with a reduction in the index seen for the 2003 and 2004 fishing years (‘All L index’ Table 5). The conversion of L index values to an estimate of the probability of sustainability for the fishery showed values of between 90.9% and 99.4% over the years analysed (‘All Psust’ Table 5). In both the frameworks presented here, the probability of a fishery being ‘sustainably fished’ is attempting to estimate the probability that the fishery does not significantly affect the wider marine ecosystem. Because the L index is calculated based on the accumulated estimates of secondary production loss, it is relatively straightforward to calculate the contribution of the deepwater fish species to the overall fishery sustainability estimate. This information is presented as the ‘DW L index contribution’ (Table 5) and decreases from 32% to 23% over the period 2003 to 2007.
Table 5. Summary of sustainability indices for eight deepwater species (DW) analysed and all New Zealand commercially fished species (All).
Fishing Year (Start year) Summary Statistic
2002 2003 2004 2005 2006 2007 20083
DW FPI 8.57% 7.23% 6.54% 5.88% 5.69% 5.06% 5.41% All FPI1 10.10% 8.76% 8.05% 7.35% 7.09% DW FPI Contribution 85% 83% 81% 80% 80%
DW TLmean 4.55 4.58 4.57 4.54 4.56 4.48 4.55 All TLmean 4.06 3.96 3.92 3.91 3.91 DW L index2
0.00405 0.00325 0.00295 0.00285 0.00266 0.00273 0.00255DW Psust 96.9% 97.3% 97.4% 97.4% 97.5% 97.5% 97.6% All L index 2 0.0125 0.0132 0.0132 0.0122 0.0118 All Psust 90.9% 90.4% 90.4% 91.1% 91.4% DW L index Contribution 32% 25% 22% 23% 23%
1 Fishing Pressure Index (FPI) for all species is calculated assuming all species are contained within the merged NABIS region for the DW species. 2 Loss in secondary production (L) index is approximated using the mean trophic level (TL) calculation as described in the methods section. 3 Catch data for all species was not available for the 2008/2009 fishing year at the time of writing.

NOVEMBER 2011 REPORT NO. 2044 | CAWTHRON INSTITUTE
20
Although we have used the mean trophic level to estimate the L index, it is also possible to calculate the L index from the sum of the individual losses (see Equation 6). This has been undertaken for the eight deepwater species in order to calculate the individual contribution of each fishery catch to the deepwater L index (Appendix 2, Table 4). Figure 8 shows the contribution for the 2008-2009 fishing year, with hoki having the largest contribution to the L index at 35.7%.
HAK3.9%
HOK35.7%
ORH4.5%
SCI0.2%
JMA16.4%
LIN4.9%
SBW15.9%
SQU18.5%
Figure 8. Contribution of individual catch towards the loss in secondary production (L) index for the eight deepwater species analysed in the 2008-2009 fishing year.

CAWTHRON INSTITUTE | REPORT NO. 2044 NOVEMBER 2011
21
5. CONCLUSIONS
This study updates and provides improved estimates of the proportion of primary resources required to support eight of New Zealand’s deepwater species, building on initial research undertaken by Knight & Jiang (2009). On revisiting the analysis, two key features were identified as requiring adjustment: 1. The primary production required to support catch over a relevant biological region
rather than the exclusive economic zone (EEZ), and; 2. The assumptions of the parameterisation of the trophic efficiency (TE) for
temperate/shelf sea ecosystems, which appeared to be excessively conservative. Using species-specific ranges defined by NABIS areas and a higher trophic efficiency of 14%, a number of new analyses have been undertaken in this study. Critical to these analyses is the fishing pressure index (FPI) and mean trophic level for each year. Despite the changes applied, the estimated FPI for the deepwater species was similar to the previous analyses undertaken by Knight & Jiang (2009), with the total net primary production (NPP) required to support the deepwater fisheries about 5.4% per year. Very few changes were noted for individual species compared to results from the previous assessment, except that the FPI value for southern blue whiting (SBW) was notably higher, but still less than 2% across all years. A review of the literature to assess the energetic sustainability of subset of fish harvests from an ecosystem yielded no frameworks for assessing the sustainability of an individual fishery. Of the four approaches described in Section 3 of this report, two were deemed relevant for assessing New Zealand’s fisheries against other fisheries: 1. A comparison of mean catch trophic level and FPI to FPI thresholds developed by
Tudela et al. (2005). 2. A comparison of a secondary production loss (L) index to a ‘probability of
sustainable fishing’ estimate from analysis of 51 classified ecosystems (Libralato et al. 2008).
The approaches outlined above were designed to assess the effects of all fishing, rather than a subset of species in an ecosystem. Although the deepwater species were analysed assuming these were the only species harvested from the ecosystem, their relative contribution to the entire fishery is more relevant. Assessed in this way the following results were recorded: 1. Estimation of the FPI-TLC thresholds for New Zealand fisheries showed that New
Zealand had a greater than 90% chance of being classified as sustainably fished

NOVEMBER 2011 REPORT NO. 2044 | CAWTHRON INSTITUTE
22
(Tudela et al. 2005). Deepwater catch contributed up to 85% of the estimated total FPI, but there was a decreasing trend seen in the series so that in the 2006/2007 fishing year the contribution was about 80% (Table 5).
2. Calculation of the L index (Libralato et al. 2008) suggests New Zealand fisheries as a whole have approximately 91% probability of being classified as sustainably fished (Psust) in 2006-2007. There was an associated increasing trend in the probability of the fishery as a whole being classified as sustainably fished through the period 2003 to 2007 (Table 5), which indicates that pressures on New Zealand’s fisheries are decreasing.
3. The contribution of the deepwater fisheries to the L index was a maximum of 32% (2003-2004) and showed a decreasing trend. This shows that deepwater fisheries are probably having less proportional impact on the overall sustainability of New Zealand’s fisheries, compared to previous years.
On the basis of these indices in 2007-2008 the New Zealand commercial fishery as a whole would have been rated as ‘very likely’ (>90% probability) to have been sustainably fished within the framework proposed by Tudela et al. (2005) and the L index framework (Libralato et al. 2008). There is no evidence in the FPI results (Table 3) for the eight deepwater species to suggest that ‘mining’ of fish biomass relative to energetic constraints is occurring (that is, fish carbon is removed quicker than it is fixed by phytoplankton).That is not to say there is no impact from these deepwater fisheries. Taking the Psust fishing indices to represent the energetic impacts of fish harvest on the food web, the deepwater fisheries represent between 23% and 80% of the accumulated food web effects, and showed a declining trend over the period studied. The eight deepwater species represent a relatively high proportion by weight of annual catch and contribution to total PPR for New Zealand’s fisheries but, as assessed using the frameworks of Tudela et al. (2005) and Libralato et al. (2008), represent a proportionately lower impact on the overall sustainability of the fishery. This is because these frameworks are based on empirical evidence that, for a given FPI, fisheries with lower mean trophic levels have a lower probability of being assessed as sustainable. This approach has some merit when considering the effects up the food chain from harvesting low trophic levels species. With either of these frameworks (Tudela et al. 2005; Libralato et al. 2008), the direction of causality between the indicator indices (i.e. L index, FPI, TLc) and sustainability of current fishing is not clear. The indices may simply reflect historical fishing and hence be a way of standardising the mean trophic level of different fisheries to detect ‘fishing down the food web’ (Pauly et al. 1998, 2001), e.g. a fishery in which FPI remains constant but mean trophic level decreases. Nevertheless these frameworks offer simple methods for rating a fishery’s performance (past or present)

CAWTHRON INSTITUTE | REPORT NO. 2044 NOVEMBER 2011
23
where specific trophic linkages are not well known. Thus they offer potentially useful tools for assessing the sustainability of multispecies fisheries at a high level. The L index is not able to determine whether a system is sustainably fished, only its likelihood as inferred from assessments of other fisheries. When we consider the ranking of the NZ fisheries relative to the other classified ecosystems, we see that the NZ L index for the 2006/2007 fishing year ranks it as 11th lowest L index (highest Psust) result out of 52 ecosystems assessed (Appendix 4). However, Appendix 4 also shows that the ecosystem with the 5th lowest L index (Southern Brazil, 1990-1994) was not classified as ‘sustainably fished’. This result illustrates that although the L index metric is informative, it is not a perfect indicator and needs to be considered within a wider suite of analyses. Although primary production can limit fisheries, clearly other processes are also important; in the case of New Zealand’s hoki fishery, year class strength alone can vary by over 1000% between years (e.g. Bull & Livingston 2001), thereby having a large impact on fish production. Without the correct management responses to observed declines in stocks, the real probability of overfishing is likely to be higher than predicted by the frameworks used in this study. In fact, strict optimisation of fisheries catches to the sustainability indices could lead to short-term overfishing. Hence these frameworks should be used as a high-level guide for monitoring possible cumulative effects of multiple fisheries rather than setting catch limits at a species specific level. These frameworks do potentially offer a way of estimating the point at which an ecosystem may start to be impacted by cumulative pressures from changes to catches from individually managed commercial stocks and other activities (e.g. recreational harvests, aquaculture etc.). We have assessed the sustainability of New Zealand’s deepwater fisheries within these frameworks, but we recognise that they cannot replace a full food web assessment. On the basis of the results of this study, the deepwater fisheries appear to be sustainable given that in recent years only about 5% of the carbon produced within the habitats of deepwater species annually is required to support their harvests. The deepwater fisheries also contribute to the cumulative energetic pressures on the wider ecosystem from all fisheries, which require an estimated 7% of the carbon produced annually. Based on the metrics and frameworks used in this study, the available evidence suggests that the current harvests in NZ fisheries are likely to be sustainable in an ecological sense at a broad-scale. The conclusions of this study rely on deterministic best estimates of parameters (e.g. trophic level for individual species, trophic efficiency and NPP estimates) that in reality are subject to considerable variability and uncertainty. We hope to quantify these underlying uncertainties in future studies.

NOVEMBER 2011 REPORT NO. 2044 | CAWTHRON INSTITUTE
24
Despite these limitations, this study has made some progress in assessing the impacts of NZ fisheries over more realistic spatial scales and within more suitable frameworks than was undertaken in Knight and Jiang (2009). We believe this provides an improved estimate of the energetic resources required to support New Zealand fisheries and its relative ecological impact when compared to other ecosystems.
6. ACKNOWLEDGEMENTS
NZ Ministry of Fisheries staff are thanked for the timely provision of catch data and NABIS regions. Rob Tilney of FishInfo is thanked for his time and assistance in providing references and data. Adam Langley, Chris Cornelisen, Marine Pomarede, David Middleton and Paul Breen are all thanked for their helpful advice and comments during the review process.

CAWTHRON INSTITUTE | REPORT NO. 2044 NOVEMBER 2011
25
7. REFERENCES
Alder J, Cullis-Suzuki S, Karpouzi V, Kaschner K, Mondoux S, Swartz W, Trujillo P, Watson R, Pauly D 2010. Aggregate performance in managing marine ecosystems of 53 maritime countries. Marine Policy 34 (3): 468-476.
Behrenfeld MJ, Falkowski P 1997a. A consumers guide to phytoplankton primary productivity models. Limnology and Oceanography 42(7), 1479-1491.
Behrenfeld MJ, Falkowski P 1997b. Photosynthetic Rates derived from satellite-based chlorophyll concentration. Limnology and Oceanography 42(1), 1-20.
Bull B, Livingston ME 2001. Links between climate variation and year class strength of New Zealand hoki (Macruronus novaezelandiae): An update. New Zealand Journal of Marine and Freshwater Research, 35 (5): 871.
Bradford-Grieve JM, Probert PK, Nodder SD, Thompson D, Hall J, Hanchet S, Boyd P, Zeldis J, Baker AN, Best HA, Broekhuizen N, Childerhouse S, Clark M, Hadfield M, Sarfi K, Wilkinson I 2003. Pilot trophic model for subantarctic water over the Southern Plateau, New Zealand: a low biomass, high transfer efficiency system. Journal of Experimental Marine Biology and Ecology 289:223-262.
Carr ME, Friedrichs MAM, Schmeltz M, Noguchi Aita M, Antoine D, Arrigo KR, Asanuma I, Aumont O, Barber R, Behrenfeld M 2006. A comparison of global estimates of marine primary production from ocean color. Deep Sea Research Part II: Topical Studies in Oceanography 53 (5-7): 741-770.
Charpy-Roubard C, Sournia A 1990. The comparative estimation of phytoplanktonic, microphytobenthic and macrophytobenthic primary production in the oceans. Marine Microbial Food Webs 4(1): 31-57.
Chassot E, Gascuel D, Colomb A 2005. Impact of trophic interactions on production functions and on the ecosystem response to fishing: A simulation approach. Aquatic Living Resources 18 (1): 1-13.
Chassot E, Mélin F, Le Pape O, Gascuel D 2007. Bottom-up control regulates fisheries production at the scale of eco-regions in European seas. Marine Ecology Progress Series 343 (7): 45-55.
Cox SP, Essington TE, Kitchell JF, Martell SJD, Walters CJ, Boggs C, Kaplan I 2002. Reconstructing ecosystem dynamics in the central Pacific Ocean, 1952-1998. II. A preliminary assessment of the trophic impacts of fishing and effects on tuna dynamics. Canadian Journal of Fisheries and Aquatic Sciences 59(11):1736-1747.
Dunn MR, Connell AM, Forman J, Stevens DW, Horn PL 2010. Diet of Two Large Sympatric Teleosts, the Ling (Genypterus blacodes) and Hake (Merluccius australis). PLoS ONE 5 (10): e13647.
FAO 1995. Code of Conduct for Responsible Fisheries, Rome, FAO. 41 p.

NOVEMBER 2011 REPORT NO. 2044 | CAWTHRON INSTITUTE
26
FishBase 2010. Froese R, Pauly D (Eds.). World Wide Web electronic publication. www.fishbase.org, version (06/2010).
Francis MP, Dunn A, Mackay KA, Anderson OF 2002. NABIS marine finfish species distributions. Final Research Report for Ministry of Fisheries Research, Project ZBD2002/20.
Harvey CJ, Cox SP, Essington TE, Hansson S, Kitchell JF 2003. An ecosystem model of food web and fisheries interactions in the Baltic Sea. ICES Journal of Marine Science 60, 939-950.
Heath RA 1985. A review of the physical oceanography of the seas around New Zealand - 1982. New Zealand Journal of Marine and Freshwater Research, 19: 79-124.
Jiang WM, Gibbs MT 2005. Predicting the carrying capacity of bivalve shellfish culture using a steady, linear food web model. Journal of Aquaculture, 244, 171-185.
Knight BR, Jiang WM 2009. Assessing primary production constraints in New Zealand fisheries. Fisheries Research 100 (1): 15-25.
Knight BR, Jiang WM, Sinner J 2010. Sustainability of New Zealand’s Deepwater Fisheries from an Energetics Perspective. Prepared for Deepwater Group Ltd. Cawthron Report No. 1834. 22 p. plus appendices
Libralato S, Coll M, Tudela S, Palomera I, Pranovi F 2005. Quantifying ecosystem overfishing with a new index of fisheries’ impact on marine trophic webs. In ICES-CIEM international council for the exploration of the sea annual science conference. Aberdeen. pp 20–24.
Libralato S, Coll M, Tudela S, Palomera I, Pranovi F 2008. Novel index for quantification of ecosystem effects of fishing as removal of secondary production. Marine Ecology Progress Series 355: 107-129.
Link JS 2005. Translating ecosystem indicators into decision criteria. ICES Journal of Marine Science 62 (3): 569-576.
Morel A 1991. Light and marine photosynthesis: A spectral model with geochemical and climatological implications. Progress in Oceanography 26, 263-306.
Murawski SA 2000. Definitions of overfishing from an ecosystem perspective. ICES Journal of Marine Science 57 (3): 649.
OSU, 2010. MODIS based net primary productivity estimates, covering 1997 – 2007, retrieved electronically from http://www.science.oregonstate.edu/ocean.productivity/index.php (August 2010)
Pauly D, Christensen V 1995. Primary production required to sustain global fisheries. Nature 374, 225-257.

CAWTHRON INSTITUTE | REPORT NO. 2044 NOVEMBER 2011
27
Pauly D, Christensen V, Dalsgaard J, Froese R, Torres F 1998. Fishing down marine food webs. Science, 279: 860 – 863.
Pauly D, Palomares ML, Frose R, SA-A P, Valkily D, Preikshot D, Wallace S 2001. Fishing down Canadian aquatic food webs. Canadian Journal of Fisheris and Aquatic Science 58: 51-62.
Strathmann RR 1967. Estimating the organic carbon content of phytoplankton from cell volume or plasma volume. Limnology and Oceanography 12: 411-418.
Tudela S, Coll M, Palomera I 2005. Developing an operational reference framework for fisheries management on the basis of a two-dimensional index of ecosystem impact. ICES Journal of Marine Science 62 (3): 585.
Ware DM, Thompson RE 2005. Bottom-Up Ecosystem Trophic Dynamics Determine Fish Production in the Northeast Pacific. Science 308: 1280-1284.
Wood LJ, Fish L, Laughren J, Pauly D. 2008 Assessing progress towards global marine protection targets: shortfalls in information and action. Oryx, 42(03):340–51.
Worm B, Hilborn R, Baum JK, Branch TA, Collie JS, Costello C, Fogarty MJ, Fulton EA, Hutchings JA, Jennings S, Jensen OP, Lotze HK, Mace PM, McClanahan TR, Minto C, Palumbi SR, Parma AM, Ricard D, Rosenberg AA, Watson R, Zeller D 2009. Rebuilding Global Fisheries. Science 325 (5940): 578-585.

NOVEMBER 2011 REPORT NO. 2044 | CAWTHRON INSTITUTE
28
8. APPENDICES
Appendix 1. NABIS areas for eight deepwater species (as shown on NABIS website, http://www.nabis.govt.nz). Dark areas represent ‘normal’ range (~90% of abundance), lighter areas represent additional ‘full’ range (100% abundance); the combined light and dark areas within the boundaries of the EEZ (represented by a black line) were used in our assessment.
Hake (HAK) Jack Mackerel (JMA)*
* assumed to be the same as ‘full’ region for Horse Mackerel.
Southern Blue Whiting (SBW) Scampi (SCI)

CAWTHRON INSTITUTE | REPORT NO. 2044 NOVEMBER 2011
29
Orange Roughy (ORH) Hoki (HOK)
Southern Arrow Squid (SQU) Ling (LIN)

NOVEMBER 2011 REPORT NO. 2044 | CAWTHRON INSTITUTE
30
Appendix 2. Aggregated catch, PPR and NPP data for eight deepwater species by fishing year.
Table 1. Aggregated wet weight catch (WWC) data (in tonnes) for all deepwater (DW) fisheries studied.
WWC (Tonnes)
Fishing Year
Species code 2002 2003 2004 2005 2006 2007 2008 HAK 10,176 12,455 12,357 8,911 9,712 5,157 9,167 HOK 176,483 128,297 99,051 98,342 94,725 84,365 84,441 JMA 33,517 34,764 44,783 41,060 37,528 46,249 38,770 LIN 16,977 17,087 15,705 12,715 14,581 15,150 11,576 ORH 14,380 12,737 14,562 14,645 13,032 12,077 10,571 SBW 25,791 21,490 28,839 23,143 24,748 29,526 37,540 SCI 781 728 835 788 766 606 549 SQU 39,202 78,273 74,411 63,746 64,317 52,523 43,630 All DW Species 317,307 305,830 290,542 263,351 259,410 245,653 236,244
All Species 463,223 449,740 432,353 406,269 403,725
Table 2. Derived PPR (MT) for each fishing year estimated based on wet weight catch and individual deepwater (DW) species trophic level (TL) estimates.
PPR(Mega Tonnes) Fishing Year
Species TL 2002 2003 2004 2005 2006 2007 2008 HAK 5.2 3.92 4.80 4.77 3.44 3.75 1.99 3.54 HOK 4.47 16.20 11.78 9.09 9.03 8.70 7.75 7.75 JMA1 3.55 0.50 0.52 0.67 0.61 0.56 0.69 0.58 LIN 4.72 2.55 2.56 2.36 1.91 2.19 2.27 1.74 ORH 4.30 0.95 0.84 0.96 0.96 0.86 0.79 0.69 SBW 3.79 0.62 0.52 0.70 0.56 0.60 0.71 0.91 SCI 3.31 0.01 0.01 0.01 0.01 0.01 0.01 0.01 SQU 3.31 0.37 0.73 0.70 0.60 0.60 0.49 0.41 All DW Species ‐ 25.12 21.77 19.25 17.12 17.26 14.71 15.62
1 JMA trophic level based on a mean of several species.

CAWTHRON INSTITUTE | REPORT NO. 2044 NOVEMBER 2011
31
Table 3. Calculated total NPP (MegaTonnes of Carbon) over each fishing year for the full NABIS range of each deepwater (DW) species based on the mean of vertically generalised production model (VGPM) and VGPMEppley estimates of NPP from MODIS ocean colour data. Note that all species refers to the total production calculated for a combined region based on individual NABIS regions.
Total NPP (MT Carbon) Fishing Year
Species 2002 2003 2004 2005 2006 2007 2008 HAK 217 223 219 216 226 216 215
HOK 217 225 218 217 227 218 216
JMA 109 114 109 110 112 110 109
LIN 187 194 187 186 193 185 183
ORH 117 117 118 115 120 114 114
SBW 48 51 49 48 51 50 45
SCI 70 75 71 70 74 73 69
SQU 150 157 152 153 157 154 151 All DW Species 293 301 294 291 303 291 289
Table 4. Percentage contribution to deepwater species loss in secondary production (L) index by individual DW species.
Contribution to L index (%)
Fishing Year
Species 2002 2003 2004 2005 2006 2007 2008 HAK 3.21% 4.07% 4.25% 3.38% 3.74% 2.10% 3.88% HOK 55.62% 41.95% 34.09% 37.34% 36.52% 34.34% 35.74% JMA 10.56% 11.37% 15.41% 15.59% 14.47% 18.83% 16.41% LIN 5.35% 5.59% 5.41% 4.83% 5.62% 6.17% 4.90% ORH 4.53% 4.16% 5.01% 5.56% 5.02% 4.92% 4.47% SBW 8.13% 7.03% 9.93% 8.79% 9.54% 12.02% 15.89% SCI 0.25% 0.24% 0.29% 0.30% 0.30% 0.25% 0.23% SQU 12.35% 25.59% 25.61% 24.21% 24.79% 21.38% 18.47%

NOVEMBER 2011 REPORT NO. 2044 | CAWTHRON INSTITUTE
32
Appendix 3. Updated trophic level calculations for Ling and Hake.
Ling diet (Dunn et al. 2010)
Common Name Main Species
% weight of stomach contents TL Reference
Squid Graneledone taniwha 3.77% 3.31 Jiang and Gibbs, 2005
Scampi Metanephrops challengeri 7.43% 3.31 Jiang and Gibbs, 2005
Krill Munida gracili; Munida spp. 7.24% 2
Own estimate
Eel (Bassango) Bassanago bulbiceps 3.87% 3.83 FishBase Eel (Diastobranchus) Diastobranchus capensis 3.79% 4.24 FishBase
Rattail Lepidorhynchus denticulatus 15.94% 4.1 FishBase
Hoki Macruronus novaezelandiae 10.76% 4.47 FishBase
Discards- Hoki Macruronus novaezelandiae 4.71% 4.47 FishBase
Discards- JMA 18.29% 3.55 FishBase % of diet used in calculation 75.80% New TL Estimate 4.72 Hake diet (Dunn et al. 2010)
Common Name Main Species
% weight of stomach contents TL Reference
Squid Nototodarus spp.; Todarodes filippovae 5.17% 3.31
Jiang and Gibbs, 2005
Alfonsino Beryx splendens 4.95% 4.38 FishBase
Rattail Lepidorhynchus denticulatus 43.63% 4.1 FishBase
Hoki Macruronus novaezelandiae 36.77% 4.47 FishBase
Squaretail Tetragonurus cuvier; Cubiceps spp. 4.26% 3.78 FishBase
% of diet used in calculation 94.78% New TL Estimate 5.20

CAWTHRON INSTITUTE | REPORT NO. 2044 NOVEMBER 2011
33
Appendix 4. L index data used to derive ‘probability of sustainable fishing’ index, from Libralato (2008).
L index
rank Model TLc PPR%TE (%) L Sustainable?
1 Azores archipelago (1997) 3.77 0.31 10.5 0.0002674 True 2 Lancaster Sound Region (1980s) 4.12 3.29 8.2 0.0005372 True 3 Venice lagoon (1988) 3.26 1.2 7.2 0.0011929 True 4 Gulf of Thailand (1963) 2.99 1.76 5.2 0.001658 True 5 Southern Brazil (1990-1994) 3.77 9.77 6.3 0.0016689 False 6 Prince William Sound, Alaska (1994-96) 4.13 4.46 14.1 0.0049472 True 7 North Sea (1880) 3.77 0.3 27.2 0.0062558 True 8 San Pedro Bay (1994-95) 3.25 3.06 9.4 0.0063318 True 9 Vietnam-China shelf (1980) 3.34 9.73 7.5 0.0087581 True 10 Icelandic fisheries (1950) 3.36 1.91 14.2 0.0097717 True 11 New Zealand (2006) 3.91 7.09 14 0.0118 12 Northern British Columbia (1750) 3.48 4.04 13.3 0.0134506 True 13 Scotian shelf (1980-85) 3.54 8.91 11 0.0148306 True 14 Georgia Strait (1950) 3.25 6.99 9.5 0.0148789 True 15 Norwegian and Barents Sea (1950) 3.59 11.66 10.5 0.0150891 True 16 Newfoundland (1985-87) 3.9 6.33 15.5 0.015235 False 17 N Benguella upwelling (78-83) 2.98 12.39 5.9 0.0161264 False 18 South China Deep Sea (1980s) 3.46 9.96 10.6 0.0177594 True 19 Northern-central Adriatic Sea (1990s) 3.07 6.59 10 0.0243596 False 20 Peru upwelling 50's (1953-59) 2.35 7.99 3.6 0.0270311 True 21 Faroe Islands (1961) 3.85 14.72 14.4 0.0303319 True 22 Peru upwelling (1973-81) 2.67 7.86 6.6 0.0308884 False 23 Brunei Darussalam (1980) 3.2 7.43 12.9 0.0400837 True
24 Northern Gulf of Saint Lawrence (1985-87) 3.57 22.94 12 0.0465264 True
25 Gulf of Thailand (1980s) 3.14 16.12 10.4 0.0561128 False 26 South Catalan Sea (1994-2000) 3.12 9.45 12.6 0.0564856 False 27 Bay of Bengal (1984-86) 2.7 8.28 9 0.0573583 False 28 Northern British Columbia (2000) 3.28 9.77 14.2 0.0584316 False 29 North Sea (1981) 3.39 21.83 11.6 0.0588612 False 30 Northern British Columbia (1950) 3.38 12.28 14.3 0.0616593 False 31 Bay of Revellata, Corsica (1998) 3.77 11.91 18.8 0.0695458 True 32 Venezuela northeastern shelf (1980s) 2.8 20.72 7.3 0.0712062 False 33 Eastern Bering Sea (1980s) 3.29 15.2 13.2 0.0727014 False 34 Boliano reef flat (1991) 2.2 2.75 10.4 0.080356 False 35 West Greenland coast (1997) 3.16 20.18 12.1 0.0997817 False 36 Hong Kong (1990s) 2.96 27.21 9.1 0.1034667 False 37 Northern British Columbia (1900) 3.33 23.26 13.7 0.1139729 True 38 Newfoundland (1995-2000) 3.13 15.11 14.3 0.123376 False 39 Venice lagoon (1998) 2.31 3.6 14.5 0.1485619 False 40 Maputo Bay (1980s) 2.53 20.29 7.6 0.1526893 False 41 Eastern Bering Sea (1950s) 3.35 30.89 14.3 0.1644212 True 42 North Sea (1963) 3.89 62.64 16 0.1712755 False 43 Newfoundland (1900) 3.54 27.2 17.3 0.1799126 True 44 Southwest coast of India (1995) 2.59 10.67 13.5 0.2207124 False 45 Gulf of Lingayen (1990s) 3.32 51.61 13.5 0.2474799 False 46 Southwest coast of India (1996) 2.61 11.66 14 0.2502397 False

NOVEMBER 2011 REPORT NO. 2044 | CAWTHRON INSTITUTE
34
L index rank Model TLc PPR%
TE (%) L Sustainable?
47 Southwest coast of India (1994) 2.61 13.2 13.5 0.262327 False 48 North Sea (1974) 3.89 61.98 19.2 0.3187424 False 49 Gulf of Mexico continental shelf (1990s) 2.6 31.65 9.7 0.3245529 False 50 San Miguel Bay (1992-94) 3 14.75 20.6 0.3961892 False
51 Coast of Western Gulf of Mexico (1990s) 3.44 89.49 16.2 0.5792711 False
52 Cantabrian Sea (1994) 3.76 82.35 38.1 5.9498918 False