Embed Size (px)
Citation preview
Impact of the Deepwater Horizon well blowout onthe economics of US Gulf fisheries
U. Rashid Sumaila, Andrés M. Cisneros-Montemayor, Andrew Dyck, Ling Huang,William Cheung, Jennifer Jacquet, Kristin Kleisner, Vicky Lam,Ashley McCrea-Strub, Wilf Swartz, Reg Watson, Dirk Zeller, and Daniel Pauly
Abstract: Marine oil spills usually harm organisms at two interfaces: near the water surface and on shore. However, becauseof the depth of the April 2010 Deepwater Horizon well blowout, deeper parts of the Gulf of Mexico are likely impacted.We estimate the potential negative economic effects of this blowout and oil spill on commercial and recreational fishing, aswell as mariculture (marine aquaculture) in the US Gulf area, by computing potential losses throughout the fish value chain.We find that the spill could, in the next 7 years, result in (midpoint) present value losses of total revenues, total profits,wages, and economic impact of US$3.7, US$1.9, US$1.2, and US$8.7 billion, respectively. Commercial and recreationalfisheries would likely suffer the most losses, with a respective estimated US$1.6 and US$1.9 billion of total revenue losses,US$0.8 and US$1.1 billion in total profit losses, and US$4.9 and US$3.5 billion of total economic losses.
Résumé : Les déversements de pétrole en mer nuisent généralement aux organismes à deux interfaces, soit près de la sur-face de l'eau et sur la côte. Cependant, à cause de la profondeur à laquelle s'est produite l'éruption de Deepwater Horizonen avril 2010, les zones plus profondes du golfe sont vraisemblablement affectées. Nous estimons les effets économiques né-gatifs potentiels de cette éruption et du déversement de pétrole sur les pêches commerciales et sportives, ainsi que sur la ma-riculture (aquaculture marine) dans la région du golfe aux É.-U., en calculant les pertes potentielles dans l'ensemble de lachaîne de valeur des poissons. Nous trouvons que le déversement pourrait, dans les 7 prochaines années, entraîner des pertesen valeur actuelle (point milieu) de revenus totaux, de profits totaux et de salaires et un impact économique de respective-ment 3,7, 1,9, 1,2 et 8,7 milliards de $US. Les pêches commerciales et sportives subiraient vraisemblablement les pertes lesplus élevées, avec des pertes totales de revenu respectives de 1,6 et 1,9 milliards $US, des pertes de profit total de 0,8 et de1,1 milliards $US et un impact économique total de 4,9 et de 3,5 milliards $US.
[Traduit par la Rédaction]
Introduction
On 20 April 2010, the Deepwater Horizon (DH), an oil rigleased by British Petroleum (BP), exploded in the Gulf ofMexico (GOM) and began leaking oil from the seabed at adepth of over 1500 m. On Monday, 1 August 2010, the USgovernment stated that BP’s ruptured well had gushed an es-timated 4.9 million barrels of oil (780 million L), making itthe largest accidental marine oil spill in US waters (Levyand Gopalakrishnan 2010; Urriza and Duran 2010). In con-trast, the 1989 Exxon Valdez oil spill, a major disaster in UShistory, amounted to less than 0.5 million barrels (80 mil-lion L). Given the likely economic and legal repercussionsof this major pollution event, a rapid first-order estimation of
the likely economic losses due to the oil leaks is required.Here, we present such a preliminary estimate using a top-down approach to set a baseline for future, hopefully moredetailed, comprehensive economic assessments.Besides obvious environmental effects, oil spills can have
extensive socio-economic, psychological, and even culturalimpacts, including effects on marine resource use and liveli-hoods (e.g., fisheries) and public health (Anonymous 1989;1990a; Palinkas et al. 1993). Impacts on marine ecosystemscan persist for extended periods and stem directly from thedestruction of habitats, death and pollution of plants and ani-mals, and changes to food web structure and function. Forexample, the environmental and economic effects of the1989 Exxon Valdez spill in Prince William Sound, Alaska,
Received 24 November 2010. Accepted 7 October 2011. Published at www.nrcresearchpress.com/cjfas on 15 February 2012.J2011-0046
Paper handled by Associate Editor Terrance Quinn III.
U.R. Sumaila, A.M. Cisneros-Montemayor, A. Dyck, L. Huang,* J. Jacquet, K. Kleisner, V. Lam, A. McCrea-Strub, W. Swartz,R. Watson, D. Zeller, and D. Pauly. Fisheries Centre, The University of British Columbia, 2202 Main Mall, Vancouver, BC V6T 1Z4,Canada.W. Cheung.† School of Environmental Sciences, University of East Anglia, Norwich, NR4 7TJ, United Kingdom.
Corresponding author: U. Rashid Sumaila (e-mail: [email protected]).
*Present address: Department of Economics, University of Connecticut, 341 Mansfield Road, Unit 1063, Monteith Room 345, Storrs, CT06269-1063, USA.
†Present address: Fisheries Centre, The University of British Columbia, 2202 Main Mall, Vancouver, BC V6T 1Z4, Canada.
499
Can. J. Fish. Aquat. Sci. 69: 499–510 (2012) doi:10.1139/F2011-171 Published by NRC Research Press
Can
. J. F
ish.
Aqu
at. S
ci. D
ownl
oade
d fr
om w
ww
.nrc
rese
arch
pres
s.co
m b
y 12
1.22
3.13
5.9
on 0
3/28
/12
For
pers
onal
use
onl
y.
were still being felt in the early 2000s (Graham 2003). Theimpacts on marine ecosystems translate into impacts on theeconomy and livelihoods, including commercial fisheries,recreation, mariculture (marine aquaculture), tourism, and en-ergy markets. Fish caught from contaminated areas or neigh-boring locations will raise concerns about food safety. Theseeffects call for actions to mitigate, recover, and prevent theincidence of oil spills, which are costly to society.The coast of the GOM is made up largely of saltwater
marshes, mangroves, wetlands, and estuaries, which are im-portant nursery and foraging areas for many marine species.Within these ecosystems, there are over 15 000 species offauna and flora (Felder and Camp 2009), including whales,turtles, manatees, sharks and other fishes, shrimps, crabs,mollusks, birds, seagrasses, and mangroves. Many of thesespecies are highly valued by commercial and recreationalfisheries, including brown shrimp (Farfantepenaeus aztecus),blue crab (Callinectes sapidus), eastern oyster (Crassostreavirginica), red snapper (Lutjanus campechanus), Gulf menha-den (Brevoortia patronus), and bluefin tuna (Thunnus thyn-nus). Additionally, one of only two existing Atlantic bluefintuna spawning grounds is located in the GOM. Large-scalepollution events, such as the DH spill, can result in impactsthat are both direct (e.g., acute-phase mortality) and indirect(e.g., bioaccumulation through the food web). Indirect effectshave been shown to persist for decades (Graham 2003).Long-term studies on salt marsh habitat following the
Florida barge spill in Wild Harbor, Massachusetts, USA, in1969 demonstrate the persistence and impacts of oil withinsediments (Culbertson et al. 2007, 2008a, 2008b). Buried hy-drocarbons result in the destruction of seagrass root structureand subsequent losses of grass cover and increased erosioneven 40 years later (Culbertson et al. 2008a).Within tropical ecosystems, mangroves are considered to
be among the most susceptible to impacts from oil spills(Shigenaka 2002). Studies of mangrove habitats after the1986 spill of 50 000 barrels from the Galeta near the PanamaCanal demonstrate the influence of sediments acting as long-term reservoirs of oil (Burns et al. 1993). The persistence ofthe oil was unexpected because of relatively warm tropicalwaters, which were thought to increase the rate of breakdownof the hydrocarbons. Short-term effects included dead man-groves along 27 km of coastline even 1½ years after the spill(Jackson et al. 1989) and the deterioration of surviving man-groves up to 6 years after the spill (Burns et al. 1993). Long-term effects were not only apparent in the mangroves them-selves, but also detected in the species found associated withthe root structure (i.e., bivalves).Coral reefs are one of the most diverse marine ecosystems
and host highly complex communities (Haapkyla et al. 2007).Besides obvious lethal effects of oil, sublethal effects such asreduced reproductive efficiency have also been demonstrated(Loya and Rinkevich 1980). Haapkyla et al. (2007) reviewedthe impacts of oil and oil spills on corals and found that cor-als were negatively impacted, leading to decreases in coralcover, growth, reproductive output, and species diversity.Only in two cases were no or only minor effects found, thesebeing the Arabian Gulf field experiment in 1989 (LeGore etal. 1989) and oil spills in the Arabian Gulf related to the GulfWar in 1991 (Downing and Roberts 1993; Price 1998).Unlike the visually obvious and immediate effects on birds
and mammals, the effects of oil on fisheries can be more dif-ficult to detect, though they are no less devastating. Oilspreads through the marine ecosystem and damages coastalareas important as nurseries for juvenile fish and shrimp. Oiland hydrocarbons are taken up by plankton and othersurface-dwelling species that link to aquatic food chains.Thus, oil moves through the food web and accumulates infood fishes, posing serious health concerns for consumers.Almost immediately following the DH spill, the region’s keyshrimp and oyster fishing areas were officially closed. Ac-cording to the US National Marine Fisheries Service, 70% ofthe commercially caught shrimp and oysters in the US comefrom the GOM (National Oceanographic and AtmosphericAdministration 2010).Several studies have examined the effects of oil on fish and
invertebrate species. The Exxon Valdez oil spill in Alaska in1989 had notable effects on important fish species, such asPacific herring (Clupea pallasii) and pink salmon (Onco-rhynchus gorbuscha), including premature hatching, reducedgrowth rates, morphological and genetic abnormalities, andincreased mortality (Bue et al. 1998; Rice et al. 2001). AdultPacific herring showed evidence of liver lesions and in-creased disease due to depressed immune function (Moles etal. 1993; Carls et al. 2001). These effects contributed to in-creased natural mortality in adult Pacific herring over a 5-year period (Thorne and Thomas 2007). Research on bio-markers of hydrocarbon exposure in nine species of pelagicand demersal fish showed that 10 years after the Exxon Val-dez spill, signs of exposure were still present (Jewett et al.2002). Consequences have been shown to be more severe forinvertebrates because of their sessile nature and close associ-ation with contaminated habitats, including declines in abun-dance, growth rate, and condition (Culbertson et al. 2007,2008a). Sediments and intertidal mussel beds (Mytilus trossu-lus) showed evidence of contamination 6 years after the Ex-xon Valdez oil spill and were a source of chroniccontamination for predatory species (Carls et al. 2001).In addition to direct effects on individual species, food
web interactions allow for the propagation of negative im-pacts to higher trophic levels. The impact of the Tsesis oilspill on benthic organisms in the Baltic Sea in 1977 resultedin food chain transfer of oil to flounder (Platichthys flesus;Elmgren et al. 1983).The magnitude and duration of impacts will depend on the
scale of the spill, the type of hydrocarbon, and the character-istics of the marine environment. Benthic and relatively ses-sile organisms (e.g., crabs, clams, mussels, and shrimps)suffer high initial mortalities, displacement, or contamination(becoming unmarketable) of up to 100% (Teal and Howarth1984). Mobile fish species are generally subject to lower ini-tial mortality rates, although those can quickly rise in largespills. For example, the 1979 Ixtoc I blowout, previously thelargest accidental oil spill in history, is estimated to havecaused 50%–70% fish mortality in adjacent coastal regions(Jernelov and Linden 1981).There are many studies that examine the initial impacts of
oil spills on species, yet few consider the time scale for ma-rine organisms to recover from exposure. Recovery time isdependent on the length of exposure, water temperature,oceanographic features of the region, mobility, and ontoge-netic stage of the species, as well as species-specific life his-
500 Can. J. Fish. Aquat. Sci. Vol. 69, 2012
Published by NRC Research Press
Can
. J. F
ish.
Aqu
at. S
ci. D
ownl
oade
d fr
om w
ww
.nrc
rese
arch
pres
s.co
m b
y 12
1.22
3.13
5.9
on 0
3/28
/12
For
pers
onal
use
onl
y.
tory traits (e.g., feeding and reproductive patterns). The abil-ity of critical habitats to act as long-term reservoirs of oil canextend exposure and subsequent recovery times. While habi-tat recolonization can begin within 3 to 6 months, it generallytakes at least 1 year for pollutant concentrations in marine or-ganisms to return to prespill conditions (Teal and Howarth1984). This assumes that the spill has ended and most oilcleaned up, so the minimum duration of impacts can be wellover 1 year. In fact, oil concentrations in sediment, where itis most persistent, have been detected up to 40 years after aspill (Culbertson et al. 2008a). All of these effects depend toa great extent on the type of ecosystem affected. In tropicalsystems like the GOM, impacts can be exacerbated by ahigh proportion of mangroves and marshes, which captureand retain oil for prolonged periods, affecting organisms thatdepend on these habitats for food, reproduction, and shelter(Jackson et al. 1989).There are numerous economic assessments of oil spills,
which can be adapted for the current assessment. Cohen(1995) estimated the social costs (i.e., cost to society as op-posed to private cost to a firm or an individual) of the 1989Exxon Valdez spill for the years 1990 and 1991 by examiningthe revenue difference between actual fisheries catches withand without the spill. García-Negro et al. (2009) studied theeconomic impact of the 2002 Prestige oil spill on the affectedcoastline in Spain, investigating the fisheries landings beforeand after the accident. The McDowe Group used businesssurveys to determine the economic effect of the Exxon Valdezspill on Alaska’s tourism industry (Anonymous 1990b). Astudy by Advanced Resources International provided esti-mates of economic impacts for many oil spill accidents by di-viding spills into three types: tanker, pipeline, and offshoreplatform, and determined the cost for clean-up, oil losses, en-vironmental and resource damage per gallon (1 gallon =3.785 L) of oil spilled to be US$260, US$1.71 andUS$9.91–19.81, respectively (Anonymous 1993). Clean-upcosts and environmental damage from tanker spills are highlyvariable, but can be particularly high if the spill occurs in re-mote and environmentally sensitive areas, as has occurred inthe past. Offshore facilities have a relatively good safety re-cord, so spill effects are more poorly defined. However, largeblowouts close to sensitive coastal areas such as marshland orreefs can lead to substantial ecological and economic dam-ages (e.g., Ixtoc I, 1979; Union Platform A, 1969); the DHblowout is unfortunately one such case.An important consideration in this study is the potential
market recovery times (i.e., the time required for market con-ditions for the affected fish species to return to prespill lev-els) of commercially important species in the GOM. There isa distinct difference between ecological and market recoverytimes. As mentioned above, ecological recovery can take dec-ades, especially for organisms associated with sediments suchas crustaceans and mollusks. Market recovery time, on theother hand, depends on the length of fisheries closures aftera spill, public perceptions of seafood safety, and the degreeof tainting (both visible and with respect to taste and smellof seafood; Moller et al. 1999).The oil industry typically touts the quick recovery of or-
ganisms to an “untainted state” as evidence of the safety ofseafood after an oil spill (e.g., Moller et al. 1999). However,after the Exxon Valdez spill, fisheries for salmon, herring,
crab, shrimp, rockfish, and sablefish were closed, with somecommercial fisheries remaining closed through 1990. Herringand salmon species in the region have never fully recoveredecologically or economically. One of the main reasons forthis is the public perception of contamination from seafood(see http://useconomy.about.com/od/suppl1/p/Exxon_Valdez_Oil_Spill_Economic_Impact.htm).
Materials and methodsThe GOM ecosystem supports considerable commercial
and recreational fisheries, as well as mariculture, all of whichare affected by spilled oil. To provide a broad picture of theeconomic effects of the spill on these three sectors, we esti-mate the potential losses in (i) total revenues; (ii) total profit(payment to capital plus resource rent); (iii) wages (paymentsto labor); (iv) number of jobs; and (v) economic impactthroughout the wider economy. To provide conservative esti-mates of the economic effects of the oil spill, we use esti-mates of market recovery time rather than longer ecologicalrecovery time horizons.Total revenue is the product of ex-vessel price and catch in
the case of commercial fisheries; the total expenditure in thecase of recreational fisheries; and the product of ex-farmprice and production quantity in the case of mariculture. To-tal profit is the sum of normal profit and resource rent. Nor-mal profit (payment to capital) is the opportunity cost of thecapital invested to run fisheries or mariculture. Resource rentis payment to the “owners” of marine resources (i.e., theAmerican people in the case of commercial and recreationalfisheries). Wages (payments to labor) are the amounts earnedby people who expend their labor, skills, and expertise in thesector. The added value or impact through the fish valuechain is the indirect economic effects of fisheries and mari-culture because of their impact on activities such as boatbuilding or maintenance, equipment supply, and the restau-rant sector (Pontecorvo et al. 1980).We assume that each economic indicator is related to land-
ings (L) in the following manner:
ð1Þ total revenue ¼ L � p
ð2Þ normal profit ¼ L � p
ð3Þ wages ¼ L � w
ð4Þ rent ¼ L � p� L � c
ð5Þ impact ¼ L � p �Mwhere p, p, w, and c represent price, profit, wages, and costs,respectively, per tonne. The parameter M represents the eco-nomic impact multiplier for fisheries of the US as estimatedby Dyck and Sumaila (2010).The present value of each indicator i over time t is ex-
pressed as
ð6Þ PVi ¼XTt¼0
dtiXi;t
where Xi,t represents economic indicator i at time t = 0… T,
Sumaila et al. 501
Published by NRC Research Press
Can
. J. F
ish.
Aqu
at. S
ci. D
ownl
oade
d fr
om w
ww
.nrc
rese
arch
pres
s.co
m b
y 12
1.22
3.13
5.9
on 0
3/28
/12
For
pers
onal
use
onl
y.
and the parameter d is the discount factor determined usingthe appropriate rate of discount applicable to the US. The dis-count factor is calculated using a real discount rate of 3.0%.
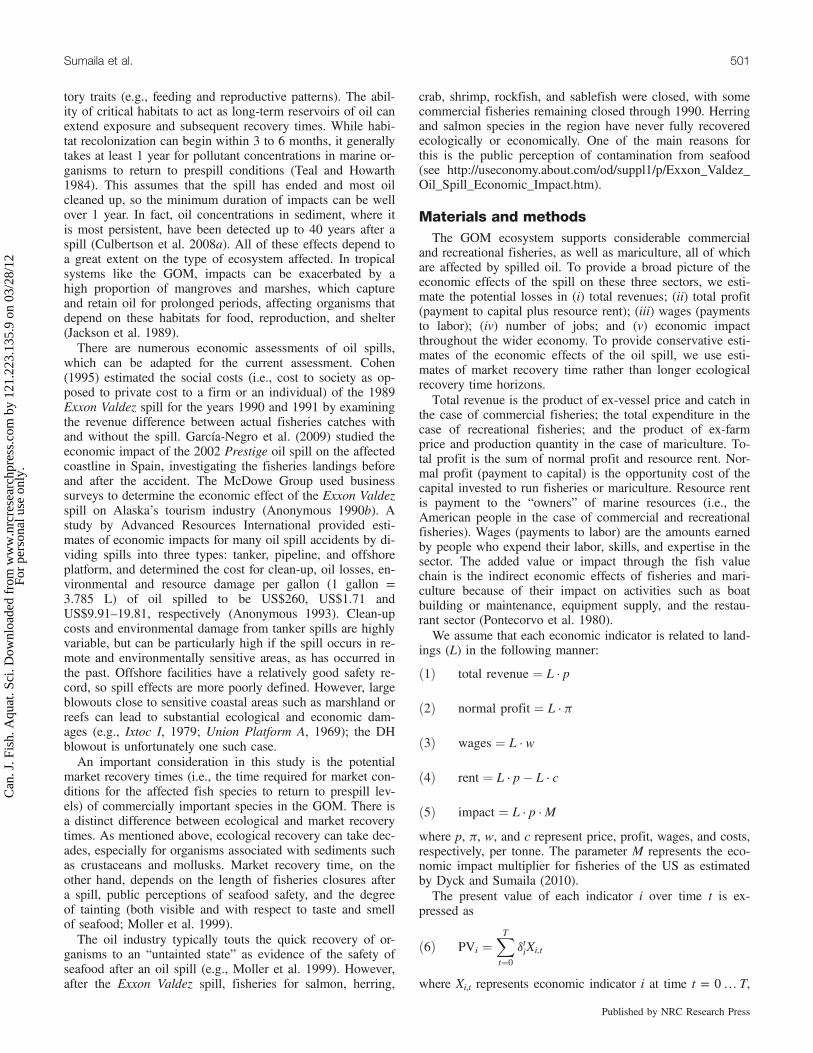
Modeling oil spill impactsWe use the Sea Around Us Project (http://www.seaaroundus.
org) global grid-map system of half degree latitude by halfdegree longitude cells of spatially assigned annual commer-cial catch (Watson et al. 2004) and landed values of catch(http://feru.org; Sumaila et al. 2007) taken by US fisheries inthe US Gulf Exclusive Economic Zone (EEZ). We then over-lay on this landed value map the area of the GOM that wasclosed to fishing at its largest extent (as of 22 July 2010), in-cluding federal and state waters (Fig. 1). Using this combina-tion of spatial data, we calculate the likely proportion oflanded value that is immediately unavailable to the fishingsector. This approach has also been applied in McCrea-Strubet al. (2011).As foreign fishing vessels have been prohibited from oper-
ating within the US EEZ since 1991, fisheries closures arealso assumed only to impact US fisheries. However, theGOM is a dynamic system, and oil and dispersants have not
been confined to the sea surface, with subsurface plumes(50–1200 m) having been documented (Camilli et al. 2010).Most marine organisms, including those mentioned here, ex-hibit daily and seasonal, small- and large-scale migrationsboth laterally and vertically. Marine organisms may be di-rectly impacted by physical contact with contaminants aswell as indirectly affected via the fouling of important nurs-ery and spawning habitats as well as food chain interactions.Therefore, it is unlikely that the effects of the spill will bespatially and temporally restricted to closed area boundariesand closure duration.Estimates of loss in commercial, recreational, and maricul-
ture fisheries are dependent on the combination of initialmortality of fish species due to the oil spill as well as thecontinued economic unmarketability that can result whenconsumers believe marine products from the GOM are lessdesirable because of real or perceived pollutants. In the caseof the Exxon Valdez spill, full market recovery of the tourismand sport fishing sector in Alaska is reported to have oc-curred within 2 years after cleanup (Anonymous 1993); inthe case of the Amoco Cadiz spill in Brittany, tourism activ-ities returned to prespill levels 1 year after cleanup (Grigalu-
Fig. 1. Spatial distribution of the annual average landed value of the total commercial fisheries catch in the US Exclusive Economic Zone inthe Gulf of Mexico (averaged for the 2000–2005 period). The area closed to commercial fishing (as of 22 July 2010) includes both federalwaters and portions of western Florida, Alabama, Mississippi, and Louisiana state waters.
502 Can. J. Fish. Aquat. Sci. Vol. 69, 2012
Published by NRC Research Press
Can
. J. F
ish.
Aqu
at. S
ci. D
ownl
oade
d fr
om w
ww
.nrc
rese
arch
pres
s.co
m b
y 12
1.22
3.13
5.9
on 0
3/28
/12
For
pers
onal
use
onl
y.
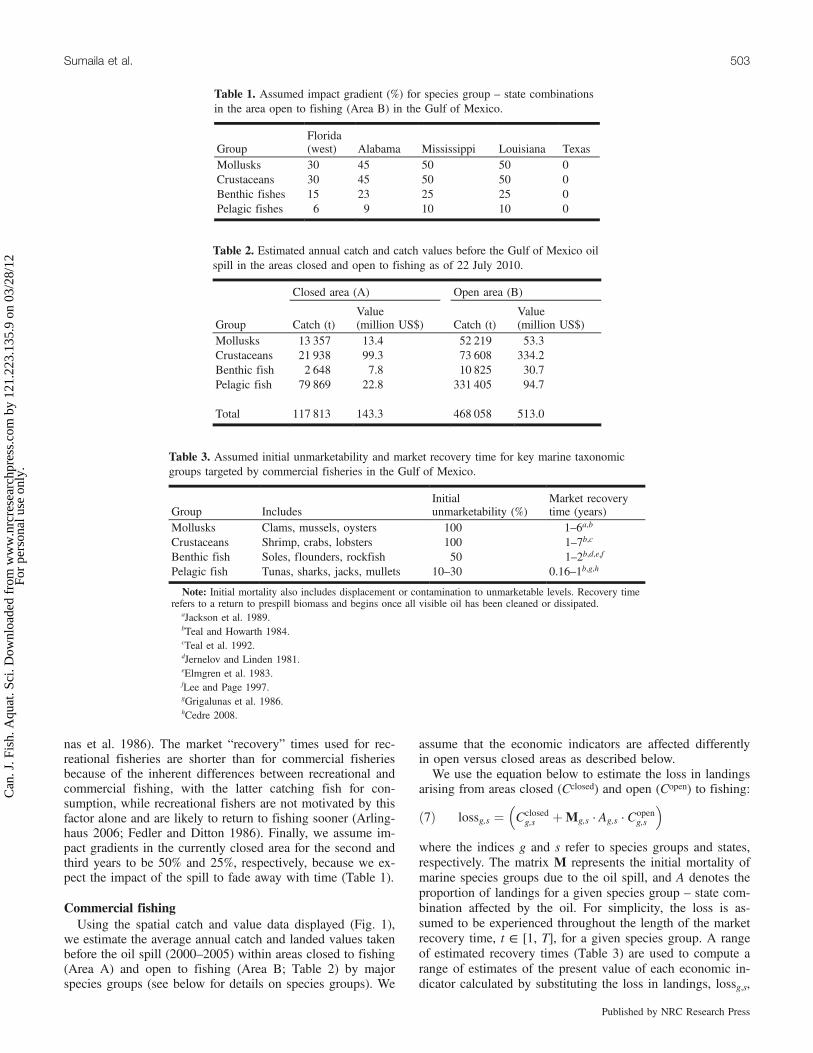
nas et al. 1986). The market “recovery” times used for rec-reational fisheries are shorter than for commercial fisheriesbecause of the inherent differences between recreational andcommercial fishing, with the latter catching fish for con-sumption, while recreational fishers are not motivated by thisfactor alone and are likely to return to fishing sooner (Arling-haus 2006; Fedler and Ditton 1986). Finally, we assume im-pact gradients in the currently closed area for the second andthird years to be 50% and 25%, respectively, because we ex-pect the impact of the spill to fade away with time (Table 1).
Commercial fishingUsing the spatial catch and value data displayed (Fig. 1),
we estimate the average annual catch and landed values takenbefore the oil spill (2000–2005) within areas closed to fishing(Area A) and open to fishing (Area B; Table 2) by majorspecies groups (see below for details on species groups). We
assume that the economic indicators are affected differentlyin open versus closed areas as described below.We use the equation below to estimate the loss in landings
arising from areas closed (Cclosed) and open (Copen) to fishing:
ð7Þ lossg;s ¼ Cclosedg;s þMg;s � Ag;s � Copen
g;s
� �
where the indices g and s refer to species groups and states,respectively. The matrix M represents the initial mortality ofmarine species groups due to the oil spill, and A denotes theproportion of landings for a given species group – state com-bination affected by the oil. For simplicity, the loss is as-sumed to be experienced throughout the length of the marketrecovery time, t ∈ [1, T], for a given species group. A rangeof estimated recovery times (Table 3) are used to compute arange of estimates of the present value of each economic in-dicator calculated by substituting the loss in landings, lossg,s,
Table 1. Assumed impact gradient (%) for species group – state combinationsin the area open to fishing (Area B) in the Gulf of Mexico.
GroupFlorida(west) Alabama Mississippi Louisiana Texas
Mollusks 30 45 50 50 0Crustaceans 30 45 50 50 0Benthic fishes 15 23 25 25 0Pelagic fishes 6 9 10 10 0
Table 2. Estimated annual catch and catch values before the Gulf of Mexico oilspill in the areas closed and open to fishing as of 22 July 2010.
Closed area (A) Open area (B)
Group Catch (t)Value(million US$) Catch (t)
Value(million US$)
Mollusks 13 357 13.4 52 219 53.3Crustaceans 21 938 99.3 73 608 334.2Benthic fish 2 648 7.8 10 825 30.7Pelagic fish 79 869 22.8 331 405 94.7
Total 117 813 143.3 468 058 513.0
Table 3. Assumed initial unmarketability and market recovery time for key marine taxonomicgroups targeted by commercial fisheries in the Gulf of Mexico.
Group IncludesInitialunmarketability (%)
Market recoverytime (years)
Mollusks Clams, mussels, oysters 100 1–6a,bCrustaceans Shrimp, crabs, lobsters 100 1–7b,cBenthic fish Soles, flounders, rockfish 50 1–2b,d,e,fPelagic fish Tunas, sharks, jacks, mullets 10–30 0.16–1b,g,h
Note: Initial mortality also includes displacement or contamination to unmarketable levels. Recovery timerefers to a return to prespill biomass and begins once all visible oil has been cleaned or dissipated.
aJackson et al. 1989.bTeal and Howarth 1984.cTeal et al. 1992.dJernelov and Linden 1981.eElmgren et al. 1983.fLee and Page 1997.gGrigalunas et al. 1986.hCedre 2008.
Sumaila et al. 503
Published by NRC Research Press
Can
. J. F
ish.
Aqu
at. S
ci. D
ownl
oade
d fr
om w
ww
.nrc
rese
arch
pres
s.co
m b
y 12
1.22
3.13
5.9
on 0
3/28
/12
For
pers
onal
use
onl
y.
into eqs. 1–5, summing across species groups and states, andusing eq. 6 to compute the present value of economic effects.Employment data for commercial fisheries in the Gulf are
from National Marine Fisheries Service (2010). We collectdirect, indirect, and induced employment data by state. Byconsidering indirect and induced employment, we includejobs that are supported by marine fisheries throughout the re-gion’s economy. We estimate potential employment loss byassuming that a reduction in the value of marine landingswill be followed by a proportional change in the number ofworkers employed.
Recreational fisheriesTo estimate the economic indicators for recreational fish-
eries, we rely on surveys undertaken by the US Fish andWildlife Service (Anonymous 2006b), which reports thenumber of recreational fishers (resident and nonresident) bystate, as well as the expenditures by anglers. Under the as-sumption that the percentage of resident anglers has remainedconstant since 2006, we calculate the total number of residentanglers based on 2009 population projections (http://www.census.gov). We use the ratio of resident to nonresident an-glers to estimate the total number of anglers per state andthe total number of fishing trips. With regard to Florida’swest coast, we use the proportion of recreational fishing thattakes place along the west coast (Steinback et al. 2004).To estimate the total expenditure (or total revenues gener-
ated by the sector) and the economic impact, we use reportedexpenditures (Steinback et al. 2004) converted to 2010 dol-lars based on the US consumer price index (http://www.bls.gov/CPI). These expenditures include payments for fishing-related items (gear, tackle, etc.) and travel costs to the fishinglocations, including private, guided, and charter fishing trips.We exclude expenditure on durable items (i.e., secondhomes), assuming that these will not be substantially af-fected. We make the strong assumption that recreational fish-ing will continue in the area open to fishing (Area B) at theprespill level. For the closed area (Area A), first year eco-nomic effects of the spill are based on the spatial extent ofthe fishing closures (Fig. 1). The resource rent and profitshare of total revenue is estimated by summarizing the litera-ture on the topic (Carter 2003; Marshall and Lucy 1981; Ga-leano et al. 2004).Losses due to the oil spill are then calculated using the fol-
lowing equation:
ð8Þ losss;t ¼ 1� Pclosedt
� �Xs
where losss,t is the change in an economic indicator, Xs, forstate s at time t. The parameter Pclosed
t represents the percen-
tage of waters in the GOM closed to fishing at time t. At thetime of writing, 24% of American waters in the GOM areclosed to recreational fishing. We assume that the percentageof waters unavailable to recreational fisheries will decrease tozero after 3 years, with their share in the second and thirdyears being 12% and 6%, respectively. Present values of lossfor each of the economic indicators (except for employment)are estimated using eq. 6.The economic impact of changes in total revenue due to
the oil spill is estimated using eq. 9 (see Appendix A formore on impact multipliers):
ð9Þ impact ¼X
sPVs �Ms
where PVs is the present value of total revenue in a givenstate s, and Ms is the state-specific economic multiplier as re-ported by Steinback et al. (2004). Employment is calculatedbased on information from Steinback et al. (2004), and it isassumed to change in proportion to changes in losses asso-ciated with the oil spill.
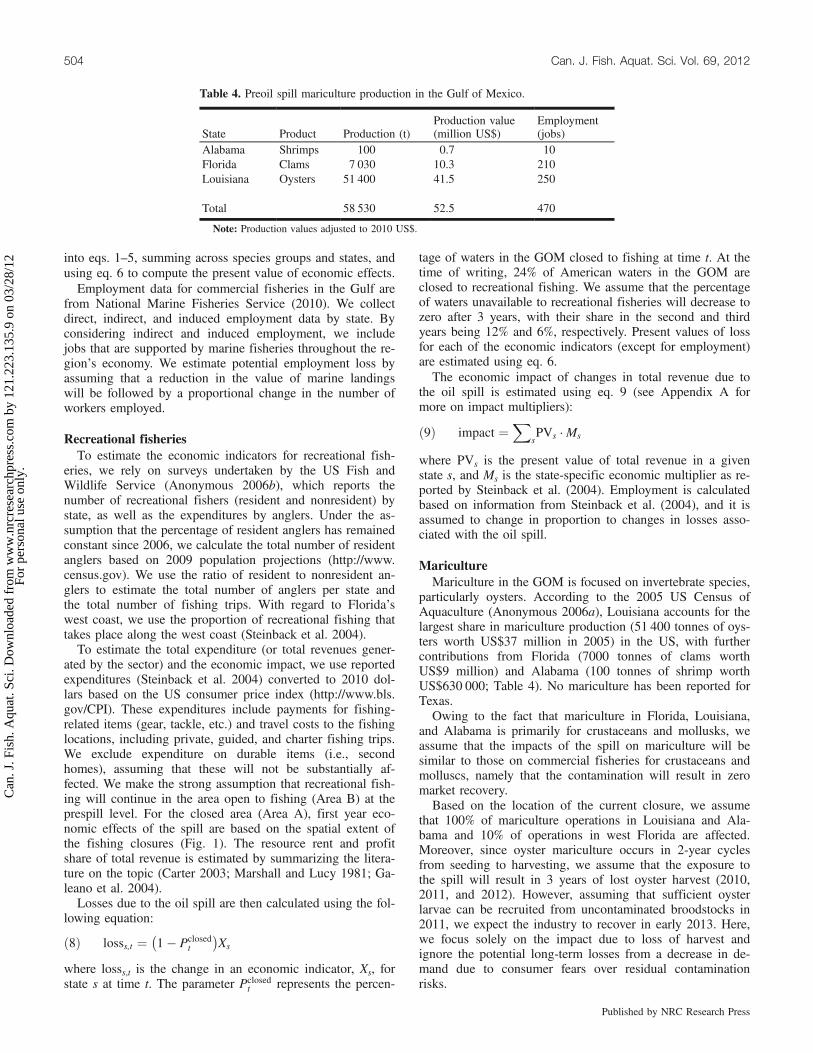
MaricultureMariculture in the GOM is focused on invertebrate species,
particularly oysters. According to the 2005 US Census ofAquaculture (Anonymous 2006a), Louisiana accounts for thelargest share in mariculture production (51 400 tonnes of oys-ters worth US$37 million in 2005) in the US, with furthercontributions from Florida (7000 tonnes of clams worthUS$9 million) and Alabama (100 tonnes of shrimp worthUS$630 000; Table 4). No mariculture has been reported forTexas.Owing to the fact that mariculture in Florida, Louisiana,
and Alabama is primarily for crustaceans and mollusks, weassume that the impacts of the spill on mariculture will besimilar to those on commercial fisheries for crustaceans andmolluscs, namely that the contamination will result in zeromarket recovery.Based on the location of the current closure, we assume
that 100% of mariculture operations in Louisiana and Ala-bama and 10% of operations in west Florida are affected.Moreover, since oyster mariculture occurs in 2-year cyclesfrom seeding to harvesting, we assume that the exposure tothe spill will result in 3 years of lost oyster harvest (2010,2011, and 2012). However, assuming that sufficient oysterlarvae can be recruited from uncontaminated broodstocks in2011, we expect the industry to recover in early 2013. Here,we focus solely on the impact due to loss of harvest andignore the potential long-term losses from a decrease in de-mand due to consumer fears over residual contaminationrisks.
Table 4. Preoil spill mariculture production in the Gulf of Mexico.
State Product Production (t)Production value(million US$)
Employment(jobs)
Alabama Shrimps 100 0.7 10Florida Clams 7 030 10.3 210Louisiana Oysters 51 400 41.5 250
Total 58 530 52.5 470
Note: Production values adjusted to 2010 US$.
504 Can. J. Fish. Aquat. Sci. Vol. 69, 2012
Published by NRC Research Press
Can
. J. F
ish.
Aqu
at. S
ci. D
ownl
oade
d fr
om w
ww
.nrc
rese
arch
pres
s.co
m b
y 12
1.22
3.13
5.9
on 0
3/28
/12
For
pers
onal
use
onl
y.
From our estimates of lost revenue, we compute the profitand wages lost. The cost structure of mariculture operationsin the GOM region was not available to us; we therefore useinformation from oyster farming in Virginia (Lipton et al.2006) to estimate the potential loss in profit (∼47%) andwages (∼20%) from total revenue. Because of the nature ofmariculture (i.e., requiring input by operators to generate har-vest), we assume that all of the profit is return to capital withno resource rent. As in commercial fisheries, the presentvalue of the lost revenue, profit, and wages are calculated us-ing eq. 1.We assume the current level of output from mariculture to
be similar to that reported in the 2005 US Census of Aqua-culture (Anonymous 2006a), converted to 2010 US$ equiva-lent (Table 4). The employment figures are estimated fromthe state total using the ratio of mariculture farms to totalnumber of aquaculture farms in each state (Anonymous2006a).The economic impact of losses in total mariculture revenue
is estimated by adapting eq. 5 to mariculture production,changing it to
ð10Þ impact ¼ PVrevenue �Mwhere PVrevenue is the present value of loss due to the oilspill, and M is the economic input–output multiplier fromDyck and Sumaila (2010).
Results
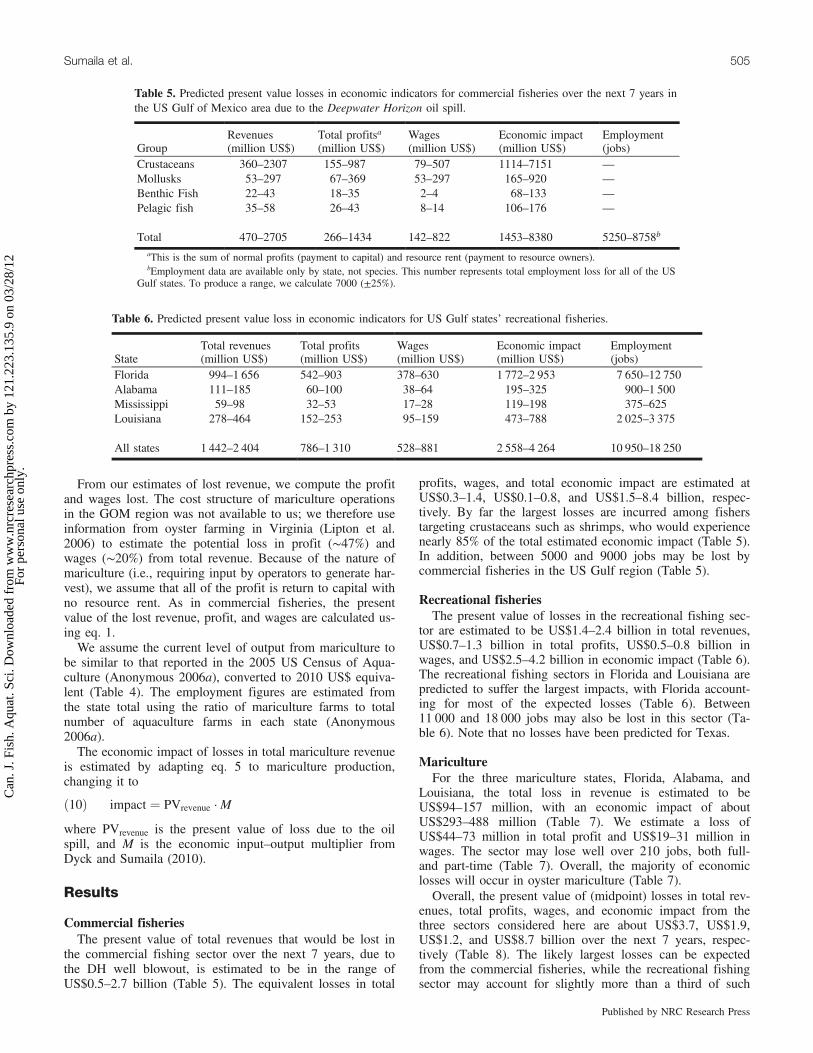
Commercial fisheriesThe present value of total revenues that would be lost in
the commercial fishing sector over the next 7 years, due tothe DH well blowout, is estimated to be in the range ofUS$0.5–2.7 billion (Table 5). The equivalent losses in total
profits, wages, and total economic impact are estimated atUS$0.3–1.4, US$0.1–0.8, and US$1.5–8.4 billion, respec-tively. By far the largest losses are incurred among fisherstargeting crustaceans such as shrimps, who would experiencenearly 85% of the total estimated economic impact (Table 5).In addition, between 5000 and 9000 jobs may be lost bycommercial fisheries in the US Gulf region (Table 5).
Recreational fisheriesThe present value of losses in the recreational fishing sec-
tor are estimated to be US$1.4–2.4 billion in total revenues,US$0.7–1.3 billion in total profits, US$0.5–0.8 billion inwages, and US$2.5–4.2 billion in economic impact (Table 6).The recreational fishing sectors in Florida and Louisiana arepredicted to suffer the largest impacts, with Florida account-ing for most of the expected losses (Table 6). Between11 000 and 18 000 jobs may also be lost in this sector (Ta-ble 6). Note that no losses have been predicted for Texas.
MaricultureFor the three mariculture states, Florida, Alabama, and
Louisiana, the total loss in revenue is estimated to beUS$94–157 million, with an economic impact of aboutUS$293–488 million (Table 7). We estimate a loss ofUS$44–73 million in total profit and US$19–31 million inwages. The sector may lose well over 210 jobs, both full-and part-time (Table 7). Overall, the majority of economiclosses will occur in oyster mariculture (Table 7).Overall, the present value of (midpoint) losses in total rev-
enues, total profits, wages, and economic impact from thethree sectors considered here are about US$3.7, US$1.9,US$1.2, and US$8.7 billion over the next 7 years, respec-tively (Table 8). The likely largest losses can be expectedfrom the commercial fisheries, while the recreational fishingsector may account for slightly more than a third of such
Table 5. Predicted present value losses in economic indicators for commercial fisheries over the next 7 years inthe US Gulf of Mexico area due to the Deepwater Horizon oil spill.
GroupRevenues(million US$)
Total profitsa(million US$)
Wages(million US$)
Economic impact(million US$)
Employment(jobs)
Crustaceans 360–2307 155–987 79–507 1114–7151 —Mollusks 53–297 67–369 53–297 165–920 —Benthic Fish 22–43 18–35 2–4 68–133 —Pelagic fish 35–58 26–43 8–14 106–176 —
Total 470–2705 266–1434 142–822 1453–8380 5250–8758baThis is the sum of normal profits (payment to capital) and resource rent (payment to resource owners).bEmployment data are available only by state, not species. This number represents total employment loss for all of the US
Gulf states. To produce a range, we calculate 7000 (±25%).
Table 6. Predicted present value loss in economic indicators for US Gulf states’ recreational fisheries.
StateTotal revenues(million US$)
Total profits(million US$)
Wages(million US$)
Economic impact(million US$)
Employment(jobs)
Florida 994–1 656 542–903 378–630 1 772–2 953 7 650–12 750Alabama 111–185 60–100 38–64 195–325 900–1 500Mississippi 59–98 32–53 17–28 119–198 375–625Louisiana 278–464 152–253 95–159 473–788 2 025–3 375
All states 1 442–2 404 786–1 310 528–881 2 558–4 264 10 950–18 250
Sumaila et al. 505
Published by NRC Research Press
Can
. J. F
ish.
Aqu
at. S
ci. D
ownl
oade
d fr
om w
ww
.nrc
rese
arch
pres
s.co
m b
y 12
1.22
3.13
5.9
on 0
3/28
/12
For
pers
onal
use
onl
y.
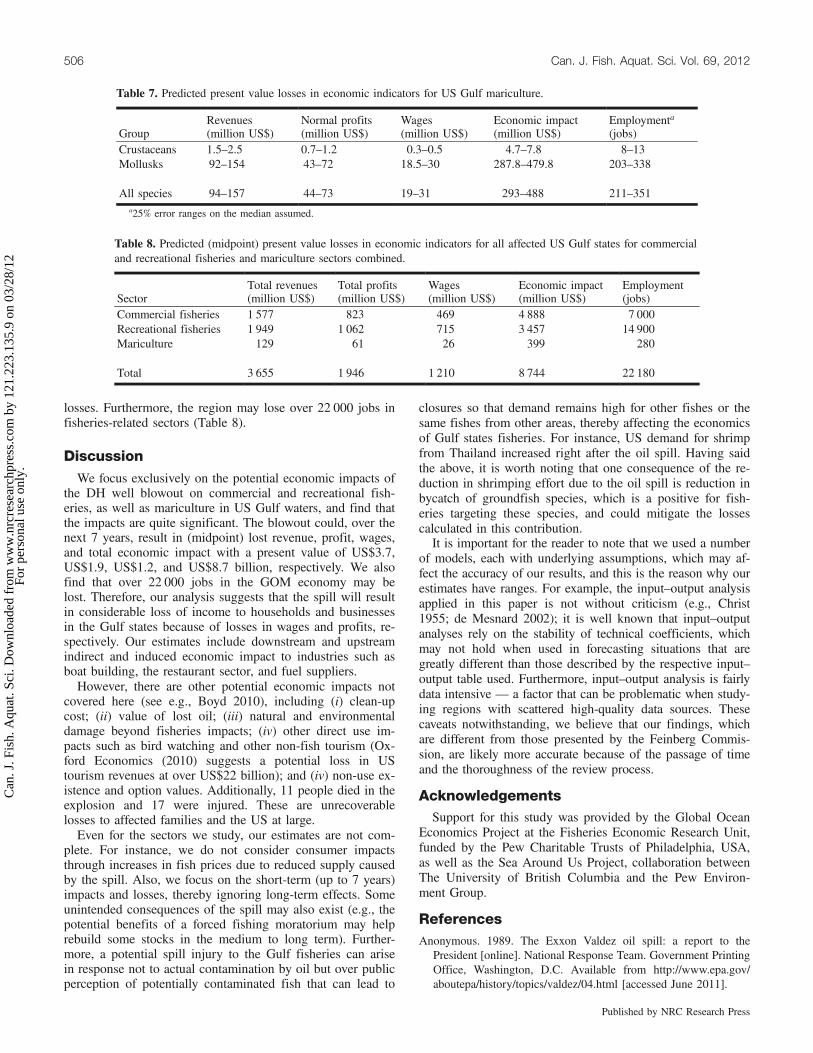
losses. Furthermore, the region may lose over 22 000 jobs infisheries-related sectors (Table 8).
DiscussionWe focus exclusively on the potential economic impacts of
the DH well blowout on commercial and recreational fish-eries, as well as mariculture in US Gulf waters, and find thatthe impacts are quite significant. The blowout could, over thenext 7 years, result in (midpoint) lost revenue, profit, wages,and total economic impact with a present value of US$3.7,US$1.9, US$1.2, and US$8.7 billion, respectively. We alsofind that over 22 000 jobs in the GOM economy may belost. Therefore, our analysis suggests that the spill will resultin considerable loss of income to households and businessesin the Gulf states because of losses in wages and profits, re-spectively. Our estimates include downstream and upstreamindirect and induced economic impact to industries such asboat building, the restaurant sector, and fuel suppliers.However, there are other potential economic impacts not
covered here (see e.g., Boyd 2010), including (i) clean-upcost; (ii) value of lost oil; (iii) natural and environmentaldamage beyond fisheries impacts; (iv) other direct use im-pacts such as bird watching and other non-fish tourism (Ox-ford Economics (2010) suggests a potential loss in UStourism revenues at over US$22 billion); and (iv) non-use ex-istence and option values. Additionally, 11 people died in theexplosion and 17 were injured. These are unrecoverablelosses to affected families and the US at large.Even for the sectors we study, our estimates are not com-
plete. For instance, we do not consider consumer impactsthrough increases in fish prices due to reduced supply causedby the spill. Also, we focus on the short-term (up to 7 years)impacts and losses, thereby ignoring long-term effects. Someunintended consequences of the spill may also exist (e.g., thepotential benefits of a forced fishing moratorium may helprebuild some stocks in the medium to long term). Further-more, a potential spill injury to the Gulf fisheries can arisein response not to actual contamination by oil but over publicperception of potentially contaminated fish that can lead to
closures so that demand remains high for other fishes or thesame fishes from other areas, thereby affecting the economicsof Gulf states fisheries. For instance, US demand for shrimpfrom Thailand increased right after the oil spill. Having saidthe above, it is worth noting that one consequence of the re-duction in shrimping effort due to the oil spill is reduction inbycatch of groundfish species, which is a positive for fish-eries targeting these species, and could mitigate the lossescalculated in this contribution.It is important for the reader to note that we used a number
of models, each with underlying assumptions, which may af-fect the accuracy of our results, and this is the reason why ourestimates have ranges. For example, the input–output analysisapplied in this paper is not without criticism (e.g., Christ1955; de Mesnard 2002); it is well known that input–outputanalyses rely on the stability of technical coefficients, whichmay not hold when used in forecasting situations that aregreatly different than those described by the respective input–output table used. Furthermore, input–output analysis is fairlydata intensive — a factor that can be problematic when study-ing regions with scattered high-quality data sources. Thesecaveats notwithstanding, we believe that our findings, whichare different from those presented by the Feinberg Commis-sion, are likely more accurate because of the passage of timeand the thoroughness of the review process.
AcknowledgementsSupport for this study was provided by the Global Ocean
Economics Project at the Fisheries Economic Research Unit,funded by the Pew Charitable Trusts of Philadelphia, USA,as well as the Sea Around Us Project, collaboration betweenThe University of British Columbia and the Pew Environ-ment Group.
ReferencesAnonymous. 1989. The Exxon Valdez oil spill: a report to the
President [online]. National Response Team. Government PrintingOffice, Washington, D.C. Available from http://www.epa.gov/aboutepa/history/topics/valdez/04.html [accessed June 2011].
Table 7. Predicted present value losses in economic indicators for US Gulf mariculture.
GroupRevenues(million US$)
Normal profits(million US$)
Wages(million US$)
Economic impact(million US$)
Employmenta(jobs)
Crustaceans 1.5–2.5 0.7–1.2 0.3–0.5 4.7–7.8 8–13Mollusks 92–154 43–72 18.5–30 287.8–479.8 203–338
All species 94–157 44–73 19–31 293–488 211–351a25% error ranges on the median assumed.
Table 8. Predicted (midpoint) present value losses in economic indicators for all affected US Gulf states for commercialand recreational fisheries and mariculture sectors combined.
SectorTotal revenues(million US$)
Total profits(million US$)
Wages(million US$)
Economic impact(million US$)
Employment(jobs)
Commercial fisheries 1 577 823 469 4 888 7 000Recreational fisheries 1 949 1 062 715 3 457 14 900Mariculture 129 61 26 399 280
Total 3 655 1 946 1 210 8 744 22 180
506 Can. J. Fish. Aquat. Sci. Vol. 69, 2012
Published by NRC Research Press
Can
. J. F
ish.
Aqu
at. S
ci. D
ownl
oade
d fr
om w
ww
.nrc
rese
arch
pres
s.co
m b
y 12
1.22
3.13
5.9
on 0
3/28
/12
For
pers
onal
use
onl
y.
Anonymous. 1990a. Economic, social, and psychological impactassessment of the Exxon Valdez oil spill: a report to the OiledMayors Subcommittee: Alaska Conference of Mayors. ImpactAssessment, Inc., La Jolla, Calif.
Anonymous. 1990b. An assessment of the impact of the ExxonValdez oil spill on the Alaska Tourism industry: Phase I, initialassessment. McDowe Group, Inc. A report to Preston, Thorgrim-son, Shidler, Gates and Ellis, Seattle, Wash.
Anonymous. 1993. Economic impacts of oil spills: spill unit costs fortankers, pipelines, refineries, and offshore facilities. A report byAdvanced Resources International, Inc. to US Department ofEnergy, Office of Domestic and International Energy Policy,Washington, D.C.
Anonymous. 2006a. Census of aquaculture 2005 [online]. Vol. 3.Special Studies Part 2 AC-02-SP-2. US Department of Agriculture,National Agricultural Statistics Service, Washington, D.C. Availablefrom http://www.ntis.gov/search/product.aspx?ABBR=AC02SP2[accessed June 2011].
Anonymous. 2006b. National survey of fishing, hunting and wildlife-associated recreation [online]. FHW/06-NATUS. Department ofthe Interior, Fish and Wildlife Service and US Department ofCommerce, Bureau of the Census, Washington, D.C. Availablefrom http://www.census.gov/prod/2008pubs/fhw06-nat.pdf [ac-cessed June 2011].
Arlinghaus, R. 2006. On the apparently striking disconnect betweenmotivation and satisfaction in recreational fishing: the case ofcatch orientation of German anglers. N. Am. J. Fish. Manage.26(3): 592–605. doi:10.1577/M04-220.1.
Boyd, J.W. 2010. How do you put a price on marine oil pollutiondamages? Resources, 175: 21–23.
Bue, B.G., Sharr, S., and Seeb, J.E. 1998. Evidence of damage topink salmon populations inhabiting Prince William Sound, Alaska,two generations after the Exxon Valdez oil spill. Trans. Am. Fish.Soc. 127(1): 35–43. doi:10.1577/1548-8659(1998)127<0035:EODTPS>2.0.CO;2.
Burns, K.A., Garrity, S.D., and Levings, S.C. 1993. How many yearsuntil mangrove ecosystems recover from catastrophic oil spills?Mar. Pollut. Bull. 26(5): 239–248. doi:10.1016/0025-326X(93)90062-O.
Camilli, R., Reddy, C.M., Yoerger, D.R., Van Mooy, B.A.S., Jakuba,M.V., Kinsey, J.C., McIntyre, C.P., Sylva, S.P., and Maloney, J.V.2010. Tracking hydrocarbon plume transport and biodegradationat Deepwater Horizon. Science, 330(6001): 201–204. doi:10.1126/science.1195223. PMID:20724584.
Carls, M.G., Babcock, M.M., Harris, P.M., Irvine, G.V., Cusick, J.A.,and Rice, S.D. 2001. Persistence of oiling in mussel beds after theExxon Valdez oil spill. Mar. Environ. Res. 51(2): 167–190. doi:10.1016/S0141-1136(00)00103-3. PMID:11468815.
Carter, D.W. 2003. 2003 Gulf of Mexico red snapper rebuilding plan:economic analysis of the recreational sector. Working Paper SeriesSEFSC-SSRG-03. National Marine Fisheries Service, SoutheastFisheries Science Center, Miami, Fla.
Cedre. 2008. Amoco Cadiz [online]. Centre de Documentation, deRecherche et d’Experimentations sur les Pollutions Accidentellesdes Eaux, Brest, France. Available from http://www.cedre.fr/en/spill/amoco/amoco.php [accessed July 2010; updated 29 February2008].
Christ, C.F. 1955. A review of input-output analysis [online]. InInput–output analysis: an appraisal. Princeton University Press,Princeton, N.J. pp. 137–182. Available from http://www.nber.org/chapters/c2866.
Cohen, M.J. 1995. Technological disasters and natural resourcedamage assessment: an evaluation of the Exxon Valdez Oil Spill.Land Econ. 71(1): 65–82. doi:10.2307/3146759.
Culbertson, J.B., Valiela, I., Peacock, E.E., Reddy, C.M., Carter, A.,and VanderKruik, R. 2007. Long-term biological effects ofpetroleum residues on fiddler crabs in salt marshes. Mar. Pollut.Bull. 54(7): 955–962. doi:10.1016/j.marpolbul.2007.02.015.PMID:17448504.
Culbertson, J.B., Valiela, I., Olsen, Y.S., and Reddy, C.M. 2008a.Effect of field exposure to 38-year-old residual petroleumhydrocarbons on growth, condition index, and filtration rate ofthe ribbed mussel, Geukensia demissa. Environ. Pollut. 154(2):312–319. doi:10.1016/j.envpol.2007.10.008. PMID:18045755.
Culbertson, J.B., Valiela, I., Pickart, M., Peacock, E.E., and Reddy,C.M. 2008b. Long-term consequences of residual petroleum onsalt marsh grass. J. Appl. Ecol. 45(4): 1284–1292. doi:10.1111/j.1365-2664.2008.01477.x.
de Mesnard, L. 2002. Note about the concept of net multipliers.J. Reg. Sci. 42(3): 545–548. doi:10.1111/1467-9787.00271.
Downing, N., and Roberts, C. 1993. Has the Gulf War affected coralreefs of the Northwestern Gulf? Mar. Pollut. Bull. 27: 149–156.doi:10.1016/0025-326X(93)90019-G.
Dyck, A.J., and Sumaila, U.R. 2010. Economic impact of ocean fishpopulations in the global fishery. J. Bioeconomics, 12(3): 227–243. doi:10.1007/s10818-010-9088-3.
Elmgren, R., Hansson, S., Larsson, U., Sundelin, B., and Boehm, P.D.1983. The “Tsesis” oil spill: acute and long-term impact on thebenthos. Mar. Biol. 73(1): 51–65. doi:10.1007/BF00396285.
Fedler, A.J., and Ditton, R.B. 1986. A framework for understandingthe consumptive orientation of recreational fishermen. Environ.Manage. 10(2): 221–227. doi:10.1007/BF01867360.
Felder, D.L., and Camp, D.K. (Editors). 2009. Gulf of Mexico:origin, waters, and biota. Vol. 1. Biodiversity, Texas A&MUniversity Press, College Station, Texas, USA.
Galeano, D., Langenkamp, D., Levantis, C., Shafron, W., andRedmond, I. 2004. Economic value of charter and recreationalfishing in Australia’s eastern tuna and billfish fishery. ABAREeReport 04.10. Prepared for the Fisheries Resources ResearchFund, Canberra, Australia.
García-Negro, M.C., Villasante, S., Carballo-Penela, A., andRodríguez-Rodríguez, G. 2009. Estimating the economic impactof the Prestige oil spill on the Death Coast (NW Spain) fisheries.Mar. Policy, 33(1): 8–23. doi:10.1016/j.marpol.2008.03.011.
Graham, S. 2003. Environmental effects of Exxon Valdez spill stillbeing felt [online]. News report. Scientific American, 19 December2003. Available from http://www.scientificamerican.com/article.cfm?id=environmental-effects-of.
Grigalunas, T.A., Anderson, R.C., Brown, G.M., Jr, Congar, R.,Meade, N.F., and Sorensen, P.E. 1986. Estimating the cost of oilspills: lessons from the Amoco Cadiz incident. Mar. Resour. Econ.2(3): 239–262.
Haapkyla, J., Ramade, F., and Salvat, B. 2007. Oil pollution on coralreefs: a review of the state of knowledge and management needs.Vie Millieu, 57(1/2): 91–107.
Jackson, J.B.C., Cubit, J.D., Keller, B.D., Batista, V., Burns, K.,Caffey, H.M., Caldwell, R.L., Garrity, S.D., Getter, C.D.,Gonzalez, C., Guzman, H.M., Kaufmann, A.H., Levings, S.C.,Marshall, M.J., Steger, R., Thompson, R.C., and Weil, E. 1989.Ecological effects of a major oil spill on Panamanian coastalmarine communities. Science, 243(4887): 37–44. doi:10.1126/science.243.4887.37. PMID:17780421.
Jernelov, A., and Linden, O. 1981. Ixtoc I: a case study of the world’slargest oil spill. Ambio, 10(6): 299–306.
Jewett, S.C., Dean, T.A., Woodin, B.R., Hoberg, M.K., andStegeman, J.J. 2002. Exposure to hydrocarbons 10 years afterthe Exxon Valdez oil spill: evidence from cytochrome P4501Aexpression and billiary FACs in nearshore demersal fishes. Mar.
Sumaila et al. 507
Published by NRC Research Press
Can
. J. F
ish.
Aqu
at. S
ci. D
ownl
oade
d fr
om w
ww
.nrc
rese
arch
pres
s.co
m b
y 12
1.22
3.13
5.9
on 0
3/28
/12
For
pers
onal
use
onl
y.
Environ. Res. 54(1): 21–48. doi:10.1016/S0141-1136(02)00093-4.PMID:12148943.
Lee, R.F., and Page, D.S. 1997. Petroleum hydrocarbons and theireffects in subtidal regions after major oil spills. Mar. Pollut. Bull.34(11): 928–940. doi:10.1016/S0025-326X(97)00078-7.
LeGore, S., Marszalek, D.S., Danek, L.J., Tomlinson, M.S.,Hofmann, J.E., and Cuddebak, J.E. 1989. Effect of chemicallydispersed oil on Arabian Gulf corals: a field experiment. InProceedings of the 1989 International Oil Spill Conference, SanAntonio, 13–16 February 1989. American Petroleum Institute,Washington, D.C. pp. 375–381.
Levy, J.K., and Gopalakrishnan, C. 2010. Promoting ecologicalsustainability and community resilience in the US Gulf Coast afterthe 2010 Deepwater Horizon oil spill. Journal of NaturalResources Policy Research, 2(3): 297–315. doi:10.1080/19390459.2010.500462.
Lipton, D.W., Kirkley, J., and Murray, T. 2006. A backgroundeconomic analysis for the programmatic environmental impactstatement regarding the restoration of the Chesapeake Bay oysterfishery using the non-native oyster Crassostrea ariakensis. Finalreport to the Maryland Department of Natural Resources,Annapolis, Md.
Loya, Y., and Rinkevich, B. 1980. Effects of oil pollution on coralreef communities. Mar. Ecol. Prog. Ser. 3: 167–180. doi:10.3354/meps003167.
Marshall, A.R., and Lucy, J.A. 1981. Virginia’s charter and head boatfishery: analysis of catch and socioeconomic impacts. Specialreport in Applied Marine Science and Ocean Engineering No. 253.Virginia Sea Grant Program, Virginia Institute of Marine Science,College of William and Mary, Gloucester Point, Va.
McCrea-Strub, A., Kleisner, K., Sumaila, U.R., Swartz, W., Watson,R., Zeller, D., and Pauly, D. 2011. Potential impact of theDeepwater Horizon oil spill on commercial fisheries in the Gulf ofMexico. Fisheries, 36(7): 332–336. doi:10.1080/03632415.2011.589334.
Moles, A.D., Rice, S.D., and Okihiro, M.S. 1993. Herring parasiteand tissue alterations following the Exxon Valdez oil spill.Proceedings of the 1993 Oil Spill Conference. AmericanPetroleum Institute, Washington, D.C. pp. 325–328.
Moller, T.H., Dicks, B., and Goodman, C.N. 1989. Fisheries andmariculture affected by oil spills. In Proceedings of the 1989International Oil Spill Conference, Seattle, Washington, 8–11 March 1999. American Petroleum Institute, Washington, D.C.pp. 693–699.
National Marine Fisheries Service. 2010. Seafood Industry Impactsearch routine of the Interactive Fisheries Economics ImpactsTools [online]. Available from https://www.st.nmfs.noaa.gov/apex/f?p=160:7:1836673894606153 [accessed 31 January 2012].
National Oceanographic and Atmospheric Administration. 2010. Fishstocks in the Gulf of Mexico [online]. Fact sheet. Available fromhttp://gulfseagrant.tamu.edu/oilspill/facts_fishstocks.htm [ac-cessed July 2010].
Oxford Economics. 2010. Potential impact of the Gulf oil spill ontourism [online]. US Travel Association. Available from http://www.ustravel.org/sites/default/files/page/2009/11/Gulf_Oil_Spill_Analysis_Oxford_Economics_710.pdf [accessed June 2011].
Palinkas, L.A., Downs, M.A., Petterson, J.S., and Russell, J.S. 1993.Social, cultural, and psychological impacts of the Exxon Valdez oilspill. Hum. Organ. 52: 1–13.
Pontecorvo, G., Wilkinson, M., Anderson, R., and Holdowsky, M.1980. Contribution of the ocean sector to the United Stateseconomy. Science, 208(4447): 1000–1006. doi:10.1126/science.208.4447.1000. PMID:17779011.
Price, A.R.G. 1998. Impact of the 1991 Gulf War on the coastal
environment and ecosystems: current status and future prospects.Environ. Int. 24(1–2): 91–96. doi:10.1016/S0160-4120(97)00124-4.
Rice, S.D., Thomas, R.E., Carls, M.G., Heintz, R.A., Wertheimer, A.C., Murphy, M.L., Short, J.W., and Moles, A. 2001. Impacts topink salmon following the Exxon Valdez oil spill: persistence,toxicity, sensitivity, and controversy. Rev. Fish. Sci. 9(3): 165–211.doi:10.1080/20016491101744.
Shigenaka, G. 2002. Oil toxicity. In Oil spills in mangroves. Office ofResponse and Restoration, NOAA Ocean Service, NOAA, Seattle,Wash. pp. 23–35.
Steinback, S., Gentner, B., and Castle, J. 2004. The economicimportance of marine angler expenditures in the United States[online]. US Department of Commerce, NOAA Professional PaperNMFS 2, La Jolla, California. Available from http://spo.nwr.noaa.gov/pp2.pdf [accessed 18 July 2011].
Sumaila, U.R., Marsden, A.D., Watson, R., and Pauly, D. 2007. Aglobal ex-vessel fish price database: construction and applications.J. Bioeconomics, 9(1): 39–51. doi:10.1007/s10818-007-9015-4.
Teal, J.M., and Howarth, R.W. 1984. Oil spill studies: a review ofecological effects. Environ. Manage. Health, 8(1): 27–44.
Teal, J.M., Farrington, J.W., Burns, K.A., Stegeman, J.J., Tripp, B.W.,Woodin, B., and Phinney, C. 1992. The West Falmouth oil spillafter 20 years: fate of fuel oil compounds and effects on animals.Mar. Pollut. Bull. 24(12): 607–614. doi:10.1016/0025-326X(92)90281-A.
Thorne, R.E., and Thomas, G.L. 2007. Herring and the “ExxonValdez” oil spill: an investigation into historical data conflicts.ICES J. Mar. Sci. 65(1): 44–50. doi:10.1093/icesjms/fsm176.
Urriza, M.S.G., and Duran, R. 2010. The Gulf oil spill: we have beenhere before. Can we learn from the past? Journal of Cosmology, 8:2026–2028.
Watson, R., Kitchingman, A., Gelchu, A., and Pauly, D. 2004. Mappingglobal fisheries: sharpening our focus. Fish Fish. 5: 168–177.
Appendix A. More on input–output modelsAs a primary industry (i.e., activities focusing on extract-
ing or processing natural resources, such as energy, minerals,and in this case food, for use elsewhere in the economy),fishing is the beginning of a productive value chain in aneconomy. The economic multiplier is used in fisheries re-search to emphasize that the industry has many linkagesthroughout the economy. Such multipliers are a factor bywhich we can multiply the value of final demand for an eco-nomic activity’s output to obtain its total contribution to eco-nomic output, including activities directly and indirectlydependent on it.More specifically, the multipliers used in this study are
taken from Dyck and Sumaila (2010). The model configura-tions, presented in this reference, are briefly described below.The method developed by Nobel laureate, Wassily Leon-
tief, known as input–output analysis, is a tried and tested ap-proach to analyzing the structure of the economy. Beginningas early as the late 1940s, Leontief used his method in anumber of applications, including the well-known analysesof the potential economic impact of disarmament for theUnited States of America and tests of the Heckscher–Ohlintheory now known as the “Leontief Paradox” (Leontief1953; Leontief et al. 1965). The definitive source on input–output methodology, his book on the subject is a collectionof his earlier works and serves as an excellent foundation forusing input–output analysis (Leontief 1966). There are, how-
508 Can. J. Fish. Aquat. Sci. Vol. 69, 2012
Published by NRC Research Press
Can
. J. F
ish.
Aqu
at. S
ci. D
ownl
oade
d fr
om w
ww
.nrc
rese
arch
pres
s.co
m b
y 12
1.22
3.13
5.9
on 0
3/28
/12
For
pers
onal
use
onl
y.
ever, several additional sources for readers who are interestedin the methodology as applied to fisheries (Heen 1989;Hoagland et al. 2005; Jin et al. 2003; Leung and Pooley2001; Roy et al. 2009).Input–output analysis uses interindustry transaction data to
compute a technical coefficient matrix, A, which is com-posed of entries ai,j summarizing the output from industry irequired to produce a unit of output for industry j. We com-pute this technical coefficient matrix for every maritimecountry of the world, expressing the economy of each coun-try as a system of linear equations summarized by the follow-ing equation:
ðA:1Þ Axþ d ¼ x
where A is the matrix of technical coefficients describing in-put requirements for each sector, x is a vector of sector in-puts, and d is a vector of final demand. The above equationthen simply states that the sum of intermediate demand (Ax)and final demand (d) is equal to supply (x). It is then a sim-ple problem of linear algebra to solve for the vector of inputs(x) required to satisfy a given final demand vector (d) using Ias the identity matrix. This solution is expressed as
ðA:2Þ x ¼ ½I� A��1d
We note that the vector x represents total output supportedby the demand vector d. It is important to keep this measureof economic activity separate from other measures such asvalue-added, which subtracts the value of inputs from thevalue of output. It is worth noting that it is not appropriateto make comparisons between estimates using input–outputanalysis and measures of value-added such as gross domesticproduct (GDP).
Type I & II output multipliersGiven the solution in eq. A.2 above, we calculate the
change in output with respect to final demand. To do this,we take a partial derivative of eq. A.2 with respect to finaldemand (d):
ðA:3Þ dx
dd¼ ½I� A��1
Equation A.3 describes a new relationship that proves to bevery useful in macro-economic analysis. The right-hand sideof this equation, [I – A]–1, is also denoted as L–1, as it iscommonly called the Leontief inverse or multiplier matrix.This square matrix is of such interest because each entry (de-noted li,j) describes the marginal inputs required from sector iwhen the output of sector j increases by one unit.We calculate industry multipliers by computing the column
sum of the Leontief inverse matrix L–1 as M ¼XN
j¼1Li;j
where M is a row vector of Type I industry output multi-pliers. Each entry, Mj, in this row vector is an output multi-plier that allows us to compute the direct and indirect outputrequired to support a unit of output for industry j. For exam-ple, in a sector with a multiplier of 1.5, we would estimatethat US$100 in final demand from this sector supports US$150 of activity throughout the economy.As we have shown, for a given economy with n industries,
one calculates the Leontief inverse using a n × n technical
coefficients matrix as described above. Multipliers calculatedin this way account for the direct and indirect output sup-ported by a given industry. In addition to these multipliers,often called Type I, a second set of multipliers, called Type II,may also be calculated. The advantage to using Type II mul-tipliers is that they account for indirect as well as induced ef-fects that occur, for example, when additional demand for agiven sector increases household incomes that induce de-mand for additional output. With Type I multipliers, house-hold consumption is part of the final demand sector andtherefore assumed to be exogenous; with Type II multipliers,we treat household consumption as endogenous by adding itas an additional intermediate sector in the technical coeffi-cients matrix A. When computing Type II output multipliers,a technical coefficients matrix with endogenous householdswill be (n + 1) × (n + 1) in dimension. Summing the multi-plier matrix L–1 over n output sectors will produce Type IIoutput multipliers that include the induced effect of endoge-nizing households without confusing output and income,which would occur if we added the last row of the multipliermatrix — also known as the income effect.Researchers have adopted approaches to account for direct
and indirect effects of fisheries in literature. A considerableamount of this previous work using economic impact meth-odology has been done for the USA (e.g., Seung and Waters2006). Several methods used in such studies to analyze theeconomic impacts of fishing including input–output model-ing, social accounting matrix (SAM) modeling, econometricinput–output (EC-IO) modeling, fisheries economic assess-ment models (FEAM), and computable general equilibrium(CGE) models. Each of these techniques has its merits anddemerits, which have been discussed in the literature atlength (Loveridge 2004; Radtke et al. 2004).Of these models, the input–output technique is well used
in the study of fisheries, likely because of the relative easeof computation and accessibility of results (Bhat and Bhatta2006; Hoagland et al. 2005; Leung and Pooley 2001). Re-sults from an input–output study can be used to predict theoutcome of a marginal change in demand for a particulargood, and they can easily be interpreted and used in a practi-cal manner.For further reading on input–output tables, refer to referen-
ces listed below.
ReferencesBhat, M.G., and Bhatta, R. 2006. Regional economic impacts of
limited entry fishery management: an application of dynamicinput–output model. Environ. Dev. Econ. 11(6): 709–728. doi:10.1017/S1355770X06003238.
Dyck, A.J., and Sumaila, U.R. 2010. Economic impact of ocean fishpopulations in the global fishery. J. Bioeconomics, 12(3): 227–243. doi:10.1007/s10818-010-9088-3.
Heen, K. 1989. Impact analysis of multispecies marine resourcemanagement. Mar. Resour. Econ. 6(4): 331–348.
Hoagland, P., Jin, D., Thunberg, E., and Steinback, S. 2005.Economic activity associated with the northeast shelf large marineecosystem: application of an input–output approach. Sustaininglarge marine ecosystems: the human dimension. Elsevier,Amsterdam, the Netherlands. pp. 159–181.
Jin, D., Hoagland, P., and Dalton, T.M. 2003. Linking economic andecological models for a marine ecosystem. Ecol. Econ. 46(3): 367–385. doi:10.1016/j.ecolecon.2003.06.001.
Sumaila et al. 509
Published by NRC Research Press
Can
. J. F
ish.
Aqu
at. S
ci. D
ownl
oade
d fr
om w
ww
.nrc
rese
arch
pres
s.co
m b
y 12
1.22
3.13
5.9
on 0
3/28
/12
For
pers
onal
use
onl
y.
Leontief, W. 1953. Domestic production and foreign trade: theAmerican capital position re-examined. Proc. Am. Philos. Soc.97(4): 332–349.
Leontief, W. 1966. Input–output economics. Oxford University Press,New York.
Leontief, W., Morgan, A., Polenske, K., Simpson, D., and Tower, E.1965. The economic impact — industrial and regional — ofan arms cut. Rev. Econ. Stat. 47(3): 217–241. doi:10.2307/1927706.
Leung, P., and Pooley, S. 2001. Regional economic impacts ofreductions in fisheries production: a supply-driven approach. Mar.Resour. Econ. 16(4): 251–262.
Loveridge, S. 2004. A typology and assessment of multi-sectorregional economic impact models. Reg. Stud. 38(3): 305–317.doi:10.1080/003434042000211051.
Oosterhaven, J., and Stelder, D. 2002. Net multipliers avoidexaggerating impacts: with a bi-regional illustration for the Dutchtransportation sector. J. Reg. Sci. 42(3): 533–543. doi:10.1111/1467-9787.00270.
Pontecorvo, G., Wilkinson, M., Anderson, R., and Holdowsky, M.1980. Contribution of the ocean sector to the United Stateseconomy. Science, 208(4447): 1000–1006. doi:10.1126/science.208.4447.1000. PMID:17779011.
Radtke, H.D., Carter, C.N., and Davis, S.W. 2004. Economicevaluation of the northern pikeminnow management program.Report prepared for Pacific States Marine Fisheries Commission,Portland, Ore.
Roy, N., Arnason, R., and Schrank, W.E. 2009. The identification ofeconomic base industries, with an application to the Newfound-land fishing industry. Land Econ. 85(4): 675–691.
Seung, C.K., and Waters, E.C. 2006. A review of regional economicmodels for fisheries management in the U.S. Mar. Resour. Econ.21(1): 101.
Steinback, S., Gentner, B., and Castle, J. 2004. The economicimportance of marine angler expenditures in the United States[online]. NOAA Professional Paper NMFS 2. US Department ofCommerce, La Jolla, Calif. Available from http://spo.nwr.noaa.gov/pp2.pdf [accessed 18 July 2011].
510 Can. J. Fish. Aquat. Sci. Vol. 69, 2012
Published by NRC Research Press
Can
. J. F
ish.
Aqu
at. S
ci. D
ownl
oade
d fr
om w
ww
.nrc
rese
arch
pres
s.co
m b
y 12
1.22
3.13
5.9
on 0
3/28
/12
For
pers
onal
use
onl
y.