Embed Size (px)
Citation preview

SUSTAINABILITY ASSESSMENT OF TECHNOLOGIES
Applicability to Photovoltaics
Paolo Frankl
Brussels, EC/DG RTD, 24-25 April 2007

2
CONTENTS
Applicability of the methodology to existing Photovoltaic (PV) Systems
Assessment of long-term future PV systems Methodological issuesExperience from the IP project NEEDSSelected preliminary results

3
NEEDS - “New Energy Externalities Development for Sustainability”; (IP project, 2004-08)
SENSE - “Sustainability EvaluatioN of Solar Energy systems” (SENSE) EU Research project, (2003-06)
www. sense-eu.netECLIPSE - “Environmental and Ecological Life Cycle Inventories for present and future Power Systems in Europe”, Co-ordinator, EU research project, (2001-03)
www.eclipse-eu.orgPVACCEPT -“Improving PV Acceptability through Innovative Architectural Design” EU research project (2001-04)
www.pvaccept.de
CRYSTALCLEAR
REFERENCE PROJECTS

APPLICABILITY OF THE METHODOLOGY TO CURRENT /
EXISTING PV SYSTEMS

5
Life Cycle Approach
EPD-like approach for existing technologiesPCR TCR2-step approach: ISO14040 ref LCA + key performance indicators
Subsequent Simplified Assessment (STAR)
Actually only way to assess PV Fully feasibleSeveral large studies available as basis for TCRFeasible and desirable for STAR, benchmarking, ecodesign and assessment of future technologies
Technical Annex Applicability to PV
GENERAL FEASIBILITY ASPECTS

6
Not only marginal changes but consequences of implementation scenarios
Broaden concept of FU?
Address potential rebound effects?
Level-1: kWh Level-2:
Identify and assess possible future scenarios(see section 2)Qualitative “warning flags”or allocation (e.g. storage)Possible further distinction/refinement of FU:
Peak power vs. base loadDistributed generationBuilding integration and energy saving
Technical Annex Applicability to PV
FUNCTIONAL UNIT

7
Identification of thresholds
Cut-off criteria on mass and/or energy?
Existing PV technology family includes significantly different technologiesCut-off must relate to representativeness and uncertainty of dataMass can be problematic for thin films take into account potential toxicity impacts
Technical Annex Applicability to PV
CUT-OFF CRITERIA

8
Foreground data for technology specific processes
European Reference Life Cycle Data System (ELCD) for upstream and downstream
Alternative: hybrid LCA I/O for background data?
Feasible, but most impacts are indirect
Highly reliable background data are crucial for PV assessment
Electricity mixMain bulk materials
Technical Annex Applicability to PV
DATA
9
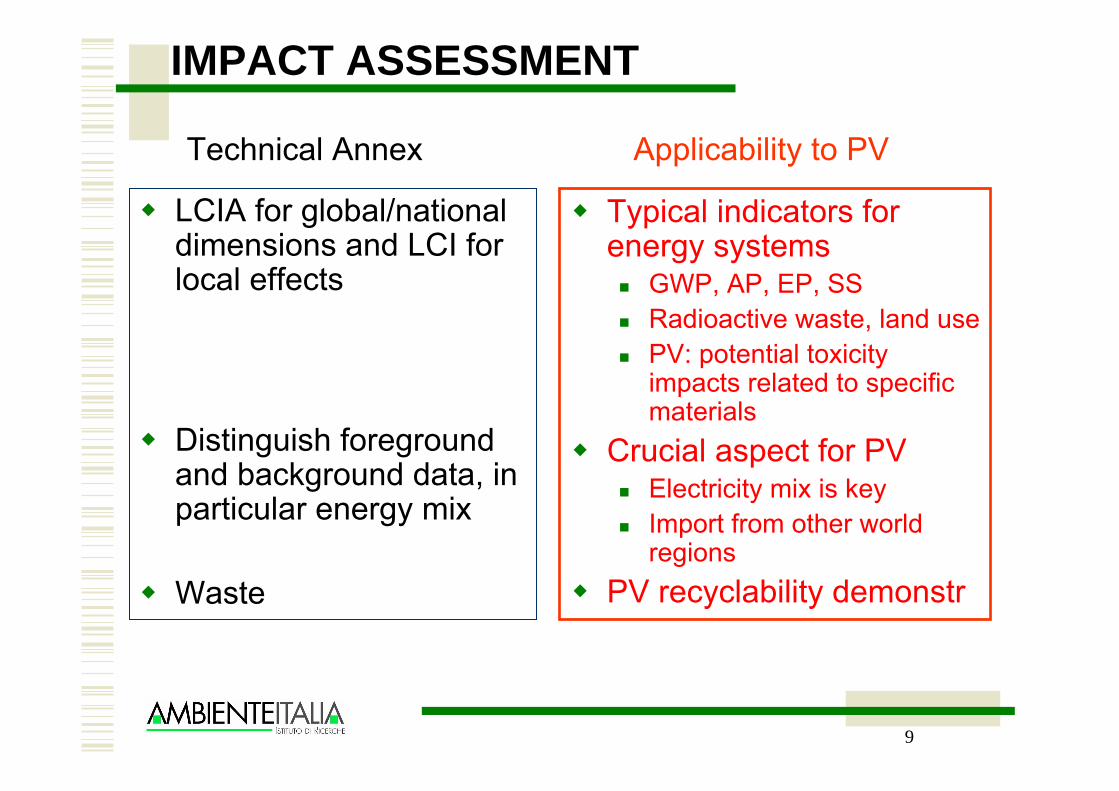
LCIA for global/national dimensions and LCI for local effects
Distinguish foreground and background data, in particular energy mix
Waste
Typical indicators for energy systems
GWP, AP, EP, SSRadioactive waste, land usePV: potential toxicity impacts related to specific materials
Crucial aspect for PVElectricity mix is keyImport from other world regions
PV recyclability demonstr
Technical Annex Applicability to PV
IMPACT ASSESSMENT

10
General information
Description of the proposed technology
LCI
LCIA
Totally feasible on full life cycle
End-of-life of PVDeutsche SolarEU-project SENSE
Technical Annex Applicability to PV
TCR

Economic dimension

12
LIFE CYCLE COSTING
Total Cost of Ownership fully feasible for PV systems
Production
Operation & Maintenance
Dismantling and End-of-life
Extension to external costs applicable, but limits to be highlighted

13
Emissions
Concentration & Deposition
Transport & chem. Conversion
Response of Receptors
e.g.EXPOSURE-RESPONSEFUNCTION Effect of ozone on crop yield
Nor
mal
ized
yie
ld
Concentration
Physical Impact
Change in UtilityChange in Utility
Welfare Losses
Costs
The ExternE Impact Pathway
RS1a
RS1b
€/t SO2, NOx, …
g/kWh SO2, NOx, …
EXTERNAL COSTS
Only average costs feasible
[Source: Krewitt 2007]

14
Impacts covered in NEEDS
Climate change
Impacts to human health due to primary and secondary particles and ozone
Impacts to crops due to airborne pollutants: yield loss, additional lime requirement, reduction in fertiliser requirement
Impacts to building materials (material damage, restoration costs)
Loss of terrestrial biodiversity due to land use changes, biodiversity losses due to acidification and eutrophication
[Source: Philipp Preiss, 13.4.2007]

15
Representation of climate change impacts in a risk-matrix(Watkiss 2005) Uncertainty in Valuation
Market Non Market Socially Contingent
Projection Coastal protection
Loss of dryland
Energy (heating/cooling)
Heat stress
Loss of wetland
Regional costs
Investment
Bounded Risk
Agriculture
Water
Variability (drought, flood, storms)
Ecosystem change
Biodiversity
Loss of life
Secondary social effects
Comparative advantage and market structures
U
ncer
tain
ty in
Pre
dict
ing
Clim
ate
Cha
nge
System change and surprise
Above, plus
Significant loss of land and resources
Non-marginal effects
Higher order social effects
Regional collapse
Irreversible losses
Regional collapse
Climate Change
16
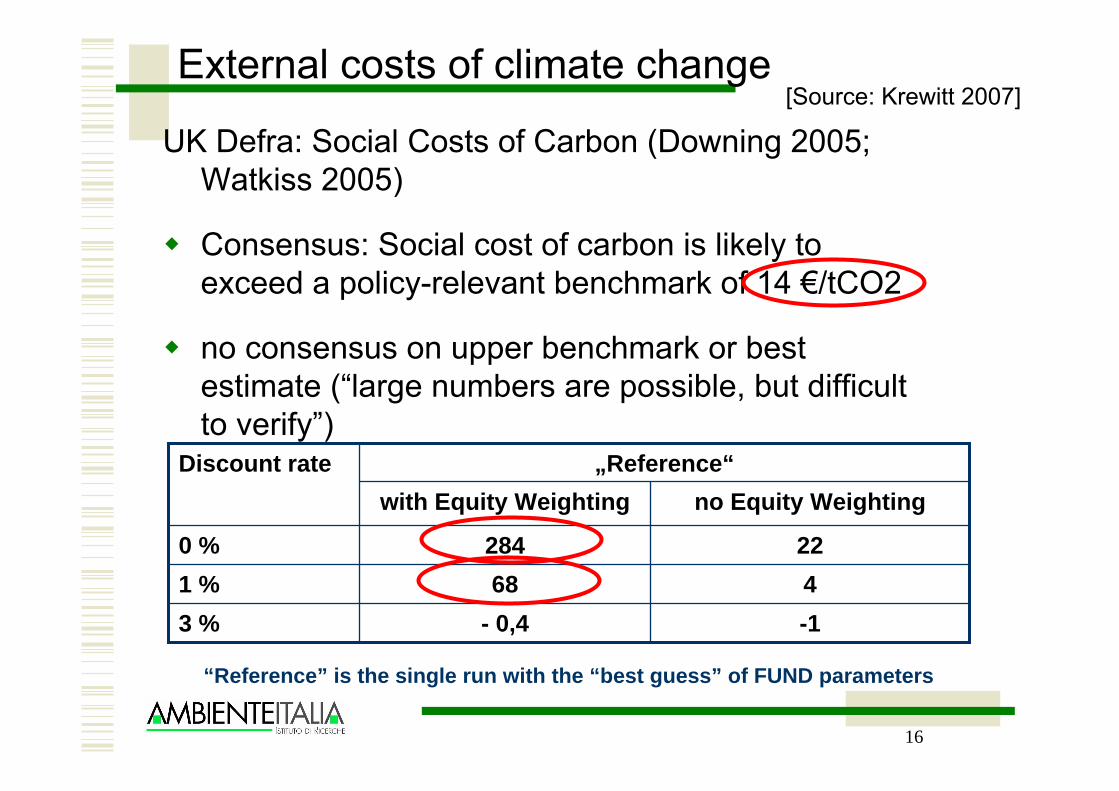
External costs of climate change
UK Defra: Social Costs of Carbon (Downing 2005; Watkiss 2005)
Consensus: Social cost of carbon is likely to exceed a policy-relevant benchmark of 14 €/tCO2
no consensus on upper benchmark or best estimate (“large numbers are possible, but difficult to verify”)
-1- 0,43 %4681 %222840 %
no Equity Weightingwith Equity Weighting„Reference“Discount rate
“Reference” is the single run with the “best guess” of FUND parameters
[Source: Krewitt 2007]
17
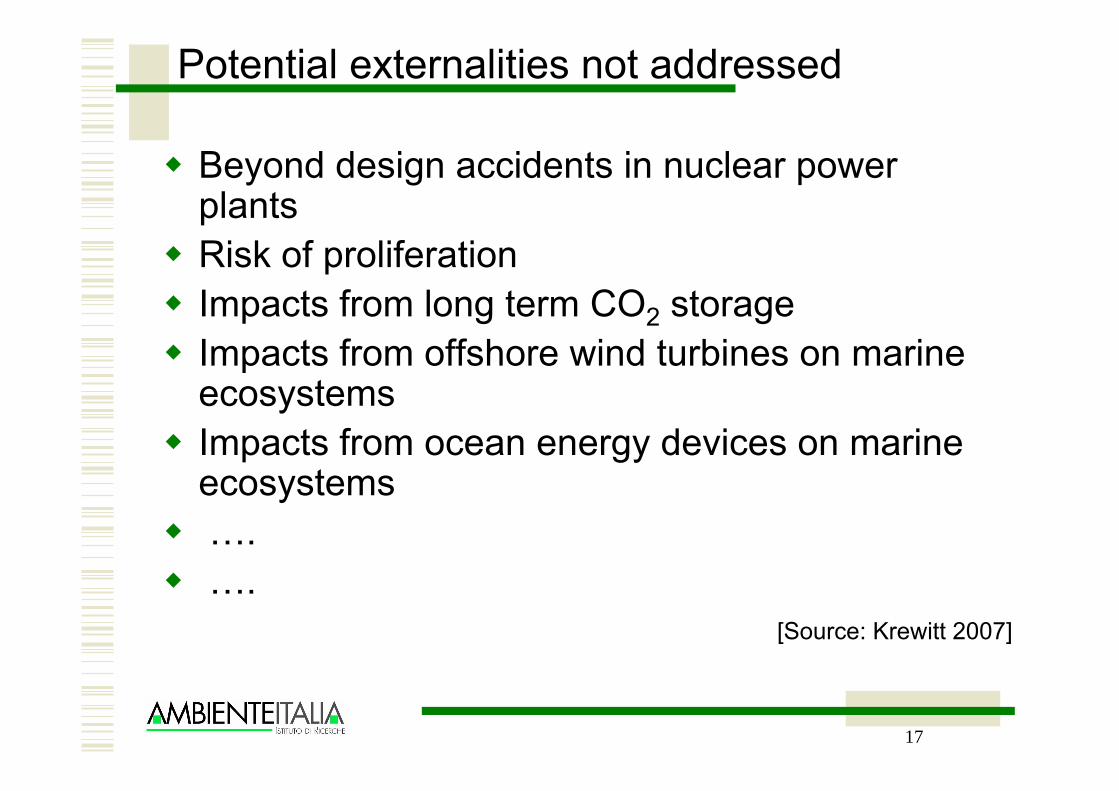
Potential externalities not addressed
Beyond design accidents in nuclear power plantsRisk of proliferationImpacts from long term CO2 storageImpacts from offshore wind turbines on marine ecosystemsImpacts from ocean energy devices on marine ecosystems….….
[Source: Krewitt 2007]
18
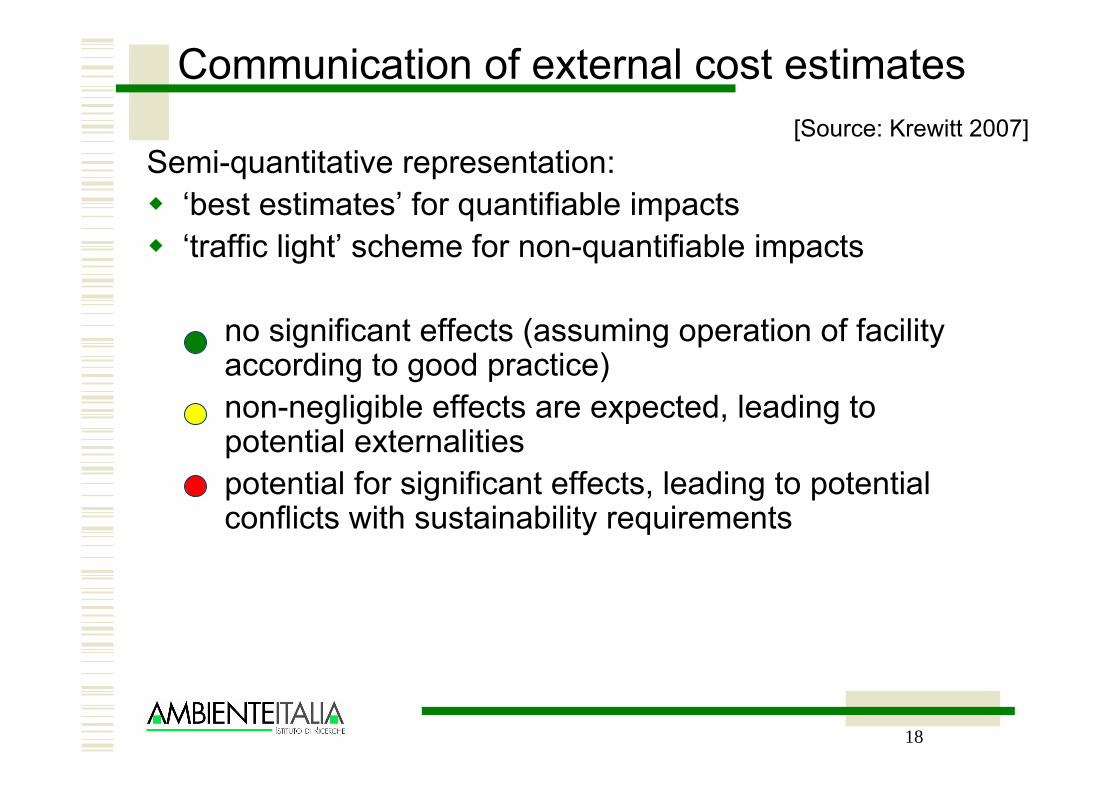
Communication of external cost estimates
Semi-quantitative representation:‘best estimates’ for quantifiable impacts‘traffic light’ scheme for non-quantifiable impacts
● no significant effects (assuming operation of facility according to good practice)
● non-negligible effects are expected, leading to potential externalities
● potential for significant effects, leading to potential conflicts with sustainability requirements
[Source: Krewitt 2007]

19
External costs of electricity supply
> 2,9
0,005
0,005
0,17
2,7
Erdgas GuD 57%
…
…
…
…
…
Kernenergie
> 6,4~ 0,09~ 0,58
Geo-pol. Effekte
Versorgungssicherheit
Proliferation
Große Risiken
0,0050,00040,004Ernteverluste
0,0080,0010,006Materialschäden
Ökosysteme
0,270,030,2Gesundheit
6,10,060,38Klimawandel
Braunkohle GuD 48%
Wind 2,5 MW
PV(2030)
> 2,9
0,005
0,005
0,17
2,7
Gas CC57%
…
…
…
…
…
Nuclear
> 6,4~ 0,09~ 0,58
Geo-political effects
Security of supply
Proliferation
Major accidents
0,0050,00040,004Crop losses
0,0080,0010,006Material damage
Ecosystem impacts
0,270,030,2Health effects
6,10,060,38Climate change
Lignite CC 48%
Wind 2,5 MW
PV(2030)
>> x
(based on DLR, ISI 2006; study commissioned by the German Ministry of the Environment)
[Source: Krewitt 2007]

Social aspects

21
SOCIAL ASPECTS
Occupation and creation of jobsDirectly in the PV sectorIndirect job creation (e.g. in building sector)
Very high social acceptance of PV“YPIMBY”Innovative design and high aesthetic value possibleEducation and trainingCommunication
NEEDS: MCDA with several social impact indicators

22
VISUAL IMPACTS OF INNOVATIVE PV Screenprinted CIS – La Spezia
Source: PVACCEPT (2005)

ASSESSMENT OF FUTURE PV SYSTEMS

Methodological issues&
Scenario approach

25
METHODOLOGICAL ISSUES
Technology-specificSeveral existing PV technologies have significant improvement potentialImpossible to model technology breakthroughs and unknown technologies
However, methodology should remain open to such options
System-relatedMutual influence between PV technology development path and diffusion scenario(s) and related background systems

26
METHODOLOGICAL ISSUES - SYSTEM
Technology development and performances depend on market diffusion scenarios and background system,e.g:
3rd generation PV devices only under favorable circumstancesVery large penetration of PV can only occur if effective and efficient grid-management and energy storage systems are available
Very large penetration of PV changes the background system
Positive and negative feedbacks possibleThe change of the system significantly changes LCA results
Dynamic or semi-dynamic approach needed

27
PROPOSED SCENARIO APPROACH
1. Technology development pathFactors affecting technological developmentIdentification of max. diffusion potential
2. Technology diffusion scenario analysisPessimistic scenarioOptimistic-realistic scenarioVery optimistic scenario
3. Parametric LCA per each scenarioWithout and with change of background system

28
TECHNOLOGY DEVELOPMENT PATH
PV hot spots Key parameters for LCA
Driving forcesRegulatory framework, distributed generation, technology spillovers, sustainable energy finance, etc.
The anticipated role of PV in a future energy supply system
What can be reached? Development targets for PV up to 2050
Main competitors of PV systems and benchmark technologies
Technology development pathway of PVWhich technology developments are necessary? How likely are these technology developments
Specification of future PV systems in 2050

29
Empirical forecast – S curveBased on:
Available industry and sector roadmapsMarket growth estimatesBenchmark with competing electricity generation technologies
Markal – 3E modeling (2007-08)Direct costs with learning curvesExternal costs
Multi-criteria decision analysis (2007-08)Taking also social criteria into account
SCENARIO FORECASTS - NEEDS
Technologydiffusionscenario
Backgroundsystem
scenario

30
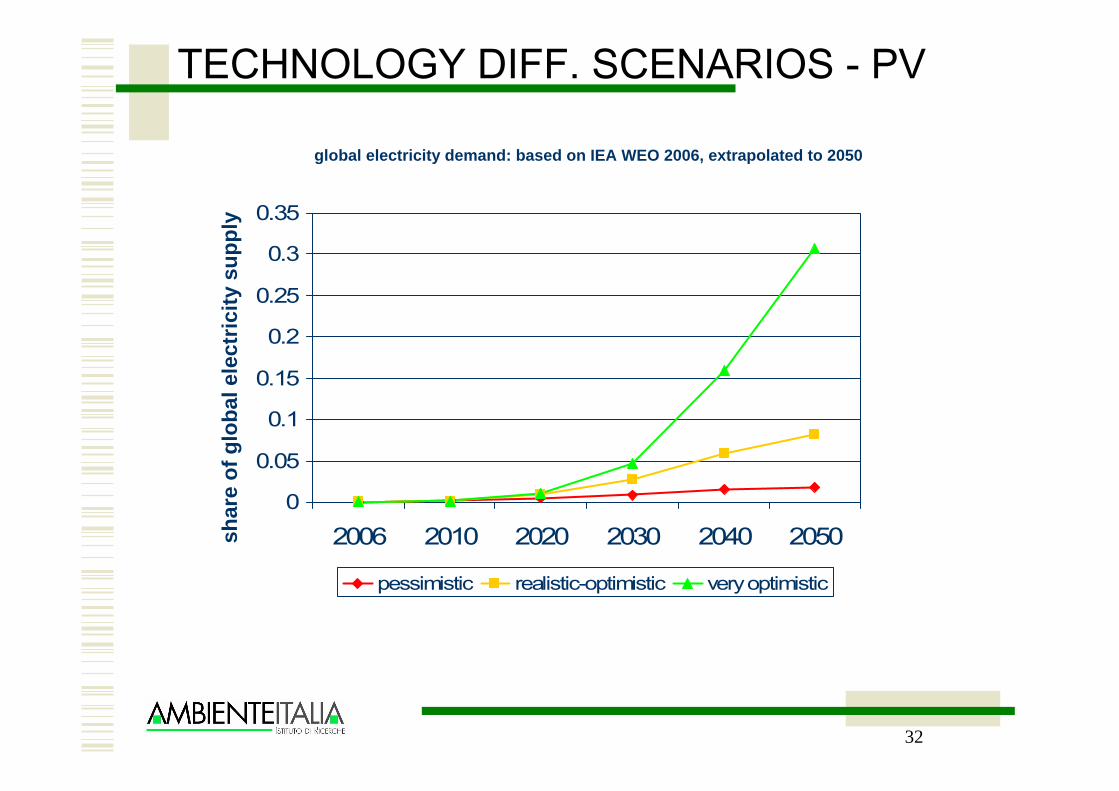
TECHNOLOGY DIFF SCENARIOS - PV‘Pessimistic’
Current incentives for PV will not be supported long enough for the technology to ever become competitive with bulk electricityGrowth severely stunted by 2025
‘Optimistic-realistic’Three different PV co-existing ‘families’ (crystalline Si, thin film, novel devices) Growth according to industry (EPIA) predictions, after 2025 reduced growth rates (GP/EREC scenario)
‘Very optimistic’Market still growing until 2050 (yearly growth rate down to 4%) By mid 2030’s large scale energy storage infrastructure availableVery rapid expansion of PV based on novel technologies after 2025 (technological breakthrough)
50% of total PV market in 2050

31
TECHNOLOGY DIFFUSION SCENARIOS
Key parameter: percentage market growth
“Very Optimistic / Technological Breakthrough” scenario
Year
Yearly installed
capacity
(GWp)
Avg. % annual
market growth rate
Cumulative
installed capacity
(GWp)
Total annual
electricity
production (TWh)
2006 1.9 34% 6.4 6
2010 5.6 21% 22.5 23
2020 44.5 23% 230 290
2025 89 15% 575 720
2030 180 15% 1,270 1,600
2040 388 8% 4,080 5,800
2050 575 4% 8,930 12,700
“Optimistic / Realistic” scenario
Year
Yearly installed
capacity
(GWp)
Avg. % annual
market growth rate
Cumulative
installed capacity
(GWp)
Total annual
electricity
production (TWh)
2006 1.9 34% 6.4 6
2010 5.6 21% 22.5 23
2020 34 19% 206 260
2025 55 11% 434 550
2030 71 5% 755 950
2040 82 1.5% 1,520 2,170
2050 86 0.5% 2,360 3,400
“Pessimistic” scenario
Year
Yearly installed
capacity
(GWp)
Avg. % annual
market growth rate
Cumulative
installed capacity
(GWp)
Total annual
electricity
production (TWh)
2006 1.9 34% 6.4 6
2010 5.6 21% 22.5 23
2020 11 7% 105 130
2025 13 3% 166 210
2030 15 3% 236 300
2040 15 0% 384 550
2050 15 0% 532 760
32
TECHNOLOGY DIFF. SCENARIOS - PV
0
0.05
0.1
0.15
0.2
0.25
0.3
0.35
2006 2010 2020 2030 2040 2050
pessimistic realistic-optimistic very optimistic
shar
eof
glo
bal e
lect
ricity
sup
ply
global electricity demand: based on IEA WEO 2006, extrapolated to 2050

33
TECHNOLOGY SHIFT
c-Si technologiessc-Simc-Si waferc-Si ribbon
Thin films: Amorphous silicon (a-Si)Copper Indium Gallium Diselenide (CIGS)Cadmium Telluride (CdTe)
New concept devices: Ultra-low cost (Dye-sensitized cells, Organic cells)Ultra-high efficiency (3rd generation, Quantum wellNanostructures, Concentrators)

34
Cumulative installed capacity worldwide per technology
0
1000
2000
3000
4000
5000
6000
7000
8000
9000
10000
Present(2006)
2010 2020 2030 2040 2050
Year
GW
Novel DevicesThin Filmsc-Si
GW
p
VERY OPTIMISTIC/BREAKTHROUGH SCEN.
Pre-competitivephase
Peak power1% of supply
Base-load“critical mass”10% of supply
Mass-diffusion3rd generation devStorageFull exploitation of PV benefits “YPIMBY”
Sustained incentives
needed
Cumulative installed capacity
0
5
10
15
20
25
Present (2006) 2010Year
GW
p
Other Thin Films
a-Si Thin Films
c-Si
GW
p

35
P V T e c h n o lo g y M a r k e t S h a r e
0 %1 0 %2 0 %3 0 %4 0 %5 0 %6 0 %7 0 %8 0 %9 0 %
1 0 0 %
2 0 0 3 2 0 1 0 2 0 2 0 2 0 3 0 2 0 4 0 2 0 5 0
Y e a r
Mar
ket S
hare
N o ve l D e vi c e sO t h e r T h in F i lm s T h in F i lm s S i l i c o n T h i n F i lm s C r y s t a l l i n e S i
2025
2050
TECHNOLOGY SHIFT vs. SCENARIO
P V T e c h n o lo g y M a r k e t S h a r e
0 %1 0 %2 0 %3 0 %4 0 %5 0 %6 0 %7 0 %8 0 %9 0 %
1 0 0 %
2 0 0 3 2 0 1 0 2 0 2 0 2 0 3 0 2 0 4 0 2 0 5 0
Y e a r
Mar
ket S
hare
N o ve l D e vi c e sO t h e r T h in F i lm s T h in F i lm s S i l i c o n T h i n F i lm s C r y s t a l l i n e S i
Optimistic-realistic
2050
2025
Pessimistic

36
Technology specification vs. scenarios
Cum. Capacity GWp
sc-Si mc-Si ribbon a-Si CIS CdTe sc-Si mc-Si ribbon (thick)
ribbon (thin) a-Si CIS CdTe DSC Conc Q-cell sc-Si mc-Si ribbon
(thick)ribbon (thin) a-Si CIS CdTe DSC Conc Q-cell
c-Si layer thickness um 250 250 300 100 100 150 100 100 100 100 50Module efficiency 14% 13% 11% 10% 10% 9% 22% 20% 20% 12% 15% 20% 18% 10% 35% 35% 28% 25% 25% 16% 20% 25% 22% 17% 50% 50%Module techn. life years 10 30 30 15 45 45Installed capacity GWp Share of market %Cost €/Wp
Cum. Capacity GWp
sc-Si mc-Si ribbon a-Si CIS CdTe sc-Si mc-Si ribbon (thick)
ribbon (thin) a-Si CIS CdTe DSC Conc Q-cell sc-Si mc-Si ribbon
(thick)ribbon (thin) a-Si CIS CdTe DSC Conc Q-cell
c-Si layer thickness um 250 250 300 100 100 150 100 100 100 100 50Module efficiency 14% 13% 11% 10% 10% 9% 22% 20% 20% 12% 15% 20% 18% 10% 35% 35% 25% 22% 22% 14% 18% 25% 22% 15% 40% 40%Module techn. life years 10 30 30 10 35 35Installed capacity GWp Share of market %Cost €/Wp
Cum. Capacity GWp
sc-Si mc-Si ribbon a-Si CIS CdTe sc-Si mc-Si ribbon (thick)
ribbon (thin) a-Si CIS CdTe DSC Conc Q-cell sc-Si mc-Si ribbon
(thick)ribbon (thin) a-Si CIS CdTe DSC Conc Q-cell
c-Si layer thickness um 250 250 300 150 150 200 150 100 100 150 100Module efficiency 14% 13% 11% 10% 10% 9% 17% 14% 14% 12% 10% 14% 12% 22% 18% 18% 12% 15% 18% 16% 10% 35% 35%Module techn. life years 10 30 30Installed capacity GWp Share of market %Cost €/Wp
Technology
Technology
Technology
V.Optimistic
Opt. / Realistic
Pessimistic
5.3 1.5
25
25
35
35
30
25
0
N/A
1.0
5.3 1.0 0.4
5.3 1.1 0.6
N/A
30
25
25
25
30
30
25
N/A
35
29045% 5%
720
N/A N/A
novel devices430
N/A
N/A N/A N/A N/A
22050%
0.3 19045%
N/A N/A N/A
45001300 310040
2050
50%
N/AN/A
N/A
15% 35%
2050
35%205%
24045%
05%0%
27050%
14085%
3015%
2.790%
2.790%
3
2.790%
0.310%
Present 2025 2050
crystalline-Si thin films novel devicesthin films crystalline-Si thin films3
novel devicescrystalline-Si
Present 2025 2050
0.310% 50%
260
N/A
thin films
2025Present
570 8 900
2 400crystalline-Si thin films crystalline-Si thin films
novel devices3 170 530
crystalline-Si thin films crystalline-Si thin films novel devices crystalline-Si
crystalline-Si thin films novel devices
10%84030%
84035%
40 35

Preliminary LCI results

38
METHOD
1. Identify technology hot-spots and key parameters influencing LCA results
2. Parametric LCA model3. Technological improvement –
experience and industry roadmaps4. Technology diffusion scenario
Exogenous variable, possibly based on economic learning curves
5. Technological improvement matrix for each technology and scenario

39
METHOD – cont.
6. Screening analysis and preliminary LCI results
7. Uncertainty calculation8. Choice of average or selected
representative results9. Final results vs. time with adapted
background systemPossibly semi-dynamic modelling
10. Final results vs. capacity – “Environmental learning curve”
Specific environmental impact vs. cumulative installed capacity

40
Key parameters for PV systems
Module efficiency Module lifetimeMaterial resource consumption
kg/Wp of semiconductor feedstock
Energy resource consumptionkWhel/Wp of semiconductor feedstock kg/Wp of fuels
Non recyclable wasteKg/Wp of waste (dangerous and not, radioactive)
BOS performance ratio in function ofApplicationLocation

41
source: Goetzberger (2002)
EX: PV EFFICIENCY INCREASEExperience and forecast

42
ASSUMPTION: TECHNOLOGY DIFFUSION SCENARIO
0
0.05
0.1
0.15
0.2
0.25
0.3
0.35
2006 2010 2020 2030 2040 2050
pessimistic realistic-optimistic very optimistic
shar
eof
glo
bal e
lect
ricity
sup
ply
global electricity demand: based on IEA WEO 2006, extrapolated to 2050

43
TECH MATRIX: Ribbon c-Si (v.optim)
Sent to external experts for review and approvalEPIA, companies, experts
KEY PARAMETERS Unit
Module efficiencyModule technical life yThicknessMaterials (technology specific) Material content Consumption Material content Consumption Material content Consumption
poly Si g/m2770 917 350 390 230 240
graphite g/m214 11 (-20%) 10 (-30%)
argon g/m24380 3500 (-20%) 3100 (-30%)
Encapsulation materialsglass g/m2
8080 6000 6000
EVA (Ethyl Vinyl Acetate) g/m21000 1000 1000
Tedlar g/m2256 256 256
Production material yield
Electricity consumption (direct) kWh/m2
Data from literatureAdapted from literatureEstimate/assumptionCalculated
20% (EPIA 2006)
45.7
35 (PVTRAC)
84%
330 150
36.6 (-20%)
90%
Present (Crystalclear 2005) Future 2025
96%
32 (-30%)
100
Future 2050
25%50
11%25

44
TECH MATRIX: DSC (v.optimistic)
KEY PARAMETERS Unit
Module efficiencyModule technical life yMaterials (technology specific) Material content Consumption Material content Consumption Material content Consumption
tin g/m21.9 (*) (*)
metalization paste g/m27.2 (*) (*)
TiO2 g/m216 (*) (*)
Terpineol in TiO2 screen print paste g/m250 (*) (*)
ethylcellulose in TiO2 synthesis g/m23.5 (*) (*)
Ruthenium g/m20.1 (*) (*)
acetonitrile g/m220 (*) (*)
Platiunum g/m20.05 (*) (*)
Polyethilene g/m220 (*) (*)
Poliester resin g/m220 (*) (*)
Iodine (electrolyte) g/m20.45 (*) (*)
Encapsulation materialsSolar glass g/m2
15000 12000 -
Poly-Ethylene Terephtalate (PET) g/m2- - 175
Electricity consumption (direct) kWh/m2
Data from literatureAdapted from literatureEstimate/assumption
(*) = due to the large uncertainty associated to this new technology, it is impossible to make reliable predictions onthe quality and quantity of the technology-specific material inputs
13
Present(Veltkamp & de Wild-Schoelten 2006)
Future 2025
5-6% (NEDO 2004)5
10% (NEDO 2004)10
10.4 9.1
Future 2050
17%15
45
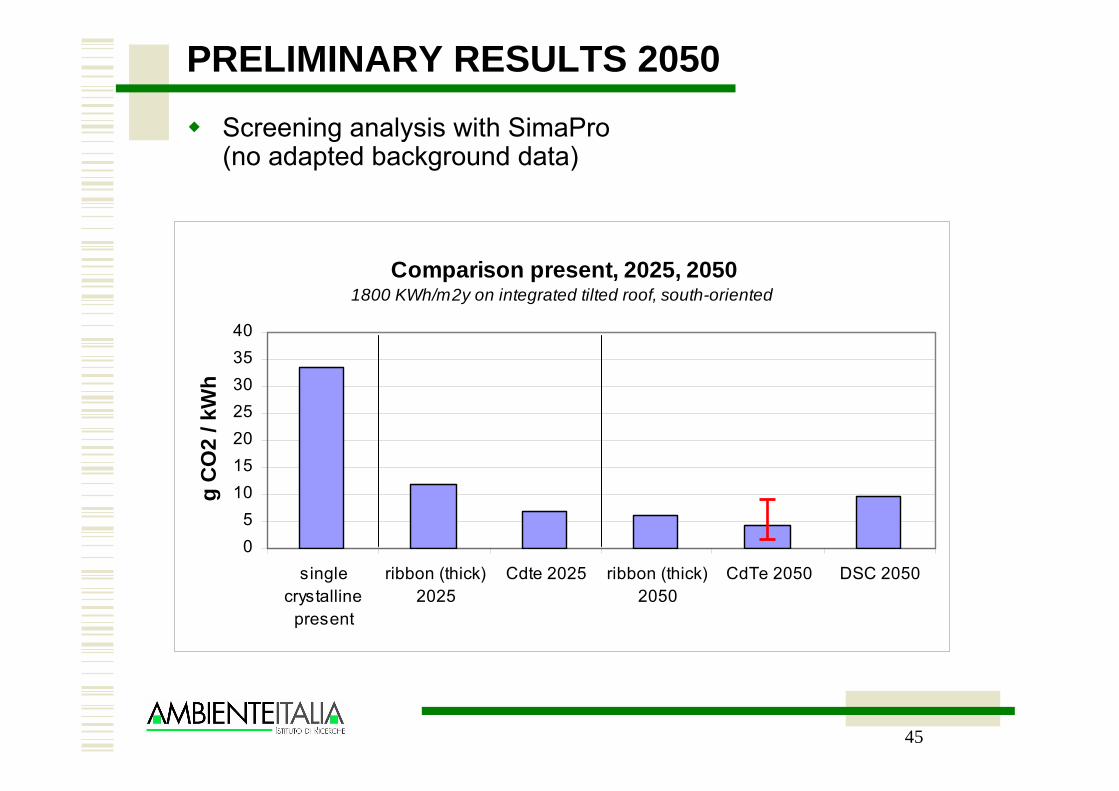
Comparison present, 2025, 20501800 KWh/m2y on integrated tilted roof, south-oriented
05
10152025303540
singlecrystalline
present
ribbon (thick)2025
Cdte 2025 ribbon (thick)2050
CdTe 2050 DSC 2050
g C
O2
/ kW
h
PRELIMINARY RESULTS 2050
Screening analysis with SimaPro(no adapted background data)

46
GWP PAST PRESENT AND FUTURE PV SYSTEMS
0,00
50,00
100,00
150,00
200,00
250,00
PAST - mc-si, retrofit roof PRESENT - mc-si, retrofitroof
FUTURE - CIGS,integrated roof
g CO
2/kW
h el
End of lifeBOS mecBOS elFrameModule
INNOVATION AND LEARNING EFFECTSPreliminary results
IP-Project NEEDS - New Energy Externalities Developments for Sustainability (2004-08)
[mid-90’ dataSource: Eclipse 2003]
[2004 CRYSTALCLEAR data + estimateSource: NEEDS 2006]
GWP of future CIGS systems
0
2
4
6
8
10
12
Future CIGS - 25%, integrated roof, 35y, 1800 kWh/m2gC
O2e
q/kW
h
gCO2/kWh

47
NEXT STEPS
Adapted background system per each scenario
Electricity mix, main materials, transports, wastePossibly dynamic or semi-dynamic consistent background system analysis
NEEDS: Energy system Markal modelling taking into account learning curves (direct and external costs) of all renewable energy technologies, advanced fossil and nuclearInertia of energy system taken into account
BAU-REFPessimistic
450 ppmVery optimistic550 ppmOptimistic-realistic
Markal scenarioTechnology scen
48
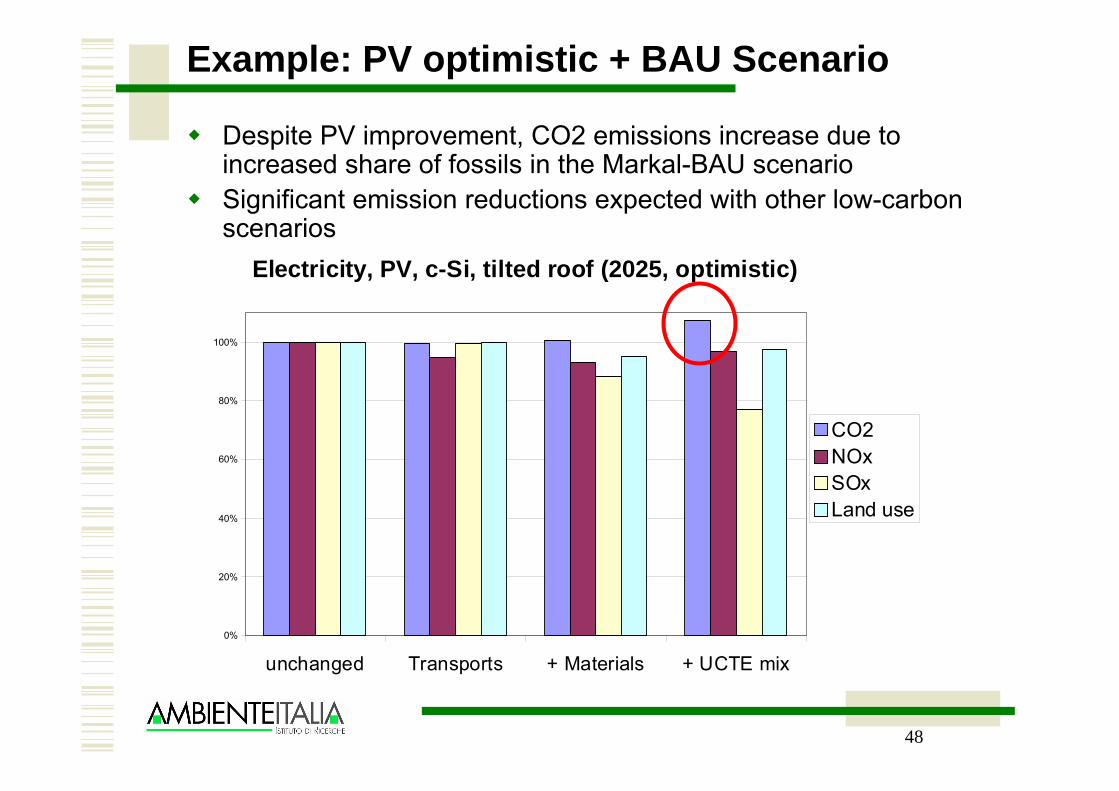
Example: PV optimistic + BAU Scenario
Despite PV improvement, CO2 emissions increase due to increased share of fossils in the Markal-BAU scenarioSignificant emission reductions expected with other low-carbon scenarios
Electricity, PV, c-Si, tilted roof (2025, optimistic)
0%
20%
40%
60%
80%
100%
unchanged Transports + Materials + UCTE mix
CO2NOxSOxLand use

49
RECOMMENDATIONS
Show results bothWithout changing background system, in order to highlight technology-specific improvementsWith adapted background system, in order to identify possible positive and negative feedbacks
Always present contribution analysisElectricity mix
Start with UCTE mix, Allow regional mixes (import) and/or national mixes
Main materialsTransportsWaste

50
Example contribution analysis
CdTe 2050 + BAU background system1 MJ
electricity,photovoltaic, tilted
roof, CdTe,100%
4.22E-6 p1 kWp tilted roof
installation, CdTe,on roof 2050
91.4%
1.92E-5 m2photovoltaic
opaque module,frameless, Cdte
38.3%
0.000179 kgSolar glass,low -iron, at
regional8.79%
0.00261 MJElectricity, mediumvoltage, productionUCTE, at grid/UCTE26.9%
1.92E-5 m2tilted roof
contruction,integrated
25.6%
4.22E-6 pinverter, 1,5 kW, at
plant
20.4%
4.22E-6 pelectric installation,
photovoltaicsystem in
7.09%
4.22E-6 pdisposal, tiltedroof, integrated
8.61%
2.96E-5 kgDisposal, plastics,
mixture, 15.3%w ater, to municipal5.5%

51
SUMMARY – ENVIR. LEARNING CURVE
Techn Hot-spotsAnd
Key parameters
LCI
XpEnd of life - Sha re s
RER: LANDFILLHOUSING OFFICE
R ER: LANDFILLMONITOR CRT
RER: LANDFILLMONITOR TFT
RER: LANDFILL PCWITHOUT HOUSINGOFFICE
INCINERATIONMONITOR TFT
INCINERATIONMONITOR CRT
INCINERATIONHOUSING
INCINER ATION PCWITHOUT MONITOR
pR ECYCLING PCWITHOUT HOUSING
pRECYCLING HOUSING
pRECYCLING MONITORCRT
pRECYCLING MONITORTFT
CO2 CH4
CFCs
UV - radiation
AbsorptionReflection
Infraredradiation
Trace gases i n the a tmosphe re
Waste water
Air pollution
Fertilisation
PO4-3
NO3-
NH4+
NOXN2O
NH3
Waste water
Air pollution
Fertilisation
PO4-3
NO3-
NH4+
NOXN2O
NH3
SO2
NOX
H2SO44
HNO3
CFCsNitrogen oxide
Stratosphere15 - 50 km Absorption Absorption
UV - radiation
CFCsNitrogen oxide
Stratosphere15 - 50 km Absorption Absorption
UV - radiation
HydrocarbonsNitrogen oxides
Dry and warmclimate
Hydrocarbons
Nitrogen oxides
Ozone
HydrocarbonsNitrogen oxides
Dry and warmclimate
Hydrocarbons
Nitrogen oxides
Ozone
LCIAGeneric Modules
Product system modelling Environmental evaluation
2
LCA
pLCI
XpEnd of life - Sha re s
RER: LANDFILLHOUSING OFFICE
R ER: LANDFILLMONITOR CRT
RER: LANDFILLMONITOR TFT
RER: LANDFILL PCWITHOUT HOUSINGOFFICE
INCINERATIONMONITOR TFT
INCINERATIONMONITOR CRT
INCINERATIONHOUSING
INCINER ATION PCWITHOUT MONITOR
pR ECYCLING PCWITHOUT HOUSING
pRECYCLING HOUSING
pRECYCLING MONITORCRT
pRECYCLING MONITORTFT
CO2 CH4
CFCs
UV - radiation
AbsorptionReflection
Infraredradiation
Trace gases i n the a tmosphe re
Waste water
Air pollution
Fertilisation
PO4-3
NO3-
NH4+
NOXN2O
NH3
Waste water
Air pollution
Fertilisation
PO4-3
NO3-
NH4+
NOXN2O
NH3
SO2
NOX
H2SO44
HNO3
CFCsNitrogen oxide
Stratosphere15 - 50 km Absorption Absorption
UV - radiation
CFCsNitrogen oxide
Stratosphere15 - 50 km Absorption Absorption
UV - radiation
HydrocarbonsNitrogen oxides
Dry and warmclimate
Hydrocarbons
Nitrogen oxides
Ozone
HydrocarbonsNitrogen oxides
Dry and warmclimate
Hydrocarbons
Nitrogen oxides
Ozone
LCIAGeneric Modules
Product system modelling Environmental evaluation
2
LCA
p
TECHNOLOGY mc-Si: multi-crystalline Literature dataEstimated dataCalculated data
KEY PARAMETERS Unit 2005 2010 2020 2030 2040 2050
Module efficiency % 13,2% 16,0% 18,0% 21,0% 23,0% 25,0%Module technical life years 25,00 30,00 35,00 40,00 45,00 50,00
Material consumption
Silicon External Feedstock
(mass/kWp)kg/kWp 12,82 7,82 3,91 3,15 2,90 2,76
Wafer thickness µm 300,00 180,00 100,00 100,00 100,00 100,00Kerf loss µm 200,00 160,00 150,00 150,00 150,00 150,00
Environmental impact g CO2 eq/ kWhel 31,00 23,25 - - - 11,00
MJ/kWp 26.515 19.886 - - - 13.800
Cost/Prices (module) €/Wp 3,00 2,00 1,00 0,70 0,60 0,50
0
50
100
150
200
250
300
1,E-02
1,E-01
1,E+0
01,E
+01
1,E+0
21,E
+03
1,E+0
51,E
+06
1,E+0
81,E
+09
Cumulative Installed Capacity
Spec
ific
Envi
ronm
enta
l Im
pact
Technology 2 maxTechnology 2 minTechnology 1 maxTechnology 1 min
Tech. 1 - ConventionalTech. 1 - Conventional
Tech. 2 - NewTech. 2 - New

52
“ENVIRONMENTAL LEARNING CURVE”
Independent from actual diffusion speedAlways report uncertainty
0
50
100
150
200
250
300
1,E-02
1,E-01
1,E+0
01,E
+01
1,E+0
21,E
+03
1,E+0
51,E
+06
1,E+0
81,E
+09
Cumulative Installed Capacity
Spec
ific
Envi
ronm
enta
l Im
pact
Technology 2 maxTechnology 2 minTechnology 1 maxTechnology 1 min
Tech. 1 - Conventional
Tech. 2 - New
Long-term policy decisions have to be made on expected future impacts, despite uncertainty

Preliminary economic results

54
PV Learning CurvesPV system Geographical
area
Time period PR Source
PV modules
(crystalline silicon)
Japan
1979-1988 79% (Tsuchiya, 1992)
PV modules USA 1976-1988 78% (Cody and Tiedje, 1997)
PV modules USA 1976- 1992 82% (Williams and Terzian, 1993)
PV modules Japan 1981-1995 80% (Watanabe, 1999?)
PV modules
1981-2000 77% (Parente et al., 2002) (data
source unknown)
PV modules
1968-1998 80% (Harmon, C. 2000) (several
different data source)
PV modules
(crystalline silicon)
1976-1996 84%,
53%,79%
(OECD/IEA 2000: based on the
EU atlas project and Nitsch
1998)
PV modules Germany app. 90% (Schaeffer et al., 2004)
PV modules
the Netherlands app. 90% (Schaeffer et al., 2004)
PV modules Globally* 1976-2001 75-80% (Schaeffer et al., 2004)
PV BOS Germany 1992-2001 78% (Schaeffer et al., 2004)
PV BOS The Netherlands 1992-2001 81% (Schaeffer et al., 2004)
74% Maycock, 2002, in Nemet
PV modules 1976-2001
1987-2001
80%
77%
Strategies Unlimited, in
Schaeffer et al., 2004
Average learning rate (LR=1-PR):20%

55
PV Learning Curve and cost reduction
Source: (PHOTEX 2004, as retrieved in PV-TRAC 2005)
Source: EPIA 2004
Average learning rate (LR=1-PR):20%

56
PV direct cost reduction vs. scenario
PV system cost reduction
0
1
2
3
4
5
6
7
2000 2010 2020 2030 2040 2050 2060
Year
€/W
p
Pessimistic Optimistic / Realistic V. Optimistic / Techn. Breakthrough
2010: 3 - 3.5 €/Wp (PV-TRAC)
2020: 2 €/Wp (PV-TRAC)
2030: 1 €/Wp (PV-TRAC)
2040: < 1 €/Wp (PV-TRAC)
2004: 5 €/W p (PV-TRAC)
LR 20% throughout the whole periodMost optimistic scenario has techn. breakthrough in 2030Other two scenarios: diffusion is limited but LR is the sameSensitivity analysis: LR =10% after 2030 carried out

57
Some German studies (2001): up to 1,7 c€/kWh
ExternE for Germany (EC brochure 2003) : 0,6 c€/kWh
Alsema & Fhtenakis (2005):Externe-Pol damage factorsmc-Si: 0,17 c€/kWhCdTe: 0,13 c€/kWh
NEEDS (on-going): revision and refinement of specific emission damage factors and costs
First estimate future PV systems: 0,02-0,08 c€/kWh
EXTERNAL COSTS OF PV

58
Very large uncertainty dominated by different estimates of impacts of climate change
Several important environmental issues not quantifiable with current state-of-the art of external costs
At least qualitative “warning flags” needed
Important valuable additional information, but limits must be clearly expressed
EXTERNAL COSTS OF PV

PRELIMINARY CONCLUSIONS
60
PRELIMINARY CONCLUSIONS
SAT and proposed approach certainly feasible to assess PV systems
Not looking just at marginal impactsAssessment of absolute large-scale impacts through semi-dynamic scenario analysis
Trade-off between precision of assessment and long-term uncertainty
Goal and objectives of SAT to be clearly definedLong-term implications crucial for policy-making, despite intrinsic uncertainties
Existing PV technologies have major improvement potential
Distinction between level-1 and level-2 might be further discussed