Embed Size (px)
Citation preview

7/28/2019 Suspensions and Expulsions in Connecticut June 2013
http://slidepdf.com/reader/full/suspensions-and-expulsions-in-connecticut-june-2013 1/61
CONNECTICUT STATE DEPARTMENT OF EDUCATION
Suspensions and Expulsions in
Connecticut Connecticut State Department of Education (CSDE)
State Board of Education Meeting, June 5, 2013
1
7/28/2019 Suspensions and Expulsions in Connecticut June 2013
http://slidepdf.com/reader/full/suspensions-and-expulsions-in-connecticut-june-2013 2/61
CONNECTICUT STATE DEPARTMENT OF EDUCATION
Questions
• What discipline data are collected by the CSDE?
• What is the trend for the three important sanctions of in-
school suspension (ISS), out-of-school suspensions (OSS), and
expulsions in Connecticut over the past five years?
• Of the total number of suspensions, what is the percentage
of ISS, OSS and Expulsion within the different districtcategories?
• Who is suspended/expelled? Do suspensions rates vary bygrade, race, gender? Also, are there differences among thesesubgroups within different district categories (e.g., Ed-Reform,Charter, RESC)? 2

7/28/2019 Suspensions and Expulsions in Connecticut June 2013
http://slidepdf.com/reader/full/suspensions-and-expulsions-in-connecticut-june-2013 3/61
CONNECTICUT STATE DEPARTMENT OF EDUCATION
Questions (cont’d)
• How long do suspensions and expulsions last? What do the
data say regarding the rate of suspensions and the length of
sanctions for the various district categories?
• Why are students being suspended/expelled? What types of incidents are resulting in suspensions/expulsions? Do these
vary by district categories?
• What percent of children suspended in kindergarten return to the same school/district in the following year?
• What actions is the CSDE taking to turn the curve on
discipline issues? 3

7/28/2019 Suspensions and Expulsions in Connecticut June 2013
http://slidepdf.com/reader/full/suspensions-and-expulsions-in-connecticut-june-2013 4/61
CONNECTICUT STATE DEPARTMENT OF EDUCATION
Definitions per C.G.S. 10-233a
• Removal “means an exclusion from a classroom for all or part
of a single class period, provided such exclusion shall not
extend beyond ninety minutes.”
• In-school suspension “means an exclusion from regular
classroom activity for no more than ten consecutive school
days, but not exclusion from school…”
• Out-of-School suspension “means an exclusion from school
privileges or from transportation services only for no more
than ten consecutive school days…”
• Expulsion “means an exclusion from school privileges for more
than ten consecutive school days…” 4
7/28/2019 Suspensions and Expulsions in Connecticut June 2013
http://slidepdf.com/reader/full/suspensions-and-expulsions-in-connecticut-june-2013 5/61
CONNECTICUT STATE DEPARTMENT OF EDUCATION
Background
• October 2008 – Original CSDE Guidelines for ISS and OSS
• CSDE provided workshops to assist districts in implementation
• District feedback indicated an interest in gaining ideas and guidance fordeveloping effective ISS programs.
• Districts expressed an appreciation for the inclusion of case studies andsought additional scenarios to help inform and guide the decision-makingprocess.
• Guidelines revised in December 2010 to help districts implementConnecticut General Statutes Section 10-233c.
• Section 10-233c aims to lower the number of students who are suspendedfrom school by setting new standards for sending students home for violating
school or district rules.• The law is not meant to take away a district’s prerogative or need to remove
students from school, but rather to urge administrators to think carefullyabout their decisions, and to find ways to keep students connected to schoolby placing them in programs designed to keep them learning, while stillholding them accountable for improper behavior.
5

7/28/2019 Suspensions and Expulsions in Connecticut June 2013
http://slidepdf.com/reader/full/suspensions-and-expulsions-in-connecticut-june-2013 6/61
CONNECTICUT STATE DEPARTMENT OF EDUCATION
Subsection (g) of C.G.S. Section 10-233c
• “Suspensions pursuant to this section shall be in-school
suspensions, unless during the hearing held pursuant to
subsection (a) of this section, (1) the administration
determines that the pupil being suspended poses such a
danger to persons or property or such a disruption of theeducational process that the pupil shall be excluded from
school during the period of suspension, or (2) the
administration determines that an out-of-school suspension is
appropriate for such pupil based on evidence of (A) previous
disciplinary problems that have led to suspensions orexpulsion of such pupil, and (B) efforts by the administration
to address such disciplinary problems through means other
than out-of school suspension or expulsion, including positive
behavioral support strategies.”
6

7/28/2019 Suspensions and Expulsions in Connecticut June 2013
http://slidepdf.com/reader/full/suspensions-and-expulsions-in-connecticut-june-2013 7/61CONNECTICUT STATE DEPARTMENT OF EDUCATION
What data are collected?
• Discipline data are collected at the incident level. For example, if 10th grader Matthew brings a knife to school and receives an out-of-school suspension, that would be reported to the CSDE as onedisciplinary incident (type of incident would be “weapon”) thatresulted in one sanction (i.e., out of school suspension).
•The State Assigned Student Identifier (SASID) is collected andverified against PSIS for each student involved in each incident; thisensures data integrity and provides additional data.
• Information regarding the location of the incident, the number of days sanctioned, whether the student was arrested, and whetherthe incident was a bullying incident (beginning with 2012-13) arealso collected.
• Districts are expected to report to the CSDE any incident that resultsin an ISS, OSS or Expulsion as well as any incident that is deemed aserious incident. 7

7/28/2019 Suspensions and Expulsions in Connecticut June 2013
http://slidepdf.com/reader/full/suspensions-and-expulsions-in-connecticut-june-2013 8/61CONNECTICUT STATE DEPARTMENT OF EDUCATION
What data are collected? (cont’d)
• Collecting data at this granular level enables determination of:
• the frequency and triggers for disciplinary incidents;
• the types of sanctions used for those incidents; and
• the actual unduplicated count of students involved in one or
more incidents.
• Both incident/sanction level data and the unduplicated
number of students involved in those incidents are needed to
fully understand the disciplinary practices of a school.
• For example, Caleb received two in-school suspensions (one in
week 10 and another in week 20) and then received one out-
of-school suspension (in week 30) from his school; this would
be counted as three sanctions but only one student.8

7/28/2019 Suspensions and Expulsions in Connecticut June 2013
http://slidepdf.com/reader/full/suspensions-and-expulsions-in-connecticut-june-2013 9/61CONNECTICUT STATE DEPARTMENT OF EDUCATION
TREND IN ISS, OSS AND EXPULSIONS
9

7/28/2019 Suspensions and Expulsions in Connecticut June 2013
http://slidepdf.com/reader/full/suspensions-and-expulsions-in-connecticut-june-2013 10/61CONNECTICUT STATE DEPARTMENT OF EDUCATION
Total Number of Sanctions (ISS, OSS, and
Expulsions) (duplicated count)
0
20,000
40,000
60,000
80,000
100,000
120,000
140,000
160,000
2007-08 2008-09 2009-10 2010-11 2011-12
10

7/28/2019 Suspensions and Expulsions in Connecticut June 2013
http://slidepdf.com/reader/full/suspensions-and-expulsions-in-connecticut-june-2013 11/61CONNECTICUT STATE DEPARTMENT OF EDUCATION
Total Number of Sanctions Disaggregated by ISS,
OSS, and Expulsions (duplicated count)
0
10,000
20,000
30,000
40,000
50,000
60,000
70,000
80,000
90,000
2007-08 2008-09 2009-10 2010-11 2011-12
ISS
OSS
Expulsion
11

7/28/2019 Suspensions and Expulsions in Connecticut June 2013
http://slidepdf.com/reader/full/suspensions-and-expulsions-in-connecticut-june-2013 12/61CONNECTICUT STATE DEPARTMENT OF EDUCATION
Unduplicated Number of Students Receiving at
least one ISS, OSS, or Expulsion
55,64453,339
50,77547,790 47,528
0
10000
20000
30000
40000
50000
60000
2007-08 2008-09 2009-10 2010-11 2011-12
12

7/28/2019 Suspensions and Expulsions in Connecticut June 2013
http://slidepdf.com/reader/full/suspensions-and-expulsions-in-connecticut-june-2013 13/61CONNECTICUT STATE DEPARTMENT OF EDUCATION
Trend Observations
• The total number of ISS, OSS and Expulsions has reduced by about14% over the past ve years from 1͌40,000 in 2007-08 to 1͌20,000 in2011-12.
• The total number of OSS has reduced by about 39% from 7͌0,000to 4͌3,000 over the same five-year period.
• Conversely, the number of ISS has increased by over 8% during thesame period; much of the increase occurred in the second year(2008-09), the year when the original guidelines were released.
• The unduplicated count of PK-12 students receivingsuspensions/expulsions has declined by 14.6% from 55,644 in 2007-08 to 47,528 in 2011-12.
• Overall, 8.6% of students received at least one ISS, OSS or expulsionin 2011-12.
13

7/28/2019 Suspensions and Expulsions in Connecticut June 2013
http://slidepdf.com/reader/full/suspensions-and-expulsions-in-connecticut-june-2013 14/61CONNECTICUT STATE DEPARTMENT OF EDUCATION
In-depth Analyses for 2011-12:
District Categories
• Educational (ED) Reform Districts — 10 districts with the lowestperformance statewide. They are Bridgeport, East Hartford,Hartford, Meriden, New Britain, New Haven, New London, Norwich,Waterbury and Windham. These districts are also consideredAlliance Districts
• Non Ed-Reform Alliance Districts — There are 30 total AllianceDistricts. In addition to the 10 ED Reform Districts, this categoryincludes Ansonia, Bloomfield, Bristol, Danbury, Derby, East Haven,East Windsor, Hamden, Killingly, Manchester, Middletown,Naugatuck, Norwalk, Putnam, Stamford, Vernon, West Haven,
Winchester, Windsor and Windsor Locks.
• All Other LEAs — All remaining local and regional school districts
• Regional Education Service Centers (RESC) — ACES, CES, CREC,EASTCONN, Education Connection, and LEARN
14

7/28/2019 Suspensions and Expulsions in Connecticut June 2013
http://slidepdf.com/reader/full/suspensions-and-expulsions-in-connecticut-june-2013 15/61CONNECTICUT STATE DEPARTMENT OF EDUCATION
In-depth Analyses for 2011-12:
District Categories
• Public Charter Schools
• Endowed Academies – They are Norwich Free Academy, The
Gilbert School and Woodstock Academy
• Connecticut Technical High School System
• State School Districts which includes the Unified District #1
(Department of Corrections), Unified District #2 (Department
of Children and Families) and Unified District #3 (Department
of Developmental Services).
15

7/28/2019 Suspensions and Expulsions in Connecticut June 2013
http://slidepdf.com/reader/full/suspensions-and-expulsions-in-connecticut-june-2013 16/61CONNECTICUT STATE DEPARTMENT OF EDUCATION
WHAT SANCTIONS ARE STUDENTSRECEIVING?
16

7/28/2019 Suspensions and Expulsions in Connecticut June 2013
http://slidepdf.com/reader/full/suspensions-and-expulsions-in-connecticut-june-2013 17/61CONNECTICUT STATE DEPARTMENT OF EDUCATION
Percent of Sanctions by District Category
0%
10%
20%
30%
40%
50%
60%
70%
80%
90%
100%
Statewide Ed-Reform Non Ed-
Reform
Alliance
All Other
Districts
RESC Public
Charters
Endowed
Academies
CT
Technical
High
Schools
State
School
Districts
ISS OSS Expulsion
17

7/28/2019 Suspensions and Expulsions in Connecticut June 2013
http://slidepdf.com/reader/full/suspensions-and-expulsions-in-connecticut-june-2013 18/61
CONNECTICUT STATE DEPARTMENT OF EDUCATION
Districts Where a Significantly High
Percentage of Total Sanctions were OSS
18
(only districts with at least 20 total sanctions are included)
District Name % of Total Sanctions that were OSS
New Beginnings Inc. Family Academy District 97.8%
Elm City College Preparatory School 82.0%
The Bridge Academy District 81.3%
New Haven School District 80.1%
Salem School District 69.2%
Cooperative Educational Services 68.9%
Integrated Day Charter School District 64.0%
Stamford School District 63.8%
Bolton School District 61.9%
Achievement First Hartford Academy Inc. 61.1%
Hartford School District 58.8%
Area Cooperative Educational Services 58.3%
Regional School District 09 57.1%
Unified School District #2 54.9%

7/28/2019 Suspensions and Expulsions in Connecticut June 2013
http://slidepdf.com/reader/full/suspensions-and-expulsions-in-connecticut-june-2013 19/61
CONNECTICUT STATE DEPARTMENT OF EDUCATION
WHO IS BEING SUSPENDED/EXPELLED?
This section looks at the unduplicated count of students
who are being suspended and/or expelled
19

7/28/2019 Suspensions and Expulsions in Connecticut June 2013
http://slidepdf.com/reader/full/suspensions-and-expulsions-in-connecticut-june-2013 20/61
CONNECTICUT STATE DEPARTMENT OF EDUCATION
Suspension/Expulsion Rate
,
ℎ
20

7/28/2019 Suspensions and Expulsions in Connecticut June 2013
http://slidepdf.com/reader/full/suspensions-and-expulsions-in-connecticut-june-2013 21/61
CONNECTICUT STATE DEPARTMENT OF EDUCATION
Suspension/Expulsion Rates by Grade Range
3.0%
11.5%14.8%
State Average
0%
5%
10%
15%
20%
25%
30%
35%
40%
45%
50%
Elementary
(PK-5)
Middle
(6-8)
High
(9-12)
21

7/28/2019 Suspensions and Expulsions in Connecticut June 2013
http://slidepdf.com/reader/full/suspensions-and-expulsions-in-connecticut-june-2013 22/61
CONNECTICUT STATE DEPARTMENT OF EDUCATION
Suspension/Expulsion Rates in the Elementary
Grades (PK-5) by District Category
7.7%
2.5%0.9% 1.8%
14.2%
0%
5%
10%
15%
20%
25%30%
35%
40%
45%
50%
Ed-Reform Non Ed-
Reform
Alliance
All Other
Districts
RESC Public
Charters 22

7/28/2019 Suspensions and Expulsions in Connecticut June 2013
http://slidepdf.com/reader/full/suspensions-and-expulsions-in-connecticut-june-2013 23/61
CONNECTICUT STATE DEPARTMENT OF EDUCATION
Suspension/Expulsion Rates in the Middle
Grades (6-8) by District Category
26.1%
13.0%
5.6%
13.1%
25.8%22.9%
27.8%
0%
5%
10%
15%
20%
25%
30%
35%
40%
45%
50%
Ed-Reform Non Ed-
Reform
Alliance
All Other
Districts
RESC Public
Charters
Endowed
Academies
State
School
Districts
23

7/28/2019 Suspensions and Expulsions in Connecticut June 2013
http://slidepdf.com/reader/full/suspensions-and-expulsions-in-connecticut-june-2013 24/61
CONNECTICUT STATE DEPARTMENT OF EDUCATION
Suspension/Expulsion Rates in the Higher
Grades (9-12) by District Category
29.8%
17.4%
8.5%11.0%
18.5%
13.1%
25.4%
6.2%
0%
5%
10%
15%
20%
25%30%
35%
40%
45%
50%
Ed-Reform Non Ed-
Reform
Alliance
All Other
Districts
RESC Public
Charters
Endowed
Academies
CT
Technical
High
Schools
State
School
Districts24

7/28/2019 Suspensions and Expulsions in Connecticut June 2013
http://slidepdf.com/reader/full/suspensions-and-expulsions-in-connecticut-june-2013 25/61
CONNECTICUT STATE DEPARTMENT OF EDUCATION
Districts with High Suspension/Expulsion Rates
25
Elementary (PK-5) Middle (6-8) High (9-12)
District Name
% of Students
Receiving
at least one
ISS, OSS or
Expulsion
District Name
% of
Students
Receiving
at least one
ISS, OSS or
Expulsion
District Name
% of
Students
Receiving
at least one
ISS, OSS or
Expulsion
Achievement First Hartford Academy Inc. 32.5% Achievement First Hartford Academy Inc. 49.4% Lisbon School District 45.8%
Elm City College Preparatory School 26.0% Unified School District #2 45.5% Elm City College Preparatory School 40.0%
Bridgeport Achievement First 20.0% Bridgeport Achievement First 43.7% Waterbury School District 39.2%
Amistad Academy District 13.8% Amistad Academy District 41.9% Windham School District 37.1%
New Beginnings Inc. Family Academy 11.2% New London School District 41.1% Unified School District #2 35.9%
Hartford School District 10.5% The Bridge Academy District 35.4% Bridgeport Achievement First 35.9%East Hartford School District 10.0% East Hartford School District 31.3% East Hartford School District 35.7%
Bridgeport School District 8.6% Waterbury School District 31.1% New Britain School District 34.1%
New Britain School District 8.4% Windham School District 28.4% Bridgeport School District 33.7%
Waterbury School District 8.1% Interdistrict School for Arts and Comm 28.3% Meriden School District 30.0%
Area Cooperative Educational Services 8.0% Elm City College Preparatory School 28.2% West Haven School District 28.9%
Bridgeport School District 28.0% Amistad Academy District 28.4%
Meriden School District 25.8% New London School District 27.8%
Hartford School District 25.3% Hartford School District 26.0%
New Britain School District 24.2% Connecticut Technical High Schools 25.4%
Bloomfield School District 23.6%
The Gilbert School 22.9%Park City Prep Charter School 22.6%
New Beginnings Inc. Family Academy 21.6%
Norwich School District 21.4%
(only districts with at least 20 students enrolled are included)

7/28/2019 Suspensions and Expulsions in Connecticut June 2013
http://slidepdf.com/reader/full/suspensions-and-expulsions-in-connecticut-june-2013 26/61
CONNECTICUT STATE DEPARTMENT OF EDUCATION
Observations
• Overall, suspension/expulsion rates in the middle and higher gradesare significantly greater than in the elementary grades.
• The suspension/expulsion rate of students in the elementary gradesin the Public Charter Schools (14.2%) is almost twice that in the 10Ed-Reform districts (7.7%), both of which are substantially greaterthan the state average (3.0%).
• The suspension/expulsion rates of students in the middle grades inthe 10 Ed-Reform districts (26.1%), the Public Charter Schools(25.8%) and the Endowed Academies (22.9%) are substantiallygreater than the state average (11.5%).
• The suspension/expulsion rates of students in the higher grades inthe 10 Ed-Reform districts (29.8%) and in the CT Technical HighSchools (25.4%) are substantially greater than the state average(14.8%).
26

7/28/2019 Suspensions and Expulsions in Connecticut June 2013
http://slidepdf.com/reader/full/suspensions-and-expulsions-in-connecticut-june-2013 27/61
CONNECTICUT STATE DEPARTMENT OF EDUCATION
Suspension/Expulsion Rates by Race
0%
5%
10%
15%
20%
25%
30%
35%
40%
45%
50%
American
Indian or
Alaska Native
Asian Black or African
American
Hispanic
Latino of any
race
Native
Hawaiian or
Other Pacific
Islander
Two or More
Races
White
27

7/28/2019 Suspensions and Expulsions in Connecticut June 2013
http://slidepdf.com/reader/full/suspensions-and-expulsions-in-connecticut-june-2013 28/61
CONNECTICUT STATE DEPARTMENT OF EDUCATION
Suspension/Expulsion Rates by Race
and Gender Statewide
0%
5%
10%
15%
20%
25%
30%
35%
40%
45%
50%
Statewide American
Indian or
Alaska Native
Asian Black or
African
American
Hispanic or
Latino
Native
Hawaiian or
Other Pacific
Islander
Two or More
Races
White
Female Male
28

7/28/2019 Suspensions and Expulsions in Connecticut June 2013
http://slidepdf.com/reader/full/suspensions-and-expulsions-in-connecticut-june-2013 29/61
CONNECTICUT STATE DEPARTMENT OF EDUCATION
Disparities in Suspension/Expulsion Rates
(Expressed as Ratios)
All Female Male
Black
Students :
WhiteStudents
19.2% : 5.0%
3.8 times
14.2% : 2.8%
5.0 times
23.8% : 7.1%
3.4 times
Hispanic
Students:
White
Students
13.9% : 5.0%
2.8 times
10.2% : 2.8%
3.6 times
17.4% : 7.1%
2.5 times
29

7/28/2019 Suspensions and Expulsions in Connecticut June 2013
http://slidepdf.com/reader/full/suspensions-and-expulsions-in-connecticut-june-2013 30/61
CONNECTICUT STATE DEPARTMENT OF EDUCATION
Similar Pattern of Disparity Exists within
District Categories
0%
5%
10%
15%
20%
25%
30%
Ed-Reform Non Ed-
Reform
Alliance
All Other
Districts
RESC Public
Charters
Black F Black M Hispanic F Hispanic M White F White M
30

7/28/2019 Suspensions and Expulsions in Connecticut June 2013
http://slidepdf.com/reader/full/suspensions-and-expulsions-in-connecticut-june-2013 31/61
CONNECTICUT STATE DEPARTMENT OF EDUCATION
Observations
• Gender:
• Males are suspended/expelled at about twice the rate as females.
• This pattern is evidenced in all racial/ethnic groups and within all
district categories.
• Race and Gender
• Black and Hispanic males are suspended/expelled at two to three
times the rate as their White counterparts.
• Black and Hispanic females are suspended/expelled at three to
five times the rate as their White counterparts.• These patterns are evidenced in all district categories.
31
7/28/2019 Suspensions and Expulsions in Connecticut June 2013
http://slidepdf.com/reader/full/suspensions-and-expulsions-in-connecticut-june-2013 32/61
CONNECTICUT STATE DEPARTMENT OF EDUCATION
HOW LONG DO SUSPENSIONS ANDEXPULSIONS LAST?
A student who is sanctioned receives, on average, 2.5 sanctions
in a year.
32

7/28/2019 Suspensions and Expulsions in Connecticut June 2013
http://slidepdf.com/reader/full/suspensions-and-expulsions-in-connecticut-june-2013 33/61
CONNECTICUT STATE DEPARTMENT OF EDUCATION
Average Number of Days Sanctioned
District ISS OSS Expulsion
Ed-Reform 1.2 3.0 111.7
Non Ed-Reform Alliance 1.4 3.3 140.3
All Other Districts 1.4 3.7 124.6RESC 1.4 2.4 163.5
Public Charters 1.0 1.6 58.1
Endowed Academies 1.6 4.3 85.0
CT Technical High Schools 1.5 4.9 67.1
State School Districts 2.9 3.6 -----
Statewide 1.3 3.1 116.3 33

7/28/2019 Suspensions and Expulsions in Connecticut June 2013
http://slidepdf.com/reader/full/suspensions-and-expulsions-in-connecticut-june-2013 34/61
CONNECTICUT STATE DEPARTMENT OF EDUCATION
Percent of Students (unduplicated) Based
on the Range of Total OSS Days Sanctioned
<=5 Days,
15133, 65%
>5 Days, 8,048,
35%
34

7/28/2019 Suspensions and Expulsions in Connecticut June 2013
http://slidepdf.com/reader/full/suspensions-and-expulsions-in-connecticut-june-2013 35/61
CONNECTICUT STATE DEPARTMENT OF EDUCATION
Attendance of Students Receiving ISS, OSS or Expulsion
by Grade Range: Percent of Students (unduplicated)
0%
10%
20%
30%
40%
50%
60%
70%
80%
90%
100%
Elementary Middle High
Chronically Absent At-Risk Satisfactory
35

7/28/2019 Suspensions and Expulsions in Connecticut June 2013
http://slidepdf.com/reader/full/suspensions-and-expulsions-in-connecticut-june-2013 36/61
CONNECTICUT STATE DEPARTMENT OF EDUCATION
Attendance of Students Receiving ISS, OSS or Expulsion
by Race: Percent of Students (unduplicated)
0%10%
20%
30%
40%
50%
60%
70%
80%
90%
100%
Black or African
American
Hispanic/Latino of any
race
White
Chronically Absent At-Risk Satisfactory
36

7/28/2019 Suspensions and Expulsions in Connecticut June 2013
http://slidepdf.com/reader/full/suspensions-and-expulsions-in-connecticut-june-2013 37/61
CONNECTICUT STATE DEPARTMENT OF EDUCATION
Observations
• Public Charter Schools evidence the lowest average number of days
sanctioned within each of the categories of ISS, OSS and Expulsions.
• Over 8,000 students who receive OSS are sanctioned for a total of
six or more days in the year.
• 40 percent of students in the higher grades (9-12) who are
suspended/expelled are chronically absent (i.e., missing 10 percent
or greater of the total number of days enrolled in the school year for
any reason). Nearly 30 percent in each of the grade ranges are also
at-risk (i.e., missing between 5 and 10 percent of enrolled days).
• Approximately 30 percent of Black and White students and 40
percent of Hispanic students who are suspended/expelled are
chronically absent. These rates far exceed the statewide averages for
these subgroups (Black 15%, Hispanic 18% and White 8%).
37

7/28/2019 Suspensions and Expulsions in Connecticut June 2013
http://slidepdf.com/reader/full/suspensions-and-expulsions-in-connecticut-june-2013 38/61
CONNECTICUT STATE DEPARTMENT OF EDUCATION
WHY ARE STUDENTS SUSPENDED OREXPELLED?
38

7/28/2019 Suspensions and Expulsions in Connecticut June 2013
http://slidepdf.com/reader/full/suspensions-and-expulsions-in-connecticut-june-2013 39/61
CONNECTICUT STATE DEPARTMENT OF EDUCATION
Incident Types (Offenses) that Result in ISS,
OSS or Expulsion
Fighting /
Battery
11%
Personally
Threatening
Behavior
6%Physical
Verbal
Confrontation9%
School Policy
Violations
66%
Other (includes
Drugs/Alcohol/To
bacco, Property
Damage, Sexually
Related Behavior,
Theft Behaviors,
Violent Crimes,
and Weapons)
8%
39

7/28/2019 Suspensions and Expulsions in Connecticut June 2013
http://slidepdf.com/reader/full/suspensions-and-expulsions-in-connecticut-june-2013 40/61
CONNECTICUT STATE DEPARTMENT OF EDUCATION
Incident Types (Offenses) that Result in ISS,
OSS, or Expulsion by District Category
0%
10%
20%
30%
40%
50%
60%
70%
80%
90%
100%
Ed-Reform Non Ed-
Reform
Alliance
All Other
Districts
RESC Public
Charters
Endowed
Academies
CT Technical
High Schools
School Policy Violations Fighting /
Battery
Personally Threatening Behavior Physical
Verbal Confrontation
Other40

7/28/2019 Suspensions and Expulsions in Connecticut June 2013
http://slidepdf.com/reader/full/suspensions-and-expulsions-in-connecticut-june-2013 41/61
CONNECTICUT STATE DEPARTMENT OF EDUCATION
Sanctions that Result from School Policy
Violations
ISS
74%
OSS
26%
Expulsion
0%41

7/28/2019 Suspensions and Expulsions in Connecticut June 2013
http://slidepdf.com/reader/full/suspensions-and-expulsions-in-connecticut-june-2013 42/61
CONNECTICUT STATE DEPARTMENT OF EDUCATION
Percent of School Policy Violations that
Result in OSS by District Category
35.6%
18.1%
14.1% 13.4%
46.8%
10.4%13.4%
0.0%5.0%
10.0%
15.0%
20.0%
25.0%
30.0%
35.0%
40.0%
45.0%
50.0%
Ed-Reform Non Ed-
Reform
Alliance
All Other
Districts
RESC Public
Charters
Endowed
Academies
CT
Technical
High
Schools

7/28/2019 Suspensions and Expulsions in Connecticut June 2013
http://slidepdf.com/reader/full/suspensions-and-expulsions-in-connecticut-june-2013 43/61
CONNECTICUT STATE DEPARTMENT OF EDUCATION
School Policy Violations Sub-Categories
that Result in OSS
0%
10%
20%
30%
40%50%
60%
70%
80%
90%
100%
Ed-Reform Non Ed-Reform
Alliance
All OtherDistricts
RESC PublicCharters
EndowedAcademies
CT TechnicalHigh Schools
Insubordination/Disrespect Disruption/Disruptive Behavior Skipping Class
Obscene Language/Profanity Leaving Grounds Inappropriate behavior
Disorderly Conduct Failure to Attend Detention or ISS Other

7/28/2019 Suspensions and Expulsions in Connecticut June 2013
http://slidepdf.com/reader/full/suspensions-and-expulsions-in-connecticut-june-2013 44/61
CONNECTICUT STATE DEPARTMENT OF EDUCATION
Observations
• Two-thirds of all ISS, OSS, and Expulsions statewide result
from School Policy Violations. This pattern holds in all district
categories except RESCs.
• 26.3 percent of all school-policy violations statewide result in
OSS. This rate is substantially higher in Public Charter Schools
(46.8%) and in Ed-Reform districts (35.6%).
• Among Ed-Reform districts, the types of offenses within the
“Other” category includes Dress Code Violation, Leaving Class
without Permission, Cell Phone, and Throwing Objects.
• Among Public Charter Schools, Accumulation of
demerits/detentions accounts for nearly two-thirds of the
“Other” category.
44

7/28/2019 Suspensions and Expulsions in Connecticut June 2013
http://slidepdf.com/reader/full/suspensions-and-expulsions-in-connecticut-june-2013 45/61
CONNECTICUT STATE DEPARTMENT OF EDUCATION
Number of Students Arrested
(unduplicated) by Race and Disability
0
100
200
300
400
500
600
700
Black or
African
American
Hispanic or
Latino
White All Others
General Education
Students
Students with
Disabilities
45

7/28/2019 Suspensions and Expulsions in Connecticut June 2013
http://slidepdf.com/reader/full/suspensions-and-expulsions-in-connecticut-june-2013 46/61
CONNECTICUT STATE DEPARTMENT OF EDUCATION
SUSPENSIONS OF YOUNG CHILDREN --- DATA
PROVIDED TO OFFICE OF CHILD ADVOCATE
46

7/28/2019 Suspensions and Expulsions in Connecticut June 2013
http://slidepdf.com/reader/full/suspensions-and-expulsions-in-connecticut-june-2013 47/61
CONNECTICUT STATE DEPARTMENT OF EDUCATION
Number of Suspensions in 2011-12 for
Children Under Age 7 as of 9/1/2011
806
1161
0
200
400
600
800
1000
1200
1400
ISS OSS
47
7/28/2019 Suspensions and Expulsions in Connecticut June 2013
http://slidepdf.com/reader/full/suspensions-and-expulsions-in-connecticut-june-2013 48/61
CONNECTICUT STATE DEPARTMENT OF EDUCATION
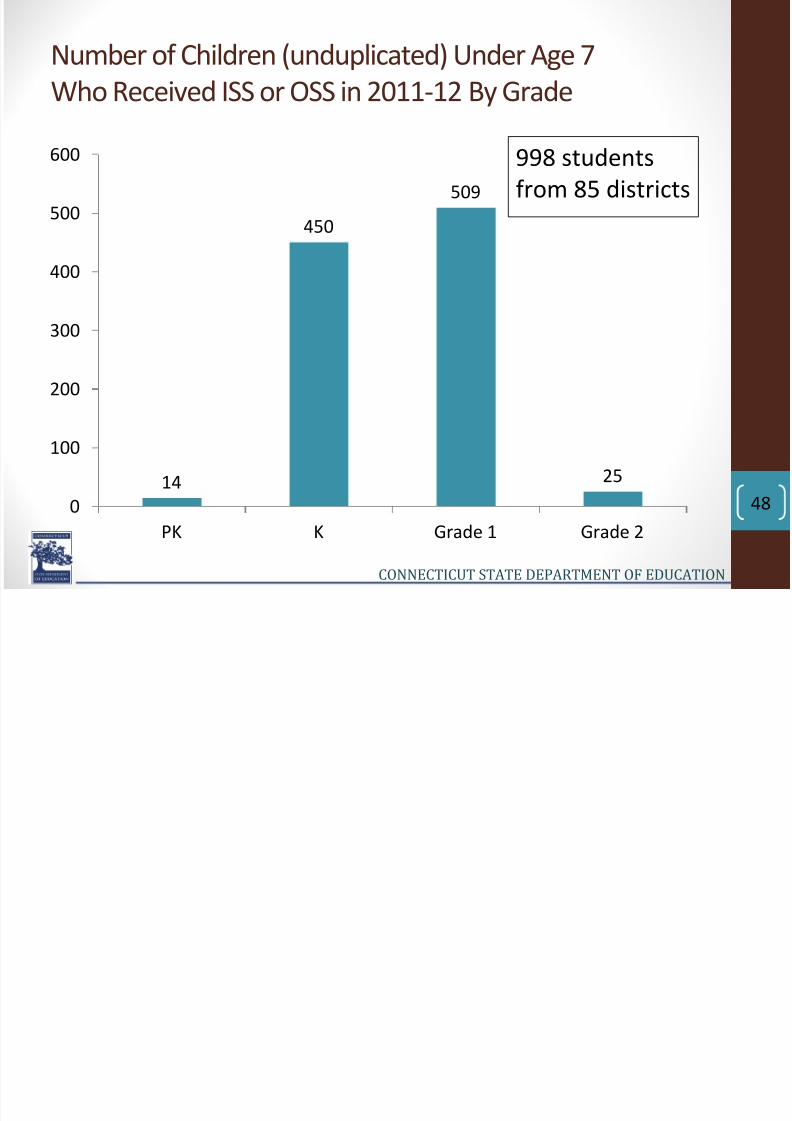
Number of Children (unduplicated) Under Age 7
Who Received ISS or OSS in 2011-12 By Grade
14
450
509
25
0
100
200
300
400
500
600
PK K Grade 1 Grade 2
998 students
from 85 districts
48

7/28/2019 Suspensions and Expulsions in Connecticut June 2013
http://slidepdf.com/reader/full/suspensions-and-expulsions-in-connecticut-june-2013 49/61
CONNECTICUT STATE DEPARTMENT OF EDUCATION
Number of Children (unduplicated) Under Age 7
Who Received ISS or OSS By Race and Gender
0
50
100
150
200
250
300
350
Black White Hispanic Multiple Race
Female
Male
49

7/28/2019 Suspensions and Expulsions in Connecticut June 2013
http://slidepdf.com/reader/full/suspensions-and-expulsions-in-connecticut-june-2013 50/61
CONNECTICUT STATE DEPARTMENT OF EDUCATION
Incident Types (Offenses) Resulting in OSS
for Children Under Age 7
PersonallyThreatening
Behavior
4%
Physical/VerbalConfrontation/Co
nduct
Unbecoming
20%
Fighting/Battery
31%
School Policy
Violations
38%
Other7%
50
d ( ff ) l

7/28/2019 Suspensions and Expulsions in Connecticut June 2013
http://slidepdf.com/reader/full/suspensions-and-expulsions-in-connecticut-june-2013 51/61
CONNECTICUT STATE DEPARTMENT OF EDUCATION
Incident Types (Offenses) Resulting in ISS
for Children Under Age 7
Personally
Threatening
Behavior
8%
Physical / Verbal
Confrontation /
Conduct
Unbecoming
25%
Fighting/Battery
20%
School PolicyViolations
41%
Other
6%
51

7/28/2019 Suspensions and Expulsions in Connecticut June 2013
http://slidepdf.com/reader/full/suspensions-and-expulsions-in-connecticut-june-2013 52/61
CONNECTICUT STATE DEPARTMENT OF EDUCATION
Percent of Kindergarteners Under Age 7 Receiving ISS or
OSS who Return in Following Year
0%
10%
20%
30%
40%
50%60%
70%
80%
90%
100%
Ed-Reform Non Ed-
Reform
Alliance
All Other
Districts
Public
Charters
% Returning to Same
School
% Returning to Same
District
52

7/28/2019 Suspensions and Expulsions in Connecticut June 2013
http://slidepdf.com/reader/full/suspensions-and-expulsions-in-connecticut-june-2013 53/61
CONNECTICUT STATE DEPARTMENT OF EDUCATION
Percent of 1st Graders Under Age 7 Receiving ISS or OSS
who Return in Following Year
0%
10%
20%
30%
40%
50%60%
70%
80%
90%
100%
Ed-Reform Non Ed-
Reform
Alliance
All Other
Districts
Public
Charters
% Returning to Same
School
% Returning to Same
District
53

7/28/2019 Suspensions and Expulsions in Connecticut June 2013
http://slidepdf.com/reader/full/suspensions-and-expulsions-in-connecticut-june-2013 54/61
CONNECTICUT STATE DEPARTMENT OF EDUCATION
Observations
• Contrary to the overall trend among all students, the number
of OSS is greater than ISS among these young children.
• Of the 998 young children who were suspended, 757 (75.9%)
were Black or Hispanic; 596 (59.7%) were Black or Hispanic
boys.
• A majority of these young children returned to the same
district in the following year across the various district
categories. In the 30 Alliance Districts, it appears that
kindergarten students who are suspended are returning toanother school within the same district.
54
7/28/2019 Suspensions and Expulsions in Connecticut June 2013
http://slidepdf.com/reader/full/suspensions-and-expulsions-in-connecticut-june-2013 55/61
CONNECTICUT STATE DEPARTMENT OF EDUCATION
CSDE ACTIONS TO TURN THE CURVE
55

7/28/2019 Suspensions and Expulsions in Connecticut June 2013
http://slidepdf.com/reader/full/suspensions-and-expulsions-in-connecticut-june-2013 56/61
CONNECTICUT STATE DEPARTMENT OF EDUCATION
CSDE Actions to Turn the Curve
• Discipline metrics are incorporated in data used
by the Turnaround Office in their work with
Alliance Districts, Commissioner’s Network
Schools, and SIG schools.
56

7/28/2019 Suspensions and Expulsions in Connecticut June 2013
http://slidepdf.com/reader/full/suspensions-and-expulsions-in-connecticut-june-2013 57/61
CONNECTICUT STATE DEPARTMENT OF EDUCATION
Alliance Districts
• CSDE has visited each of the 30 districts and had conversationswith them about their status on the following four domains:
• climate and culture;
• human capital;
• operations; and
• instruction.
• Based on the results of these visits and data, the CSDE isidentifying areas of need and strength in each district. Thosedistricts that need to address climate and behavior issues are
being identified. CSDE will ensure that districts address thoseissues in their Alliance District applications.
• CSDE will monitor Alliance Districts in 2013-14 and use climatedata along with other data around instruction and academics.
57

7/28/2019 Suspensions and Expulsions in Connecticut June 2013
http://slidepdf.com/reader/full/suspensions-and-expulsions-in-connecticut-june-2013 58/61
CONNECTICUT STATE DEPARTMENT OF EDUCATION
Sample NetStat Dashboard Indicators on Discipline Data
Used for Commissioner’s Network Schools
58

7/28/2019 Suspensions and Expulsions in Connecticut June 2013
http://slidepdf.com/reader/full/suspensions-and-expulsions-in-connecticut-june-2013 59/61
CONNECTICUT STATE DEPARTMENT OF EDUCATION
CSDE Actions to Turn the Curve (cont’d)
• Discipline data will be included in the progress monitoringprotocols used to review Charter schools.
• CSDE will continue to work with partners to provide trainingand support to schools and districts on the implementation of
positive behavioral interventions and supports and diversionstrategies to ensure that behavioral consequences minimizestudent disengagement from school and learning.
• Partner with the Center for Behavioral Education and Research atUCONN and the State Education Research Center to:
• deliver a statewide Webinar on the Positive Behavioral Interventionsand Supports framework;
• provide focused technical assistance with high suspension rates.
• CSDE will provide refresher training to districts on the December 2010 Guidelines for In-School and Out-of-School Suspensions. 59

7/28/2019 Suspensions and Expulsions in Connecticut June 2013
http://slidepdf.com/reader/full/suspensions-and-expulsions-in-connecticut-june-2013 60/61
CONNECTICUT STATE DEPARTMENT OF EDUCATION
CSDE Actions to Turn the Curve (cont’d)
• The CT Technical High Schools have already reviewed their
data and are implementing several interventions to reduce the
number of suspensions.
• The CSDE will continue to monitor discrepancies (overall and
by race/ethnicity) in the rates of suspension and expulsion forstudents with disabilities through federal indicators 4A and 4B.
For districts identified as having a significant discrepancy, the
CSDE conducts a review of district policies, procedures, and
practices and, if necessary, requires revisions to those
procedures.
60
U i S h l Li k d S i A h

7/28/2019 Suspensions and Expulsions in Connecticut June 2013
http://slidepdf.com/reader/full/suspensions-and-expulsions-in-connecticut-june-2013 61/61
Using a School Linked Services Approach
to Solve Chronic Absenteeism
• As part of its work with the Interagency Council for Ending the
Achievement Gap, CSDE held a forum, “Using a School LinkedServices Approach to Solve Chronic Absenteeism” on May 15,2013 (with nearly 200 attendees).
• A school linked services approach is important in addressingthe underlying causes of absenteeism (e.g., health,
bullying/safety, etc.).
• CSDE released district-level chronic absenteeism data
(including subgroup data) for the first time at this event.
• CSDE is encouraging districts to use a school linked services
approach to work with community partners and other state
agencies to meet the comprehensive needs of all students.
61