Embed Size (px)
Citation preview


E X P U L S I O N S

E X P U L S I O N SBrutality and Complexity in the Global Economy
Saskia Sassen
THE BELKNAP PRESS OFHARVARD UNIVERSITY PRESS
Cambridge, MassachusettsLondon, England
2014

To Richard
Copyright © 2014 by the President and Fellows of Harvard College
All rights reservedPrinted in the United States of America
Library of Congress Cataloging- in- Publication Data
Sassen, Saskia.Expulsions : brutality and complexity in the global economy / Saskia Sassen.
pages cmIncludes bibliographical references and index.
ISBN 978- 0- 674- 59922- 2 (alk. paper)1. Economics— Sociological aspects. 2. Economic
development— Social aspects. 3. Economic development— Moral and ethical aspects. 4. Capitalism— Social aspects.
5. Equality— Economic aspects. I. Title.
HM548.S275 2014330—dc23 2013040726

Introduction: The Savage Sorting 1
1. Shrinking Economies, Growing Expulsions 12
2. The New Global Market for Land 80
3. Finance and Its Capabilities: Crisis as Systemic Logic 117
4. Dead Land, Dead Water 149
Conclusion: At the Systemic Edge 211
References 225Notes 269Acknowledgments 283Index 285
Contents

1
We are confronting a formidable problem in our global po liti cal economy: the emergence of new logics of expulsion. The past two de cades have seen a sharp growth in the number of people, enter-prises, and places expelled from the core social and economic orders of our time. This tipping into radical expulsion was enabled by ele-mentary decisions in some cases, but in others by some of our most advanced economic and technical achievements. The notion of ex-pulsions takes us beyond the more familiar idea of growing in e-qual ity as a way of capturing the pathologies of today’s global capi-talism. Further, it brings to the fore the fact that forms of knowledge and intelligence we respect and admire are often at the origin of long transaction chains that can end in simple expulsions.
I focus on complex modes of expulsion because they can function as a window into major dynamics of our epoch. Further, I select ex-treme cases because they make sharply visible what might otherwise remain confusingly vague. One familiar example in the West that is both complex and extreme is the expelling of low- income workers and the unemployed from government social welfare and health programs as well as from corporate insurance and unemployment support. Beyond the negotiations and the making of new law re-quired to execute this expulsion, there is the extreme fact that the divide between those with access to such benefi ts and those denied
IntroductionThe Savage Sorting
2 • E X P U L S I O N S
it has sharpened and may well be irreversible under current condi-tions. Another example is the rise of advanced mining techniques, notably hydraulic fracturing, that have the power to transform natural environments into dead land and dead water, an expulsion of bits of life itself from the biosphere. Together the diverse expul-sions I examine in this book may well have a greater impact on the shaping of our world than the rapid economic growth in India, China, and a few other countries. Indeed, and key to my argument, such expulsions can coexist with economic growth as counted by standard measures.
These expulsions are made. The instruments for this making range from elementary policies to complex institutions, systems, and tech-niques that require specialized knowledge and intricate or gan i za-tion al formats. One example is the sharp rise in the complexity of fi nancial instruments, the product of brilliant creative classes and advanced mathematics. Yet, when deployed to develop a par tic u lar type of subprime mortgage, that complexity led to the expulsion a few years later of millions of people from their homes in the United States, Hungary, Latvia, and so on. Another is the complexity of the legal and accounting features of the contracts enabling a sovereign government to acquire vast stretches of land in a foreign sovereign nation- state as a sort of extension of its own territory— for example, to grow food for its middle classes— even as it expels local villages and rural economies from that land. Another is the brilliant engineer-ing that allows us to extract safely what we want from deep inside our planet while disfi guring its surface en passant. Our advanced po-liti cal economies have created a world where complexity too often tends to produce elementary brutalities.
The channels for expulsion vary greatly. They include austerity policies that have helped shrink the economies of Greece and Spain, environmental policies that overlook the toxic emissions from enor-mous mining operations in Norilsk, Rus sia, and in the American state of Montana, and so on, in an endless array of cases. The specif-

Introduction • 3
ics of each case matter in this book. For instance, if our concern is environmental destruction rather than interstate politics, the fact that both these mining operations are heavy polluters matters more than the fact that one site is in Rus sia and the other in the United States.
The diverse pro cesses and conditions I include under the notion of expulsion all share one aspect: they are acute. While the abjectly poor worldwide are the most extreme instance, I do include such di-verse conditions as the impoverishment of the middle classes in rich countries, the eviction of millions of small farmers in poor countries owing to the 220 million hectares of land, or over 540 million acres, acquired by foreign investors and governments since 2006, and the destructive mining practices in countries as different as the United States and Rus sia. Then there are the countless displaced people ware-housed in formal and informal refugee camps, the minoritized groups in rich countries who are ware housed in prisons, and the able- bodied unemployed men and women ware housed in ghettos and slums. Some of these expulsions have been taking place for a long time, but not at the current scale. Some are new types of expulsions, such as the 9 mil-lion house holds in the United States whose homes were foreclosed in a short and brutal housing crisis that lasted a mere de cade. In short, the character, contents, and sites of these expulsions vary enormously across social strata and physical conditions, and across the world.
The globalization of capital and the sharp rise in technical capa-bilities have produced major scaling effects. What may have been minor displacements and losses in the 1980s, such as deindustrializa-tion in the West and in several African countries, had become devas-tations by the 1990s (think Detroit and Somalia). To understand this scaling as more of the same in e qual ity, poverty, and technical capac-ity is to miss the larger trend. Similarly with the environment. We have been using the biosphere and producing localized damage for millennia, but only in the last thirty years has the damage grown to become a planetary event that boomerangs back, often hitting sites

4 • E X P U L S I O N S
that had nothing to do with the original destruction, such as the Arc-tic permafrost. And so on with other domains, each with its own specifi cs.
The many diverse expulsions examined in this book together amount to a savage sorting. We tend to write about the complex or-gan i za tion al capacities of our modern world as producing societies capable of ever more complexity, and conceive of this as a positive development. But often it is so in a partial way or holds for a short temporal frame. Expanding the range of situations and the temporal frame makes visible the fact of sharp edges that obscure what might lie beyond. This raises a question: is much of today’s society tending toward the condition of brutal simplicity against which the great his-torian Jacob Burckhardt warned in the nineteenth century? From what I have observed, complexity does not inevitably lead to brutal-ity, but it can, and today it often does. Indeed, it often leads to simple brutality, not even grand brutality of a sort that might be an equal, even if negative, to that complexity, as is today’s scale of our environ-mental destruction.
How does complexity produce brutality? Part of the answer, I will argue, concerns the logics or ga niz ing some of today’s major order- making systems in domains as diverse as global environmental pro-tection and fi nance. Let me illustrate very briefl y my argument with two cases, developed at length in this book. The main policy “inno-vation” in interstate agreements to protect the environment is car-bon trading, which means, practically and brutally speaking, that countries will tend to fi ght for expanding their right to pollute so as to either buy or sell a bigger quota of carbon emissions. In the case of fi nance, its or ga niz ing logic has evolved into a relentless push for hyperprofi ts and a need to develop instruments that enable it to ex-pand the range of what can be fi nancialized. That led to a willing-ness to fi nancialize even the livelihoods of those who lose everything if the instrument backfi res. It was the case with the type of sub-prime mortgage launched in 2001 in the United States. What is per-
Introduction • 5
haps still misunderstood is that this was a fi nancial project aimed at profi ts for high fi nance. It was not aimed at helping modest- income people buy a house, and hence the opposite of the state projects launched de cades earlier, such as the GI Bill and loans under the FHA. The capacities furthering the developments of these systems and innovations are not necessarily intrinsically brutalizing. But when they function within par tic u lar types of or ga niz ing logics they become so. The capacity of fi nance to make capital is not inherently destructive, yet it is a type of capital that needs to be put to the test: can it be materialized into a transport infrastructure, a bridge, a water- cleaning system, a factory?
There is a social conundrum here. These capacities should have served to develop the social realm, to broaden and strengthen the well- being of a society, which includes working with the biosphere. Instead they have too often served to dismember the social through extreme in e qual ity, to destroy much of the middle- class life promised by liberal democracy, to expel the vulnerable and the poor from land, jobs, and homes, and to the expulsion of bits of the biosphere from their life space.
A question running through this book is whether the mix of cases I discuss here, which cut across the familiar divisions of urban versus rural, Global North versus Global South, East and West, and more, are the surface manifestation, the localized shape, of deeper systemic dynamics that articulate much of what now appears as unconnected. These systemic dynamics might be operating at a more subterranean level, with more to connect them than we can grasp when we divide the world into familiar, discrete categories— capitalist economy, com-munist China, sub- Saharan Africa, the environment, fi nance, and so on. We use these labels to give familiar shapes and meanings to con-ditions that might actually be originating in deeper, unfamiliar trends. This possibility is a key driver in each of the chapters of this book.
I use the notion of subterranean trends as a shorthand for what are, strictly speaking, conceptually subterranean trends. They are

6 • E X P U L S I O N S
hard to see when we think with our familiar geopo liti cal, economic, and social markers. The one domain where they are perhaps most visible is that of the environment. We know that we are using and destroying the biosphere, but our “environmental policies” do not connect with or refl ect a clear understanding of the actual condi-tion of the biosphere. Thus carbon trading as a way of protecting the environment makes sense only from an interstate perspective, and makes little sense from a planetary perspective where local destructions scale up and hit us all. New dynamics may well get fi ltered through familiar thick realities— poverty, in e qual ity, econ-omy, politics— and thereby take on familiar forms when in fact they are signaling accelerations or ruptures that generate new meanings.
Using the notion of subterranean trends is one way of calling into question familiar categories for or ga niz ing knowledge about our economies, our societies, and our interaction with the biosphere. It helps us assess whether today’s problems are extreme versions of old troubles or manifestations of something, or some things, disturbing and new. I explore whether the sheer variety of expulsions taking place obscures larger subterranean dynamics that may underlie that variety at ground level. The prevalence of this one feature— the pos-sibility of expulsions— across our familiar differentiations is what led me to the notion of such subterranean trends. The specialization of research, knowledge, and interpretation, each with its own canons and methods for protecting boundaries and meanings, does not al-ways help in this effort of detecting subterranean trends that cut across our familiar distinctions. But specialization does give us de-tailed knowledge about specifi cs, bringing us back to basics that can be compared with one another.
Rather than giving meaning to facts by pro cessing them upward through theorization, I do the opposite, bringing them down to their most basic elements in an effort to de- theorize them. Through such de- theorizing I can then revisit in e qual ity, fi nance, mining, land grabs, and much more in order to see what we would miss with more ab-

Introduction • 7
stract categorizations; one instance is seeing the more radical fact of expulsions rather than merely more in e qual ity, fi nancial speculation, mining advances, etc. In short, one aim of the book is to stay close to the ground, in order to discover by suspending the overwhelming weight of the familiar categories through which we interpret current trends.
At its sharpest, my hypothesis is that beneath the country specif-ics of diverse global crises lie emergent systemic trends shaped by a few very basic dynamics. For that reason, empirical research and conceptual recoding must happen together. Empirically a phenome-non may look “Chinese” or “Italian” or “Australian,” but this may not help us detect the DNA of our epoch, even if such labels capture certain features. China may still retain many features of a communist society, but growing in e qual ity and the recent impoverishment of its modest middle classes might be rooted in deeper trends that are also at work in, for instance, the United States. Despite enduring differ-ences the two countries may both be hosting major contemporary logics that or ga nize the economy, notably speculation- driven fi nance and a push for hyperprofi ts. These parallels and their consequences for people, places, and economies may well turn out to be more sig-nifi cant for understanding our times than differences between com-munism and capitalism. Indeed, at a deeper level, these “parallels” may be the multisited materializations of trends that are deeper than speculation and hyperprofi ts but are as yet invisible in that they have not been detected, named, or conceptualized. My focus on the ma-terializing of global trends inside countries contrasts with the far more common focus on the deregulation of national borders where the border is seen as the site for our current transformation.
The problem as I see it is one of interpretation. When we confront today’s range of transformations— rising in e qual ity, rising poverty, rising government debt— the usual tools to interpret them are out of date. So we fall into our familiar explanations: governments that are not fi scally responsible, house holds that take on more debt than

8 • E X P U L S I O N S
they can handle, capital allocations that are ineffi cient because there is too much regulation, and so on. I do not deny that these explana-tions have some use, but I am more interested in exploring whether other dynamics are at work as well, dynamics that cut across these familiar and well- established conceptual/historical boundaries.
The far- ranging sets of facts and cases I use throughout this book point to limits in our current master categorizations. Notwithstand-ing all the differences, whether under communism or liberal democ-racy, in Africa or North America, par tic u lar practices dominate how we mine, manufacture, use people, and get away with murder, fi gu-ratively speaking. The politico- economic orderings within which these practices take place imbue them with distinct meanings, and one question for me is whether these meanings camoufl age more than they reveal. I use the cases in the book as facts on the ground, as material instances that can help detect conceptually subterranean trends that cut across our geopo liti cal divisions. Is today’s sharp in-crease of displaced people in sub- Saharan Africa systemically akin to the sharp growth of the permanently unemployed and frequently incarcerated in the United States? Are the impoverished middle classes in Greece systemically akin to the impoverished middle classes in Egypt, even though these two countries have very different po liti cal economies? Is the large mining complex in Norilsk, Rus sia, a long- term source of acute toxicity in the area, systemically akin to the Zortman- Landusky mining operations in Montana, United States, with their own long- term toxicities? These facts on the ground help do away with old conceptual superstructures, such as capitalism versus communism.
The epochal transformations that interest me here are rooted in diverse and often old histories and genealogies. But my starting point is the 1980s, a vital period of change both in the South and in the North, in capitalist and communist economies alike. To mark the period I highlight two profound shifts from the vast and rich histories that take off in the 1980s. These two shifts happen across

Introduction • 9
the world. But they evolve with highly specifi c characteristics in each locality, and it is this feature that makes those shifts a useful backdrop for the research in this book.
One is the material development of growing areas of the world into extreme zones for key economic operations. At one end this takes the shape of global outsourcing of manufacturing, ser vices, clerical work, the harvesting of human organs, and the raising of industrial crops to low- cost areas with weak regulation. At the other end, it is the active worldwide making of global cities as strategic spaces for advanced economic functions; this includes cities built from scratch and the often brutal renovation of old cities. The net-work of global cities functions as a new geography of centrality that cuts across the old North- South and East- West divides, and so does the network of outsourcing sites.
The second is the ascendance of fi nance in the network of global cities. Finance in itself is not new— it has been part of our history for millennia. What is new and characteristic of our current era is the capacity of fi nance to develop enormously complex instruments that allow it to securitize the broadest- ever, historically speaking, range of entities and pro cesses; further, continuous advances in electronic networks and tools make for seemingly unlimited multiplier effects. This rise of fi nance is consequential for the larger economy. While traditional banking is about selling money that the bank has, fi nance is about selling something it does not have. To do this, fi nance needs to invade— that is, securitize— nonfi nancial sectors to get the grist for its mill. And no instrument is as good for this as the derivative. One result that illustrates this capacity of fi nance is that by 2005, well before the crisis started brewing, the (notional) value of outstanding derivatives was $630 trillion; this was fourteen times global gross domestic product (GDP). In some ways, the nonalignment between the value of GDP and that of fi nance is not unpre ce dented in Western history. But that misalignment has never been so extreme. Moreover, it is a major departure from the Keynesian period, when economic
10 • E X P U L S I O N S
growth was driven not by the fi nancializing of everything but by the vast expansion of material economies such as mass manufactur-ing and mass building of infrastructures and suburbs.
We can characterize the relationship of advanced to traditional capitalism in our current period as one marked by extraction and destruction, not unlike the relationship of traditional capitalism to precapitalist economies. At its most extreme this can mean the im-miseration and exclusion of growing numbers of people who cease being of value as workers and consumers. But today it can also mean that economic actors once crucial to the development of capitalism, such as petty bourgeoisies and traditional national bourgeoisies, cease being of value to the larger system. These trends are not anom-alous, nor are they the result of a crisis; they are part of the current systemic deepening of capitalist relations. And, I will argue, so is the shrinking economic, as distinct from fi nancial, space in Greece, Spain, the United States, and many other developed countries.
People as consumers and workers play a diminished role in the profi ts of a range of economic sectors. For instance, from the per-spective of today’s capitalism, the natural resources of much of Af-rica, Latin America, and central Asia are more important than the people on those lands as workers or consumers. This tells us that our period is not quite like earlier forms of capitalism that thrived on the accelerated expansion of prosperous working and middle classes. Maximizing consumption by house holds was a critical dynamic in that earlier period, as it is today in the so- called emergent economies of the world. But overall it is no longer the strategic systemic driver that it was in most of the twentieth century.
What is next? Historically, the oppressed have often risen against their masters. But today the oppressed have mostly been expelled and survive at a great distance from their oppressors. Further, the “oppressor” is increasingly a complex system that combines per-sons, networks, and machines with no obvious center. And yet there are sites where it all comes together, where power becomes concrete
Introduction • 11
and can be engaged, and where the oppressed are part of the social infrastructure for power. Global cities are one such site.
These are the contradictory dynamics I examine in this book. Bits and pieces of this account have been recorded in the general litera-ture on contemporary affairs, but it has not been narrated as an over-arching dynamic that is taking us into a new phase of a certain type of global capitalism. What I seek to contribute is a theorization that begins with the facts at ground level, freed from the intermediation of familiar institutions, and takes us to the other side of traditional geopo liti cal, economic, and cultural differentiations.

12
The aim of this chapter is to put some fl esh on the idea that we may have entered a new phase of advanced capitalism in the 1980s, one with reinvented mechanisms for primitive accumulation. Today’s is a form of primitive accumulation executed through complex opera-tions and much specialized innovation, ranging from the logistics of outsourcing to the algorithms of fi nance. After thirty years of these types of development, we face shrinking economies in much of the world, escalating destructions of the biosphere all over the globe, and the reemergence of extreme forms of poverty and brutalization where we thought they had been eliminated or were on their way out.
What is usually referred to as economic development has long depended on extracting goods from one part of the world and ship-ping them to another. Over the past few de cades this geography of extraction has expanded rapidly, in good part through complex new technologies, and is now marked by even sharper imbalances in its relation to, and use of, natural resources. The mix of innovations that expands our capacities for extraction now threatens core com-ponents of the biosphere, leaving us also with expanded stretches of dead land and dead water.
Some of this is old history. Economic growth has never been benign. But the escalations of the past three de cades mark a new epoch in that they threaten a growing number of people and places
CHAPTER 1
Shrinking Economies, Growing Expulsions
Shrinking Economies, Growing Expulsions • 13
throughout the world. Such growth still takes on distinctive for-mats and contents in the mix of diversely developed countries we refer to as the Global North versus the mix of less or differently developed countries we refer to as the Global South. For instance, predatory elites have long been associated with poor countries that have rich natural resources, not with developed countries. Yet in-creasingly we see some of this capture at the top also in the latter, albeit typically in far more intermediated forms.
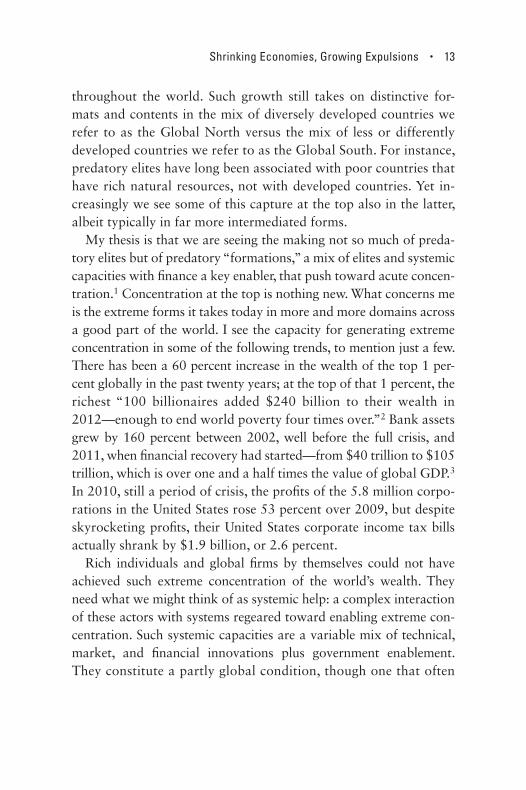
My thesis is that we are seeing the making not so much of preda-tory elites but of predatory “formations,” a mix of elites and systemic capacities with fi nance a key enabler, that push toward acute concen-tration.1 Concentration at the top is nothing new. What concerns me is the extreme forms it takes today in more and more domains across a good part of the world. I see the capacity for generating extreme concentration in some of the following trends, to mention just a few. There has been a 60 percent increase in the wealth of the top 1 per-cent globally in the past twenty years; at the top of that 1 percent, the richest “100 billionaires added $240 billion to their wealth in 2012— enough to end world poverty four times over.”2 Bank assets grew by 160 percent between 2002, well before the full crisis, and 2011, when fi nancial recovery had started— from $40 trillion to $105 trillion, which is over one and a half times the value of global GDP.3 In 2010, still a period of crisis, the profi ts of the 5.8 million corpo-rations in the United States rose 53 percent over 2009, but despite skyrocketing profi ts, their United States corporate income tax bills actually shrank by $1.9 billion, or 2.6 percent.
Rich individuals and global fi rms by themselves could not have achieved such extreme concentration of the world’s wealth. They need what we might think of as systemic help: a complex interaction of these actors with systems regeared toward enabling extreme con-centration. Such systemic capacities are a variable mix of technical, market, and fi nancial innovations plus government enablement. They constitute a partly global condition, though one that often

14 • E X P U L S I O N S
functions through the specifi cs of countries, their po liti cal economies, their laws, and their governments.4 They include enormous capaci-ties for intermediation that function as a kind of haze, impairing our ability to see what is happening— but unlike a century ago, we would not fi nd cigar- smoking moguls in this haze. Today, the structures through which concentration happens are complex assemblages of multiple elements, rather than the fi efdoms of a few robber barons.
Part of my argument is that a system with the capacity to concen-trate wealth at this scale is distinctive. It is different, for instance, from a system with the capacity to generate the expansion of pros-perous working and middle classes, as happened during most of the twentieth century in the Global North, in much of Latin America, and in several African countries, notably Somalia. This earlier system was far from perfect: there were in e qual ity, concentration of wealth, poverty, racism, and more. But it was a system with a capacity to generate a growing middle sector that kept expanding for several generations, with children mostly doing better than their parents. Also, these distributive outcomes were not simply a function of the people involved. It took specifi c systemic capacities. By the 1980s, these earlier capacities had weakened, and we saw the emergence of capacities that push toward concentration at the top rather than toward the development of a broad middle. Thus the fact, for ex-ample, that the top 10 percent of the income ladder in the United States got 90 percent of the income growth of the de cade beginning in 2000 signals more than individual capacity— it was enabled by that complex mix I conceive of as a predatory formation.
In the fi rst section of this chapter I elaborate on how economic growth can get constituted in diverse ways with diverse distributive effects. I fi nd that in our global modernity, we are seeing a surge of what are often referred to as primitive forms of accumulation, usu-ally associated with earlier economies. The format is no longer something like the enclosure of farmers’ fi elds so that wool- bearing sheep can be raised there, as was done in En gland to satisfy textile

Shrinking Economies, Growing Expulsions • 15
manufacturers’ demands during the industrial revolution. Today, enormous technical and legal complexities are needed to execute what are ultimately elementary extractions. It is, to cite a few cases, the enclosure by fi nancial fi rms of a country’s resources and citizens’ taxes, the repositioning of expanding stretches of the world as sites for extraction of resources, and the regearing of government bud gets in liberal democracies away from social and workers’ needs. I return to these subjects in the third section.
The second section examines global in e qual ity through this criti-cal lens. In e qual ity, if it keeps growing, can at some point be more accurately described as a type of expulsion. For those at the bottom or in the poor middle, this means expulsion from a life space; among those at the top, this appears to have meant exiting from the respon-sibilities of membership in society via self- removal, extreme concen-tration of the wealth available in a society, and no inclination to redistribute that wealth. Building on the discussion of extreme in-stantiations of in e qual ity, the third section focuses on familiar situa-tions that, when taken to extremes, become unfamiliar— the other side of the curve. To render visible today’s accelerated systemic ca-pacity to make the familiar extreme, I focus on the developed world. Greece and Spain particularly have entered a phase of active shrink-age of their economies to a point we would not have thought pos-sible in the developed world only a few years ago.
These fi rst three sections of the chapter bring out the speed with which what was experienced as more or less normal can evolve into its opposite. The fi nal two sections focus on acute types of expulsions that are likely to become more widespread in par tic u lar areas of the world. One is the growth over the past two de cades of the displaced population, mostly in the Global South, and the other is the rapid in-crease of the incarcerated population in a growing number of coun-tries in the Global North. These and so many other old but mutating conditions point to a multisited systemic transformation. In the Global South, both the diverse causes of displacement and the futures of those

16 • E X P U L S I O N S
who have been displaced are calling into question the United Nations’ formal classifi cations of displaced persons, because mostly such peo-ple will never go back home— home is now a war zone, a plantation, a mining operation, or dead land. An equivalent shift is evident in the Global North, where what until recently was incarceration as response to a crime (whether the crime was actually committed or not) is now becoming the warehousing of people, which, furthermore, is increas-ingly done for profi t— with the United States in a vanguard all its own.
Unsustainable Contradictions? From Incorporation to Expulsion
The ways in which economic growth takes place matter. A given growth rate can describe a variety of economies, from one with lit-tle in e qual ity and a thriving middle class to one with extreme in e-qual ity and concentration of most of the growth in a small upper tier. These differences exist across and within countries. Germany and Angola had the same rate of GDP growth in 2000 but clearly had very different economies and saw very different distributive effects. Although Germany is reducing the level, it still puts a good share of government resources into countrywide infrastructure and offers a wide array of ser vices to its people, from health care to trains and buses. Angola’s government does neither, choosing to support a small elite seeking to satisfy its own desires, including luxury developments in its capital city, Luanda, now ranked as the most expensive city in the world. These differences can also be seen in a single country across time, such as the United States just within the past fi fty years. In the de cades after World War II, growth was widely distributed and gener-ated a strong middle class, while the de cade beginning in 2000 saw the beginnings of an impoverished middle class, with 80 percent of the growth in income going to the top 1 percent of earners.
In the post– World War II era, the critical components of Western market economies were fi xed- capital intensity, standardized pro-
Shrinking Economies, Growing Expulsions • 17
duction, and the building of new housing in cities, suburbs, and new towns. Such patterns were evident in a variety of countries in North and South America, Eu rope, Africa, and Asia, most promi-nently Japan and Asia’s so- called Tiger economies. These forms of economic growth contributed to the vast expansion of a middle class. They did not eliminate in e qual ity, discrimination, or racism. But they reduced systemic tendencies toward extreme in e qual ity by constitut-ing an economic regime centered on mass production and mass con-sumption, with strong labor unions at least in some sectors, and diverse government supports. Further deterrents to in e qual ity were the cultural forms accompanying these pro cesses, particularly through their shaping of the structures of everyday life. For instance, the cul-ture of the large suburban middle class evident in the United States and Japan contributed to mass consumption and thus to standard-ization in production, which in turn facilitated unionization in man-ufacturing and distribution.5
Manufacturing, in tandem with state policies, played a particu-larly strong role in this conjunction of trends. As the leading sector in market- based economies for much of the twentieth century, mass manufacturing created the economic conditions for the expansion of the middle class because (1) it facilitated worker or ga niz ing, with unionization the most familiar format; (2) it was based in good part on house hold consumption, and hence wage levels mattered in that they created an effective demand in economies that were for the most part fairly closed; and (3) the relatively high wage levels and social benefi ts typical of the leading manufacturing sectors became a model for broader sectors of the economy, even those not unionized nor in manufacturing. Manufacturing played this role in non- Western- style industrial economies as well, notably in Taiwan and South Korea, and, in its own way, in parts of the Soviet Union. It has also played a signifi cant part in the growth of a middle class in China since the 1990s, though not as consequential a role as it did in the West in the twentieth century.
18 • E X P U L S I O N S
By the 1990s, these economic histories and geographies had been partly destroyed. The end of the Cold War launched one of the most brutal economic phases of the modern era. It led to a radical reshuf-fl ing of capitalism. The effect was to open global ground for new or sharply expanded modes of profi t extraction even in unlikely domains, such as subprime mortgages on modest residences, or through unlikely instruments, such as credit default swaps, which were a key compo-nent of the shadow banking system. Thus I see China’s rapid manufac-turing growth as part of this new phase of global capitalism that takes off in the 1980s;6 this also helps explain why that growth did not lead to the vast expansion of a prosperous working and middle class in China. Such a difference also marks manufacturing growth in other countries that have become part of the outsourcing map of the West.
Two logics run through this reshuffl ing. One is systemic and gets wired into most countries’ economic and (de)regulatory policies— of which the most important are privatization and the lifting of tariffs on imports. In capitalist economies we can see this in the unsettling and de- bordering of existing fi scal and monetary arrangements, al-beit with variable degrees of intensity in different countries.
The second logic is the transformation of growing areas of the world into extreme zones for these new or sharply expanded modes of profi t extraction. The most familiar are global cities and the spaces for outsourced work. Each is a type of thick local setting that contains the diverse conditions global fi rms need, though each does so at very different stages of the global economic pro cess, for instance, computers for high- fi nance versus manufacturing compo-nents for those computers. Other such local settings in today’s global economy are plantations and places for resource extraction, both producing mostly for export. The global city is a space for producing some of the most advanced inputs global fi rms need. In contrast, outsourcing is about spaces for routinized production of compo-nents, mass call centers, standardized clerical work, and more, all of it massive and standardized. Both these types of spaces are among

Shrinking Economies, Growing Expulsions • 19
the most strategic factors in the making of today’s global economy, besides intermediate sectors such as transport. They concentrate the diverse labor markets, par tic u lar infrastructures, and built environ-ments critical to the global economy. And they are the sites that make visible, and have benefi ted from, the multiple deregulations and guar-antees of contract developed and implemented by governments across the world and by major international bodies— in both cases, work mostly paid for by the taxpayers in much of the world.
In e qual ity in the profi t- making capacities of different sectors of the economy and in the earning capacities of different types of workers has long been a feature of advanced market economies. But the or-ders of magnitude today across much of the developed world distin-guish current developments from those of the postwar de cades. The United States is probably among the most extreme cases, so it makes the pattern brutally clear. Figures 1.1 and 1.2 show the extraordinary
0
200
400
600
800
1000
1200
1400
1600
1800
1940
1945
1950
1955
1960
1965
1970
1975
1980
1985
1990
1995
2000
2005
2010
2015
FIGURE 1.1 Corporate Profi ts after Tax in the United States, 1940s– 2010s (in $ billions)Data source: Federal Reserve Bank of St. Louis 2013a.
20 • E X P U L S I O N S
0
2000
4000
6000
8000
10000
12000
14000
16000
18000
1950
1955
1960
1965
1970
1975
1980
1985
1990
1995
2000
2005
2010
2015
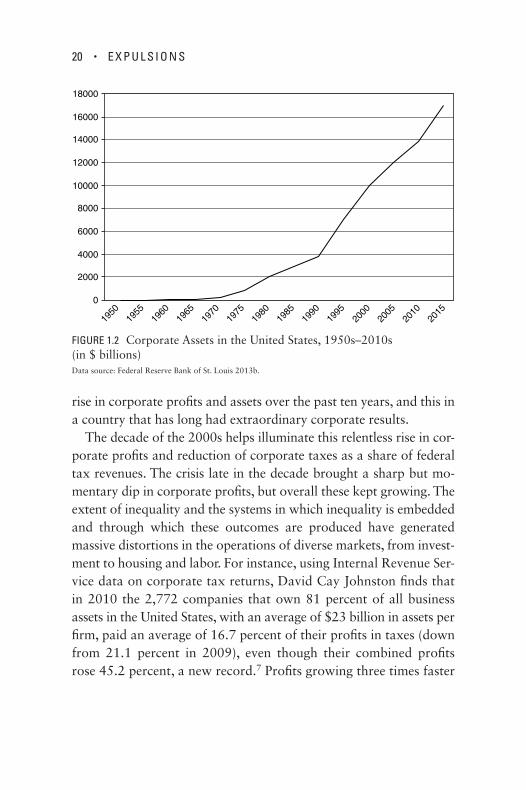
FIGURE 1.2 Corporate Assets in the United States, 1950s– 2010s (in $ billions)Data source: Federal Reserve Bank of St. Louis 2013b.
rise in corporate profi ts and assets over the past ten years, and this in a country that has long had extraordinary corporate results.
The de cade of the 2000s helps illuminate this relentless rise in cor-porate profi ts and reduction of corporate taxes as a share of federal tax revenues. The crisis late in the de cade brought a sharp but mo-mentary dip in corporate profi ts, but overall these kept growing. The extent of in e qual ity and the systems in which in e qual ity is embedded and through which these outcomes are produced have generated massive distortions in the operations of diverse markets, from invest-ment to housing and labor. For instance, using Internal Revenue Ser-vice data on corporate tax returns, David Cay Johnston fi nds that in 2010 the 2,772 companies that own 81 percent of all business assets in the United States, with an average of $23 billion in assets per fi rm, paid an average of 16.7 percent of their profi ts in taxes (down from 21.1 percent in 2009), even though their combined profi ts rose 45.2 percent, a new record.7 Profi ts growing three times faster
Shrinking Economies, Growing Expulsions • 21
than taxes means their effective tax rates fell.8 The effects are vis-ible in the composition of federal tax revenues: a growing share of individual taxes and a declining share of corporate taxes. The share of individual taxes is estimated to rise from 41.5 percent of federal revenues in fi scal 2010 to 49.8 percent in fi scal 2018. In contrast, corporate income taxes— assuming current rates— are expected to grow by only 2.4 percentage points over the same period, from 8.9 percent of federal revenues in 2010 to 11.3 per-cent in 2018.9
The trajectory of governments in this same period is one of grow-ing indebtedness. Today, most of the developed- country govern-ments could not engage in the large- scale infrastructure projects common in the postwar de cades. Using International Monetary Fund (IMF) data, the Organisation for Economic Co- operation and Development (OECD) fi nds widespread growth of central govern-ment debt as a percentage of GDP. Table 1.1 presents numbers for several, mostly developed countries. The trend holds for very differ-ent types of governments: Germany saw its central government debt increase from 13 percent of GDP in 1980 to 44 percent in 2010; U.S. government debt increased from 25.7 percent of GDP in 1980 to 61 percent in 2010; and China’s rose from 1 percent of GDP in 1984 to 33.5 percent in 2010.
The rise of government defi cits has also been fed by the increase in tax evasion, partly facilitated by the development of complex ac-counting, fi nancial, and legal instruments. In a 2012 research proj-ect for the Tax Justice Network, accountant Richard Murphy esti-mates tax evasion globally at $3 trillion in 2010, which represents 5 percent of the global economy and 18 percent of global tax col-lections in 2010.10 The study covered 145 countries with $61.7 tril-lion of gross product, or 98.2 percent of the world total. The esti-mated tax evasion is based on a juxtaposition of World Bank data on the estimated size of shadow economies with a Heritage Founda-tion analysis of average tax burdens by country.11 Figure 1.3 presents

22 • E X P U L S I O N S
tax evasion estimates for several developed countries, including those generally seen as well governed and well functioning, such as Germany, France, and the United Kingdom. It ranges from 8.6 per-cent of GDP in the United States to 43.8 percent in Rus sia. Murphy fi nds that a key reason for this tax evasion is the combination of weak rules on accounting and disclosure combined with inadequate bud gets to enforce tax laws. The United States has the largest amount of absolute tax evasion, clearly a function partly of the size of its economy. Murphy estimates U.S. tax evasion at $337.3 billion, which is 10.7 percent of global evasion; this is not too different from
TABLE 1.1: Central Government Debt (% of GDP) in Eleven Countries, 1980– 2010
Year
Country 1980 1990 2000 2010
Australia 8.0 6.1 11.4 11.0
Canada 26.1 46.6 40.9 36.1
China 1.0a 6.9 16.4 33.5
Germany 13.0 19.7 38.4 44.4
Greece n/a 97.6b 108.9 147.8
Italy 52.7 92.8 103.6 109.0
Japan 37.1 47.0 106.1 183.5c
Portugal 29.2 51.7 52.1 88.0
Spain 14.3 36.5 49.9 51.7
Sweden 38.2 39.6 56.9 33.8
United States 25.7 41.5 33.9 61.3
Data source: OECD 2014.Notes: a. Data for 1984b. Data for 1993c. Data for 2009

Shrinking Economies, Growing Expulsions • 23
the offi cial U.S. Internal Revenue Ser vice tax gap estimates. Given the mea sures used in the report, it excludes “lawful” tax evasion, which we know has increased sharply over the last de cade thanks to ex-tremely creative accounting, including the use of private contractual arrangements that can bypass state regulations lawfully, so to speak.12
The losers in much of this are the majority of citizens and their governments. Governments become poorer, partly as a result of tax evasion and partly because more of their citizens are impoverished and therefore less capable of meeting their social obligations. The Genuine Progress Indicator (GPI) is a comprehensive mea sure that includes social conditions and environmental costs; it adjusts expen-diture using twenty- six variables so as to account both for costs such as pollution, crime, and in e qual ity and for benefi cial activities where no money changes hands, such as house work and volunteer-ing. An international team led by Ida Kubiszewski from Australian National University collected GPI estimates for seventeen countries, which together account for over half the world’s population and
0
50
100
150
200
250
300
350
400
USBra
zilIta
ly
Russia
German
y
France
Japan
China UKSp
ain
Billi
ons
of d
olla
rs
0
5
10
15
20
25
30
35
40
45
50
% o
f GD
P
Tax loss (in billions of $US) Size of the shadow economy (% of GDP)
FIGURE 1.3 Countries with the Largest Absolute Levels of Tax Evasion, 2011Data source: Johnston 2011.

24 • E X P U L S I O N S
GDP, to generate a global overview of GPI changes over the last fi ve de cades. They found that GPI per person peaked in 1978 and has been declining slowly but steadily ever since.13 In contrast, GDP per capita has been rising steadily since 1978. The research team argues that this signals that social and environmental negatives have out-paced the growth of monetary wealth. Clearly, an additional factor is the distribution of that monetary wealth, which, as we know from other data examined in this chapter, has become increasingly concen-trated at the top.
Using IMF data on public expenditures and adjustment mea sures in 181 countries, Isabel Ortiz and Matthew Cummins examine the impact of the crisis, from 2007 through the forecasts for 2013– 2015. The authors fi nd that the IMF data used in 314 studies show that a quarter of the countries are undergoing excessive contraction. “Excessive contraction” is defi ned as a cut in government expendi-tures as a percentage of GDP in the 2013– 2015 postcrisis period com-pared to the equivalent mea sure in the precrisis levels of 2005– 2007. Fiscal contraction is found to be most severe in the developing world. Overall, sixty- eight developing countries are projected to cut public spending by 3.7 percent of GDP on average in 2013– 2015, com-pared to 2.2 percent in twenty- six high- income countries. In terms of population, austerity will affect 5.8 billion people, or 80 percent of the global population, in 2013; this is expected to increase to 6.3 bil-lion, or 90 percent of people worldwide, by 2015. This leads the au-thors to question the desirability of fi scal contraction as the way out of the crisis. They argue that the worldwide propensity toward fi scal consolidation is likely to aggravate unemployment, produce higher food and fuel costs, and reduce access to essential ser vices for many house holds in all these countries. These house holds are bearing the costs of a “recovery” that has passed them by.14
Some of the major pro cesses feeding the increased in e qual ity in profi t- making and earnings capacities are an integral part of the ad-

Shrinking Economies, Growing Expulsions • 25
vanced information economy; thus this growing in e qual ity is not an anomaly nor, in the case of earnings, the result of low- wage immi-grant labor, as is often asserted. One such pro cess is the ascendance and transformation of fi nance, particularly through securitization, globalization, and the development of new telecommunications and computer- networking technologies. Another source of inequalities in profi t making and earnings is the growing ser vice intensity in the or ga ni za tion of the economy generally, that is to say, the increased demand for ser vices by fi rms and house holds.15 Insofar as there is a strong tendency in the ser vice sector toward polarization in the lev-els of technical expertise that workers need, and in their wages and salaries, the growth in the demand for ser vices reproduces these in-equalities in the broader society.
The exceptionally high profi t- making capacity of many of the leading ser vice industries is embedded in a complex combination of new trends. Among the most signifi cant over the past twenty years are technologies that make possible the hypermobility of capital at a global scale; market deregulation, which maximizes the imple-mentation of that hypermobility; and fi nancial inventions such as securitization, which liquefy hitherto illiquid capital and allow it to circulate faster, hence generating additional profi ts (or losses). Glo-balization adds to the complexity of these ser vice industries, their strategic character, and their glamour. This in turn has contributed to their valorization and often overvalorization, as illustrated in the unusually high salary increases for top- level professionals that be-gan in the 1980s, a trend that has now become normalized in many advanced economies.16
Of all the highly developed countries, it is the United States where these deep structural trends are most legible. National- level data for the United States show a sharp growth in in e qual ity. For instance, earnings growth during the precrisis level for 2001 to 2005 was high but very unequally distributed. Most of it went to the

26 • E X P U L S I O N S
upper 10 percent and, especially, the upper 1 percent of house holds. The remaining 90 percent of house holds saw a 4.2 percent decline in their market- based incomes.17 Figure 1.4 traces a longer- term pattern from the boom and bust of the 1920s, the growth of the middle sectors in the de cades of the Keynesian period, and the re-turn to rapidly rising in e qual ity by 1987. It was in that immediate postwar period extending into the late 1960s and early 1970s that the incorporation of workers into formal labor market relations reached its highest level in the most advanced economies. In the United States, it helped bring down the share of total job earnings going to the top 10 percent from 47 percent at its height in the 1920s and early 1930s to 33 percent from 1942 until 1987. The formalization of the employment relation in this period helped implement a set of regulations that, overall, protected workers and secured the gains made by often violent labor struggles. Not that
20
25
30
35
40
45
50
1917
1922
1927
1932
1937
1942
1947
1952
1957
1962
1967
1972
1977
1982
1987
1992
1997
2002
FIGURE 1.4 Share (in %) of Incomea Going to the Top 10 Percent of U.S. Households, 1917– 2002Data source: Mishel 2004, table 1.
Note: a. Income is defi ned as market income but excludes capital gains.
Shrinking Economies, Growing Expulsions • 27
0
50
100
150
200
250
300
Bottom fifthMiddle fifthHighest fifthTop 1%
1979
1981
1983
1985
1987
1989
1991
1993
1995
1997
1999
2001
2003
2005
2007
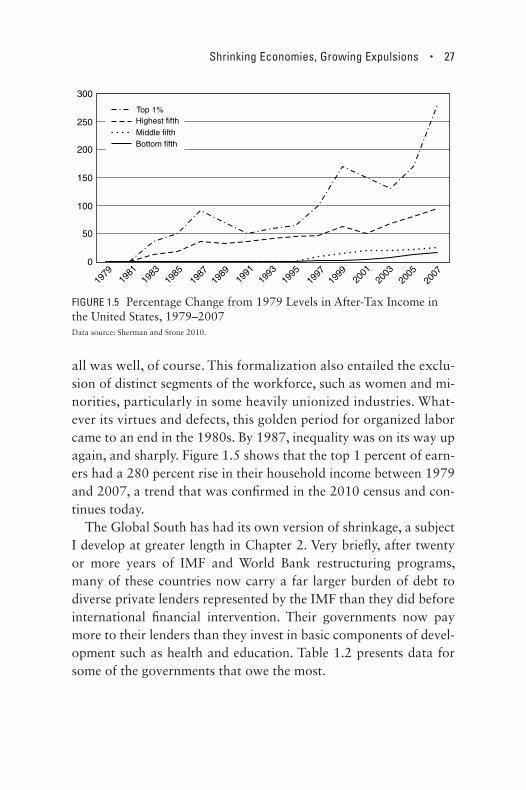
FIGURE 1.5 Percentage Change from 1979 Levels in After- Tax Income in the United States, 1979– 2007Data source: Sherman and Stone 2010.
all was well, of course. This formalization also entailed the exclu-sion of distinct segments of the workforce, such as women and mi-norities, particularly in some heavily unionized industries. What-ever its virtues and defects, this golden period for or ga nized labor came to an end in the 1980s. By 1987, in e qual ity was on its way up again, and sharply. Figure 1.5 shows that the top 1 percent of earn-ers had a 280 percent rise in their household income between 1979 and 2007, a trend that was confi rmed in the 2010 census and con-tinues today.
The Global South has had its own version of shrinkage, a subject I develop at greater length in Chapter 2. Very briefl y, after twenty or more years of IMF and World Bank restructuring programs, many of these countries now carry a far larger burden of debt to diverse private lenders represented by the IMF than they did before international fi nancial intervention. Their governments now pay more to their lenders than they invest in basic components of devel-opment such as health and education. Table 1.2 presents data for some of the governments that owe the most.

28 • E X P U L S I O N S
These are some of the key destructive trends that began in the 1980s, took off globally in the 1990s, and reached some of their highest levels in the 2000s. Although many of them began before the 2008 crisis, they were not quite visible. What was visible was the redevelopment and gentrifi cation of vast urban areas, which produced an impression of overall prosperity, from Paris to Bue-nos Aires, from Hong Kong to Dublin. Now these formerly invisi-ble trends have been exacerbated and have become visible. In
TABLE 1.2: Low- and Lower- Middle Income Governments with the Highest Foreign Debt Payments, 2012
CountryDebt payment
(% government revenue)
Belize 28.1
Philippines 27.1
Bhutan 26.6
El Salvador 25.8
Sri Lanka 24.1
St Vincent 18.6
St Lucia 18.1
Angola 17.1
Maldives 14.4
Gambia 13.9
Paraguay 13.3
Guatemala 12.7
Indonesia 11.9
Laos 11.5
Pakistan 10.5
Source: Jubilee Debt Campaign 2012, table 3.
Shrinking Economies, Growing Expulsions • 29
their extreme forms they can function as windows into a more complex and elusive reality of impoverishment in the making, one partly engendered by what was mostly visible as explosive growth in wealth and profi ts, a twenty-year pro cess I have examined in great detail elsewhere.18
In what follows I examine the sharp shifts in a number of very diverse domains. They range from the rapid growth in corporate profi ts alongside the rapid increase in government bud get defi cits to the rise of displaced populations in the Global South and the rising rates of incarceration in the Global North. Each of the do-mains examined is highly specifi c and functions within a par tic u-lar assemblage of institutions, laws, aims, and obstacles. As con-ditions become acute, they contribute to a third phase that is just beginning, one marked by expulsions— from life projects and livelihoods, from membership, from the social contract at the center of liberal democracy. It goes well beyond simply more in e-qual ity and more poverty. It is, in my reading, a development not yet fully visible and recognizable. It is not a condition faced by the majority, though it might become one in some cases. It entails a gradual generalizing of extreme conditions that begin at the edges of systems, in microsettings. This is important, because much of this sharp shift I am seeking to capture is still invisible to the statistician. But it is also to the passerby—the impoverished middle classes may still be living in their same nice houses, with their losses hidden behind neat facades. Increasingly these house holds have sold most of their valuables to afford payments, have started to sell their basics, including furniture, and are doubling up with grown- up children. My assumption is that in their extreme char-acter these conditions become heuristic and help us understand a larger, less extreme, and more encompassing dynamic in our po-liti cal economies.
Next I begin by describing general trends in the growth of in e-qual ity in both rich and poor countries, to be followed by a more
30 • E X P U L S I O N S
detailed examination of the active shrinking of the Greek, Spanish, and Portuguese economies.
Income In e qual ity in the World
The growth of in e qual ity in the past thirty years has been relent-less.19 Rather than providing an overview of a by now familiar sub-ject, I want to recover par tic u lar aspects of in e qual ity. Beyond dis-agreements of mea sures, time frames, and interpretation, much evidence shows substantial income and wealth inequalities both among and within countries across the globe. Most of this in e qual ity can be accounted for by differences among countries as measured by country means.
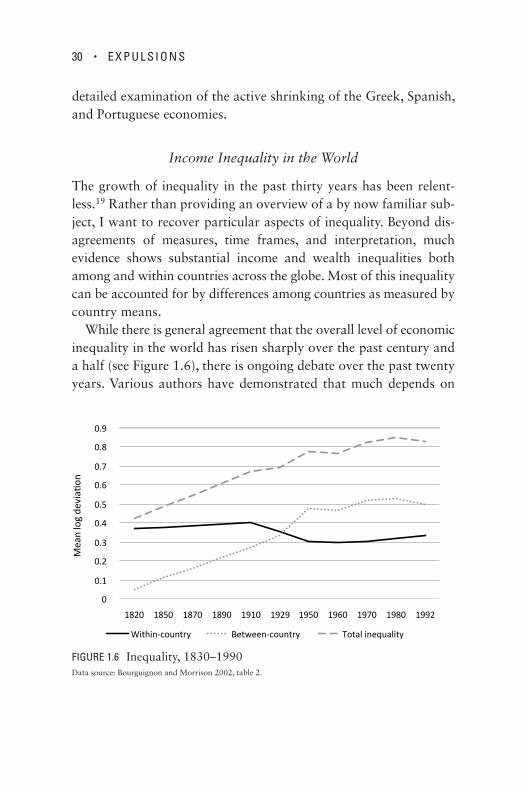
While there is general agreement that the overall level of economic in e qual ity in the world has risen sharply over the past century and a half (see Figure 1.6), there is ongoing debate over the past twenty years. Various authors have demonstrated that much depends on
0
0.1
0.2
0.3
0.4
0.5
0.6
0.7
0.8
0.9
1820 1850 1870 1890 1910 1929 1950 1960 1970 1980 1992
Mea
n lo
g de
via
on
Within-country Between-country Total inequality
FIGURE 1.6 In e qual ity, 1830– 1990Data source: Bourguignon and Morrison 2002, table 2.
Shrinking Economies, Growing Expulsions • 31
how global in e qual ity is mea sured. If rather than using country means, we would use the sum of the actual numbers of poor in each country according to basic standards, we would arrive at yet another measure of global inequality. Yet it is clear that the gap between incomes in rich and poor nations is large and growing. In one mea-sure of the in e qual ity among national incomes, Milanovic shows that the poorest quintile of certain high- income nations (which in-cludes countries such as Denmark) will be richer on average than the richest quintile in low- income nations (which includes countries such as Mali).20
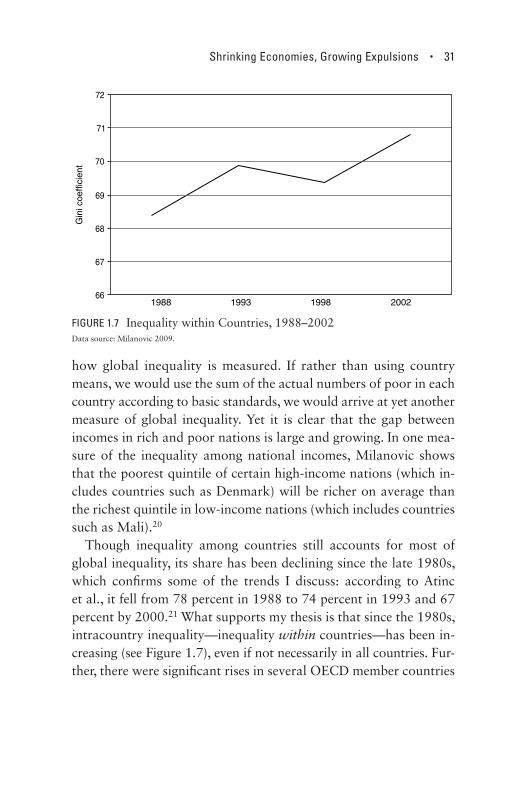
Though in e qual ity among countries still accounts for most of global in e qual ity, its share has been declining since the late 1980s, which confi rms some of the trends I discuss: according to Atinc et al., it fell from 78 percent in 1988 to 74 percent in 1993 and 67 percent by 2000.21 What supports my thesis is that since the 1980s, intracountry inequality— inequality within countries— has been in-creasing (see Figure 1.7), even if not necessarily in all countries. Fur-ther, there were signifi cant rises in several OECD member countries
66
67
68
69
70
71
72
1988 1993 1998 2002
Gin
i coe
ffici
ent
FIGURE 1.7 In e qual ity within Countries, 1988– 2002Data source: Milanovic 2009.

32 • E X P U L S I O N S
for which long- term data are available (see Figure 1.8 for a sampling). For some OECD countries— notably the United States, United Kingdom, and Israel— within-country income in e qual ity has been on the rise since the late 1970s. In the 2000s, within-country income in e qual ity began to rise quickly in traditionally low- inequality coun-tries such as Germany, Finland, and Sweden. The evidence for OECD countries points to growing within-country in e qual ity.
Income In e qual ity in the United States
The United States can serve as a kind of natural experiment, show-ing us how bad income in e qual ity can get in what is commonly cat-egorized as a “highly developed country” (see Figure 1.9). According to Milanovic, even though the poorest people in the United States may, on average, fare much better than the poorest in many devel-
−6
−4
−2
0
2
4
6
8
Sweden
New Z
ealan
dIsr
ael
Germ
any
United
Sta
tes
United
King
dom
Canad
a
Turk
ey
Greec
eSpa
in
FIGURE 1.8 Change in within-Country Inequality in OECD Countries, 1980s– 2000sData source: OECD 2013b.
Shrinking Economies, Growing Expulsions • 33
Bottomfifth
Secondfifth
Middlefifth
Fourthfifth
80– <90th 90– <95th 95– <99th Top 10%
15%
20%
25%
30%
35%
40%
45%
10%
5%
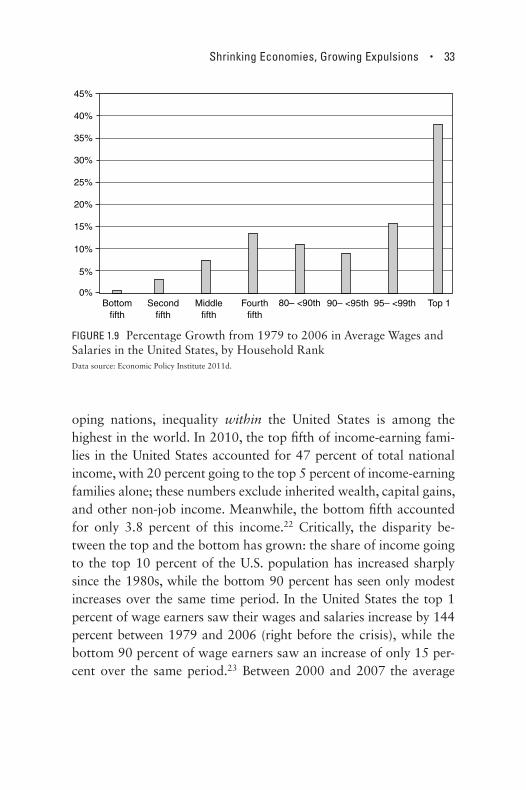
FIGURE 1.9 Percentage Growth from 1979 to 2006 in Average Wages and Salaries in the United States, by Household RankData source: Economic Policy Institute 2011d.
oping nations, in e qual ity within the United States is among the highest in the world. In 2010, the top fi fth of income- earning fami-lies in the United States accounted for 47 percent of total national income, with 20 percent going to the top 5 percent of income- earning families alone; these numbers exclude inherited wealth, capital gains, and other non- job income. Meanwhile, the bottom fi fth accounted for only 3.8 percent of this income.22 Critically, the disparity be-tween the top and the bottom has grown: the share of income going to the top 10 percent of the U.S. population has increased sharply since the 1980s, while the bottom 90 percent has seen only modest increases over the same time period. In the United States the top 1 percent of wage earners saw their wages and salaries increase by 144 percent between 1979 and 2006 (right before the crisis), while the bottom 90 percent of wage earners saw an increase of only 15 per-cent over the same period.23 Between 2000 and 2007 the average

34 • E X P U L S I O N S
income in the United States grew by $1,460, but all gains went to the richest 10 percent, while income for the bottom 90 percent declined.24
Wealth disparities in the United States tend to mirror disparities in income. The distribution of wealth in the United States is heavily skewed not only to the top quintile of wealth holders but in par tic u-lar to the top 1 percent (see Figure 1.10). Moreover, the top 1 percent of wealth holders in the United States saw their wealth increase over the 1980s and 1990s, peaking in 2007 at 103 percent greater than in 1983 before falling after the fi nancial crisis to 48 percent greater than in 1983.25 During this same period, median house hold wealth in the United States peaked in 2007 at 48 percent higher than 1983 levels, before falling sharply after the fi nancial crisis to 13.5 percent less than 1983 levels.26
Even more so than income, gains in real wealth were heavily skewed toward the wealthiest Americans in the period from 1983
1962 1983 1989 1992 1995 1998 2001 2004 2007 20100
50
100
150
200
250
300
350
FIGURE 1.10 Ratio of Wealth of Top 1 Percent to Median Wealth in the United States, 1962– 2010Data source: Economic Policy Institute 2011e.

Shrinking Economies, Growing Expulsions • 35
to 2009. During this period, all gains in wealth went to the top two quintiles, with the wealthiest 5 percent of Americans accounting for 81.7 percent of the total wealth gained. The middle, lower middle, and lowest quintiles, meanwhile, all saw decreases in their wealth over this time (see Figure 1.11).
Extreme Conditions in Rich Countries
If the United States shows us how bad intracountry in e qual ity can get, Greece, Spain, and Portugal can show us how sharply a whole economy can shrink. I use these three countries as but the most extreme sites of what is a broad trend within the developed world, including the rest of the eurozone: the shrinking space of the economy in developed countries. Such shrinking is an unusual trend in developed countries when not at war with each other. The more common language to describe these trends is that of
Bottomfifth
Secondfifth
Middlefifth
Fourthfifth
80– <90th 90– <95th 95– <99th Top 1%
0%
15%
20%
25%
30%
35%
40%
45%
10%
-5%
5%
FIGURE 1.11 Change in Share of Total Wealth from 1983 to 2010 in the United States, by Household RankSource: Economic Policy Institute 2011g.

36 • E X P U L S I O N S
low growth and high unemployment. I will argue that this lan-guage is too vague given the extreme condition of large parts of the population and economy in these three countries, and in fact many other countries, including the United States. Modest increases in em-ployment growth are not enough to eliminate this shrinking. The aim here is not to provide a detailed description of the well- documented rise in unemployment and bankruptcies. My aim is to use these trends to explore the shrinking of economic space and its consequences.
There is a de facto redefi nition of “the economy” when sharp con-tractions are gradually lost to standard mea sures. The unemployed who lose everything— jobs, homes, medical insurance— easily fall off the edge of what is defi ned as “the economy” and counted as such. So do small shop and factory own ers who lose everything and commit suicide. And so do the growing numbers of well- educated students and professionals who emigrate and leave Eu rope all together. These trends redefi ne the space of the economy. They make it smaller and expel a good share of the unemployed and the poor from standard mea sures. Such a redefi nition makes “the economy” presentable, so to speak, allowing it to show a slight growth in its mea sure of GDP per capita. The reality at ground level is more akin to a kind of eco-nomic version of ethnic cleansing in which elements considered trou-blesome are dealt with by simply eliminating them. This shrinking and redefi nition of economic space so that economies can be repre-sented as “back on track” holds for a growing number of countries in the Eu ro pe an Union and elsewhere. One difference is the central role of the IMF and the Eu ro pe an Central Bank in narrating what it takes to return to growth. To some extent they are succeeding, insofar as theirs are almost the only voices being heard on the mat-ter, and the language they use is not of contracting economies but of a return to GDP growth. Indeed, in early January 2013, the Eu-ro pe an Central Bank said that Greece’s economy was on the path back to growth, and Moody’s upgraded Greek debt by a point; the country’s rating is still low, but such shifts matter because investors
Shrinking Economies, Growing Expulsions • 37
take them into account. What is left out of these mea sures showing a return to some growth is that a signifi cant portion of house holds, enterprises, and places have been expelled from that economic space that is being mea sured. The expelled become invisible to for-mal mea sure ments, and thereby their negative drag on growth rates is neutralized.
A second major feature of the position of Eu ro pe an Union institu-tions and governments heading the so- called rescue effort for Greece is to consider it a unique case— a poor country with extreme tax fraud and a dysfunctional government bureaucracy. To some extent Portugal and Spain are also seen as extreme, though for different reasons than Greece. That is to say, they are not seen as indicative of a trend that might also affect the rest of the eurozone. But if we look at the other Eu ro pe an Union (EU) countries that are confronting low growth, relatively high unemployment, and pressures to cut social programs, the picture changes.
I argue that we cannot assume that Greece, Spain, and Portugal are unique cases. We need to examine whether they are. What takes an extreme form in Greece, and to some extent in Portugal and Spain, may well also be present elsewhere in the eurozone and beyond. This would alert us to a deeper structural condition in this phase of advanced capitalism, which took off in the 1980s and became en-trenched in the 1990s. The explanation would thus not be confi ned to exceptional conditions, such as Greece’s poverty and corruption, but would have to address structural features of the po liti cal economy present throughout the Eu ro pe an Union.
The data in Figures 1.12 and 1.13 offer evidence for this thesis that Greece and Spain are extreme examples of a larger trend affect-ing the eurozone more generally.27 Greece’s government debt al-most tripled from 2000 to 2013. While Spain’s debt actually de-clined in the roaring 2000s, by 2011 its private debt was surpassing the eurozone average. Notwithstanding sharp differences among coun-tries, the eurozone overall saw declining economic growth and, as

38 • E X P U L S I O N S
0
20
40
60
80
100
120
140
160
180
1996
1997
1998
1999
2000
2001
2002
2003
2004
2005
2011
2010
2009
2008
2007
2006
Greece EU Average
Deb
t per
cent
age
FIGURE 1.12 Greek Debt Compared to Eurozone Average, 1996– 2011Data source: Eurostat, “Government Defi cit and Debt,” 2013a.
0
10
20
30
40
50
60
70
80
90
1996
1997
1998
1999
2000
2001
2002
2003
2004
2005
2011
2010
2009
2008
2007
2006
Spain EU Average
Deb
t per
cent
age
FIGURE 1.13 Spanish Debt Compared to Eurozone Average, 1996– 2011Data source: Eurostat, “Government Defi cit and Debt,” 2013a.

Shrinking Economies, Growing Expulsions • 39
Figure 1.14 shows, a considerable rise in government indebtedness. And workers across Eu rope have staged protests against rising un-employment and austerity mea sures.
In a detailed examination of the G20, a group that includes many non- European countries, the International Labour Or ga ni za tion and the OECD found that in “postcrisis” 2012, seventeen of these coun-tries had unemployment levels above the precrisis levels of 2007.28 Only Germany, Rus sia, and Brazil had a decline in unemployment. More specifi cally, in over half of the countries examined, long- term unemployment as a share of total unemployment remains above pre-crisis levels. Finally, in Eu ro pe the unemployment rate rose further overall, and particularly so in France, Italy, and Spain. Europe’s 2012 youth unemployment rate exceeded 20 percent in most countries (see Figure 1.15), in some cases by a lot. It was below 5 percent in only four G20 countries (China, India, Japan, and the Republic of Korea).
−35.0
−30.0
−25.0
−20.0
−15.0
−10.0
−5.0
0.0
5.0
10.0
1999
2000
2001
2002
2003
2004
2005
2006
2007
2008
2009
2010
2011
2012
Ireland Greece Spain United Kingdom
FIGURE 1.14 General Government Financial Balance, 1999– 2012Data source: OECD 2012.

40 • E X P U L S I O N S
A second variable, the ratio of the employment rate for women to the rate for men, changed little since 2007, signaling a relatively gender- neutral impact of the crisis on job loss that is probably an indication of the depth of job losses.29 The exceptions are Spain and Turkey, where this ratio did rise. A third variable considers 2012 youth unemployment, which was over twice as high as adult unemployment in the G20. High as it is, this rate is known to be a severe undercount, since a substantial proportion of youth in G20 countries are neither in the labor force nor in school or a training program. More generally, youth labor force participation rates have dropped in nine of the G20 countries. The median youth labor force participation rate stands at 60 percent, ranging from a low of 49.4 percent in Italy to a high of 69.8 percent in China, which suggests that where jobs are available, as in China, youth participation is high.
0
10
20
30
40
50
60
Germ
any
Norway
Austri
a
Nethe
rland
s
Denm
arkM
alta
Luxe
mbo
urg
Finlan
d
Czech
Rep
ublic
Belgium
Sloven
ia
Estonia
United
King
dom
Roman
ia
Sweden
Fran
ce*
Lithu
ania
Poland
Cypru
s
Bulgar
ia
Hunga
ry
Latvi
a
Irelan
d
Slovak
iaIta
ly
Portu
gal
Spain
Greec
e
2006
2012
FIGURE 1.15 Eu ro pe an Youth (under Age 25) Unemployment, 2006, 2012Data source: Eurostat 2013b.
Shrinking Economies, Growing Expulsions • 41
This type of evidence helps us see that a good part of the world’s richer economies is experiencing negatives two years after the crisis was supposedly over. The extreme cuts in social benefi ts, declines in workforce numbers, and increases in income taxes imposed on Greece and Spain years after the 2008 crisis, make visible a deep restructur-ing project. But milder versions of such restructuring are taking place throughout the eurozone, as well as in other wealthy countries such as the United States.
One project that seems to be part of this restructuring involves keeping the increasingly privatized and corporatized economy go-ing by getting rid of excessive social contract–related expenditures. Debt repayment and austerity programs are disciplining mecha-nisms that serve this larger project of protecting a par tic u lar type of economy. They do not help or aim at maximizing employment and production. Greece’s recession, entering its fi fth year in 2012, is deep-ening as a result of privileging debt repayment, job cuts, reductions in social programs, and higher taxes. These policies keep intensify-ing, with the Greek government regularly announcing further cuts: for instance, at the end of 2012, a 22 percent cut in the private sector minimum wage, abolishing permanent jobs in state enterprises, and eliminating a further 150,000 jobs in the public sector by 2015. Rec-ognition of the limits and counterproductive effects of such policies is widespread. Regarding Greece, Charles Dallara, managing director of the Institute of International Finance (IIF) and the spokesman for Greece’s creditors, said that responses to the Greek debt crisis placed too much emphasis on short- term austerity and not enough on im-proving the country’s longer- term competitiveness. Further, concern-ing what it would take to pay Greece’s foreign creditors, he argued that it would take “only some €15bn–€20bn. . . . This can easily be realised in part by reducing interest rates on the loans which Eu rope and the IMF made to Greece on more concessional terms.”30
What ever the logic behind Eu rope’s sorting of winners and los-ers, it is important to note it tends to cut deep into the social and
42 • E X P U L S I O N S
economic fabric of a country. Economic output in Greece, Spain, and Portugal has fallen over the past several years. This challenges the prevailing Eu ro pe an view that fi scal belt- tightening will foster growth. Offi cial data make this clear, even if they undercount the shrinkage because they exclude a direct mea sure of what has been expelled from the formal economy. In the fi rst three months of 2013, Greece’s economy contracted for a nineteenth straight quarter as con-sumption and investment declined— a 16 percent drop in its GDP since the end of 2007. Moreover, this decline is accelerating: Greece’s GDP fell by 5.6 percent in the fi rst quarter of 2013 alone, a steeper decline than had been estimated given a return to growth, as formally mea sured, in several of Eu rope’s economies. Portugal’s GDP decline is speeding up as well, according to the country’s National Statistics In-stitute. In the last quarter of 2012, Portugal’s GDP fell by an esti-mated 5.3 percent, for a total decline of 3.2 percent for the year. Fur-ther, Portugal’s contraction in the fi rst quarter of 2013 exceeded initial projections.31 Spain, the eurozone’s fourth- largest economy, has con-tracted each year for the last several years; both the government and the International Monetary Fund predicted further contraction in 2013.32 First- quarter 2013 fi gures show that Spain did indeed fall deeper into recession, for a seventh straight quarter of economic shrinkage. The expectation is that expansion will not happen until 2014. While the rate of contraction in Spain might be lower than that in Greece, offi cial unemployment, at 27.2 percent, was just as high.
These economies are testing grounds for Eu rope’s major policy set-ters, who posit that reducing government spending and raising taxes will bring about economic recovery and a revival of investor confi -dence. It is important to note that the severe economic contractions in Greece and Portugal have not signifi cantly affected eurozone GDP.33 Those two economies combined account for only 4 percent of the bloc’s €9.5 trillion ($12.6 trillion) economy. But Spain is another mat-ter; this may be refl ected in the 100 million IMF loan exclusively for Spain’s banks. Signifi cantly, this loan was clearly not intended to en-
Shrinking Economies, Growing Expulsions • 43
able government delivery of needed health and education ser vices or to stimulate employment via government ser vices generally. Such uses were explicitly excluded in the loan’s conditions. More generally, all three economies may be making visible deep trends at work across Eu rope, as indicated by data presented in the next section.
So far, there is no evidence that the strategy for economic growth is working in the stated way. The Greek, Portuguese, and Spanish economies have kept contracting. And while Greece’s GDP has seen mild growth since early 2013, this mea sure of growth excludes all that has been expelled from the space of the economy, as we have seen. Thus it is a growth mea sure that exists alongside rising poverty, joblessness, homelessness, hunger, use of soup kitchens, suicide rates among own ers of small businesses that are going under, and more. It leads one to wonder if this brutal restructuring was undertaken pre-cisely in order to achieve a smaller but workable economic space that would show growth in GDP according to traditional metrics— even if it necessitates the expulsion from the economy, and its mea sures, of signifi cant shares of the workforce and the small business sector. Af-ter all, a mere hint of GDP growth can be a positive signal to inves-tors and fi nancial markets, and this is a key achievement from the perspective of current IMF and Eu ro pe an Central Bank policy— and not only in the EU. The alternative survival economies that are emerging exist in a different economic space, one that falls outside formal mea sures and indicators. For now they are not enough to meet the needs of the expelled and of the merely impoverished.
Adverse Conditions for Economic Prosperity
The sharp contraction of the space of what is considered to be the formal economy, especially though not exclusively in Greece, Portugal, and Spain, has multiple negative impacts on people. More unemployment, poverty, suicides, and austerity mea sures have become part of everyday life for most Greeks, Portuguese, and

44 • E X P U L S I O N S
Spaniards. Following two de cades of unpre ce dented economic growth as new Eu ro pe an Union member states, today Greece, Portugal, and Spain face some exceptionally adverse conditions for economic re-covery. In the following sections, I focus briefl y on employment, out- migration, foreclosures, and poverty, placing Greece, Portugal, and Spain in conversation with other EU member countries as well as other developed countries in the Global North, such as the United States.
Employment
The extreme employment condition in Greece and Spain becomes evident when these two countries are compared to countries as di-verse as China and the United States (see Figure 1.16).34 The Greek and Spanish labor force has unemployment rates two to three times as large as that in the United States; one qualifier here is that Eu rope’s unemployment mea sures include a far larger share of
0
1991
1992
1993
1994
1995
1996
1997
1998
1999
2000
2001
2002
2003
2004
2005
2006
2007
2008
2009
2010
2011
5
10
15
20
25
30
China Greece Spain United States
FIGURE 1.16 Unemployment Rates in China, Greece, Spain, and the United States, 1991– 2011Data source: “Unemployment and Infl ation (11–19)” and “Key Supply Side Data (20–22)” in OECD 2012; IMF 2012b.

Shrinking Economies, Growing Expulsions • 45
0
100
200
300
400
500
600
2000
2001
2002
2003
2004
2005
2006
2007
2008
2009
2010
2011
2012
Greece Italy Portugal Spain United States
FIGURE 1.17 Male Involuntary Part- Time Workers Ages 25–54 in Greece, Italy, Portugal, Spain, and the United States, 2001– 2011 (in thousands)Data source: OECD 2013c.
the unemployed than do United States mea sures. In 2013, youth un-employment rates surged past 56 percent in Spain, and Greece now leads the Global North with an astonishing 62.5 percent of its youth workforce jobless.35
The number of involuntary part- time workers has grown in the past ten years. Figures 1.17 and 1.18 indicate the extent to which the adult labor market has become increasingly precarious in Greece, It-aly, Portugal, Spain, and the United States. Important to note is that there is a sharp overrepre sen ta tion of women among involuntary part- time workers. For instance, in Spain their number grew from under 300,000 to almost 1 million, an overrepre sen ta tion that can-not be explained by the economic crisis alone. In Italy, Spain, and the United States, the number of men in involuntary part- time work has doubled, while it has tripled for women.

46 • E X P U L S I O N S
Out- migration
The shrinking economies of southern Eu rope have generated novel patterns of geographic mobility, especially among their resident im-migrant populations.36 Figure 1.19 shows an upward trend in out- migration from Spain by citizenship, especially after 2007. The in-creasing unemployment in the past two years has most probably only added to this emigration.37 These novel patterns are expected to impact the degree of economic growth and the socioeconomic standards of southern Eu rope in the near future.
Among immigrants, those of Eu ro pe an and Latin American ori-gin exhibit the highest rates of out- migration, especially when com-pared to Africans and Asians (Figure 1.20). Given the long history of Eu ro pe an emigration to Latin America and the ease with which
0
200
400
600
800
1000
1200
2000
2001
2002
2003
2004
2005
2006
2007
2008
2009
2010
2011
2012
Greece Italy Portugal Spain United States
FIGURE 1.18 Female Involuntary Part- Time Workers Age 25–54 in Greece, Italy, Portugal, Spain, and the United States, 2001– 2011 (in thousands)Data source: OECD 2013c.

Shrinking Economies, Growing Expulsions • 47
0
50000
100000
150000
200000
250000
300000
350000
400000
2002 2003 2004 2005 2006 2007 2008 2009 2010
Nationals Immigrants
FIGURE 1.19 Out- migration from Spain by Citizenship, 2002– 2010Data source: Eurostat 2012c.
0
20000
40000
60000
80000
100000
120000
140000
160000
180000
200000
2002 2003 2004 2005 2006 2007 2008 2009 2010 2011
Asia
South America
Africa
Oceania
North America
Europe
FIGURE 1.20 Out- migration from Spain by Continent of Origin, 2002– 2011Data source: Eurostat 2012c.

48 • E X P U L S I O N S
Latin Americans in Eu rope can repatriate, it is no surprise that so many Eu ro pe ans and Latin Americans have left for South America. In contrast, the restrictions that Africans and Asians face in cross-ing borders make them more likely to remain in the country of resi-dence, in this case Spain.
Foreclosures
One of the most brutal forms of expulsion is the eviction of people from their homes for failure to pay outstanding debt on their home. This is an especially devastating trend in Eu rope because there the evicted remain responsible for the full amount of their loan even after foreclosure.
In Spain, where the percentage of homeownership (80 percent) is one of the highest in Eu rope, foreclosures have reached the highest numbers.38 This is partly a function of the home construction boom in the 2000s and banks’ willingness to innovate on the mortgage front. There have been thousands of evictions every month since 2008; in 2009 alone, there were more than 93,000. By the end of 2012, foreclosures in Spain had surpassed 400,000 since 2007.
But foreclosure rates have increased generally in Eu rope (see Table 1.3). The most comprehensive examination of Eu ro pe an trends only goes as far as 2009, and it is after that year that matters generally got worse, as the fragmentary data indicate.39 The increases range from a maximum of 205 percent between 2008 and 2009 in Latvia to a low of 10.83 percent in Sweden. Some countries have seen a decline in the rate of foreclosures, even as their overall numbers of foreclo-sures have been extremely high. Hungary’s foreclosure rate, for ex-ample, declined by 70 percent from 2008 to 2009, but that is be-cause it had very sharp increases in foreclosures in 2007 and 2008. By the end of 2012, Hungary had accumulated almost a million foreclosures since 2009.

TAB
LE 1
.3:
Eu r
o pe a
n C
ount
ries
wit
h th
e H
ighe
st a
nd L
owes
t N
umbe
rs o
f Fo
recl
osur
es, 2
007–
2009
Num
ber
of f
orec
losu
res
% C
hang
e
2007
2008
2009
2007
–200
820
08–2
009
Incr
ease
?
Hig
hest
for
eclo
sure
s:
H
unga
ry22
5,66
324
5,59
771
,683
8.83
−70.
81N
o
G
erm
any
91,7
8888
,379
86,6
17−3
.71
−1.9
9N
o
Sp
ain
25,9
4358
,686
93,3
1912
6.21
59.0
1Y
es
U
nite
d K
ingd
om27
,869
46,9
8454
,014
68.5
914
.96
Yes
Low
est
fore
clos
ures
:
B
ulga
ria
449
886
1,57
097
.33
77.2
0Y
es
Fi
nlan
d50
682
51,
036
63.0
425
.58
Yes
D
enm
ark
1,01
51,
942
2,86
091
.33
47.2
7Y
es
N
ethe
rlan
ds1,
811
1,96
12,
256
8.28
15.0
4Y
es
Dat
a so
urce
: Whi
te 2
013.
50 • E X P U L S I O N S
Of course, these rising numbers need to be interpreted with cau-tion. For instance, the 63 percent increase in Finland sounds high, but the total number of foreclosure procedures is still below 1,000 (and the mea sure used also includes nonresidential mortgage loans). Foreclosure rates in at least some EU member states started their in-crease from a very low base. Further, the total volume of foreclosure procedures is relatively small in relation to the total number of out-standing residential mortgage loans. For instance, the 46,825 fore-closures in 2008 in the United Kingdom represent a high number to begin with, but that number was under 1 percent of the total num-ber of outstanding mortgages in 2008.
What is clear from these and from more recent data is that the total numbers of foreclosures since 2007 are increasing year after year, even if they may fall in some years. Second, the trend is not yet over, and countries fi nd themselves in different stages of this pro cess. For instance, between year- end 2007 and year- end 2009, default rates in Portugal and the United Kingdom rose only slightly, while default rates in Cyprus, Hungary, and Poland more than doubled and rates in Ireland tripled. Default rates in Denmark, Spain, Estonia, Bulgaria, and Latvia all increased more than threefold. Apart from Bulgaria, Cyprus, Estonia, Greece, Hungary, Ireland, Latvia, and Poland, how-ever, in none of the member states, nor in Norway, do loans that are more than three months in arrears appear to account for more than 3 percent of total outstanding mortgage loans in 2009. Finally, member states have experienced the impact of the crisis very differently. Each of the three member states with the highest increases (Denmark, Esto-nia, and Latvia), for example, exhibit very different default rates, sug-gesting that relative increases in default rates must be viewed along-side the absolute default rate, which is low in some of these cases.
Poverty
These rising default rates, even if low, take on added meaning if we consider the growing incidence of poverty in the EU- 27. Poverty is

Shrinking Economies, Growing Expulsions • 51
rising throughout Eu rope, regardless of the different levels of socio-economic development. For instance, between 2010 and 2011, the percentage of the population at risk for poverty or social exclusion increased from 41.6 to 49.1 percent in Bulgaria, from 27.7 to 31.0 percent in Greece, from 25.5 to 27.0 percent in Spain, from 29.9 to 31.0 percent in Hungary, and from 15.0 to 16.1 percent in Sweden (see Table 1.4).
At the end of 2012, Eurostat, the statistical offi ce of the Eu ro pe an Union, released updated fi gures on risk of poverty or social exclusion through 2011.40 It found that 119.6 million people, or 24.2 percent of the population, in the EU- 27 were at risk of poverty, severely ma-terially deprived, or living in house holds with very low work inten-sity.41 In that group of twenty- seven countries, 9 percent of the pop-ulation were severely materially deprived, meaning that they had living conditions constrained by a lack of resources (for example, they were not able to afford to pay their bills, keep their home ade-quately warm, or take a one- week holiday away from home). The share of those severely materially deprived varied signifi cantly among member states, ranging from 1 percent in Luxembourg and Sweden to 44 percent in Bulgaria and 31 percent in Latvia. In 2011, the high-est shares of people at risk of poverty or social exclusion were re-corded in Bulgaria (49 percent), Romania and Latvia (both 40 per-cent), Lithuania (33 percent), and Greece and Hungary (both 31 percent); the lowest were in the Czech Republic (15 percent), the Netherlands and Sweden (both 16 percent), and Luxembourg and Austria (both 17 percent). Furthermore, the report found that 27 percent of children below eigh teen years of age were affected by at least one of the three forms of poverty or social exclusion, based on 2010 data. Children were most affected in twenty member states, while the el der ly were the most touched in Bulgaria, Slovenia, Finland, and Sweden. In Denmark, it was the working- age population that was the most affected.
Poverty fi gures are calculated by different mea sures in Eu rope and the United States. But some important trends can be noticed for both

TAB
LE 1
.4:
Pove
rty
and
Soci
al E
xclu
sion
in E
U C
ount
ries
and
Sw
itze
rlan
d, 2
008–
2011
% o
f th
e to
tal p
opul
atio
n ex
clud
ed,
by t
ype
of s
ocia
l exc
lusi
on%
of
popu
lati
on
excl
uded
Num
ber
excl
uded
, 20
11 (
in m
illio
ns)
Ris
k of
po
vert
y
Seve
rely
m
ater
ially
de
priv
ed
Hou
se ho
lds
wit
h lo
w w
ork
inte
nsit
y20
0820
1020
11
EU
27
16.9
8.8
10.0
23.5
23.4
24.2
119.
6
Aus
tria
12.6
3.9
8.0
18.6
16.6
16.9
1.4
Bel
gium
15.3
5.7
13.7
20.8
20.8
21.0
2.3
Bul
gari
a22
.343
.611
.038
.241
.649
.13.
7
Cro
atia
21.1
14.8
17.0
n/a
31.3
32.7
1.4
Cyp
rus
14.5
10.7
4.5
22.4
22.9
23.5
0.2
Cze
ch R
ep.
9.8
6.1
6.6
15.3
14.4
15.3
1.6
Den
mar
k13
.02.
611
.416
.318
.318
.91.
0
Est
onia
17.5
8.7
9.9
21.8
21.7
23.1
0.3
Finl
and
13.7
3.2
9.8
17.4
16.9
17.9
0.9
Fran
ce14
.05.
29.
318
.619
.219
.311
.8
Ger
man
y15
.85.
311
.120
.119
.719
.916
.1
Gre
ece
21.4
15.2
11.8
28.1
27.7
31.0
3.4
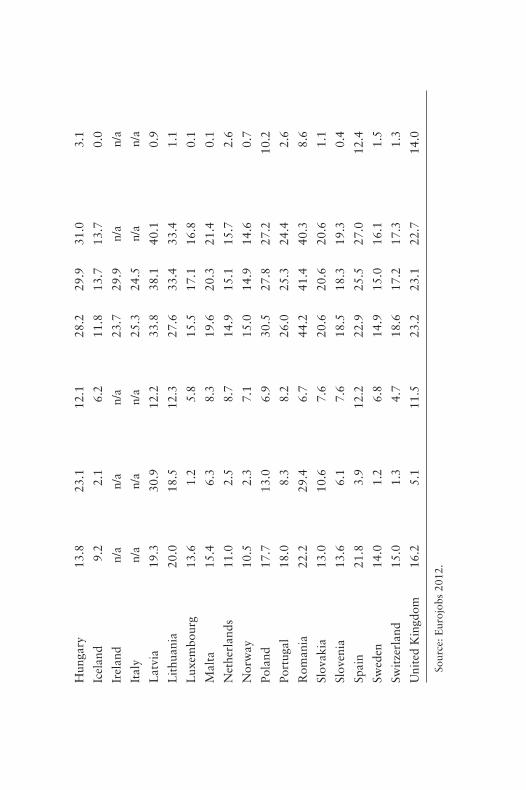
Hun
gary
13.8
23.1
12.1
28.2
29.9
31.0
3.1
Icel
and
9.2
2.1
6.2
11.8
13.7
13.7
0.0
Irel
and
n/a
n/a
n/a
23.7
29.9
n/a
n/a
Ital
yn/
an/
an/
a25
.324
.5n/
an/
a
Lat
via
19.3
30.9
12.2
33.8
38.1
40.1
0.9
Lit
huan
ia20
.018
.512
.327
.633
.433
.41.
1
Lux
embo
urg
13.6
1.2
5.8
15.5
17.1
16.8
0.1
Mal
ta15
.46.
38.
319
.620
.321
.40.
1
Net
herl
ands
11.0
2.5
8.7
14.9
15.1
15.7
2.6
Nor
way
10.5
2.3
7.1
15.0
14.9
14.6
0.7
Pola
nd17
.713
.06.
930
.527
.827
.210
.2
Port
ugal
18.0
8.3
8.2
26.0
25.3
24.4
2.6
Rom
ania
22.2
29.4
6.7
44.2
41.4
40.3
8.6
Slov
akia
13.0
10.6
7.6
20.6
20.6
20.6
1.1
Slov
enia
13.6
6.1
7.6
18.5
18.3
19.3
0.4
Spai
n21
.83.
912
.222
.925
.527
.012
.4
Swed
en14
.01.
26.
814
.915
.016
.11.
5
Swit
zerl
and
15.0
1.3
4.7
18.6
17.2
17.3
1.3
Uni
ted
Kin
gdom
16.2
5.1
11.5
23.2
23.1
22.7
14.0
Sour
ce: E
uroj
obs
2012
.
54 • E X P U L S I O N S
regions in lifetime rates of homelessness (as indexed by house hold surveys), in income in e qual ity, and in tax and benefi t programs that increase or reduce poverty. Such mea sures show that before the economic collapse, the United States and the United Kingdom had consistently higher lifetime rates of homelessness, more income in e-qual ity, and less generous social welfare policies than most Eu ro pe an countries.42 In all countries, racial minorities and people with mental illness experience high rates of homelessness. However, in recent years, in Greece these trends are becoming extreme. NGOs working with the homeless in Greece estimate that their number had reached 20,000 by year- end 2010, if all homeless on the street, house less, in-adequately housed, and insecurely housed are counted. This is up from the 2009 estimate of 17,000 people, pointing to a disturbing trend of rapid increase.
One indication of a people’s economic despair is a sharp rise in suicides.43 This trend is evident in several countries worldwide, from India to the United States, albeit for diverse reasons— from losing land or a business to the experience of absolute abandonment by state and society. What matters for my analysis here is the fact of the increase, not the total number of suicides. In 2011, the Greek minis-ter for health, Andeas Loverdos, reported that suicides in the fi rst fi ve months of the year may have increased 40 percent compared to the same period in 2010. The report also states that most of these sui-cides were connected to the fi nancial crisis, as bankruptcies increased sharply and unemployment rose from 13.9 to 20.9 percent in the space of twelve months. Klimaka, a major assistance or ga ni za tion, reports that during that same period of time, calls from people thought to be at serious risk more than doubled, to 5,500 in 2011.
The World’s Displaced
One way of bringing a global perspective to these extreme condi-tions of social expulsion in rich countries is to consider key world-wide displacement trends in poor countries over the last few years.

Shrinking Economies, Growing Expulsions • 55
Unemployment, out- migration, foreclosures, poverty, and suicide rates are useful variables in Global North countries. Displacement due to war, disease, and famine are perhaps more useful variables in the Global South. The main agency in charge of tracking the displaced is the United Nations High Commission on Refugees (UNHCR); it counts specifi c types of displacement linked to armed confl icts, and hence underrepresents the total.44 Thus UNHCR numbers leave out the displaced due to the large- scale land acquisi-tions in the Global South discussed in Chapter 2, those displaced in the Global North due to fi nancial manipulation of their debt dis-cussed in Chapter 3, or those displaced by catastrophic climate change worldwide discussed in Chapter 4.
At the end of 2011, the latest year for which comprehensive UNHCR statistics are available at this time, 42.5 million people worldwide had been forcibly displaced from their homes as a result of per sis tent or new confl icts in different parts of the world. This is the fi fth year when the number of forcibly displaced persons world-wide exceeded 42 million. The classifi cation “displaced persons” comprises several different populations. In 2011, the distribution was 15.2 million refugees (10.4 million under UNHCR’s care and 4.8 million registered with the UN Relief and Works Agency for Palestine Refugees), 26.4 million displaced within their own coun-try by confl ict, and 895,000 asylum seekers (forcibly displaced as refugees across international borders), with nearly one- tenth of this last group in South Africa alone. The 2011 total contains, among others, three alarming growth trends I would like to highlight here. One is that an estimated 4.3 million were newly displaced by con-fl ict or persecution. The second trend is that the above mentioned 895,000 asylum seekers represented the highest number in this cat-egory in more than a de cade. The third is that another 3.5 million people were newly displaced within the borders of their countries, a 20 percent increase from 2010.
Next I examine some of these trends in greater detail so as to get at how these outcomes are constituted.
56 • E X P U L S I O N S
Making Mass Displacement
UNHCR had responsibility for 35.4 million of the total interna-tionally recognized 42.5 million displaced people in 2011. Of those 35.4 million, 25.9 million were refugees and internally displaced per-sons. The increase over 2010 was largely due to renewed confl ict- related displacement in Af ghan i stan, Côte d’Ivoire, Libya, South Su-dan, Sudan, and Yemen. Af ghan i stan remains the world’s leading origin of refugees for 2011. On average, one out of four refugees in the world originated from Af ghan i stan, with 95 percent of them fi nd-ing asylum in Pakistan or the Islamic Republic of Iran. Iraq ranked second, the source of over 1.4 million refugees, followed by Somalia with almost 1.1 million, Sudan with 500,000, and the Demo cratic Republic of the Congo with 491,500.
Protracted displacement of fi ve years or more affects 7.1 million refugees— almost three- quarters of the refugee population under the UNHCR mandate. A protracted refugee situation is defi ned by UNHCR as one where 25,000 or more refugees from the same country have been in exile for fi ve or more years. This is of par tic u lar concern to human rights activists: they have coined the term refugee warehousing to describe the multiyear impact of such restricted mo-bility, enforced idleness, and de pen den cy in camps or other segregated settlements.45 These are the expelled who are probably never going back to a normal life.
Table 1.5 shows the global breakdown of forcibly displaced people in 2011 by category. Table 1.6 provides a list of those countries reporting the largest numbers of new internally displaced people, and Table 1.7 summarizes some of the key facts and fi gures for global internal displacement trends in 2011. Finally, Table 1.8 shows where all forcibly displaced people are seeking refuge, by category of displacement and continent of asylum. These numbers are visu-ally integrated in the world map included as Figure 1.21, which shows internally displaced people by country of asylum and cate-

Shrinking Economies, Growing Expulsions • 57
TABLE 1.5: Global Forced Displaced under UNHCR Care, 2011
Categories of displaced population Number of people (millions)
Refugees 10.4Asylum seekers (pending cases) 0.9Returned refugees 0.5IDPs assisted by UNHCR 15.5Returned IDPs 3.2Stateless persons 3.5Various 1.4Total 35.4
Data source: UNHCR 2012b.
TABLE 1.6: Countries with the Largest Reported Numbers of Internally Displaced People, 2011 (in thousands)
Country Beginning 2011 End 2011 % Change
Af ghan i stan 351 448 27Azerbaijan 592 599 1Colombia 3672 3888 6Côte d’Ivoire 517 127 −75Demo cratic Republic of the Congo 1721 1709 −1Iraq 1343 1332 −1Kenya 300 300 0Pakistan 952 452 −52Somalia 1463 1356 −7Sudan 1526 2340 53
Data source: UNHCR 2012b.
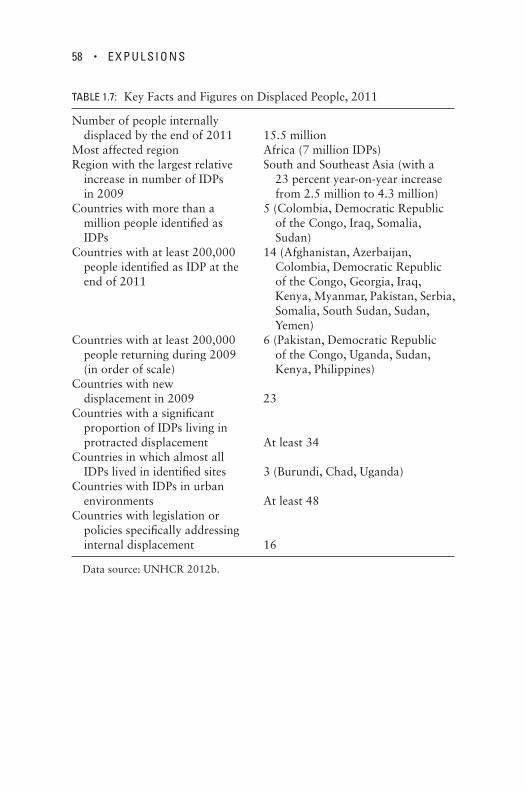
58 • E X P U L S I O N S
TABLE 1.7: Key Facts and Figures on Displaced People, 2011
Number of people internally displaced by the end of 2011 15.5 millionMost affected region Africa (7 million IDPs)Region with the largest relative increase in number of IDPs in 2009
South and Southeast Asia (with a 23 percent year- on- year increase from 2.5 million to 4.3 million)
Countries with more than a million people identifi ed as IDPs
5 (Colombia, Demo cratic Republic of the Congo, Iraq, Somalia, Sudan)
Countries with at least 200,000 people identifi ed as IDP at the end of 2011
14 (Af ghan i stan, Azerbaijan, Colombia, Demo cratic Republic of the Congo, Georgia, Iraq, Kenya, Myanmar, Pakistan, Serbia, Somalia, South Sudan, Sudan, Yemen)
Countries with at least 200,000 people returning during 2009 (in order of scale)
6 (Pakistan, Demo cratic Republic of the Congo, Uganda, Sudan, Kenya, Philippines)
Countries with new displacement in 2009 23Countries with a signifi cant proportion of IDPs living in protracted displacement At least 34Countries in which almost all IDPs lived in identifi ed sites 3 (Burundi, Chad, Uganda)Countries with IDPs in urban environments At least 48Countries with legislation or policies specifi cally addressing internal displacement 16
Data source: UNHCR 2012b.
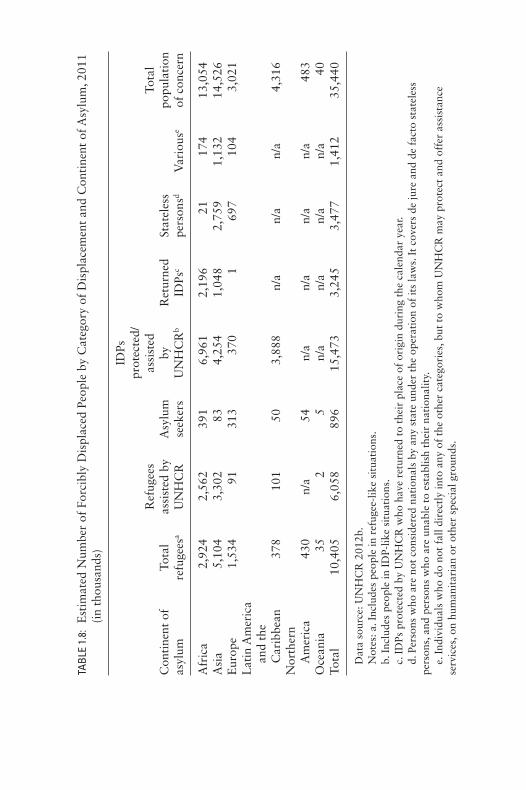
TAB
LE 1
.8:
Est
imat
ed N
umbe
r of
For
cibl
y D
ispl
aced
Peo
ple
by C
ateg
ory
of D
ispl
acem
ent
and
Con
tine
nt o
f Asy
lum
, 201
1 (i
n th
ousa
nds)
Con
tine
nt o
f as
ylum
Tota
l re
fuge
esa
Ref
ugee
s as
sist
ed b
y U
NH
CR
Asy
lum
se
eker
s
IDPs
pr
otec
ted/
as
sist
ed
by
UN
HC
Rb
Ret
urne
d ID
Psc
Stat
eles
s pe
rson
sdV
ario
use
Tota
l po
pula
tion
of
con
cern
Afr
ica
2,92
42,
562
391
6,96
12,
196
2117
413
,054
Asi
a5,
104
3,30
283
4,25
41,
048
2,75
91,
132
14,5
26E
u rop
e1,
534
9131
337
01
697
104
3,02
1L
atin
Am
eric
a
and
the
C
arib
bean
378
101
503,
888
n/a
n/a
n/a
4,31
6N
orth
ern
A
mer
ica
430
n/a
54n/
an/
an/
an/
a48
3O
cean
ia35
25
n/a
n/a
n/a
n/a
40To
tal
10,4
056,
058
896
15,4
733,
245
3,47
71,
412
35,4
40
Dat
a so
urce
: UN
HC
R 2
012b
.N
otes
: a. I
nclu
des
peop
le in
ref
ugee
- lik
e si
tuat
ions
.b.
Inc
lude
s pe
ople
in I
DP-
like
situ
atio
ns.
c. I
DPs
pro
tect
ed b
y U
NH
CR
who
hav
e re
turn
ed t
o th
eir
plac
e of
ori
gin
duri
ng t
he c
alen
dar
year
.d.
Per
sons
who
are
not
con
side
red
nati
onal
s by
any
sta
te u
nder
the
ope
rati
on o
f it
s la
ws.
It
cove
rs d
e ju
re a
nd d
e fa
cto
stat
eles
s pe
rson
s, a
nd p
erso
ns w
ho a
re u
nabl
e to
est
ablis
h th
eir
nati
onal
ity.
e. I
ndiv
idua
ls w
ho d
o no
t fa
ll di
rect
ly in
to a
ny o
f th
e ot
her
cate
gori
es, b
ut t
o w
hom
UN
HC
R m
ay p
rote
ct a
nd o
ffer
ass
ista
nce
ser v
ices
, on
hum
anit
aria
n or
oth
er s
peci
al g
roun
ds.

CO
LU
MB
IA
DE
M.
RE
P.
OF
T
HE
CO
NG
O
4,0
00
,00
0
2,0
00
,00
0
40
0,0
00
IRA
Q
Tot
al p
opul
atio
n be
low
10,
000
Incl
udin
g pe
ople
in r
efug
ee-li
ke s
ituat
ion
Incl
udin
g pe
ople
in ID
P-li
ke s
ituat
ion
a b
Ref
ugee
s
Asy
lum
-see
kers
(pe
ndin
g ca
ses)
IDP
s pr
otec
ted/
assi
sted
by
UN
HC
R
Ret
urne
d R
efug
ees,
ret
urne
d ID
Ps
Sta
tele
ss p
erso
ns
Oth
ers
of c
once
rn
(a)
(b)

Shrinking Economies, Growing Expulsions • 61
gory. None of these numbers take into account the surge in refugees after 2011, notably due to the confl ict in Syria.
Bearing the Burden of Displacement
As the above numbers indicate, Global South countries hosted 80 percent of the world’s refugees. Almost 5 million refugees resided in countries where the per capita GDP was below $3,000. The forty- eight least- developed countries provided asylum to about half of these refugees. In 2011, Pakistan, Iran, and Syria hosted the largest refugee populations, at 1.7 million, 886,500, and 755,400 respec-tively. The Global North country with the largest refugee popula-tion was Germany, hosting well over half a million people.
The refugee population has a much greater economic impact on the Global South than on the Global North. Pakistan experienced the biggest economic impact, with 605 refugees for each U.S. dollar of its per capita GDP, followed by Demo cratic Republic of the Congo and Kenya with 399 and 321 refugees for each dollar of per capita GDP, respectively. In contrast, Germany experienced a minimal im-pact on its economy from its refugee population, with 15 refugees for each dollar of per capita GDP. Clearly, economic impact might be minimal even as social impact can be high.
António Guterres, the United Nations high commissioner for refu-gees, attributed this imbalance in refugee hosting to xenophobia. “Fears about supposed fl oods of refugees in industrialized countries are being vastly overblown or mistakenly confl ated with issues of migration,” Guterres said in a statement. “It is poorer countries that are left having to pick up the burden.”46
FIGURE 1.21 Total Population of Concern to UNHCR by Country of Asylum and Category, 2011Source: UNHCR 2012a, map 1.

62 • E X P U L S I O N S
Reconceptualizing the Key Forces of Displacement
While the vast majority of displaced persons across the globe con-tinue to be forcibly expelled from their homes due to per sis tent or new po liti cal confl icts, there is also an increase in those expelled due to environmental disasters.47 Factors such as poverty and po-liti cal confl ict, which themselves can drive global dynamics of ex-pulsion, also intensify the impact of environmental disasters on the world’s poor. Bangladesh and Mozambique provide two illustrative case studies.
Bangladesh is widely recognized as one of the countries most vul-nerable to cyclones and fl ooding, both of which have increased in severity and frequency in recent years. Currently almost 40 million people in Bangladesh live in coastal zones threatened by sea-level rises. It is estimated that around 3 percent of coastal land will be lost to the sea by the 2030s and 6 percent by the 2050s. As climate change advances, however, this loss of land to rising sea levels is ex-pected to generate a far more disastrous impact on those living in coastal regions. Rising sea levels exacerbate fl ooding, bringing larger storm surges during cyclones and increased salinity levels in coastal areas; this will damage crops and drinking water supplies. Increasing salinity along Bangladesh’s coastline is a major emergent problem among communities there, as it destroys livelihoods by making vast stretches of arable land unfarmable and contaminating drinking wa-ter for both people and livestock. Beyond such impending coastal disasters, in the interior, severe droughts and heavy fl ooding are caus-ing both temporary and long- term displacements. An estimated 6.5 million people in Bangladesh have already been displaced by climate change, a number that is only expected to rise.
Mozambique is among a handful of countries suffering from both desertifi cation and sea- level rise. Major fl ooding occurred in 2001, 2007, 2008, 2010, and 2012. Mozambique has been relatively suc-cessful at resettling its climate- displaced populations, but as United
Shrinking Economies, Growing Expulsions • 63
Nations migration researchers report, resettlement removes people from the physical danger of extreme fl oods but can lead to other environmental, social, and economic diffi culties. Subsistence farm-ers and fi shers lose access to fertile lands on riverbanks and are con-fi ned to higher, drought- prone areas. And even if some regularly re-turn to the fertile land and waters, they are unlikely to maintain land own ership and their livelihoods as farmers. They increasingly be-come dependent “on governmental and international aid.”48 As in Bangladesh, the loss of livelihoods from climate change has also been the major driver of displacement in Mozambique.
Together, these global dynamics of extreme poverty, mass displace-ment, environmental disasters, and armed confl icts have created heretofore unseen levels of social expulsion, especially in the Global South but now also beginning in the Global North, albeit through different events.
Imprisonment as Expulsion
A fi nal mechanism of expulsion must be considered if we are to fully appreciate the nuances of advanced capitalism that we are liv-ing through: the rapid increase in incarceration. At the limit, it is becoming a brutal form of expulsion of surplus labor populations in the Global North, especially in the United States and increasingly in the United Kingdom. From a global perspective, one can see systemic resonances between the mass- incarcerated, ware housed refugees, and forcibly displaced people. All three signal the presence of larger foundational dynamics of expulsion that surface through the thick realities of diverse localities and systemic sites. These thick realities on the ground, along with the very different specialized research fi elds for each of these subjects, take us away from conceptualiza-tions that might point to systemic parallels. From my interpretive stance, they are indeed diverse localized forms of deeper conceptually subterranean trends that cut across established differentiations.

64 • E X P U L S I O N S
Mass incarceration has long been present in extreme dictatorships. But today it is also emerging as inextricably linked to advanced capi-talism, albeit via the formal link of crime. Most of the people who are being incarcerated are also the people who do not have work and for whom work will not be found in our current epoch; this was less the case twenty years ago, when a prisoner had a better chance to be considered rehabilitated and deserving of a job. In this sense, then, today’s prisoners in the United States and in the United Kingdom are increasingly today’s version of the surplus laboring population common in the brutal beginnings of modern capitalism.
Three trends can be seen when we look at incarceration, an old pro cess, but one that today is reaching new orders of magnitude and diversifying its institutional spaces to include private for- profi t pris-ons.49 Most notable is the increase in the numbers of the incarcer-ated, a trend evident in a growing number of countries. The United States is the most dramatic case and in that regard (again) tells us how bad it can get. The imprisoned population in the United States has increased 600 percent in the past four de cades. The 2.3 million prisoners in the United States account for 25 percent of those incar-cerated globally, giving the United States the largest single impris-oned population in the world. Second is the sharp growth globally in those under some form of protracted correctional supervision. In the United States alone, an additional 5 million people are currently on probation or parole, which means they are effectively second- class citizens, not easily hired for a job or able to get housing. Third is the growth in the privatization of prisons and prison ser vices, most developed in the United States but taking hold in more and more countries. The privatizing of prison ser vices is taking place in fi elds as diverse as policing, courts, community supervision (elec-tronic monitoring), parole, probation, and halfway houses for those who obtain early release from prison.
On each of these trends, global statistics are uneven in their crite-ria and coverage. Mea sures of the world’s prison population often leave out those who are on parole or other such forms of carceral

Shrinking Economies, Growing Expulsions • 65
surveillance. In its many guises, carceral surveillance outside the prison setting is becoming a signifi cant mechanism for social exclu-sion, which at the limit can become yet another mechanism for ex-pulsion. It is diffi cult to mea sure in most countries, let alone on a global scale. Similarly, the global rise of privatization across the many facets of the global carceral assemblage, from prisons to prison ser-vices, is also diffi cult to track. Current data on private prison facili-ties center on the United States as the pioneering country in this de-velopment, followed by a mix of countries with diverse initiatives at different stages of development, including Mexico, New Zealand, Peru, South Africa, and the United Kingdom.50
To gain a handle on this emergent condition of expulsion through imprisonment, I begin by analyzing U.S. incarceration in the global context, then move to a detailed analysis of the rise of prison priva-tization in the past four de cades.
U.S. Incarceration in Global Context
At present, 1 in 100 Americans is incarcerated in a U.S. state or fed-eral prison or detained in a local jail awaiting trial.51 When those on probation or on parole are added, the total fi gure tops 7 million people— 1 in 31 Americans. And if all people with an arrest or con-viction record are counted, the number reaches 65 million people— 1 in 4 Americans. That the United States criminal justice system now touches overall 25 percent of the population is quite extreme compared with most Global North countries. If there was ever an argument to be made for American exceptionalism, the mushroom-ing state and private corporate prison complex would likely be the proof. Not only does the United States lead the globe in incarcera-tion rates, but the state of Louisiana has become the world’s prison capital, with 1 in 55 Louisianans currently living behind bars.
A state- by- state analysis of incarceration rates in the United States makes it clear that the carceral boom is far from uniform; this also points to the need for fi ner politico- legal differentiations

66 • E X P U L S I O N S
inside countries in country- by- country analyses across the globe. While the southern states of Louisiana, Mississippi, Oklahoma, Ala-bama, and Texas lead the nation in residents on lockdown, the New En gland states of New Hampshire, Massachusetts, Rhode Island, and Maine bring up the rear. States with high incarceration levels are frequently represented as suffering from a regional proclivity toward criminality. Rather, what those states have in common are adminis-trative rules and practices such as protracted pretrial detention, harsh sentencing laws, and minimal opportunities for pre- release. High- incarceration states also share another feature: the proliferation of for- profi t prisons and for- profi t prison ser vices.
To this list of variables that are part of how a criminal justice sys-tem is or ga nized and run, the International Centre for Prison Studies adds several others to establish the specifi city of the United States carceral state in global perspective. According to the ninth edition of “World Prison Population List,” released in 2011, it is estimated that more than 10.1 million people are held in penal institutions throughout the world, mostly as pretrial detainees/remand prisoners or as sentenced prisoners.52 This fi gure excludes seven countries for which data were not available. Note that the 2011 report does not control for differences in carceral practices among countries, which can make a sharp difference in the overall data. Among variables not included is whether all pre- trial detainees and juveniles are held under the authority of the prison administration and whether prisons are used to house people with mental illnesses and/or those detained for drug and alcohol addiction. Moreover, those held in a form of custody not under the authority of the prison administration— for example, the 5 million people in the United States who are on proba-tion or parole— are generally excluded from the offi cial national prison totals.
Despite such discrepancies, the International Centre for Prison Studies draws several key conclusions in its analysis of global prison population trends. One is that “almost half of [those held] are in the

Shrinking Economies, Growing Expulsions • 67
United States (2.29m), Rus sia (.81m), and China (1.65m sentenced prisoners),” with another 650,000 in detention centers in China. Figure 1.22 shows the steady growth of state and federal prisoners in private facilities from 2000 to 2010.
It is more challenging to estimate a global equivalent to the United States number of 7 million Americans under some form of correc-tional supervision ( jail, prison, probation, parole). Parole is not widely used in much of the world; it remains a judicial practice primarily of wealthy Western countries. On the other hand, poor countries tend to have vastly more people detained while awaiting trial. In 2008, The International Centre for Prison Studies conducted a global anal-ysis of pretrial detainees and other remand prisoners in all fi ve con-tinents, estimating that as many as 2.5 million people worldwide were incarcerated while awaiting trial. In Liberia, Mali, Haiti, An-dorra, Niger, and Bolivia, 75 percent or more of the total prison population is awaiting trial. In 2008, the Open Society Foundation launched a global pretrial campaign as part of their initiative on
0
20000
40000
60000
80000
100000
120000
140000
2000 2005 2010
Total Federal State
FIGURE 1.22 U.S. State and Federal Prisoners in Private Facilities, 2000– 2010Data source: Guerino, Harrison, and Sabol 2012, appendix table 19.

68 • E X P U L S I O N S
rights and justice. By their estimates, approximately 3 million people are behind bars awaiting trial on a given day in our world, and the annual estimate is 10 million unduplicated individuals.53
Private Prisons
The proliferation of for- profi t prisons and for- profi t prison ser vices that undergirds big carceral systems in the United States serves as a window on what is actually involved in such a system.54
In the case of the United States, historians often trace the concept of private prisons to the convict leasing system that emerged in tandem with the Black Codes after the abolition of slavery in the United States. But the rise of discrete, privately operated correctional facilities is decidedly a twentieth- century development. As early as the 1970s, private companies began to take over the operation of halfway houses in the United States at a time of rapidly rising incar-ceration rates due to drug- related convictions; public facilities could not handle the added numbers. In the 1980s, private corporations further encroached “on the ‘soft’ end of the correctional continuum” by contracting with the Immigration and Naturalization Ser vice (INS) to detain undocumented immigrants.
In 1984, the Corrections Corporation of American (CCA) became the fi rst for- profi t prison company to win a contract to run an entire prison facility, in Hamilton County, Tennessee. Some years later, the Wackenhut Corrections Corporation (now GEO Group) was set up. By the 1990s, both CCA and Wackenhut had set their sights overseas, striving to infl uence government policy and/or gain prison contracts in the United Kingdom, Australia, and France. A 2001 U.S. Depart-ment of Justice report estimated that there were 184 privately oper-ated correctional facilities worldwide, which held a total of 132,346 people in custody. Of these, 158 were in the United States. These were distributed across thirty states, Puerto Rico, and the District of Columbia, but concentrated in the southern and western regions of

Shrinking Economies, Growing Expulsions • 69
the country. The remaining twenty- six facilities out of the total 184, included ten in the United Kingdom and twelve in Australia.
Private prisons continued to proliferate throughout the fi rst de-cade of the twenty- fi rst century in the United States, at rates roughly proportional to the overall growth in the U.S. prison population (see Figure 1.22). By year- end 2010, private facilities in the United States housed 128,195 state and federal prisoners. About 16 percent of United States federal prisoners (33,830) and nearly 7 percent of state prisoners (94,365) were housed in private facilities on December 31, 2010. Table 1.9 provides a regional breakdown of state and federal prisoners held in private prisons in 2000, 2009, and 2010. By 2010, thirty states in the United States had some level of privatization, with seven states housing more than a quarter of their incarcerated in pri-vate prisons.
By 2005 prison privatization, often in the form of emergent public- private partnerships, was present on all continents, even if not comparable to the U.S. level.55 Laura McTighe analyzed a series of briefi ngs on prison privatization released by the Public Ser vices International Research Unit and found the following patterns and conditions in the year 2005:
• In Eu rope, the countries that made decisions regarding private prisons or private sector involvement in prisons were Belgium, the Czech Republic, France, Germany, Hungary, Ireland, and the United Kingdom. France’s famed thirty- facility public- private prison partnership provided the blueprint for the country’s ex-pansion into for- profi t juvenile detention. The United Kingdom continued to extend the role of the private sector in its carceral system, including a new privatized electronic monitoring pro-gram; this expansion proceeded in the face of increased media attention focused on deplorable conditions in private facili-ties. Hungary started construction of a 700- bed private prison and planned a second to open in 2007, and the Czech Republic

70 • E X P U L S I O N S
planned its fi rst private prison. Ireland drew up plans for its fi rst private prison, opened nine private courts, privatized its elec-tronic monitoring, and converted two empty prisons into for- profi t halfway houses. In Germany, the British company Serco was awarded a fi ve- year contract to provide psychological, medical, and educational ser vices; video surveillance, kitchens, workshops, and facility management ser vices; and industrial work for 300 prisoners in conjunction with other companies. Greece rounded out the list with a year- end opening of six new prisons and passage of a new law that provided the framework for future public- private partnerships.
TABLE 1.9: U.S. State and Federal Prisoners in Private Facilities, by Region and States with Largest Populations in Private Prison, 2000– 2010
Region 2000 2009 2010% all prisoners
(2010)
U.S. total 87,369 129,333 128,195 8.0
Federal 15,524 34,087 33,830 16.1State 71,845 95,246 94,365 6.7
Northeast 2,509 5,423 5,301 3.0New Jersey 2,498 2,950 2,841 11.4Pennsylvania 0 920 1,015 2.0
Midwest 7,836 4,895 5,885 2.2Indiana 991 2,479 2,817 10.1Ohio 1,918 2,195 3,038 5.9
South 45,560 58,737 60,491 9.2Florida 3,912 9,812 11,796 11.3Texas 13,985 19,207 19,155 11.0
West 15,940 26,191 22,688 7.3Arizona 1,430 8,971 5,356 13.3New Mexico 2,155 2,822 2,905 43.6
Data source: National Prisoner Statistics Program 2013.

Shrinking Economies, Growing Expulsions • 71
• In Asia and the Pacifi c, the countries that were developing pri-vate prisons in 2005 were Israel, Thailand, Rus sia, and Hong Kong. Israel awarded its fi rst prison contract. Thailand con-ducted a substantial feasibility study on prison privatization. Rus sia’s economy ministry was considering private prison con-struction as a solution to the $9 billion estimated cost to modernize its existing penitentiary system. Members of Hong Kong’s Special Administrative Region government made a trip to the United Kingdom to study its public- private partnership prison projects.
• In Africa, South Africa ended the year with its two private prisons running strong and four new facilities under construction. The leadership of the New Partnership for Africa’s Development, an economic development program run by the African Union, in-creasingly looked to South Africa as a model for private- sector fi nancing of prisons and other ailing public ser vices.
• In the Australia and Oceania region, the American company GEO Group lost its only prison contract in New Zealand and was increasingly under investigation surrounding correctional issues in Australia. But by the end of the year Australia had not only privatized the New South Wales government’s police sta-tions but also welcomed a new private prison lobbying group on the national scene.
• In South America, Ec ua dor’s interior minister advocated the expedited expansion of prison privatization, while a constitu-tional court thwarted Costa Rica’s attempt to award a private prison contract to a Utah- based company.
• In North America, Canada made a major step toward privati-zation when it contracted prison monitoring out to a for- profi t corporation.
This one- year snapshot of global private prison expansion is in-structive for several reasons. While much research has been conducted
72 • E X P U L S I O N S
on prison privatization in the United States, for- profi t prisons had become a decidedly global phenomenon by the turn of the twenty- fi rst century. Many of the corporations that led the U.S. privatiza-tion boom earned as much as 20 percent of their profi ts from overseas prison contracts. Furthermore, this global snapshot helps to illuminate the legal and legislative mechanisms through which privatization was often introduced, and the wide variety of prison settings in which private fi nancing was able to fl ourish. Thus analy-ses of worldwide private prisons that focus solely on prisons hold-ing sentenced adults and pre- trial detainees can miss key develop-ments. Among such developments are, for instance, the expansion of privatization into juvenile detention facilities in France, halfway houses in Ireland, and electronic monitoring programs in the United Kingdom and Canada. Beyond such dedicated for- profi t facilities and correctional supervision strategies, carceral systems also saw the rise of prisons that outsourced to for- profi t companies ser vices such as health care, education, food, and transportation, as was the case in Germany. The evolution from public to private prisons was often initiated through parliamentary debates and legislation; this was the case in Greece, Rus sia, Hong Kong, and Ec ua dor. Finally, lobbying efforts by private prison companies often served to expand privatization even (and especially) in the face of media and in de pen-dent monitoring evidence of the failures of private prisons, as was the case in Australia.
Private prisons and prison ser vices corporations in the United States pursue their goals as a regular private fi rm might (see Figure 1.23). Campaign contributions in the 2000s by two major corpora-tions had reached several million dollars by the 2010 election cycle in Washington, DC (see Figure 1.23) and even more at the state level. In economies where privatization has been seen as effi cient the argument for private prisons is easy to make. Yet prisons are not just any way of making profi ts.56 Profi ts come from fi lling beds and selling state prison ser vices. Indeed, there is evidence of bribes to keep prison beds full and profi ts up. In what is probably an extreme case, the Penn-

Shrinking Economies, Growing Expulsions • 73
sylvania Supreme Court in 2011 overturned about 4,000 convic-tions issued by Judge Mark Ciavarella, dubbed the “kids- for- cash” judge after he accepted $1 million in bribes from developers of privatized juvenile detention centers and then presided over trials that sent youth to those same centers.57 There are multiple in-stances across the United States, albeit in milder versions, of this push to keep prison beds occupied: the rise in longer sentences even for minor offenses, three- strikes- and- you’re- out legislation (whereby a third felony conviction mandates life imprisonment), the greater like-lihood that even the very el der ly and impaired are being kept in prison. Together these and other mea sures result in an expanding prison pop-ulation that generates a greater demand for prison beds; directly or indirectly, this generates a greater demand for private prisons and prison ser vices. Despite such gross miscarriages of justice, the myth that privatization decreases costs and increases safety has remained largely untouched.
0
100
200
300
400
500
600
2002 2004 2006 2008 2010 2012
Correction Corporation of America The Geo Group
FIGURE 1.23 Washington Campaign Contributions (in thousands of dollars), 2002– 2012Source: Kirkham 2012.
74 • E X P U L S I O N S
Beyond the privatization of prisons, jails, juvenile facilities, half-way houses, electronic monitoring programs, and in- prison ser-vices, many transnational corporations have set up satellite factories inside prisons. This is often facilitated by for- profi t prison contracts, as was the case in Germany when the British company Serco took over the majority of operations. Throughout the Federal Bureau of Prisons in the United States, all sentenced prisoners are required to work so long as they are medically able. Institution assignments vary, and wages are a meager 12¢ to 40¢ per hour. Those employed in Federal Prison Industries make slightly more for the metals, fur-niture, electronics, textiles, and graphic arts they are required to produce; pay ranges from 23¢ to $1.15 per hour, of which up to 50 percent can be garnished to cover court- ordered fi nes, victim resti-tution, child support, and other monetary judgments.58 Federal Prison Industries is a U.S. government- owned corporation created in 1934 to provide job skills training to federal prisoners, who work for the federal government; it is a very different arrangement from that used by corporations who use prison labor. Private cor-porations can benefi t from such low- wage labor in several ways: (1) from directly using prisoner labor for manufacturing and ser-vice jobs, (2) by contracting with other companies to purchase products or ser vices made by prisoners, and (3) by investing in the private prison corporations responsible for the ever- expanding global correctional system. Available evidence suggests that the ma-jority of corporations profi ting from prison labor, including Chev-ron, Bank of America, AT&T, Starbucks, and Walmart, fall into the second mode.
In prisons and jails across the United States, increasingly the commodity being bought and sold is prisoners themselves. This has been facilitated by a shift in the way that prisons are funded by the government: from cost reimbursement to fi xed- rate per diem sys-tems, whereby a prison receives a fl at fee per incarcerated person per day. Recently, several state prison systems have transitioned

Shrinking Economies, Growing Expulsions • 75
from cost reimbursement to per diem systems for their entire facili-ties. The practice is also starting to extend to local jails: New Or-leans became the fi rst major U.S. city to fi nance its local jail through a per diem system.
Until the 1880s, the Department of the Interior and its U.S. Mar-shals Ser vice were responsible for federal prisoners at facilities across the United States, including local jails. Historically, the U.S. Marshals Ser vice housed federal prisoners at facilities across the United States, including local jails. Per diem funding dates back to that time, when the federal government began to “rent” beds in state prisons and local jails for housing those serving federal time. However these federal prisoners were by far the exception. This is an important point to underscore if we are to understand why mass incarceration has become such a powerful vehicle of expulsion un-der our current phase of advanced capitalism.
This may seem like little more than a logistical change in the way that prison operators are reimbursed by the state or local municipality. In practice, however, reimbursement for incarcer-ated bodies rather than actual prison operating costs has created a perverse incentive to lock up more people for longer periods of time at taxpayers’ expense. If a person is held in custody for even twenty- fi ve hours, a prison or local sheriff’s offi ce is reimbursed for two days. After basic operating costs are covered, anything left over is profi t for the sheriff. (In contrast, one might posit that if the bottom line is operating costs, it would seem that fewer prisoners for less time is the ideal, and it would mean using less of the tax-payers’ money.) The capacity for profi t generation through the warehousing of incarcerated people has been leveraged in critical ways outside of the dynamics of prison privatization discussed thus far. For example, it has now been well documented that sher-iffs in rural Louisiana parishes trade prisoners among facilities to keep all beds full and, thus, reimbursement rates at the highest pos-sible amount.

76 • E X P U L S I O N S
Conclusion: Predatory Formations
A long chapter with many diverse strands deserves a short and sharp conclusion. There is one or ga niz ing proposition across all these diverse strands: since the 1980s, there has been a strengthen-ing of dynamics that expel people from the economy and from society, and these dynamics are now hardwired into the normal functioning of these spheres. One outcome is the shrinking of the recognized economy— recognized in standard mea sures. I see this as a rupture with the preceding period— the Keynesian period in some parts of the world, and, with its own modes, the working commu-nist state period in others. In both these types of po liti cal economy the systemic tendency was toward incorporating people, especially as workers, notwithstanding social exclusions of all sorts. In this sense they contrast with the expulsion dynamics I see as prevailing in the current post- 1980s period across diverse types of po liti cal economies (though this chapter has largely focused on po liti cal economies in the Global North; Chapter 2 will concentrate on the Global South).
Getting at those expulsions meant getting at a mix of very di-verse conditions and local specifi cs— in short, getting to ground level. To do this I used established data sets, albeit to explore an idea that is far from established. In the established data, each condition is specifi c to a country and a sector, and each has been researched and conceptualized on its own terms. And yet at ground level, a level not intermediated by the specifi cs of nation and sector, each of the examined conditions contains within it an expulsion dynamic— marked by extremes in unemployment, pov-erty, suicide, displacement from home and land, incarceration, or suicide.
Beyond the empirics of each condition, the second strand or ga-niz ing the chapter is the need to conceptualize these diverse condi-tions inside countries and across countries in ways that make visi-

Shrinking Economies, Growing Expulsions • 77
ble deeper shared dynamics across sectors and countries. A prison in the Global North is not the same entity as a displaced- persons camp in the Global South. The “long- term unemployed” and small busi-ness bankruptcies in each Greece, Italy, and India are not the same as the “excess suicides” in each country. The emigration of Spain’s middle- class citizens because they have been expelled from the pros-perity zone of their country’s economy is not the same event as small-holder farmers migrating to urban slums because they have been ex-pelled from their land. Each one of these cases is specifi c, and each one has been researched and conceptualized on its own terms via the existing data. In this chapter I have sought to capture the fact itself of this mix of local events and situated meanings. And yet, at ground level, not intermediated by the specifi cs of country and sec-tor, they all go in one direction— toward pushing people out.
I conceive of the mix of elements that generates each of the par tic-u lar expulsions examined in this chapter as a kind of predatory for-mation. That is to say, these expulsions are not simply the result of an individual’s, a fi rm’s, or a government’s decision or action. Yes, such decisions and actions matter, but they are part of larger assem-blages of elements, conditions, and mutually reinforcing dynamics. Suicide is a very personal decision, but the demographic concept of “excess suicides” in specifi c places and situations is partly a function of a larger assemblage of conditions. Eu ro pe an Central Bank and IMF offi cials have made the decision to insist on government debt reduction via cuts in basic ser vices and the jobs of mostly modest- salaried government employees. Yet we cannot simply say that the IMF and the bank are guilty of the extreme outcomes discussed in this chapter; the decisions of these powerful actors are part of a larger assemblage of institutional changes implemented in the name of the “proper way of running an economy,” an idea that goes back to the 1980s and has now spread worldwide. Similarly, each of the cases discussed in this chapter arises partly out of the application of complex knowledges and the deployment of complex technologies.
78 • E X P U L S I O N S
Yet we cannot simply say that such knowledges and technologies are the cause of the extreme outcomes analyzed here.
There is a kind of systemic logic at work in each of these preda-tory formations. It is this logic that led me to the notion of a forma-tion rather than simply a collection of powerful individuals and fi rms that make decisions with major consequences for people and places worldwide. At the heart of this logic is a distortion when compared to the prior period— that of rising welfare states in many market economies as well in many communist countries.
Perhaps this systemic logic is clearest in the case of private pris-ons and, as I examine in Chapter 2, land grabs. Profi t- driven private prisons are not the same as government prisons. Strictly speaking, the latter are part of a government’s larger obligation to protect its citi-zens from genuinely dangerous individuals. Since it is meant to be a public good fi nanced through citizens’ taxes, the goal of a govern-ment prison is to imprison those who are a danger and only for as long as is necessary: citizens’ taxes should not be used on frivolous imprisonment and unnecessarily long terms (though in practice, the right balance among these imperatives— protecting citizens and using citizens’ taxes wisely— is rarely fully achieved). When prisons become a corporate business whose logic is not unlike the logic of a motel owner— fi ll those beds— the goals are opposite from those of govern-ment prisons: to imprison more people and to keep them there for longer periods. As I examined in this chapter, the proliferation of pri-vate for- profi t prisons has coincided with far longer sentences for trivial acts and a further increase in the rate of incarceration. There are decision makers at each step of the pro cess, but they are caught in a sticky web of systemic logics. Finally, the profi ts of private prisons are represented as a positive addition to a country’s GDP even as they are a government cost; in contrast, government- run prisons are only represented as government debt.
It is this type of predatory logic embedded in an assemblage of diverse elements, each only a bit of a larger formal institutional
Shrinking Economies, Growing Expulsions • 79
domain, that marks much of our current period. In Chapter 2 I focus on yet another such systemic logic: when a corporation or a foreign government acquires a large tract of land to grow palm to make biofuels, it expels whole fl oras and faunas, small farmers, rural manufacturing setups, and more. But it all translates into a rise in corporate profi ts and an increase in a country’s GDP. Each of the predatory formations discussed in this book also tells us something about the larger challenge we confront— one that goes beyond pow-erful individuals and institutions.
80
The acquisition of local land by foreign governments and foreign fi rms is a centuries- old pro cess in much of the world. But we can detect specifi c phases in the diverse histories and geographies of such acquisitions. A major such shift began in 2006, marked by a rapid increase in the volume and geo graph i cal spread of foreign acquisitions, as well as the diversity of the buyers. More than 200 million hectares of land are estimated to have been acquired from 2006 to 2011 by foreign governments and fi rms. Much of the pur-chased land is in Africa, but a growing share is now in Latin Amer-ica and, a fi rst since the post– World War II era, in several countries in Europe and Asia, notably Rus sia, Ukraine, Laos, and Vietnam. Finally the buyers are increasingly diverse, including purchasers from countries of origin that range from China to Sweden, and fi rms from sectors as different as biotechnology and fi nance.
What matters for my analysis is this extremely sharp change in the total level and geo graph i cal range of foreign land acquisitions. It represents a break in a long- term trend and thereby becomes an indicator of a larger systemic shift, one that goes beyond the old, established patterns of acquisition. Two signifi cant factors contrib-ute to this sharp increase in acquisitions. One is the growing de-mand for industrial crops, notably palm for biofuels, and for food crops, the latter still coming largely from the states of the Persian
CHAPTER 2
The New Global Market for Land

The New Global Market for Land • 81
Gulf and from China. The second is that growing demand for land and the sharp rise in global food prices in the 2000s made land a desirable investment, even for speculative reasons. It is now public knowledge that the major banks were already concerned in 2006 about signs of the extraordinary fi nancial crisis that was about to break. It is no coincidence that land then surged as a destination for investment capital, both because of its materiality (the thing itself, rather than a derivative representing land) and as a means of access to an expanding range of commodities (food, industrial crops, rare earth minerals, and water).
The acquisition of foreign land is not a lone- wolf event. It re-quires, and in turn stimulates, the making of a vast global market for land. It entails the development of an also vast specialized servicing infrastructure to enable sales and acquisitions, secure property or leasing rights, develop appropriate legal instruments, and even push for the making of new law to accommodate such purchases in a sovereign country. This is an infrastructure that goes well beyond supporting the mere act of purchasing. It not only fa-cilitates but also stimulates further foreign acquisitions of land. This increasingly sophisticated specialized ser vice sector invents new types of contracts and forms of own ership, and creates innova-tive accounting, legal, and insurance instruments.1 As it develops, this specialized sector, in turn, depends on further acquisitions of foreign land as a source of profi ts. We see the beginnings of a large- scale commodifi cation of land, which may in turn lead to the fi nan-cializing of the commodity we still call, simply, land.
The scale of land acquisitions leaves a large global footprint. It is marked by a vast number of microexpulsions of small farmers and villages, and by rising levels of toxicity in the land and water sur-rounding the plantations constructed on the acquired land. There are growing numbers of displaced people, rural migrants moving to slums in cities, destroyed villages and smallholder economies, and, in the long run, much dead land. What actually happens when a
82 • E X P U L S I O N S
new own er/leaser, whether national or foreign, has acquired 2.8 million hectares of land to grow palm for biofuels? Mostly, dozens of villages, whole smallholder agriculture districts, and whole man-ufacturing operations in these rural regions are expelled from the land. Some may receive compensation and some may be resettled in equivalent terrain. But generally speaking, the losses are far larger than the compensations. Finally, fl ora and fauna are expelled to make room for monocultures. All this brings degradation of the land and the earth itself, through loss of diversity of nutrients and of insect life. After a few de cades, the land will be exhausted, clinically dead, as we have seen in older plantation zones in Cen-tral America, the Ca rib be an, and parts of Africa. In the very long term the land may recover, but the descendants of the expelled farmers and rural manufacturers will most likely not benefi t, and instead fi nd themselves living in crammed slums at the edges of large cities.
Let me emphasize that this trajectory has become the norm, re-gardless of who is purchasing land and where. Millions of Brazilian smallholders have been expelled from their farmland, which has been taken over by vast soya plantations that produce for export. The developers may be national or foreign corporations and indi-viduals. One outcome has been hunger in areas where there used to be little if any hunger even if they were poor: soya has replaced black beans, which were a source of income and food for poor farmers. And many of them have had no option other than to mi-grate to the slums of large cities. The new hunger is further accentu-ated by the toxicity that large plantations bring to the surrounding area, making it diffi cult for the house holds of plantation workers to use their small plots to grow food.
The actual material practices that underlie these large- scale for-eign acquisitions vary enormously. I am interested in these material practices, which transform sovereign national territory into a far more elementary condition— land for usufruct. This pro cess, at least indirectly, degrades the governments that sold and leased the

The New Global Market for Land • 83
land. The eviction of farmers and craftspeople, villages, rural man-ufacturing districts, and districts of agricultural smallholders simi-larly degrades the meaning of citizenship for local people. And when the mines and plantations occupy land where there are no people, they degrade water and earth. Such material practices re-constitute territory in vast stretches of the nation- state: territory becomes merely land in the case of plantations and dead land in the case of mines.
These are accelerated histories and geographies in the making. Right now we know that many millions of people are dramatically affected by the scale of these pro cesses. The fact that the vast ma-jority of acquisitions since 2006 have been by foreign governments and fi rms may or may not prove decisive for the people of those areas. Sometimes host governments have agreed to these deals for the benefi t of local elites; other times they have simply succumbed to pressures and commissions. Researchers can fi nd it easier to track foreign rather than national acquisitions of land, as informa-tion about the former is more likely to be in the public domain. But large- scale national acquisitions are also happening, with implica-tions similar to those I discuss for foreign acquisitions. The critical dimension explored in this chapter is the empirical one: the scale, geography, purpose, and diversity of foreign acquisitions.
This empirical examination aims at laying down the facts in or-der to signal the devastating consequences that rural populations and rural land may face. Given the recency of this new wave of ac-quisitions, we do not yet fully know the consequences for all the people and the land caught up in this vortex of large- scale acquisi-tions. But we do know enough to be worried.
Debt as a Disciplining Regime: Preparing the Ground for Land Acquisitions
Today’s large- scale acquisitions of foreign land are enabled by the explicit aims and unplanned consequences of the IMF and World

84 • E X P U L S I O N S
Bank restructuring programs implemented in much of the Global South in the 1980s. To this we can add the demands of the World Trade Or ga ni za tion (WTO) in the 1990s and into the 2000s to lift import- export barriers in the name of “free trade.” The resulting mix of constraints and demands had the effect of disciplining gov-ernments not yet fully integrated into the regime of free trade and open borders pursued mostly by large fi rms and the governments of dominant countries.
The aim was compliance with what was then an emerging body of rules and conditionalities that eventually were represented as self- evident norms for the proper governing of an economy if a country was to have growth and prosperity. Among the better- known of these quasi- norms were the control of infl ation even if it meant sacrifi cing economic growth and employment, reduction of apparent government waste at just about any cost; payment of debt even if it meant cutting social benefi ts, health care, and infrastruc-ture development; and privatization of all the basic ser vice func-tions, from telecommunications to banking.2 These norms, imposed on Global South countries through IMF and World Bank restruc-turing programs beginning in the 1980s, resonate with what today goes under the name of “austerity” in Eu rope.
In my reading, then, it is not merely the fact that governments of poor countries are burdened with debt repayment that creates suf-fering, as much well- meaning discussion of the Global South and the eurozone describes. What also matters is the larger assemblage of elements within which debt functions and which the dynamics of debt helped constitute. Let me bring in the qualifi ers later and for now put it brutally for the sake of clarity. Even if privatization and the lifting of trade barriers are not by themselves destructive forces, they tend to become so in the context of weak governments weighed down by costly debt restructuring programs. Indeed, they have be-come mechanisms for the direct and indirect destabilizing of a large number of governments in the Global South. For instance, many
The New Global Market for Land • 85
national manufacturing and consumer ser vices fi rms have gone un-der because they could not compete with cheap mass imports by global fi rms. In short, these diverse programs had the effect of re-conditioning national sovereign frameworks in ways that enabled the insertion of national territory into the new or emerging global corporate circuits. Once there, territory became land for sale on the global market.
My core conceptual move here is to see these programs of the 1980s and onward as regimes of discipline. These regimes aimed at a major restructuring of the role of government and at making the executive branch of government beholden to powerful inter-national organizations such as the IMF, the World Bank, and the WTO. These regimes do not exist simply to push for repayment of debt and a few policy changes, though perhaps the work of the IMF and the WTO did, de cades ago, begin with such limited goals. Nor have the IMF, World Bank, and WTO programs in the Global South succeeded in what they presented as necessary policies to achieve economic growth. Where followed, their advice has not delivered either economic development or strong demo cratic gov-ernment. The effect in most of the program countries was, rather, a massive increase in indebtedness to foreign lenders and a sharp shrinkage in government funds for education, health, and infra-structure. Nor did the private economic sector fare well: there were widespread bankruptcies among local enterprises after the entry of well- capitalized foreign mass- market fi rms. Indeed, the IMF has had to face up to this by implementing special debt relief programs for the forty- one so- called HIPCs (highly indebted poor countries).
The language of failed states, the most common way to describe these weakened, often devastated nation- states, leaves out many of the negative effects that key actors of the international governance system, notably the IMF and the WTO, have had on program coun-tries. Such language represents these states’ decay as endogenous, a function of their own weaknesses and corruptions. These states are

86 • E X P U L S I O N S
indeed mostly weak, corrupt, and uncaring about the well- being of their citizens. But it is important to remember that it often is and was the vested interests of foreign governments and fi rms that en-abled the corruption and weakening of these states. And good lead-ers who resisted Western interests did not always survive; consider, notably, the now- recognized murder of the Congolese leader Patrice Lumumba by the United States government. Further, the extensive land acquisitions now under way, with the expulsions of small farm-ers and poisoning of land they are causing, cannot be understood simply as a consequence of the corruption of host states.
IMF and World Bank restructuring programs prepared the ground for the systemic deepening of advanced capitalism. This is not a novel point, and while I agree with the well- known critiques of these programs, my focus here is on something that has received less attention: detecting how those restructuring programs partly enabled the ease with which foreign buyers can purchase land in many of the countries subjected to such programs, and the ease with which governments are willing to allow those acquisitions. Greed and money are not enough to explain the outcome. Further, notwithstanding the similarities to older imperial epochs, there is now clear treaty law that asserts the authority of all national states over their territory. As a result, it is actually not so simple for a gov-ernment to acquire vast stretches of land in a foreign country, nor for a government to sell or lease its land to a foreign government. Enablements, which include corruption and a government’s over-whelming foreign debt, can play a role in the negotiation. But so can innovative lawyering, accounting, and business deal- making.
There are (at least) two vectors through which we can identify the bridge between restructuring programs and today’s massive land acquisitions. One is the debt regime as a factor that helps weaken and impoverish national governments in much of the Global South. This in turn has often been a factor in governments’ extreme corruption and disregard for the nation’s well- being, especially in

The New Global Market for Land • 87
underdeveloped but resource- rich countries. It can also be a factor in a government’s willingness to sell vast amounts of land and expel whole villages from their land to do so. The other vector is the debt regime: it can function as a strong and “legitimate” point of entry into a sovereign nation- state; what was once open access to the economies of Global South countries for the IMF and World Bank seems to have eventually been extended to foreign governments and fi rms. The debt regime, in turn enabled extensive fi scal disci-plining and prioritized the payment of foreign debt over national priorities such as education and economic development. To put it bluntly, it is easier for rich foreign governments and investors to acquire vast stretches of land in sub- Saharan Africa and parts of Latin America and Asia if their dealings are with weakened and/or corrupt governments and local elites, with little if any voice and po-liti cal repre sen ta tion left for the population.
This is not to argue that rich countries, global fi rms, and interna-tional organizations have long conspired to weaken poor countries specifi cally to enable purchases of land. I am extracting the older history alluded to earlier in this chapter, which begins in the 1980s with restructuring programs, and arguing that it weakened and im-poverished those national governments. As I will discuss later, many of these countries had developed both mass manufacturing and a middle class employed in government bureaucracies; for instance, Mogadishu, Somalia, was a middle- class city, with a large educated workforce and a prosperous working class. When national debt ex-ploded in the 1980s in much of sub- Saharan Africa, partly due to the recycling of so- called post- 1973 OPEC dollars, much of this progress was thwarted. Key reasons were the imposition of debt repayment priorities and the opening of markets to powerful for-eign fi rms. This weakened the state, thereby impoverishing the mid-dle classes, and it destroyed the indigenous manufacturing sector, which could not compete with large mass- market foreign fi rms. A downward cycle was put in motion that in turn enabled the much

88 • E X P U L S I O N S
later large- scale acquisition of land by foreign governments and fi rms.
One way of reading this earlier history in the Global South is to see it as an antecedent of what has begun to crawl into the Global North through the venue of state defi cits as those defi cits began to rise sharply over the last few years.3 A key component of these rising defi cits among Global North governments is the falling share of corporate taxes in total state tax revenue; to this we can add in some countries, massive transfers of state tax revenue to fund bail-outs or cheap money for banks. The growing dependence of states on individual tax payments makes the state even more vulnerable given a fi nancial crisis with massive repercussions on the economy, notably a sharp rise in unemployment. Add to this the bankruptcies of growing numbers of small enterprises, often family- owned, which are unlikely to use tax havens, and states experience an additional loss of revenue. These losses proceed alongside the sharp rise in corporate profi ts— public resources decline and private resources grow, as examined in Chapter 1. Under its own specifi c modalities, the Global North experiences an asymmetry between the fortunes of governments and major fi rms similar to what I examine here for the Global South. In the Global South this facilitated, among other things, the concentration of benefi ts at the top (including the upper levels of the middle class), thinned out the modest middle classes, and sharpened the meaning of poverty. This looks remark-ably similar to the major trends in Greece today, even though Greece’s wealthy elites mostly do not live in that country, unlike what is the case in Angola and Nigeria, for instance. The structural adjustment programs imposed on Global South countries echo the austerity politics of the Global North, not just in Greece but also in countries as diverse as the United States and the Netherlands.
Debt and debt- servicing problems have long been a systemic fea-ture of the developing world. But the par tic u lar features of debt negotiated by the IMF, rather than the fact of debt per se, are what

The New Global Market for Land • 89
concern me here: this was not just about debt, but rather about us-ing the issue of debt to reor ga nize a po liti cal economy. The second feature that concerns me is how the gradual destruction of tradi-tional economies in rural areas prepared the ground, literally, for some of the new needs of advanced capitalism, notably land for plantation agriculture and for access to water, metals, and minerals. While the pursuit of these needs is familiar and has happened be-fore, my argument is that they are now part of a new or ga niz ing logic that changes their valence and their macro- level effects. This notion or proposition is based on a methodological and interpreta-tion practice I develop at length elsewhere.4
With few exceptions, poor countries subjected to the restructur-ing regime that began in the 1980s now have larger shares of their populations that are in desperate poverty and are less likely to enter the “modern” economy via consumption than they did even twenty years ago, a dynamic that parallels certain developments in the Global North (see Chapter 1). When this new era began in the 1980s, many sub- Saharan countries had functioning health and education systems and economies, and less absolute destitu-tion than today. Also, resource- rich countries have seen more of their people become destitute and expelled from basic survival systems because of those resources, even as another part of their population becomes a rich middle class, also because of those re-sources; Nigeria and Angola are probably the most familiar cases of this common pattern in the current de cade. The dominant dy-namic at work for these populations is, to a good extent, the op-posite of the old Keynesian dynamic of valuing people as workers and as consumers. Expulsions from home, land, and job have also had the effect of giving expanded operational space to criminal networks and to the traffi cking of people, as well as greater access to land and underground water resources to foreign buyers, whether fi rms or governments. Systemically, the role of rich donor countries has also shifted: overall they give less in foreign aid for

90 • E X P U L S I O N S
development than they did thirty years ago. As a result, in many cases the remittances sent by low- income immigrants to countries of origin are now larger than foreign aid to those countries. Fur-ther, since the late 1990s an increasing share of foreign aid comes through NGOs and philanthropic organizations, further margin-alizing many a government’s role in development. One extreme outcome is the de facto downgrading of governments to the status of predatory elites.
These systemic shifts contribute to explain a complex difference that can be captured in a set of simple numbers. Generally, the IMF asked poor program countries in the 1980s and 1990s to pay 20 to 25 percent of their export earnings toward debt ser vice. In contrast, in 1953, the Allies cancelled 80 percent of Germany’s war debt and only insisted on 3 to 5 percent of export earnings for debt ser vice. They asked 8 percent from central Eu ro pe an countries in the 1990s. Against these past levels, the debt ser vice burdens on poor coun-tries beginning in the 1980s are extreme. It does suggest that the earlier aim of policy for Europe— fi rst Germany after World War II and more recently central Europe— was reincorporation into the capitalist world economy. In contrast, the aim for the Global South in the 1980s and 1990s was more akin to transformative discipline, starting with forced ac cep tance of both restructuring programs and loans from the international system. It is in this sense that the re-structuring programs were about more than debt ser vice: they aimed at shaping a po liti cal economy and a repositioning of these countries as sites for extraction, ranging from natural resources to the consumption power of their populations.
After twenty years of this regime, it became clear that it did not deliver on the basic components for healthy development. The discipline of debt ser vice payments was given strong priority over infrastructure, hospitals, schools, jobs, and other people- oriented goals. The primacy of this extractive logic became a mechanism, perhaps mostly unintended, for systemic transformation that went

The New Global Market for Land • 91
well beyond debt ser vice payment. It contributed to the devastation of large sectors of traditional economies, often the destruction of a good part of the national bourgeoisie and petty bourgeoisie, the sharp impoverishment of the population and, in many cases, of the state. Again, beyond the many differences there are worrisome res-onances with today’s austerity politics in Eu rope and other devel-oped countries.
Even before the economic crises of the mid- 1990s that hit a vast number of countries as they implemented privatization and open- border policies, the debt of poor countries in the Global South had grown from $507 billion in 1980 to $1.4 trillion in 1992.5 Debt ser vice payments alone had increased to $1.6 trillion, more than the actual debt in 1980. From 1982 to 1998, indebted countries paid in interest four times the amount of their original debts, and at the same time their indebtedness went up fourfold. These countries had to use a signifi cant share of their total revenues to ser vice these debts. For instance, Africa’s debt ser vice payments reached $5 billion in 1998; that year, for every $1 in foreign aid African countries paid $1.40 in debt ser vice. By the late 1990s, debt- to- GDP ratios (see Table 2.1) were especially high in Africa, where they stood at 123 percent, compared with 42 percent in Latin America and 28 percent in Asia.6 As of 2006, the poorest forty- nine countries (countries with annual per capita income of less than $935) had debts of $375 bil-lion. If to these poor countries we add the “developing countries,” in 2006 a total of 144 countries had debt amounting to $2.9 trillion and paid $573 billion to ser vice that debt.7
Generally, IMF debt management policies from the 1980s on-ward have not halted the worsening situation for the unemployed and poor.8 Much research on poor countries documents the link between hyperindebted governments and cuts in social programs. These cuts tend to affect women and children in par tic u lar through reductions in education and health care, both investments neces-sary to ensure a better future.9

92 • E X P U L S I O N S
There is now a larger history in the making. In my reading it in-cludes as one key element a repositioning of much of Africa and substantial parts of Latin America and Central Asia in a new mas-sively restructured global economy with a growing demand for land and the many things it allows access to, from food to minerals and water. Weakened governments and the destruction of tradi-
TABLE 2.1: Debt Ser vice Amount and as a Percentage of GDP in Selected Countries, 2009
Country
Total external
debt ($billions)
Total external debt payment
($billions)
Total health spending (% GDP)
Total spending on debt ser vice payments (% GDP)
Angola 15.1 1.6a 1.5 6.8
Ec ua dor 17.1 4.1a 2.2 11.4
Egypt 34.4 2.5a 2.4 2.8
Georgia 1.9 0.2a 2.4 2.9
Jamaica 6.5 1.0a 2.4 10.1
Lebanon 23.3 3.5a 2.4 16.1
Lesotho 0.7 54.2a 2.4 3.7
Moldova 2.0 0.3 4.2 8.6
Morocco 16.4 2.7 1.7 5.3
Pakistan 33.7 2.4 0.4 2.2
Panama 9.8 2.0 5.2 13.4
Papua New Guinea 1.9 0.4 3.0 6.7
Paraguay 3.1 0.5 2.6 6.7
Philippines 61.5 9.9a 1.4 10.0
Ukraine 333.3 5.9 3.7 6.6
Source: Jubilee Debt Campaign 2013.Note: a. Yearly payment
The New Global Market for Land • 93
tional economies have facilitated access to that land by foreign gov-ernments and fi rms. After de cades of debt ser vice and competition from mass- market foreign fi rms, there is little left of what were once modern economic sectors in many of these countries. Thus modest middle- class sectors that may once have had the possibility of active participation in the new consumer economy, and even in the current land and resource boom, are simply no longer there, for reasons ranging from brain drain and military confl icts to IMF re-structuring programs. To this we can add corruption on both sides of many international deals, which enabled the emergence of what can only be described as predatory elites in resource- rich coun-tries. By the early 2000s, this mix of pro cesses and conditions had launched a new phase of wealth accumulation for some and a strug-gle merely to survive for growing components of society, economy, and government.
The Who, Where, and What of Foreign Land Acquisitions
What is actually being mea sured in general descriptions of land grabs can vary considerably depending on the study. I have chosen the data of the Land Matrix project, which were generated collec-tively in collaboration with the International Land Co ali tion. It provides the most comprehensive overall mea sure.10
But before discussing the Land Matrix fi ndings, I briefl y mention several focused investigations into specifi c sectors and countries; each contributes to the larger, rapidly moving overall pro cess of data gathering.11 GRAIN, a French NGO, developed its own data-base on land acquisitions in 2012. It can account for about 14 mil-lion hectares acquired by foreign investors in 416 separate land deals. GRAIN’s methodology is stricter than Land Matrix’s. It col-lected information specifi cally on post- 2006 land deals led by for-eign investors involving “large areas of land . . . for the production

94 • E X P U L S I O N S
of food crops.”12 A second focused study comes from HighQuest Partners, an OECD contracted consulting fi rm specializing in farm-land investing. They interviewed twenty- fi ve fi nancial groups that invested in farmland in 2010, and were managing a total of $7.44 billion in agricultural assets. HighQuest Partners also generated es-timates for total investment of private capital in farmland and agri-cultural infrastructure of between $10 billion and $25 billion. Fi-nally, HighQuest also found that twenty of the twenty- fi ve funds surveyed were at the time raising money for further investments.13 In short, this is a live story. A third study, by Ellen Aabø and Thomas Kring for the United Nations Development Programme, found that the total global area of farmed land in 2007 was 1,554 million hectares. Land for pasture expanded by 2.5 million hectares per year between 1990– 2007, for a total global pasture area of 3,400 million hectares in 2007. They also report that plantation forestry expanded by 2.5 million hectares per year between 1990 and 2005, to a total of 140 million hectares globally. And while Aabø and Kring do alert the reader that “data on the exact scale of large land acquisitions are scarce and incomplete, due to the lack of transpar-ency that often accompanies these investments,” their fi gures show that a large share of these acquisitions was in developing and tran-sition economies: 54 percent in the case of plantation forestry, ac-counting for 75 million hectares.14
Several other estimates suggest similarly dramatic numbers.15 A re-cent report from the Oakland Institute suggests that during 2009 alone, foreign investors acquired nearly 60 million hectares of land in Africa. The Commercial Pressures on Land Research Project, a project of the International Land Co ali tion and the French group Centre de Coopération Internationale en Recherche pour le Dével-oppement, has documented more than 2,000 projects covering as much as 227 million hectares of land since 2001, with most pur-chases since 2011. Oxfam uses the Land Matrix data to report that an area eight times the size of the United Kingdom was sold or

The New Global Market for Land • 95
leased in land grabs between 2000 and 2010. Further, Oxfam esti-mates that between 2008 and 2009, deals by foreign investors for agricultural land increased by approximately 200 percent. And Sofi a Murphy, a researcher at the Institute for Agriculture and Land Policy, reports that “the World Bank estimates some ten million hectares of land were contracted in just fi ve African countries (Ethi-opia, Liberia, Mozambique, Nigeria and Sudan) between 2004 and 2009.”16
Each of the above fi ndings and mea sures contributes insights into what is a vast global operation with multiple sites in very diverse countries and with very diverse buyers and sellers. The Land Ma-trix project provides a good overview of that large- scale phenome-non. To begin with, consider how Land Matrix defi nes the types of land acquisitions to be included in mea sure ments. This is worth looking at, as it indicates some of the limitations of existing data. According to this defi nition, pertinent land transactions
1. Entail a transfer of rights to use, control, or own land through sale, lease, or concession
2. Imply a conversion from land used by smallholders, or for im-portant environmental functions, to large- scale commercial use
3. Are 200 hectares or larger and were not concluded before the year 2000, when the FAO food price index was lowest
The Land Matrix database contains information about two types of data: “reported” and “cross- referenced.” “Reported” data cover deals presented in published research reports, media reports, and gov-ernment registers where these are made public. “Cross- referenced” data refer to deals about which information is obtained from mul-tiple sources; the cross- referencing pro cess involves an assessment of the reliability of the source of the information, triangulation with other information sources, and, if necessary, confi rming with in- country partners in the Land Matrix networks. Media reports are not considered suffi cient for cross- referencing. Research reports

96 • E X P U L S I O N S
based on fi eldwork, confi rmation by known in- country partners, and offi cial land rec ords are considered suffi cient evidence.
While the explosion in food demand and food prices in the mid- 2000s was certainly a key factor in this post- 2006 phase of land acquisitions, it is crops for biofuels that now account for most of the acquisitions. Cross- referenced data from the Land Matrix show that biofuel production accounts for over 37 percent of land ac-quired after 2006. In comparison, food crops account for 25 percent of cross- referenced deals, followed by 3 percent for livestock pro-duction and 5 percent for other nonfood crops. Farming broadly understood, including food and industrial agriculture, accounts for 73 percent of cross- referenced acquisitions. The remaining 27 percent of land acquired is for forestry and carbon sequestration, mineral extraction, industry, and tourism (see Figure 2.1).
A second major pattern is the massive concentration of foreign acquisitions in Africa. Of the publicly reported deals, 948 land ac-
0
5
10
15
20
25
30
35
40
Biofuels Food crops Forestry Industry Livestock Mineralextraction(includingpetroleum)
Nonfoodagricultural
commodities
Tourism
FIGURE 2.1 Global Land Acquisitions by Sector, 2006– 2010 (in millions of hectares)Data Source: Anseeuw, Wily, et al. 2012, fi gure 5.
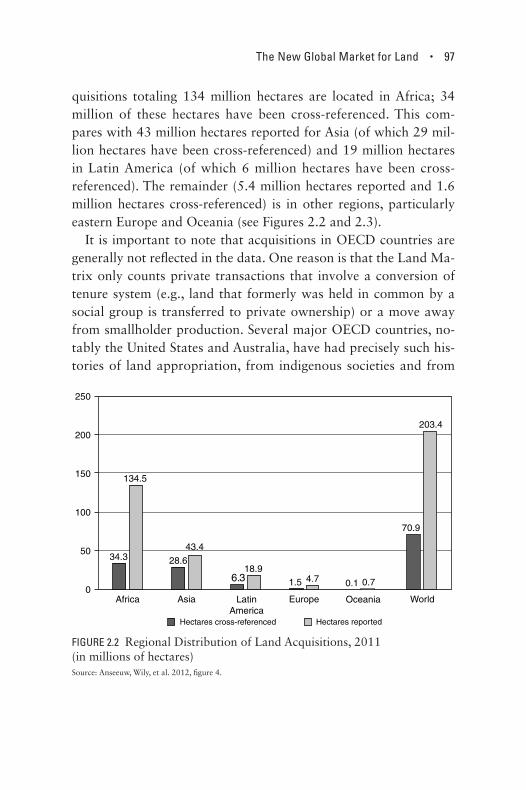
The New Global Market for Land • 97
quisitions totaling 134 million hectares are located in Africa; 34 million of these hectares have been cross- referenced. This com-pares with 43 million hectares reported for Asia (of which 29 mil-lion hectares have been cross- referenced) and 19 million hectares in Latin America (of which 6 million hectares have been cross- referenced). The remainder (5.4 million hectares reported and 1.6 million hectares cross- referenced) is in other regions, particularly eastern Eu rope and Oceania (see Figures 2.2 and 2.3).
It is important to note that acquisitions in OECD countries are generally not refl ected in the data. One reason is that the Land Ma-trix only counts private transactions that involve a conversion of tenure system (e.g., land that formerly was held in common by a social group is transferred to private own ership) or a move away from smallholder production. Several major OECD countries, no-tably the United States and Australia, have had precisely such his-tories of land appropriation, from indigenous societies and from
34.3 28.6
6.3 1.5 0.1
70.9
134.5
43.4
18.94.7 0.7
203.4
0
50
100
150
200
250
Africa Asia LatinAmerica
Europe Oceania World
Hectares cross-referenced Hectares reported
FIGURE 2.2 Regional Distribution of Land Acquisitions, 2011 (in millions of hectares)Source: Anseeuw, Wily, et al. 2012, fi gure 4.

98 • E X P U L S I O N S
small farmers, but they took place de cades and centuries ago. Further, this defi nition of “land grabs” also holds for several OECD coun-tries today, among which are the United States, Mexico, Australia, Brazil, to mention just a few, where small farmers have lost their land to corporate buyers. It is worth noting that land grabs are also hap-pening in Eu rope, but through a different venue— basically, prevent-ing small farms from expanding and new small farms from being developed. This mode of land grabs falls outside the current defi nition and tends to fall below the 200 hectares minimum to be included in the Land Matrix mea sure.
The data on acquisitions also point to a sort of regionalism that is not just geographic but also geopolitical— that is, a tendency for buyers from certain regions to acquire land in a specifi c set of regions. The Land Matrix project fi nds that this might be linked to regional trade agreements. Thus, 75 percent of land acquisitions
Reliable Only reported Number of deals
0
20
40
60
80
100
120
0
1
2
3
4
5
6
7
8
9
Sud
an
Mill
ions
of h
ecta
res
Num
ber
of d
eals
Moz
ambi
que
Phi
lippi
nes
Tanz
ania
Eth
iopi
a
Mad
agas
car
Zam
bia
DR
Con
go
Bra
zil
Pa k
ista
n
Indo
nesi
a
Arg
entin
a
Mor
occo
Libe
ria
Con
goR
ep
Sen
egal
Rus
sia
Laos
Gha
na
Nig
eria
FIGURE 2.3 Most- Targeted Countries According to Size of Total Reported Acquisitions, 2012Source: Anseeuw, Boche, et al. 2012, fi gure 4.
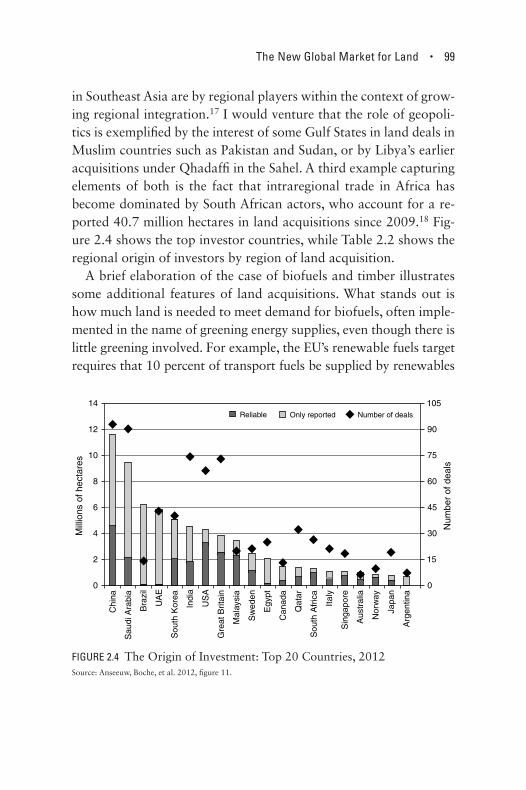
The New Global Market for Land • 99
in Southeast Asia are by regional players within the context of grow-ing regional integration.17 I would venture that the role of geopoli-tics is exemplifi ed by the interest of some Gulf States in land deals in Muslim countries such as Pakistan and Sudan, or by Libya’s earlier acquisitions under Qhadaffi in the Sahel. A third example capturing elements of both is the fact that intraregional trade in Africa has become dominated by South African actors, who account for a re-ported 40.7 million hectares in land acquisitions since 2009.18 Fig-ure 2.4 shows the top investor countries, while Table 2.2 shows the regional origin of investors by region of land acquisition.
A brief elaboration of the case of biofuels and timber illustrates some additional features of land acquisitions. What stands out is how much land is needed to meet demand for biofuels, often imple-mented in the name of greening energy supplies, even though there is little greening involved. For example, the EU’s renewable fuels target requires that 10 percent of transport fuels be supplied by renewables
Reliable Only reported Number of deals
0
15
30
45
60
75
90
105
0
2
4
6
8
10
12
14
Chi
n
Mill
ions
of h
ecta
res
Num
ber
of d
eals
a
Sau
di A
rabi
a
Bra
zil
UA
E
Sou
th K
ore a
Indi
a
US
A
Gre
at B
ritai
n
Ma l
aysi
a
Sw
eden
Egy
pt
Can
ada
Qat
ar
Sou
th A
fric
a
Ital
y
Sin
gapo
re
Aus
tral
ia
Nor
wa y
Japa
n
Arg
entin
a
FIGURE 2.4 The Origin of Investment: Top 20 Countries, 2012Source: Anseeuw, Boche, et al. 2012, fi gure 11.

100 • E X P U L S I O N S
TABLE 2.2: Who Buys Where, 2011 (millions of hectares)
Regions where land acquired
Origin of investors Africa Asia Latin America Eu rope Oceania
Africa 6.4 0 0.1 0 0
Central Asia 12.3 25.3 0.6 0 0.1
Latin America 0.1 0 1.7 0 0
Eu rope 6.0 0.6 0.5 1.5 0
North America 3.3 0.4 1.6 0 0
Oceania 0 0.3 0.1 0 0
Western Asia 3.7 1.6 0 0 0
Data source: Anseeuw, Wily, et al. 2012, fi gure 3.
Note: Western Asia used by authors to indicate mostly Muslim Asia.
by 2020, with the expectation that 80– 90 percent of this target is likely to be met by biofuels. The result has been widespread corporate investments in biofuel production both inside and outside Eu rope.19 The Netherlands Environment Assessment Agency estimates that these targets require 20– 30 million hectares of production, of which 60 percent will be imported. A very different biofuel case, but with the same land- intensive features, is palm oil production for biodiesel in the Peruvian forest; it already uses 52,829 hectares and the plan is to expand to 307,329 hectares in the short- to medium-term.20
The demand for timber might become another major stimulus for land acquisitions. Augusta Molnar and colleagues report that in nine tropical countries studied, concessions in forest areas have al-ready been granted for 258 million hectares; the demand for forest lands is rising fast due to the growing commodifi cation of forest products.21 Most forest land deals are not reported in the Land Ma-trix because they do not necessarily imply a conversion of the total concession area. The researchers suggest that demands on forests

The New Global Market for Land • 101
are rising sharply as more forest products are being turned into commodities.22 Louis Putzel and coworkers report that since 2000, China has obtained 121 concessions over 2.67 million hectares of forest in Gabon and is negotiating rights in the Demo cratic Repub-lic of Congo and Cameroon.23 Further pressure on forests comes from clearance for oil palm plantations. An estimated 7.5 million hectares of land are already under oil palm cultivation in the Indo-nesian forest, with a rate of land clearance in the late 2000s exceed-ing 600,000 hectares per year.24
While it belongs to a different economic domain and requires far less land than crops or timber, manufacturing is increasingly compet-ing for land in par tic u lar areas. For example, case studies from the International Land Co ali tion show this is occurring with the estab-lishment of special economic zones (SEZs) in densely populated areas
0
5
10
15
20
25
30
35
0
50
100
150
200
250
300
350
400
450
500
Privatecompany
Public / Stateowned
Investmentfund
Public privatepartnership
Number of deals Cumulative size of deals
Num
ber
of d
eals
Cum
ulat
ive
size
of d
e als
(mill
ions
of h
ecta
res)
FIGURE 2.5 Land Acquisition by Type of InvestorData source: Anseeuw, Boche, et al. 2012, fi gure 12.

102 • E X P U L S I O N S
in Benin and India.25 In India, 571 SEZs have been approved covering 140,000 hectares in total, leading to confl icts with displaced land us-ers in a number of cases. Such zones are also being developed in Af-rica: China is setting up eight major SEZs around the continent.26 Besides land, manufacturing generates a demand for raw materials from rural areas, which may impinge on traditional rural economies.
Figure 2.5 provides an overview of land acquisition by type of investor, and Table 2.3 provides an overview by country.
A fi nal set of fi ndings concerns water use or needs as part of land acquisition. The researchers were particularly interested in how transnational land deals entailed water access and use (see Figure 2.6). They gathered data on land acquisitions from multiple sources, accounting for 90 percent of all known acquired land, and used a
Grabbed green water
0
20
40
60
80
100
120
140
Arg
entin
a
Aus
tral
ia
Bra
zil
Cam
eroo
n
Re p
. Con
go
Eth
iopi
a
Gab
on
Indo
nesi
a
Libe
ria
Mad
agas
car
Mor
occo
Moz
ambi
que
Nig
eria
Pak
ista
n
Pap
ua N
ew G
uine
a
Phi
lippi
nes
Dem
. Rep
.Con
go
Sie
rra
Leon
e
Tanz
ania
Ukr
aine
Uru
gua y
Uga
nda
Sud
an
Rus
sia
Grabbed blue water
FIGURE 2.6 Assessment of the Grabbed Water in the Top 24 Grabbed Countries, 2012 (in billions of cubic meters)Data source: Rulli, Saviori, and D'Odorico 2013, fi gure 3. Note that the word "grabbed" is in the original source.
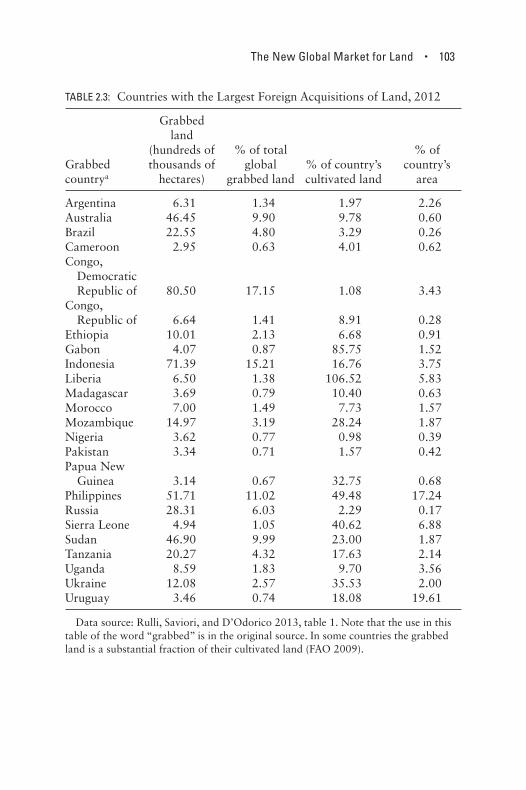
The New Global Market for Land • 103
TABLE 2.3: Countries with the Largest Foreign Acquisitions of Land, 2012
Grabbed countrya
Grabbed land
(hundreds of thousands of
hectares)
% of total global
grabbed land% of country’s cultivated land
% of country’s
area
Argentina 6.31 1.34 1.97 2.26Australia 46.45 9.90 9.78 0.60Brazil 22.55 4.80 3.29 0.26Cameroon 2.95 0.63 4.01 0.62Congo, Demo cratic Republic of 80.50 17.15 1.08 3.43Congo, Republic of 6.64 1.41 8.91 0.28Ethiopia 10.01 2.13 6.68 0.91Gabon 4.07 0.87 85.75 1.52Indonesia 71.39 15.21 16.76 3.75Liberia 6.50 1.38 106.52 5.83Madagascar 3.69 0.79 10.40 0.63Morocco 7.00 1.49 7.73 1.57Mozambique 14.97 3.19 28.24 1.87Nigeria 3.62 0.77 0.98 0.39Pakistan 3.34 0.71 1.57 0.42Papua New Guinea 3.14 0.67 32.75 0.68Philippines 51.71 11.02 49.48 17.24Rus sia 28.31 6.03 2.29 0.17Sierra Leone 4.94 1.05 40.62 6.88Sudan 46.90 9.99 23.00 1.87Tanzania 20.27 4.32 17.63 2.14Uganda 8.59 1.83 9.70 3.56Ukraine 12.08 2.57 35.53 2.00Uruguay 3.46 0.74 18.08 19.61
Data source: Rulli, Saviori, and D’Odorico 2013, table 1. Note that the use in this table of the word “grabbed” is in the original source. In some countries the grabbed land is a substantial fraction of their cultivated land (FAO 2009).
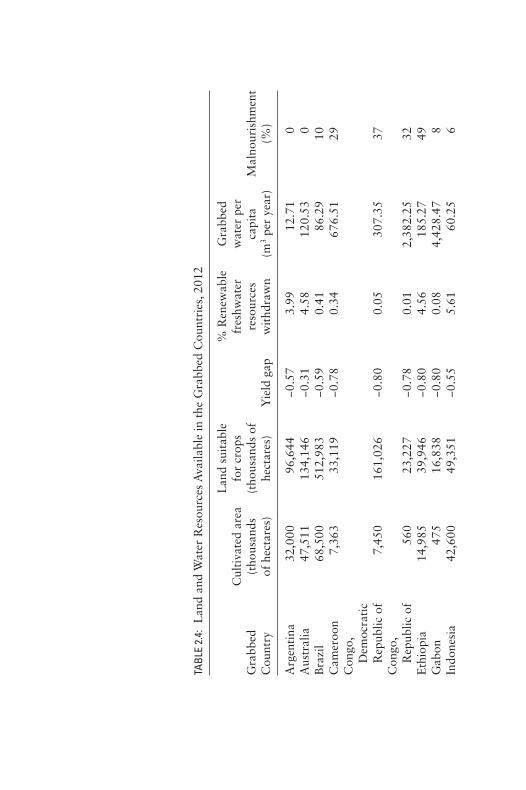
TAB
LE 2
.4:
Lan
d an
d W
ater
Res
ourc
es A
vaila
ble
in t
he G
rabb
ed C
ount
ries
, 201
2
Gra
bbed
C
ount
ry
Cul
tiva
ted
area
(t
hous
ands
of
hec
tare
s)
Lan
d su
itab
le
for
crop
s (t
hous
ands
of
hect
ares
)Y
ield
gap
% R
enew
able
fr
eshw
ater
re
sour
ces
wit
hdra
wn
Gra
bbed
w
ater
per
ca
pita
(m
3 pe
r ye
ar)
Mal
nour
ishm
ent
(%)
Arg
enti
na32
,000
96,6
44−0
.57
3.99
12.7
10
Aus
tral
ia47
,511
134,
146
−0.3
14.
5812
0.53
0B
razi
l68
,500
512,
983
−0.5
90.
4186
.29
10C
amer
oon
7,36
333
,119
−0.7
80.
3467
6.51
29C
ongo
,
Dem
o cra
tic
R
epub
lic o
f7,
450
161,
026
−0.8
00.
0530
7.35
37C
ongo
,
Rep
ublic
of
560
23,2
27−0
.78
0.01
2,38
2.25
32E
thio
pia
14,9
8539
,946
−0.8
04.
5618
5.27
49G
abon
475
16,8
38−0
.80
0.08
4,42
8.47
8In
done
sia
42,6
0049
,351
−0.5
55.
6160
.25
6

Lib
eria
610
5,32
3−0
.78
0.08
385.
7446
Mad
agas
car
3,55
028
,764
−0.7
54.
3673
.27
40M
oroc
co9,
055
8,35
3−0
.90
43.4
517
2.51
5M
ozam
biqu
e5,
300
60,4
37−0
.90
0.35
1,04
1.06
58N
iger
ia37
,000
60,4
78−0
.78
3.60
34.9
18
Paki
stan
21,2
804,
438
−0.5
574
.35
40.6
120
Papu
a N
ew
G
uine
a96
011
,603
−0.4
10.
0539
3.44
29Ph
ilipp
ines
10,4
508,
734
−0.5
817
.03
29.6
721
Rus
sia
123,
541
287,
045
−0.7
01.
4713
9.40
6Si
erra
Leo
ne1,
215
3,75
3−0
.80
0.31
853.
3643
Suda
n20
,391
89,2
85−0
.85
57.5
81,
844.
2618
Tanz
ania
11,5
0062
,505
−0.8
15.
391,
131.
0141
Uga
nda
8,85
012
,795
−0.7
50.
4813
9.14
30U
krai
ne33
,376
49,3
38−0
.72
27.5
612
8.26
5U
rugu
ay1,
912
14,1
52−0
.65
2.63
51.4
64
Dat
a so
urce
: Rul
li, S
avio
ri, a
nd D
’Odo
rico
201
3, s
uppl
. tab
le 2
. Not
e th
at t
he u
se in
thi
s ta
ble
of t
he w
ord
“gra
bbed
” is
in
the
orig
inal
sou
rce.

106 • E X P U L S I O N S
hydrologic model to determine the associated rates of freshwater use. They found that transnational deals for land and water are occurring in all continents except Antarctica. More important, they established that the amount of grabbed water lowered water supplies to a point below what is required to ensure the per capita volume necessary for a balanced diet and what would be suffi-cient to improve food security and abate malnourishment in the pertinent countries.27 Table 2.4 gives an overview of land and water resources available in countries where water is being mined.
Material Practices of Large- Scale Land Acquisitions
Investments in large- scale land acquisitions have crowded out other material economies, especially in sub- Saharan Africa. One outcome that has received little attention is the sharp decline in the share of foreign direct investment (FDI) going to mass manufacturing, a sec-tor that can generate good jobs and feed the growth of a middle class. This decline took place just as several countries of the Global South were beginning to experience signifi cant growth in mass manufacturing. If we consider Africa, for instance, the data show a sharp decline in foreign direct investment in manufacturing. Both South Africa and Nigeria, Africa’s two top FDI recipients in 2006 (accounting for 37 percent of FDI stock in Africa), have seen a sharp transformation in the composition of investment: a fall in FDI in manufacturing and a sharp rise in FDI in the primary sector— mining, crops, oil, and such.28 In Nigeria, where foreign investment in oil has long been heavy, the share of the primary sector in FDI stock stood at 75 percent in 2005, up from 43 percent in 1990. Other African countries have seen similar shifts. Even in Madagas-car, one of the (mostly small) countries where manufacturing FDI infl ows began to increase as recently as the 1990s, this increase was
The New Global Market for Land • 107
well below that of FDI in the primary sector.29 There is much evi-dence showing that this shift from investment in manufacturing to investment in mining, oil, and land is not good for the development of national economies.
The current phase of land acquisitions dwarfs investments in manufacturing. A few examples assembled by von Braun and Meinzen-Dick signal the range of buyers and of locations, with Af-rica a major destination. South Korea has signed deals for 690,000 hectares and the United Arab Emirates for 400,000 hectares, both in Sudan. Saudi investors are spending $100 million to raise wheat, barley, and rice on land leased to them by Ethiopia’s government; they receive tax exemptions and export the crop back to Saudi Arabia.30 China secured the right to grow palm oil for biofuels on 2.8 million hectares of Congo, making it the world’s largest palm oil plantation. It is negotiating to grow biofuels on 2 million hect-ares in Zambia. Perhaps less well known than these African cases is the fact that privatized land in the territories of the former So-viet Union, especially in Rus sia and Ukraine, is also becoming the object of much foreign acquisition. In 2008 alone, these acquisi-tions included the following: a Swedish company, Alpcot Agro, bought 128,000 hectares in Rus sia; South Korea’s Hyundai Heavy Industries paid $6.5 million for a majority stake in Khorol Zerno, a company that owns 10,000 hectares in eastern Siberia; Morgan Stanley bought 40,000 hectares in Ukraine; Gulf investors are plan-ning to acquire Pava, the fi rst Rus sian grain pro cessor fl oated on the fi nancial markets (the intention was to enable the sale of 40 percent of its landowning division to international investors), which will give them access to 500,000 hectares. Also less noticed is Pakistan’s intended lease of 500,000 hectares of land to Gulf investors, with the bonus of a security force of 100,000 to protect the land.
In what follows I focus on one set of countries in more detail. It helps understand the variety of buyers and deals underlying the overall counts.

108 • E X P U L S I O N S
Six Destinations for Acquiring Land
In an analysis of 180 large land acquisitions in Africa, Cecilie Friis and Anette Reenberg identify major types of investors in this cur-rent period: (1) oil- rich Gulf states of Saudi Arabia, United Arab Emirates, Qatar, Bahrain, Oman, Kuwait, and Jordan; (2) populous and capital- rich Asian countries such as China, South Korea, Japan, and India; (3) Eu rope and the United States; (4) private companies from around the world. Investors are mostly energy companies, ag-ricultural investment companies, utility companies, fi nance and in-vestment fi rms, and technology companies.31
Using the Friis and Reenberg data, I constructed the repre sen ta-tions of this geography (shown in Figures 2.7 and 2.8) by focusing on the top six sellers in Africa and their investors.32 They are Ethio-pia, Madagascar, Sudan, Tanzania, Mali, and Mozambique— all sub- Saharan, and all, except Mali, in East Africa. In all these coun-tries both private investors and government agencies have acquired land.
No specifi c investor dominates in fi ve of these top- selling coun-tries. The exception is Mozambique, where Agri SA, the South African farmers’ association, is the largest buyer, and overwhelm-ingly so. However, when we mea sure by national origin, each “seller country” does have a dominant “buyer country” in terms of size of acquisitions: India in Ethiopia, South Korea in Madagascar, Saudi Arabia in Sudan, and China in Mali. In Tanzania, it is a multinational group. There are few cases of cross acquisition; among them are Sun Biofuels’ purchase of land in Tanzania and Mozambique, Chi-na’s acquisitions in Mozambique and Mali, Qatar’s in Madagascar and Sudan, and those by the United Arab Emirates and Jannat, a Saudi Arabia conglomerate, in Sudan and Ethiopia.33
Overall there are forty- seven different countries of origin among investors in these six countries. Among the countries with the most

The New Global Market for Land • 109
BioshapeHoldings
Tanzania
CAMSGroup
ChinaInt
ChongqingSeedCorp
D1Oils
KoreaRuralCommunityCorporation
Multinatioanlforeigncompanies
PharosMiroAgricultureFund
SaudiArabiaInvestors
SouthKoreaSunBiofuels
Tadco
YesBank
Al-Korayev
Mali
CapitalFund
CEN-SAD
China
IslamicDevelopmentBank
LibyaProjetdeSOSUMAR
Malibya
MCA
PetrotechAgroMaliMultinatioanlKiaNetherlands
SouthAfricaandChina
WestAfricanEconomicandMonetaryUnion
AgriSA
Mozambique
Agriterra
CAMECMauritiusMinistryofAgroIndustry
ProcanaSekab
Trans4mationAgric-techLtd
FIGURE 2.7 Top Land Sellers and Buyers in Africa (Tanzania, Mozambique, Mali), 2010Data source: Friis and Reenberg 2010.
diverse group of investors by country of origin are Madagascar, with twenty- four foreign investors from fi fteen countries, and Ethi-opia, with twenty- six investors from twelve countries. Asian coun-tries (China, South Korea, India, and Japan) make up almost 20 percent of investors in these six countries. Middle Eastern countries (Saudi Arabia, United Arab Emirates, Egypt, Jordan, Qatar, Leba-non, and Israel) account for almost 22 percent of investors. Eu ro-pe an countries (United Kingdom, Sweden, Netherlands, Germany, Italy, Denmark, and France) account for 30 percent of investors.

110 • E X P U L S I O N S
ArdentEnergyGroup Ethiopia
BDFC
BeccoBiofuels
Djibouti
DubaiWorldTrading
EmamiBiotechFloraEcopower
Fri-ElGreenPower
GermanConsortium
HovevAgricultureLtd
IDCInvestment
India
Jannat
KaruturiGlobalLtd
LHB
Mohammedal-AmoudiSheik
AgriNexus
EthioAgri-CEFT
SaudiStarAgriculturalDevelopmentPlc
SaudiInvestors
ShapoorjiPallonji
NBC
UnitedArabEmirates
UnknownPrivateInvestors
VarunInternationalVerdanaHarvestPvh
AvanaGroup
Madagascar
BioEnergyLimited
DaewooLogisticsDEKOSA
DeltaPetroli
ERCompany
GEMBiofuels
GlobalAgrofuel
J-Oils
JSLAgro-fuels
LesCulturesduCapEst
Madabeef
NEO
NOTSRenewableEnergy
OjiPaperOSHOGroup
Qatar
SimeDarbyBhd
SitheGlobal
SOPREMAD
SUCOCOMA
TozziRenewableEnergy
UnitechandUnitedTechnologiesGroup
VarunIndustries
AbuDhabiFundSudan
BeltoneandKenanaCitadelCapitalEgypt
EgyptHADCO
HassadFoodJarchCapital
Jordan
KuwaitRegionalprivatebusiness
SaudiArabia
SouthKoreanBusinesses
FIGURE 2.8 Top Land Sellers and Buyers in Africa (Madagascar, Sudan, Ethiopia), 2010Data source: Friis and Reenberg 2010.
The New Global Market for Land • 111
African countries (South Africa, Mauritius, Libya, and Djibouti) account for about 10 percent of investors. The remaining investors are from Australia, Brazil, and the United States.
Three countries have a signifi cant share of all investments. The United States, United Kingdom, and Saudi Arabia account for 25 percent of all investors in these six countries. Each has investments in four countries. It is worth noting that private companies domi-nate among buyers for some countries, and states for others.
One Case: Palm Production at Ground Level
Palm oil, traded on international commodities and futures market as crude palm oil, is a component of huge numbers of products, including livestock feed, prepared foods, cooking oils, cosmetics, lubricants, and fuels. Between 2000 and 2010, consumption of palm oil doubled to reach 46.8 million tons, surpassing soybean oil in 2005 to become the world’s most pop u lar vegetable oil.34 By 2020, consumption of all vegetable oils is expected to increase 25 percent, with palm oil continuing to be a leader in the category.35
In its raw state, crude palm oil is fragile: oil in freshly picked palm fruits begins to decay in as little as forty- eight hours after har-vest, meaning that producers need ready access to pro cessing sites. Mills that extract and stabilize palm oil require between 4,000 and 5,000 hectares of cropland to produce output at maximum effi -ciency. The transportation systems, infrastructure, and economies of scale required for profi table production of palm oil mean that the growing demand is being met by monoculture farming, usu-ally on massive plantations or government- supported smallholder groups.36
Eighty percent of commercial palm oil is produced in Malaysia (4 million hectares of land in palm oil production) and Indonesia (7.5 million hectares of land in palm oil production).37 A scarcity

112 • E X P U L S I O N S
of arable land in Malaysia is pushing new production into Indonesia, where Malaysian conglomerates are the majority investors in ap-proximately two- thirds of all palm oil production ventures.38 The Indonesian government has promoted palm oil as pro- poor, pro- job, and pro- growth: 85 percent of palm oil consumed in Indonesia is used as food, especially as affordable cooking oil, and 3.5 million small farmers produced 40 percent of the Indonesian palm oil crop.39
The outlook for locals, however, is not sunny. In the Indonesian province of Riau, protests by small farmers against the palm indus-try started in the early 1980s. That is when government offi cials required the forfeit and redistribution of collectively held land to develop palm oil plantations.40
Indonesian land rights are nebulous, unclear, and often insecure. Customary law, known as adat in Indonesia and Malaysia, was codifi ed and integrated into Dutch colonial law; it remains an im-portant, if contested, part of the Indonesian legal framework. While adat varies greatly among Indonesia’s ethnic groups, many indige-nous peoples hold land through hak ulayat (communal tenure) or hutan adat (customary forest license).41 The Basic Agrarian Law of 1960 limits government recognition of adat land rights to claims where “the land is under the own ership of a recognized adat com-munity[,] the boundaries are defi ned and understood and the com-munity is recognized and functioning as such under adat law prin-ciples.”42 These types of issues are also overlooked in the framework for resolving claims between overlapping rights and concessions on land such as confl icts between mining and agricultural claims.43 Further, Indonesia’s land registration system is insuffi cient; two- thirds of all land in forest administration within the country is without title.44 These ambiguities and inadequacies leave signifi cant room for vested interests to challenge community land rights. Vari-ous Indonesian governments (especially the Suharto regime) actively sought to bring more territory directly under the control of the

The New Global Market for Land • 113
state, while various businesses have successfully challenged inade-quately documented claims of own ership.45
Land confl ict has come to a head in Indonesia’s Riau Province, on the island of Sumatra. Local people have opposed the spread of palm oil plantations since the 1980s; opposition to the industry was sup-pressed under the Suharto dictatorship but has spread like wildfi re since regime change in 1998.46 Seventy percent of all palm oil planta-tions in Riau are owned by Malaysian interests; many of these com-panies have engaged in questionable land acquisitions and failed to respect the rights of local communities that hold land collectively.47 Under the Basic Agrarian Law of 1960, communities can be forced to forfeit land; this is especially the case in areas where local groups maintain traditional collective land own ership but are engaged in commodity production rather than following indigenous lifeways.
Here is a case that illustrates some of these tensions going back years and the lengthy pro cess of the state recognizing the rights of smallholders. In 1998, PT Mazuma Agro Indonesia (MAI) seized 5,508 hectares of land in the village of Rokan Hulu, Riau, without the consent of village leaders, and began to illegally expel local farmers and their families.48 Legal action was able to prevent fur-ther development until 2012. In February of that year, MAI began development on the land despite the unresolved court case. At 8:30 a.m. on February 2, 2012, a hundred local villagers tried to prevent bulldozers and excavators from clearing their land; at 11:00 a.m., offi cers of the Northern Sumatran Regional Police opened fi re on the protesters, wounding fi ve.49 This was not the fi rst time land confl icts in Rokan Hulu had become violent. Since 1998, MAI and the leadership of a nearby village had conspired to burn at least eighty- nine houses and destroy twenty- six palm oil pro cessing plants owned by members of the community.50 In 2004, two men from Rokan Hulu protesting a land claim by palm oil company PT Suraya were killed by the company’s security guards; local police

114 • E X P U L S I O N S
deployed to the area prevented the confl ict from escalating but failed to apprehend the killers.51
Responding to these abuses by fi rms, in May 2013, the pertinent court in Indonesia transferred millions of hectares of forest from government control to the control of local communities, at least nominally.52 However, the strength of these new land rights remains dependent on government rec ords and agencies that have proved fal-lible in the past. It remains to be seen if indigenous people in Indone-sia can use their land to produce commodity crops for the global economy without sacrifi cing their right to communal own ership.
Conclusion
These are the elements of a larger history in the making. It includes a repositioning of growing areas of Africa, Latin America, and Asia in a massively restructured global economy. Weakened gov-ernments that function as comprador bourgeoisies and the destruc-tion of smallholder economies have launched a new survival phase in expanding parts of the world for rising numbers of people
The key empirical trends that matter for the larger argument in this chapter are the sharp growth in foreign land acquisitions after 2006, a year when the banking crisis was already brewing, and the rapid international diversifi cation of the buyers. It is not the fact of foreign acquisition per se that is the issue here, as foreign own-ership has long been part of the world’s economic history, and fur-ther, there are positive reasons for some acquisitions, such as cre-ating a nature reserve. What matters for my argument is that this sharp growth in foreign own ership is signifi cantly altering the char-acter of local economies, notably land own ership, and diminishing the sovereign authority of the state over its territory. The pro cess of acquisition may be less violent and disruptive than the imperial conquests of the past. But that does not mean they should be con-fused with more benign examples of foreign ownership— the place-

The New Global Market for Land • 115
ment of a job- generating Ford Motors plant in Eu rope or a Volks-wagen plant in Brazil.
Emphasizing the juxtaposition of formal sovereign authority and growing foreign land acquisitions leads to two conceptual issues that are easily bypassed if we simply emphasize the power asym-metry between those acquiring land and host governments. One of these is the role of IMF and World Bank restructuring, eventually amplifi ed by WTO rules, in weakening the economies, social de-velopment, and governments of various countries. The complex of trends and conditions associated with this restructuring actually facilitated the massive foreign land acquisition that took off after 2006 and further escalated after the crisis of 2008. These trends prepared the ground for the sudden rise in acquisitions, for the rela-tive ease of the formal execution of many a novel type of contract, and for the rapid diversifi cation of those doing the acquiring.
The other is the repositioning of national sovereign territory re-sulting from the sharp rise in land acquisitions by foreigners. Na-tional territory is not merely vacant land. Lands acquired by for-eigners include vast stretches of national territory populated and shaped by villages, smallholder agriculture, rural manufacturing districts, and the actors that make these economies and reproduce them— whether this is recognized by the state or not. Much of this politico- structural complexity is today being erased from its home territory as a result of these acquisitions. At the extreme, we might ask what citizenship is worth when national territory is downgraded to foreign- owned land for plantations, leading to the eviction of everything else— fl ora, fauna, villages, smallholders, and the tradi-tional rules that or ga nized land own ership or use.
In their aggregate these large- scale land acquisitions have pro-duced a global operational space that is partly embedded in na-tional territories. They produce a partial denationalization deep inside nation- states, a structural hole in the tissue of national sov-ereign territory. I see acquisition of land by foreigners as one of

116 • E X P U L S I O N S
several such pro cesses that partly disassemble national territory. The contracts developed for these acquisitions become capabilities of an or ga niz ing logic that is disarticulated from the national state even as these acquisitions operate deep inside its territory. Further, in so doing, these contracts often go against the interests not only of much of a country’s people but also of local capital, one far more likely to generate positive feedback loops for a country’s diverse re-gions. It is important to note that large- scale foreign land acquisi-tions could be generators of good jobs and local economic effects, especially when committed to workers rights and to environmental sustainability. But the current trends do not promise much along these lines: it is a story of expulsions of people and local economies and of biospheric destruction.
Against this larger context, the materiality and visibility of foreign land acquisitions become heuristic: they tell us something about a larger pro cess that is often not as visible and material as land or the direct participation of the executive branch of government in the ex-ecution of contracts. This way of representing economic globaliza-tion is very different from the common notion of the whole state as victim. Indeed, to a large extent it is the executive branch of govern-ment that is getting aligned with global corporate capital, both in the Global South and in the Global North. This becomes highly visible in the case of foreign land acquisitions. At the same time, in my reading, a key implication of this strategic participation of states in global pro-cesses is that, guided by different interests, states could re orient their goals away from the global corporate agenda and toward global agendas concerning the environment, human rights, social justice, and climate change.
117
Once it exists, fi nancial profi t can be viewed as morally neutral. It can be used for unambiguous good— materialized, for example, into a nonfi nancial asset such as a green transport system. It can be materialized for ill— to buy arms for warlords, say. Or it can be left immaterial, used as a platform for ever more speculative fi nancial constructions that can be so complex they challenge empirical anal-ysis, let alone moral examination. The last of these trends, associ-ated most spectacularly with the market for derivatives, has come to dominate fi nance over the past twenty years. Until the fi nancial crisis, the obscurity of its operations masked how dangerous this market can be. It has generated the extreme levels of fi nancializa-tion now evident in several major developed countries.
The orders of magnitude the fi nancial system has built up over the last two de cades are captured in the total value of outstanding derivatives, a form of complex debt that derives its value from an-other source, ranging from other types of debt to material goods such as buildings and crops; derivatives are presently the most com-mon fi nancial instrument. That total value of outstanding deriva-tives stood at $600 trillion (more than ten times the value of global GDP) before the crisis exploded in 2008, and then it dipped briefl y before rising again. By 2012, a few years after that very costly event that brought down fi rms, governments, and whole economies, it
CHAPTER 3
Finance and Its CapabilitiesCrisis as Systemic Logic

118 • E X P U L S I O N S
had risen to over $800 trillion, and by early 2013 it had reached more than $1 quadrillion. Similarly, the value of bank assets, which stood at $160 trillion right before the crisis, had risen to almost $200 trillion by 2010, and it has kept rising since. In contrast, global GDP actually fell sharply from $55 trillion in 2007 to $45 trillion in early 2008, refl ecting the crisis in the economy. The power of fi nance, and what makes it dangerous, is its capacity to build up its own value even as house holds, economies, and govern-ments lose value.1
I conceive of fi nance as a capability, though one with variable valence; it is not Amartya Sen’s or Martha Nussbaum’s positively marked concept of capability. Finance needs to be distinguished from traditional banking. Traditional banks sell money in their possession. Financial fi rms sell something they do not have, and therein lies the push to be far more innovative and invasive than traditional banking. In this regard fi nance can be thought of as a capability to securitize just about everything in an economy and, in doing so, subject economies and governments to its own crite-ria for mea sur ing success. Securitization involves the relocation of a building, good, or debt, into a fi nancial circuit where it becomes mobile and can be bought and sold over and over in markets near and far. In the past two de cades fi nance has invented often very complex instruments to securitize extreme instances of familiar items— not just high- grade debt but also used- car loans and mod-est municipal government debt. Once an input is securitized, fi -nancial engineering can keep on building long chains of increas-ingly speculative instruments that all rest on the alleged stability of that fi rst step. This is, then, a very special, distinctive, and often dangerous capability. (It is worth remembering that par tic u lar kinds of derivatives, one of the key enablers of fi nance, had been declared basically illegal in the United States. It was not until 1973 that derivatives became legal again in the commodity markets of Chicago.)

Finance and Its Capabilities • 119
At the heart of fi nance is the work of inventing and developing complex instruments. It is the mathematics of physics and its mod-els that are in play here, not the mathematics of microeconomic models. Exemplifying it all, Goldman Sachs’s backroom is well stocked with physicists. The mathematics of the backroom is mostly well beyond the understanding of the highly paid executives of the boardroom.
These features make fi nance a major force in a pro cess that started in the 1980s and took off sharply worldwide beginning in the 1990s. I consider fi nance a complex assemblage of actors, capa-bilities, and operational spaces. Elements of this assemblage func-tion as one of the conceptually subterranean dynamics that concern me in this book. Finance can take diverse forms on the surface and adapt to institutional settings as different as China and the United States, with instruments as diverse as securitized student loans and credit-default swaps. But beneath this diversity of encasements lies an epoch- making capability— the fi nancializing of the debt and assets of fi rms, house holds, and governments regardless of geopoli-tics, sovereign authority, legal system, state- economy relation, or economic sector.
We can think of fi nance as the most accomplished and effective—at least in the short run— of these conceptually subterranean trends that are reshaping our world in so many different ways. In the case of fi nance, the visible manifestations take the form of multiple mi-croworlds and microtrends, some specialized, some not: credit card loans, this or that government’s defi cit, a par tic u lar fi rm’s debt, and so on. All this disaggregating is partly due to the diverse institu-tional arrangements through which those debts and assets are gen-erated and become recognizable to third parties. But disaggregation also renders invisible the deeper vortex and in many ways veils what is happening: a large- scale destruction of healthy economies, healthy government debt, and healthy house holds. In case after case, this destruction takes the form of a fl ow of capital and resources to

120 • E X P U L S I O N S
fi nancial fi rms and the impoverishment of other economic sectors. We cannot generalize too much, for there are exceptions to every-thing, and we can see an enrichment of a range of sectors other than fi nance, from high-technology to oil. Many of these other sec-tors depend on fi nance or make a living providing fi nance with the highly specialized ser vices it needs.2
Yet we can only apprehend fi nance and its dynamics through the thick worlds within which its diverse invasions happen. For in-stance, now we see not just the commodifi cation of food, gold, and many other goods, but also the fi nancializing of those commodities. Similarly, there is not only interest on loans but the fi nancializing of interest payments. There are particularly brutal cases that reveal the economic violence that can ensue when something goes wrong. One example is the expulsion of huge numbers of people from their foreclosed homes in countries as different as the United States, Spain, and Latvia over a short and sharp history. Another is the massive losses arising from fi nancial speculation and borne by the funds of municipal governments in countries as unlike as the United States and Italy.
I begin with a microcosm where all these aspects come together in thick, often elementary ways: how modest house holds seeking to own modest houses were brought into the fi nancializing machinery in a growing number of countries. I focus on the United States be-cause it was ground zero for this development and the innovation that enabled it. The case serves to illustrate some of the features of fi nancialization, specifi cally the use of complex instruments in the making of a short, highly profi table investment cycle for some and elementary brutalities for the many millions who lost their homes. Next I examine the global potential for such instruments and focus on some other countries that have experienced similar ex-pulsions, even though in each country there is a different specifi c explanation.

Finance and Its Capabilities • 121
What matters to my analysis is that these diverse countries are beginning to share a deeper underlying dynamic that cuts across familiar divisions even as it gets fi ltered through the thick specifi cs of each situation. Conceptually we tend to remain captives of exist-ing and inherited distinctions among different countries, different national banking systems, and so on. This has consequences: our focus on familiar, often long- standing distinctions serves to hide or make less legible the fact that a similar dynamic can underlie diverse cases. Local or national developments and trends can be building blocks of a global trend that transcends the familiar separations. The chapter concludes with a discussion of the intersection of complexity and brutality as it is fi ltered through national po liti cal economies, veiling the making of a deeper global po liti cal economy. While the latter is partial in its specifi city, it cuts across many of the familiar divisions of nation- states, economic sectors, and markets.
When Local Housing Becomes a Global Financial Instrument
Beyond its social and po liti cal role, housing has long been a critical economic sector in all developed societies and has made major con-tributions to economic growth. There have historically been three ways in which it played this economic role: as part of the construc-tion sector, as part of the real estate market, and as part of the banking sector in the form of mortgages. In all three sectors it has at times been a vector for innovations. For instance, solar energy has largely been applied to housing rather than to offi ces or facto-ries. Mass construction has used housing as a key channel to develop new techniques and formats, and the industrial production of prefab-ricated buildings has similarly focused on housing to work out the kinks. Finally, mortgages have been one of the key sources of in-come and innovations for traditional- style banking. The thirty- year

122 • E X P U L S I O N S
mortgage, now a worldwide standard, was actually a major inno-vation for credit markets. Japan and then China instituted, respec-tively, ninety- and seventy- year mortgages to deal with a rapidly growing demand for housing fi nance in a situation where three generations were necessary to cover the cost of housing in a boom period— the 1980s in Japan and the 2000s in China.
The securitizing of mortgages, which took off in the 1980s, added yet another role for housing in the economy. Securitizing home mortgages can create growth in an economy. But it also opens up the mortgage market to speculation, making it vulnerable to risk and loss. This is acceptable if the own er of the mortgaged property decides to speculate and is fully informed of the risks. But it is not acceptable if the decision to enter a risky arrangement is made without such knowing consent. Even knowing consent may not be enough at a time when contracts are long and impenetrable and the culture pervading the fi nancial and investment industry is not characterized by openness and transparency. It is worth recalling the notorious bankruptcy of Orange County, a municipal govern-ment in California: what the local government thought was a loan turned out to be a highly speculative investment, bankrupting the county and its pension funds. A similar crisis happened late in 2012 when dozens of municipal governments in Italy confronted a bud-get crisis because what they thought were straightforward bank loans turned out to be credit default swaps— one of the riskiest and most speculative types of investment.
The securitizing of home mortgages has a similar effect: it trans-forms what might look like a traditional mortgage into part of a speculative investment instrument to be sold and bought in specu-lative markets. But it follows a different pathway and represents yet another fi nancial innovation capable of extreme destruction. It in-serts a new channel for using housing as an asset that is to be rep-resented by a contract (the mortgage) and can be sliced into smaller components and mixed with other types of debt for sale in the high

Finance and Its Capabilities • 123
fi nance circuit. In the case of the par tic u lar type of subprime mort-gage developed in the United States in the 2000s, the contract rep-resenting the mortgage was spliced and then each bit mixed with high- grade debt to generate an “asset- backed security” to be sold to fi nancial investors. All that mattered to succeed in such selling was, in the last instance, a signed contract between bank and homebuyer representing an asset— the modest house. The actual value of the underlying asset (the house) did not matter, nor did the mortgage itself or the value of interest payments. The fi nancial instrument was constructed so as to delink the instrument from those values. What mattered was that the instrument could function as an asset- backed security in the investment circuit, even if the instrument contained merely a small slice of a very low- cost asset (playing the role of material asset) and was mostly made up of other types of debt. The challenge was to delink the actual value of that asset (house) from the contract that was to be used in the high- fi nance circuit. It meant developing a series of complex steps, numbering up to fi fteen, so that the fact of the actual value of the home and the mortgage payments did not matter. That is, the asset- backed secu-rity had to be “liberated” from the burden of the actual value of the asset, which was mostly very modest. The result was an enormously complex and opaque instrument.
Such delinking made the creditworthiness of mortgage holders irrelevant to the potential for profi t. The result was to put modest house holds in a high- risk situation, with salespeople pushing to get the contract signed. What mattered was the mere existence of the signed contract, or, more precisely, the accumulation of large num-bers of such signed contracts. This innovation opened up the world of lower- middle- income house holds to the high circuits of fi nance, creating what could potentially be a global market comprising bil-lions of house holds. Later in this chapter I briefl y examine the po-tential for this new fi nancial instrument to spread to major devel-oping regions of the world.3

124 • E X P U L S I O N S
This is not the fi rst time the fi nancial sector has used housing to develop an instrument for investors. The fi rst residential- mortgage- backed securities were produced in the late 1970s. The concept, a good one in many ways, was to generate another source for fund-ing mortgages besides the traditional one, which was basically bank deposits in their many variants. In their benign early form, mortgage- backed securities served to lower interest rates on mort-gages and to stabilize the loan supply: that is, they allowed banks to continue lending even during downturns.
But that earlier incarnation of subprime mortgages was a state project. The one developed in the United States at the beginning of the twenty- fi rst century and now spreading internationally is built by and for the fi nancial sector. It is not about helping house holds to get housing but rather is intended to build a fi nancial instrument, an asset- backed security, for use in fi nancial circuits. Two features make this innovation different. One is the extent to which these mortgages function purely as fi nancial instruments, in that they can be bought and promptly sold. Own ership of the instrument may just last for a matter of hours. Thus, when an investor has sold the instrument, what happens to the house itself is irrelevant; indeed, the fi rms or bank divisions that suffered sharp losses were largely those specialized subprime lenders or divisions within banks that did retain own ership of the debt. Further, as already described, since these mortgages have been divided, spliced, and distributed across diverse investment packages, there is no single component in such a package that actually represents the whole house. In con-trast, the own er loses the entire house and all the value she has in-vested in it if she is unable to meet the mortgage payments for a few months— no matter who owns the instrument and the slice of her house inside that instrument.
The second difference from traditional mortgages is that the source of profi t for the investor is not the payment of the mortgage itself but the sale of the fi nancial package that bundles hundreds or

Finance and Its Capabilities • 125
thousands of mortgage slices. This par tic u lar feature of the instru-ment enables lenders to make a profi t from the vast potential market represented by modest- income house holds. The billions of these house holds across the world can become a major target when the source of profi t is not the payment of the mortgage itself but the sale of the fi nancial bundle. What counts for the lender is not the credit-worthiness of the borrower but the sheer number of mortgages sold to (often pushed onto) house holds. This par tic u lar feature might be fi ne if the target for such mortgages is wealthy speculators, but it becomes alarming when less well- off house holds are the target.
The asymmetry between the world of investors (only some will be affected) and the world of homeowners (once they default, they will lose the house no matter what investor happens to own the instrument at the time) creates a massive distortion in the housing market and the housing fi nance market. While homeowners unable to meet their mortgage obligations cannot escape the negative con-sequences of default, most investors can, because they buy these mortgages in order to sell them; there were many winners among investors and only a few losers in the years before the crisis broke in August 2007. Thus, investors could relate in a positive way to even the so- called subprime mortgages (poor- quality instruments), and this indifference in itself was bad for potential homeowners. We see here yet another sharp asymmetry in the position of the di-verse players enacting an innovation.
Finally, the current period makes legible a third asymmetry. At a time of massive concentration of fi nancial resources in a limited number of superfi rms, any that own a large share of the subprime mortgages when a mortgage default crisis hits get stuck with mas-sive losses. In an earlier period, own ership of mortgages was widely distributed among a huge number of banks and credit unions, and hence losses were more widely distributed as well. The fact that several large, powerful fi rms wrongly felt that they could manage high- risk instruments further raised their losses. Ruthless practices,

126 • E X P U L S I O N S
the capacity of fi rms to dominate markets, and the growing inter-connectedness of the markets have made these superfi rms vulnera-ble to their own power, in a sort of network effect.4 One notorious example is that of now defunct Lehman Brothers, whose value still has not been established by the team of top- level experts assembled for the company’s bankruptcy proceedings.
It is easy to persuade modest- income house holds to take out risky mortgages in a country such as the United States, where owning a house has been constructed into a high priority, unlike, for instance, Germany. Presented with the possibility (which turned out to be mostly a deception) of owning a house, modest- income people will put what ever savings they have into a down payment, and future earnings into monthly payments. The small savings or future earnings of modest- income house holds or the prior own ership of a modest house were used to enable customers to enter into a contract. And, as we have seen, to the lender it was the contract that mattered, not the house itself or the mortgage payments, for the contract was necessary to develop a fi nancial instrument that could profi t investors.
By 2004, the strategy was so successful with investors that mort-gage sellers did not even ask for full credit reports or a down pay-ment, just a signature on the contract. In a fi nancial world over-whelmed by speculative capital, speed and numbers mattered, so the premium was on selling subprime mortgages to as many house holds as possible, including those who qualifi ed for a regular mortgage that would have afforded them more protections but would have taken much longer to pro cess. The negative effects on house holds, on neighborhoods, and on cities received no consider-ation. It is interesting to note that the same innovation that oper-ated in the securitization of mortgages, in which a negative for some can actually translate into a categorical positive for a larger system, can be seen in the case of outsourced jobs as well. Out-sourcing involves complex and costly logistics, but it is worth it to gain those cents on each work hour because it translates into addi-

Finance and Its Capabilities • 127
tional value for a fi rm’s shares in the fi nancial markets, and hence additional profi ts for shareholders and executives.
Furthermore, within the logic of fi nance, it is also possible to make a good profi t by betting against the success of an innovation— that is, to profi t by predicting failure. This type of profi t making happened as well with subprime mortgages and a series of other fi nancial in-novations, notably credit default swaps. In fact, it was the far larger market of swaps that sparked the September 2008 fi nancial crisis: anxious investors trying to cash in their credit default swaps begin-ning in 2007 made visible the fact that this $60 trillion market lacked the actual funds to meet its obligations. In short, the so- called sub-prime crisis was not due to irresponsible house holds taking on mort-gages they could not afford, as is still commonly asserted in the United States and the rest of the world. Rather, the mounting foreclo-sures signaled to those investors who had bought credit default swaps, that it was time to cash in their “insurance,” but the money was not there, because the foreclosures had also devalued the swaps.
Multiple conditions, including the decline in housing prices, led to extremely negative outcomes for house holds, including foreclo-sure.5 From 2005 to 2010, out of more than 13.3 million mortgage
TABLE 3.1: U.S. Home Foreclosures, 2006– 2010
Year Foreclosure notices (in millions)
2006 1.2
2007 2.2
2008 3.1
2009 3.9
2010 2.9
Total 13.3
Data source: RealtyTrac 2012b.
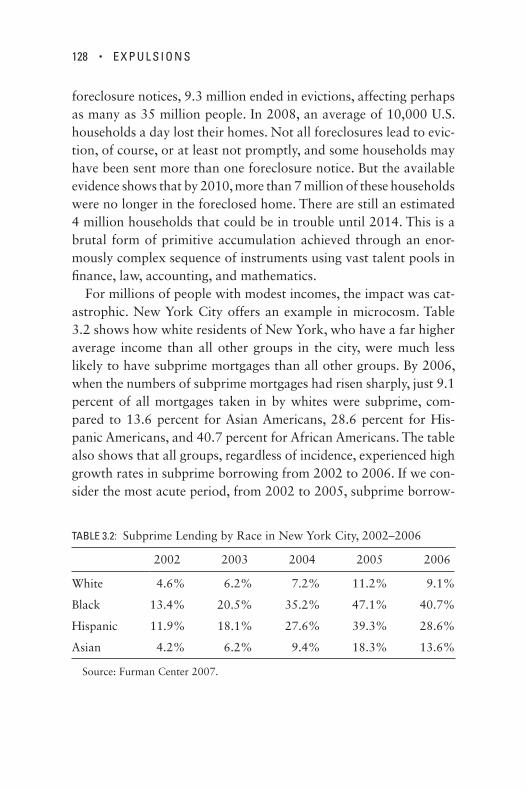
128 • E X P U L S I O N S
foreclosure notices, 9.3 million ended in evictions, affecting perhaps as many as 35 million people. In 2008, an average of 10,000 U.S. house holds a day lost their homes. Not all foreclosures lead to evic-tion, of course, or at least not promptly, and some house holds may have been sent more than one foreclosure notice. But the available evidence shows that by 2010, more than 7 million of these house holds were no longer in the foreclosed home. There are still an estimated 4 million house holds that could be in trouble until 2014. This is a brutal form of primitive accumulation achieved through an enor-mously complex sequence of instruments using vast talent pools in fi nance, law, accounting, and mathematics.
For millions of people with modest incomes, the impact was cat-astrophic. New York City offers an example in microcosm. Table 3.2 shows how white residents of New York, who have a far higher average income than all other groups in the city, were much less likely to have subprime mortgages than all other groups. By 2006, when the numbers of subprime mortgages had risen sharply, just 9.1 percent of all mortgages taken in by whites were subprime, com-pared to 13.6 percent for Asian Americans, 28.6 percent for His-panic Americans, and 40.7 percent for African Americans. The table also shows that all groups, regardless of incidence, experienced high growth rates in subprime borrowing from 2002 to 2006. If we con-sider the most acute period, from 2002 to 2005, subprime borrow-
TABLE 3.2: Subprime Lending by Race in New York City, 2002– 2006
2002 2003 2004 2005 2006
White 4.6% 6.2% 7.2% 11.2% 9.1%
Black 13.4% 20.5% 35.2% 47.1% 40.7%
Hispanic 11.9% 18.1% 27.6% 39.3% 28.6%
Asian 4.2% 6.2% 9.4% 18.3% 13.6%
Source: Furman Center 2007.
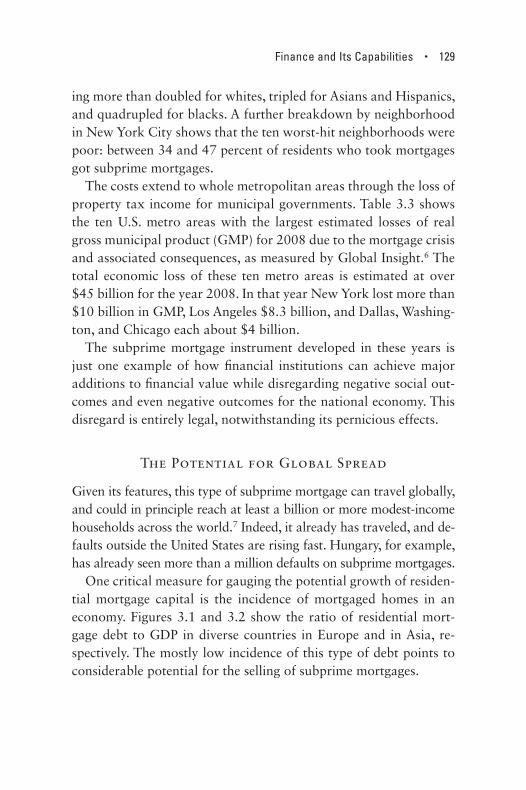
Finance and Its Capabilities • 129
ing more than doubled for whites, tripled for Asians and Hispanics, and qua dru pled for blacks. A further breakdown by neighborhood in New York City shows that the ten worst- hit neighborhoods were poor: between 34 and 47 percent of residents who took mortgages got subprime mortgages.
The costs extend to whole metropolitan areas through the loss of property tax income for municipal governments. Table 3.3 shows the ten U.S. metro areas with the largest estimated losses of real gross municipal product (GMP) for 2008 due to the mortgage crisis and associated consequences, as mea sured by Global Insight.6 The total economic loss of these ten metro areas is estimated at over $45 billion for the year 2008. In that year New York lost more than $10 billion in GMP, Los Angeles $8.3 billion, and Dallas, Washing-ton, and Chicago each about $4 billion.
The subprime mortgage instrument developed in these years is just one example of how fi nancial institutions can achieve major additions to fi nancial value while disregarding negative social out-comes and even negative outcomes for the national economy. This disregard is entirely legal, notwithstanding its pernicious effects.
The Potential for Global Spread
Given its features, this type of subprime mortgage can travel globally, and could in principle reach at least a billion or more modest- income house holds across the world.7 Indeed, it already has traveled, and de-faults outside the United States are rising fast. Hungary, for example, has already seen more than a million defaults on subprime mortgages.
One critical mea sure for gauging the potential growth of residen-tial mortgage capital is the incidence of mortgaged homes in an economy. Figures 3.1 and 3.2 show the ratio of residential mort-gage debt to GDP in diverse countries in Eu rope and in Asia, re-spectively. The mostly low incidence of this type of debt points to considerable potential for the selling of subprime mortgages.

130 • E X P U L S I O N S
TABLE 3.3: U.S. Metro Areas with Largest Losses of GMP, 2006
Rank Metro area
Revised real GMP growth
(%)
Loss in real GMP growth
(%)
Loss of GMP
(million $)
1 New York– Northern New Jersey– Long Island, NY/PA
2.13 0.65 10,372
2 Los Angeles– Long Beach– Santa Ana, CA
1.67 0.95 8,302
3 Dallas–Fort Worth– Arlington, TX
3.26 0.83 4,022
4 Washington, DC– Arlington–Alexandria, VA/MD/WV/DC
2.79 0.60 3,957
5 Chicago- Naperville- Joliet, IL/IN/WI
2.23 0.56 3,906
6 San Francisco– Oakland–Fremont, CA
1.88 1.07 3,607
7 Detroit- Warren- Livonia, MI
1.30 0.97 3,203
8 Boston- Cambridge- Quincy, MA
2.16 0.99 3,022
9 Philadelphia- Camden- Wilmington, DE/NJ/PA/MD
1.85 0.63 2,597
10 Riverside–San Bernadino– Ontario, CA
3.51 1.05 2,372
Source: Global Insight 2007, table 2.

Finance and Its Capabilities • 131
0
20
40
60
80
100
120
140
Roman
ia
Sloven
ia
Poland
Slovak
ia
Hunga
ry
Czech
Rep
.
Lithu
ania
Italy
Austri
a
Greec
e
Latvi
a
Fran
ce
Estonia
Finlan
d
Belgium
Malt
a
Luxe
mbo
urg
Sweden
Germ
anySpa
in
Portu
gal
Irelan
d
Nethe
rland
sUK
Denm
ark
Switzer
land
FIGURE 3.1 Ratio of Residential Mortgage Debt to GDP in Europe, 2006Data source: Miles and Pillonca 2008, fi gure 1.
0
10
20
30
40
50
60
70
Pakist
an
Indo
nesia
Bangla
desh
India
Philipp
ines
China
Thaila
ndKor
ea
Taiw
an
Mala
ysia
Hong
Kong
Singap
ore
FIGURE 3.2 Ratio of Residential Mortgage Debt to GDP in Emerging Asia, 2001– 2005Data source: Warnock and Warnock 2008, table 2.

132 • E X P U L S I O N S
A second critical mea sure is the ratio of overall house hold credit (that is to say, debt) to house hold disposable income in the rapidly changing 2000–2005 period (see Table 3.4 and Figure 3.3). In some countries this ratio increased sharply: for instance, in the Czech Republic it grew from 8.5 percent in 2000 to 27.1 percent in 2005 and in Hungary from 11.2 percent to 39.3 percent, while in South Korea it rose from 33 percent to 68.9 percent. This growth is also evident in India, where the initial level was low, 4.7 percent in 2000, but had doubled to 9.7 percent by 2004. In mature market
TABLE 3.4: Ratio of House hold Credit to Personal Disposable Income, 2000– 2005
2000 2001 2002 2003 2004 2005
Emerging Markets
Czech Republic 8.5 10.1 12.9 16.4 21.3 27.1
Hungary 11.2 14.4 20.9 29.5 33.9 39.3
Poland 10.1 10.3 10.9 12.6 14.5 18.2
India 4.7 5.4 6.4 7.4 9.7
Korea 33.0 43.9 57.3 62.6 64.5 68.9
Philippines 1.7 4.6 5.5 5.5 5.6
Taiwan 75.1 72.7 76.0 83.0 95.5
Thailand 26.0 25.6 28.6 34.3 36.4
Mature Markets
Australia 83.3 86.7 95.6 109.0 119.0 124.5
France 57.8 57.5 58.2 59.8 64.2 69.2
Germany 70.4 70.1 69.1 70.3 70.5 70.0
Italy 25.0 25.8 27.0 28.7 31.8 34.8
Japan 73.6 75.7 77.6 77.3 77.9 77.8
Spain 65.2 70.4 76.9 86.4 98.8 112.7
United States 104.0 105.1 110.8 118.2 126.0 132.7
Data source: IMF 2006.
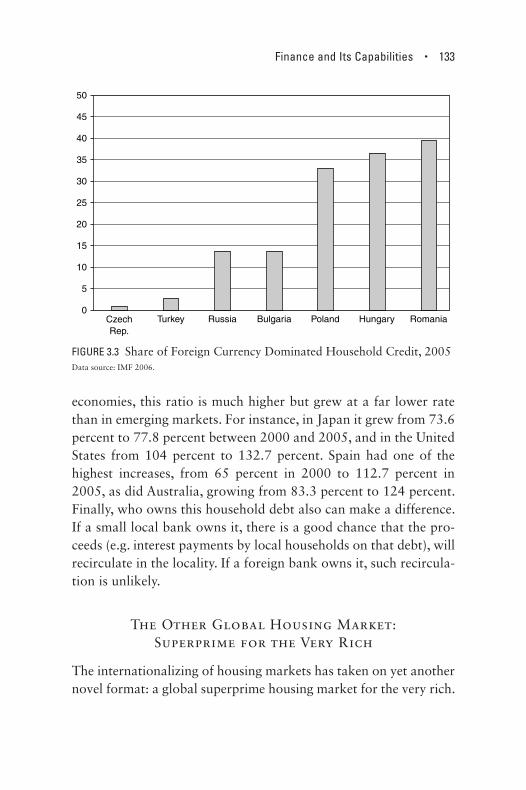
Finance and Its Capabilities • 133
economies, this ratio is much higher but grew at a far lower rate than in emerging markets. For instance, in Japan it grew from 73.6 percent to 77.8 percent between 2000 and 2005, and in the United States from 104 percent to 132.7 percent. Spain had one of the highest increases, from 65 percent in 2000 to 112.7 percent in 2005, as did Australia, growing from 83.3 percent to 124 percent. Finally, who owns this house hold debt also can make a difference. If a small local bank owns it, there is a good chance that the pro-ceeds (e.g. interest payments by local house holds on that debt), will recirculate in the locality. If a foreign bank owns it, such recircula-tion is unlikely.
The Other Global Housing Market: Superprime for the Very Rich
The internationalizing of housing markets has taken on yet another novel format: a global superprime housing market for the very rich.
0
5
10
15
20
25
30
35
40
45
50
CzechRep.
Turkey Russia Bulgaria Poland Hungary Romania
FIGURE 3.3 Share of Foreign Currency Dominated House hold Credit, 2005Data source: IMF 2006.

134 • E X P U L S I O N S
It is an invented or made market, where setting a very high base price allows it to avoid regular market dynamics, and then makes its specialness part of the cost to buyers. The basic concept is prob-ably as old as wealth. But the developments of the past de cade mark a distinctive phase. In a growing number of global cities, extremely rich foreigners have bought a signifi cant number of luxury houses; in some cities this entails buying several smaller units to combine into one larger mansion. Among the main destinations for the superrich are Monaco, London, Paris, New York, Moscow, Singapore, Hong Kong, Shanghai, and Dubai. It is worth noting that Shanghai was the only city to show a marked decrease in the percentage of foreign buyers during the period of the economic crisis, from 2007 to 2012, when it showed a decline of 24 percentage points, while Hong Kong had the highest increase (23 percent), albeit mostly from China’s mainland. In the other cities, the number of foreign buyers remained the same or increased.
As Table 3.5 shows, the minimum price of a house for it to be included in the superprime market varies considerably, from $6.4 million in Shanghai to $18.9 million in Monaco. The demographics of the market, specifi cally the incidence of foreign buyers, seem to play a role in the price. Thus, to take an extreme case, 100 percent of the market for superprime housing in Dubai consists of foreign-ers, compared to 10 percent in the cheaper market of Shanghai. As for nationalities, Rus sians have been the main foreign buyers in London, Paris, and Monaco. British buyers have been strong in Monaco, Paris, New York, and Singapore. Africans seem to be purchasing superprime real estate exclusively in Dubai. There is in some cases a regionalism in the choices. Housing in Singapore is predominately purchased by other Asians and Australians; in Hong Kong, mostly by mainland Chinese; in Paris, Monaco, and Mos-cow, mainly by local Eu ro pe ans and citizens of the CIS. London, Dubai, and New York City seem to attract foreign buyers from all around the globe.

TAB
LE 3
.5:
Fore
ign
Buy
ers
in t
he S
uper
prim
e H
ousi
ng M
arke
t, 20
07– 2
012
Cit
yC
ount
ry o
f or
igin
of
fore
ign
buye
rs
Min
imum
pri
ce t
o qu
alif
y as
sup
erpr
ime
(in
mill
ions
of
$)
% f
orei
gn
(of
all b
uyer
s)
2007
2012
Mon
aco
Rus
sia,
CIS
,a U
nite
d K
ingd
om, I
taly
, Sw
itze
rlan
d18
.910
010
0
Pari
sR
us si
a, C
IS,a
Ital
y, F
ranc
e, G
erm
any,
Uni
ted
Kin
gdom
, Uni
ted
Stat
es8.
890
95
Lon
don
Rus
sia,
Fra
nce,
Sou
th A
fric
a, I
taly
, Ind
ia,
Uni
ted
Ara
b E
mir
ates
, Gre
ece,
Aus
tral
ia,
Uni
ted
Stat
es, C
anad
a
15.9
7585
Dub
aiK
enya
, Som
alia
, Tan
zani
a, S
audi
Ara
bia,
R
us si
a, I
ndia
, Ira
n8.
045
60
New
Yor
kU
nite
d K
ingd
om, F
ranc
e, I
taly
, Spa
in, C
hina
, Si
ngap
ore,
Aus
tral
ia, B
razi
l, A
rgen
tina
, C
anad
a
10.0
5050
Shan
ghai
Hon
g K
ong,
Tai
wan
, Uni
ted
Stat
es, C
anad
a,
Japa
n, M
alay
sia,
Ger
man
y, F
ranc
e6.
434
10
Sing
apor
eIn
done
sia,
Chi
na, M
alay
sia,
Ind
ia, A
ustr
alia
, U
nite
d K
ingd
om8.
324
31
Hon
g K
ong
Chi
na15
.412
35M
osco
wC
ISa
7.8
1010
Dat
a so
urce
: Pow
ley
and
War
wic
k- C
hing
201
2.N
ote:
a. C
IS r
efer
s to
Com
mon
wea
lth
of I
n de p
en de
nt S
tate
s, w
hich
incl
udes
the
fol
low
ing
coun
trie
s: A
rmen
ia, A
zerb
aija
n,
Bel
arus
, Kaz
akhs
tan,
Kyr
gyzs
tan,
Mol
dova
, Rus
sia,
Taj
ikis
tan,
and
Uzb
ekis
tan.

136 • E X P U L S I O N S
Finance: Unable to Govern Its Own Power?
Financial assets have grown far more rapidly than the overall economy of developed countries, as mea sured by GDP. This would not necessarily be bad, especially if the growing fi nancial capital is transformed into large- scale projects for public benefi t. But in the period that began in the 1980s, this accrual of benefi t to the public was rare; among the exceptions were, for example, large- scale greening and environmentally sound projects in a range of cities, from London’s Olympic Park to Rio’s expansion of its mass- transport system. Mostly, fi nance focused on developing more spec-ulative instruments and investments. Historically, this seems to be part of the logic of fi nance: As it grows and gains power, it does not use its power well. Giovanni Arrighi has argued that when specula-tive fi nance becomes dominant in a historic period, it signals the decay of that period.8
In the United States, the home of many or gan i za tion al and fi nan-cial innovations, the value of fi nancial assets by 2006— before the economic crisis— was 450 percent the value of GDP.9 In the Eu ro-pe an Union, the corresponding fi gure was 356 percent, with the United Kingdom well above the EU average at 440 percent. More generally, the number of countries where fi nancial assets exceeded the value of the country’s GDP more than doubled, from thirty- three in 1990 to seventy- two in 2006.
These numbers signal that the period beginning in the late 1980s and continuing to the present constitutes an extreme phase. But is it anomalous? I argue that it is not. Furthermore, this phase is not created by exogenous factors, as the notion of crisis suggests. Re-current crises are characteristic of this par tic u lar type of fi nancial system. Even after the fi rst crises of this phase occurred, in the 1980s, the U.S. government gave the fi nancial industry the instru-ments to continue its leveraging stampede, as is illustrated in the

Finance and Its Capabilities • 137
savings and loan crisis and the New York stock market crash of 1987. In the United States, perhaps the most extreme case, there have been fi ve major bailouts, starting with the 1987 stock market crisis. Each time, taxpayers’ money was used to pump liquidity into the fi nancial system, and the fi nancial industry used it to leverage, aiming at more speculation and gain. It did not use it to pay off its debt because this industry is about debt.
The fi nancializing of a growing number of economic sectors since the 1980s has become both a sign of the power of this fi nancial logic and the sign that it is exhausting its growth potential in the current phase, insofar as fi nance needs to use and invade other economic sectors in order to grow. Once it has subjected much of the econ-omy to its logic, it reaches some type of limit, and the downward curve is likely to set in. One acute illustration of this is the develop-ment of instruments by some fi nancial fi rms that allow them simul-taneously to bet on growth in a sector and bet against that sector. This clearly is not made public, but every now and then we gain an insight into how it might work. In one recent case, Goldman Sachs designed derivatives for the Greek government that facilitated Greece’s entry into the EU and then developed instruments for another client that would deliver profi ts if Greece’s government went bankrupt. This generated considerable outrage in Greece and in the EU.
The current crisis contains features suggesting that fi nancialized capitalism has reached the limits of its own logic for this phase. Fi-nance has been extremely successful at extracting value from many an economic sector and from chains of derivative on derivative in an often long sequence. However, when everything in a sector has become fi nancialized in a long chain that consists basically of fi -nance building instruments on fi nance, then there is no longer value to extract. At that point the sector needs new, nonfi nancialized sectors to build on. In this context, two of the last frontiers for fi nancial extraction are housing for the modest- income house hold, of which

138 • E X P U L S I O N S
there are a billion or more worldwide, and bailouts through tax-payers’ money (real, old- fashioned—not fi nancialized— money).10
Credit default swaps, yet another recent innovation, are a critical factor in the current fi nancial crisis. Their rapid growth was partly due to the fact that they were sold as a sort of insurance, which was valuable to many investors in a worrisome hypergrowth market. The second factor that fed the growth of this market was a familiar con-dition in any speculative market: some investors saw the economy as nearing crisis and others saw it as still having a few years of rapid growth. In short, there were eager buyers of swaps and there were eager sellers, and a market was thus made. From under $1 trillion in 2001, swaps reached a value of $62 trillion by 2007, more than the $55 trillion of global GDP in 2007. But by September 2008 they had led to massive losses. The critical factor creating instabil-ity for the fi nancial sector was not that millions of people with sub-prime mortgages were facing foreclosures, because the overall value of foreclosures was relatively small for global fi nanciers. It was not knowing what might next turn out to be a toxic asset, since vast numbers of small slices of these mortgages had been bundled with high- grade debt in order to sell these instruments as backed by an actual material asset. The complexity of these investment instru-ments made it almost impossible to trace that tiny toxic compo-nent. What was a housing crisis for millions of people was only a crisis of confi dence among investors. Yet it was enough to make that powerful system tremble. In other words, this type of fi nancial system has more of the social in it than is suggested by the technical complexity of its instruments and electronic platforms.11
The language of crisis remains ambiguous. A fi rst point is that what we call “crisis” has enormous variability. Since the 1980s, there have been several fi nancial crises. Some are well known, such as the 1987 New York stock market crash and the 1997 Asian meltdown. Others have received less attention, such as the fi nancial crises that occurred in more than seventy countries during the

Finance and Its Capabilities • 139
1980s and 1990s as they deregulated their fi nancial systems. These are usually referred to as “adjustment crises,” the language of “ad-justment” suggesting that these are positive changes inasmuch as they move a country toward economic development.
Typically, the term “fi nancial crisis” is used to describe an event that has a deleterious effect on the leading sectors of fi nance rather than on a country’s institutions and people. Adjustment crises in-volved a far larger region of the globe than did the fi nancial crises of 1987 and 1997. Yet the miseries the adjustment crises infl icted on middle- income people in the countries where they occurred, and the resulting destruction of often well- functioning national eco-nomic sectors, have largely been invisible to the global eye. These adjustment crises in individual countries intersected with global in-terests only when there were strong fi nancial links with global fi rms and investors, as was the case with the 1994 crisis in Mexico and the 2001 crisis in Argentina.
A second point arises from data that present the period after the 1997 Asian fi nancial crisis as a fairly stable one— until the current fi nancial crisis. One element of this repre sen ta tion is that after a country goes through an adjustment crisis, what follows can be mea sured as “stability” and even prosperity according to conven-tional indicators. Except for the dot- com bust and the Argentine sovereign default, the post- 1997 period was one of considerable fi -nancial stability for the leading fi nancial markets and fi rms. But behind this “stability” lay the savage sorting of winners and losers that has already been described. It is easier to track winners than to track the often slow descent into poverty of house holds, small fi rms, and government agencies (such as those concerned with health and education) that are not part of the new glamour sectors of fi nance and trade. The postadjustment losers became relatively invisible globally over the last twenty years. Every now and then they became visible, as when members of the traditional middle class in Argentina engaged in food riots in Buenos Aires and elsewhere in the

140 • E X P U L S I O N S
mid- 1990s, breaking into food shops just to get food— something that was previously unheard of in Argentina and took many by sur-prise. Such rare events also make visible the very incomplete char-acter of postadjustment stability and the new “prosperity” praised by global regulators and media.
Thus, we need to disaggregate the often- touted fact that in 2006 and 2007 most countries had a GDP growth rate of 4 percent a year or more, a rate much higher than that of previous de cades. Behind that mea sure lies the making of extreme forms of wealth and poverty and the destruction of well- established middle classes. In contrast, a 4 percent GDP growth rate in the Keynesian years described the growth of a massive middle class.
Also left out of this macro- level picture of relative stability in the de cade after the Asian fi nancial crisis is the critical fact that crisis is a structural feature of deregulated, interconnected, and electronic fi nancial markets. Two points are worth mentioning in this regard. One is the sharp growth in the extent to which nonfi nancial eco-nomic sectors were fi nancialized, leading to the overall growth of fi nancial assets as a share of sector value. That is to say, if crisis is a structural feature of current fi nancial markets, then the more non-fi nancial economic sectors experience fi nancialization, the more susceptible they become to a fi nancial crisis, regardless of their product. As a result, the potential for instability even in strong eco-nomic sectors is high, particularly in countries with sophisticated fi nancial systems and high levels of fi nancialization, such as the United States and the United Kingdom. Germany, which has weath-ered the fi nancial crisis much better than the United States and the United Kingdom, has a manufacturing economy and a fairly low level of fi nancialization— before the 2007 crisis hit, the value of fi -nancial assets in Germany was only 175 percent of GDP, compared with 450 percent in the United States.
Let me illustrate with an example from the current crisis and another from the 1997 Asian crisis. When the current crisis hit the
Finance and Its Capabilities • 141
United States in 2007, many healthy fi rms, with good capitaliza-tion, strong demand for their goods and ser vices, and good profi t levels, were brought low. Large U.S. corporations, from Coca- Cola and Pepsi to IBM and Microsoft, were doing fi ne in terms of capital reserves, profi ts, market presence, and so on, but the fi nancial crisis still hit them, directly via devalued stock and other fi nancial hold-ings and indirectly through the impact of the crisis on consumer demand and credit access. Highly fi nancialized sectors such as the housing market and commercial property market suffered directly and immediately. In many countries that underwent adjustment cri-ses in earlier years, too, basically healthy nonfi nancial fi rms were negatively affected. These adjustments were aimed at securing the conditions for globally linked fi nancial markets, but they ruined many fi rms in the nonfi nancial sector as well as small domestic banks.
We saw this also in the 1997 Asian fi nancial crisis. Thousands of healthy manufacturing fi rms were destroyed in South Korea— fi rms whose products were in strong demand in national and foreign markets and that had the workforces and the machines to fi ll worldwide orders but which had to close because credit dried up and they were prevented from paying the up- front costs of produc-tion. The result was the unemployment of more than a million fac-tory workers.12
The critical event that brought the fi nancial system to a momen-tary standstill in 2008 was the classic bursting of a speculative bub-ble: the $62 trillion credit default swap crisis that exploded in Sep-tember 2008, a full year after the subprime mortgage crisis of August 2007. By 2008, the decrease in house prices, the high rate of mortgage foreclosures, the decline in global trade, and the growth of unemployment all alerted investors that something was not right. This in turn led those who had bought credit default swaps as a sort of insurance (see Figure 3.4 for the rapid growth in the value of such swaps between 2001 and 2007) to want to cash in.
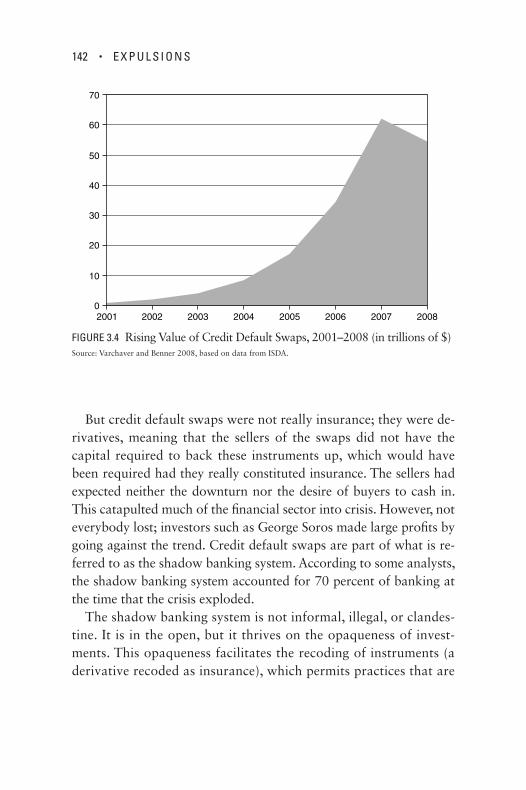
142 • E X P U L S I O N S
But credit default swaps were not really insurance; they were de-rivatives, meaning that the sellers of the swaps did not have the capital required to back these instruments up, which would have been required had they really constituted insurance. The sellers had expected neither the downturn nor the desire of buyers to cash in. This catapulted much of the fi nancial sector into crisis. However, not everybody lost; investors such as George Soros made large profi ts by going against the trend. Credit default swaps are part of what is re-ferred to as the shadow banking system. According to some analysts, the shadow banking system accounted for 70 percent of banking at the time that the crisis exploded.
The shadow banking system is not informal, illegal, or clandes-tine. It is in the open, but it thrives on the opaqueness of invest-ments. This opaqueness facilitates the recoding of instruments (a derivative recoded as insurance), which permits practices that are
0
10
20
30
40
50
60
70
2001 2002 2003 2004 2005 2006 2007 2008
FIGURE 3.4 Rising Value of Credit Default Swaps, 2001– 2008 (in trillions of $)Source: Varchaver and Benner 2008, based on data from ISDA.
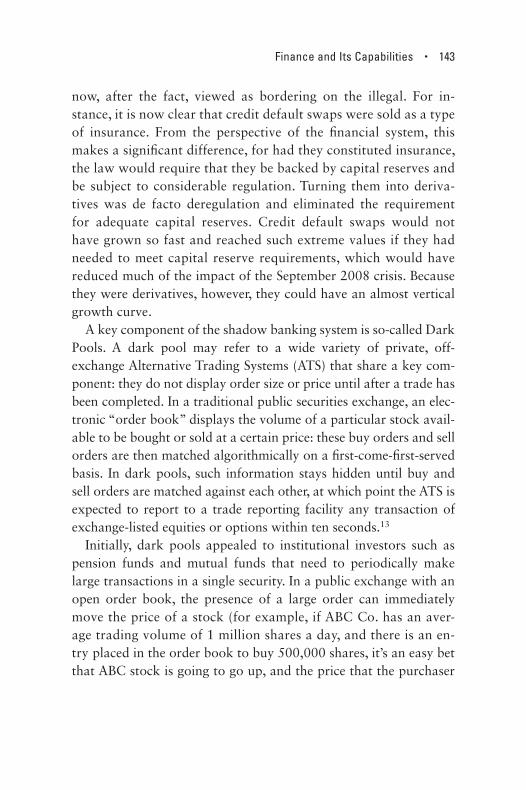
Finance and Its Capabilities • 143
now, after the fact, viewed as bordering on the illegal. For in-stance, it is now clear that credit default swaps were sold as a type of insurance. From the perspective of the fi nancial system, this makes a signifi cant difference, for had they constituted insurance, the law would require that they be backed by capital reserves and be subject to considerable regulation. Turning them into deriva-tives was de facto deregulation and eliminated the requirement for adequate capital reserves. Credit default swaps would not have grown so fast and reached such extreme values if they had needed to meet capital reserve requirements, which would have reduced much of the impact of the September 2008 crisis. Because they were derivatives, however, they could have an almost vertical growth curve.
A key component of the shadow banking system is so- called Dark Pools. A dark pool may refer to a wide variety of private, off- exchange Alternative Trading Systems (ATS) that share a key com-ponent: they do not display order size or price until after a trade has been completed. In a traditional public securities exchange, an elec-tronic “order book” displays the volume of a par tic u lar stock avail-able to be bought or sold at a certain price: these buy orders and sell orders are then matched algorithmically on a fi rst- come- fi rst- served basis. In dark pools, such information stays hidden until buy and sell orders are matched against each other, at which point the ATS is expected to report to a trade reporting facility any transaction of exchange- listed equities or options within ten seconds.13
Initially, dark pools appealed to institutional investors such as pension funds and mutual funds that need to periodically make large transactions in a single security. In a public exchange with an open order book, the presence of a large order can immediately move the price of a stock (for example, if ABC Co. has an aver-age trading volume of 1 million shares a day, and there is an en-try placed in the order book to buy 500,000 shares, it’s an easy bet that ABC stock is going to go up, and the price that the purchaser
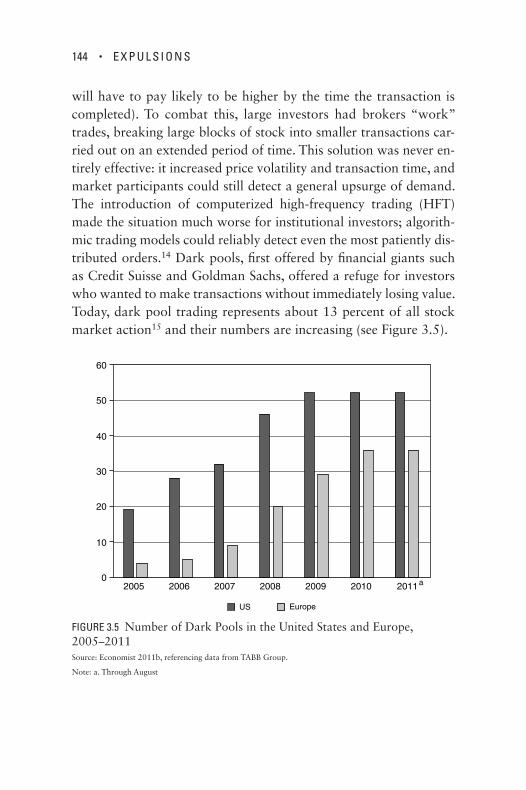
144 • E X P U L S I O N S
will have to pay likely to be higher by the time the transaction is completed). To combat this, large investors had brokers “work” trades, breaking large blocks of stock into smaller transactions car-ried out on an extended period of time. This solution was never en-tirely effective: it increased price volatility and transaction time, and market participants could still detect a general upsurge of demand. The introduction of computerized high- frequency trading (HFT) made the situation much worse for institutional investors; algorith-mic trading models could reliably detect even the most patiently dis-tributed orders.14 Dark pools, fi rst offered by fi nancial giants such as Credit Suisse and Goldman Sachs, offered a refuge for investors who wanted to make transactions without immediately losing value. Today, dark pool trading represents about 13 percent of all stock market action15 and their numbers are increasing (see Figure 3.5).
0
10
20
30
40
50
60
2005 2006 2007 2008 2009 2010 2011
US Europe
a
FIGURE 3.5 Number of Dark Pools in the United States and Eu rope, 2005– 2011Source: Economist 2011b, referencing data from TABB Group.
Note: a. Through August

Finance and Its Capabilities • 145
The potential for abuse within dark pools is massive. The 10- second reporting delay for ATS transactions is an eternity in the modern stock market: in 2010, the major fi nancial exchanges aver-aged 215,162 quotes per second and 28,375 trades.16 In this envi-ronment, the opacity provided by dark pools may distort markets. Further, the same opacity has enabled an extreme potential for abuse: large banks that run their own dark pools are suspected of giving unequal access to their own traders, and dark pool operators have been penalized for running the same HFT strategies within their exchanges and sharing confi dential trade information with in-vestors (Citigroup, in a recent case, received trade information from a dark pool it helped fund).17
In short, the so- called 2008 crisis contained several distinct crises. One was the subprime crisis experienced by the people who obtained these mortgages and lost out. A second crisis emerged from the fact that the millions of home foreclosures were a signal that something was wrong. But in itself, this crisis could not have brought down the fi nancial system. It led to a crisis of confi dence in the investor community. This, in turn, led those who had bought swaps as insur-ance against what they saw as the end of the growth cycle to want to cash in those swaps. And it was this that engendered the major crisis because the sellers of swaps were not ready for such a massive sudden disbursement. The decision by several governments to bail out banks with taxpayers’ money, with no guarantees from banks that they would recirculate bailout funds in the economy, led to further declines in growth and rising poverty of citizens and govern-ments. It pushed already overindebted governments and house holds over the edge. And this is the crisis that lingers on and has led to the current austerity politics examined in Chapter 2. In contrast, global fi nance has gone back to super- profi ts after a brief but sharp fall in 2008.

146 • E X P U L S I O N S
We all need debt, whether we are a fi rm, a house hold, or a coun-try. But do we need this level of debt? More important, do we need such complex instruments to fi nance basic needs for fi rms and house holds? No. Many of these needs can be met with traditional banking loans. We need fi nance because it “creates” capital, and can enable large- scale projects that we need— to clean toxic dumps, green our energy sources, address the vast needs of the destitute in poor and rich countries. In this latest growth cycle fi nance never did. It opted for fi nancialization— of consumer loans and home mortgages, of student loans and pensions, of municipal government debt, and more. Finance was aggressive, invasive, and self- interested, and rather than being regulated fi rmly, it was too often left to risk our money for its own gain.
Changing Our Understanding of Growth and Prosperity
One important difference between the current crisis and other post- 1980 crises is the order of magnitude that speculative instruments made possible. A second important difference involves the larger economic landscape: we now recognize clearly that we need to act quickly to curb fi nancial excess, because existing international trea-ties and national laws are not suffi cient. A third difference is the wider recognition that the growing extremes of wealth and poverty have become problematic. We now know that the profi ts secured by the richer segments of society do not “trickle down.” And we know that epidemics resulting from poverty and inadequate health care will in time also reach the rich.
The extreme character of the current crisis and the fact that we have recognized other major crises— most important among these being climate change— create an opening for the establishment of novel criteria for economic benefi t. Yes, we need fi nancial institu-tions: fi nance has the capacity to make and effi ciently distribute

Finance and Its Capabilities • 147
capital. However, fi nancial capital has been used during the past de cades for extremely speculative investments that largely served to enrich the already wealthy and has often wound up destroying healthy fi rms, even if more often that not this was unintended. In-stead, we must use that new capital for large- scale investments in public goods, to develop manufacturing sectors, to green our econ-omies, and more.
This combination of goals creates an opportunity to re orient fi -nancial capital to meet a broad range of needs. As an example, fi nan-cial capital helped lift countless people in China out of poverty in recent years. But it did so via investments in manufacturing, infra-structure, and other material economies. Using fi nancial capital to expand material economic sectors and to green our economies is distributive— the opposite of using fi nancial capital to make more fi -nancial capital, which leads to massive concentrations of wealth and power. In principle, a serious effort to use fi nancial capital to develop the material economy is an opportunity to green those investments— to encourage the development and use of technologies and practices that do not harm the environment.
The greater our capacity to produce wealth has become over the last twenty years (and fi nance has played a critical role here), the more radical the condition of poverty has become. It used to be that being poor meant owning or working a plot of land that did not produce much. Today the 2 billion people living in extreme poverty own nothing but their bodies. The fact is that we have the capacity to feed everybody on the globe, but feeding the poor is not the pri-ority of the most powerful economic actors, so we have more hun-ger than ever before, and hunger is now growing in rich countries as well, notably the United States. Most of us have heard about the abusive conditions under which diamonds are extracted and how those profi ts get rerouted to armed warfare rather than to develop-ment. Fewer know about the circumstances surrounding the mining of rare earth elements, key metals needed for electronic components

148 • E X P U L S I O N S
(notably cell phones), for green batteries, and more. These metals are often mined by unprotected workers who use their naked hands to extract the minerals, live in extreme poverty, and die too young from poisoning to have been able to pass on the news of their abuse to the wider world. Finally, there is the well- established fact that discovering oil in a poor country becomes the formula for the cre-ation of even more poverty and a small elite of the superrich.
We need to change the logics through which we defi ne genuine prosperity. The triple crisis we confront should become an oppor-tunity to re orient our enormous capacities to make capital and to produce what is urgently needed in both the Global South and the Global North.
149
The biosphere’s capacities to renew land, water, and air are remark-able. But they are predicated on specifi c temporalities and life cycles that our technical, chemical, and or gan i za tion al innovations are rapidly outpacing. Industrialized economies have long done dam-age to the biosphere, but in at least some of these cases, and with time on its side, the biosphere has brought land and water back to life. Existing data show that in specifi c zones these sorts of recover-ies have failed, however. We now have vast stretches of land and water that are dead— land overwhelmed by the relentless use of chemicals and water dead from lack of oxygen due to pollution of all sorts. The surge of foreign land acquisitions by governments and fi rms examined in Chapter 2 is one of many sources of this destruc-tion. But the purchases are also partly a response to the crisis: more land and water need to be acquired to replace what has died. And if we take fi nance as a capability, following the analysis in Chap-ter 3, we can see more grist for its mill in the most foundational elements— not only the commodifi cation of land and water, but also the further fi nancializing of the resulting commodities.
The trends described in this chapter point to accelerated histories and geographies of destruction on a scale our planet has not seen before, making substantive the notion of the Anthropocene, the age marked by major human impact on the environment. Many of
CHAPTER 4
Dead Land, Dead Water

150 • E X P U L S I O N S
these destructions of the quality of land, water, and air have hit poor communities particularly hard, producing an estimated 800 million displaced people worldwide. But none of us is immune, as other destructions can reach us all, spread by massive transforma-tions in the atmosphere.
Here I examine extreme conditions. As in the other chapters of this book, this is a partial view that rests on the assumption that extreme conditions makes visible trends that are more diffi cult to apprehend in their milder versions. Most of the land and most of the water on our planet are still alive. But much of it is fragile. Scattered evidence in news media signals that the extent of this fragility may not be widely understood or recognized. For instance, polls suggest that few in the United States seem to know that more than a third of that country’s land, including much of the cherished fertile Midwest, is actually stressed according to scientifi c mea sures. Or that the six major gyres that help keep our ocean currents going have now be-come massive trash zones, full of circling garbage that leads to the asphyxiation of marine life. Or that we have at least 400 clinically dead coastal ocean zones. We made this fragility and these deaths.
We can think of such dead land and dead water as holes in the tissue of the biosphere. I conceive of these holes as sites marked by the expulsion of biospheric elements from their life space, and as the surface expression of deeper subterranean trends that are cutting across the world, regardless of the local politico- economic or ga ni za-tion or mode of environmental destruction. The mix of conditions examined in previous chapters and in this chapter all contribute to these expulsions. Massive demand for land and water, growing poverty, the eviction of fauna and fl ora in order to develop planta-tions and mines, together reposition vast stretches of land as noth-ing more than sites for extraction. In each place there is a specifi c genealogy that explains the outcome. But from a conceptual distance all these different genealogies of destruction become visible as a sort of generic condition: a global multisited array of dead patches of land and water in the tissue of the biosphere.

Dead Land, Dead Water • 151
This multisited space of devastation tells a story about biospheric destruction that is much more than a tale of the individual, specifi c ways in which countries and sectors are destructive. I briefl y invoke a diversity of sites in this chapter to serve the conceptual effort of de-tecting forces that transcend the familiar divisions of our geopo liti cal systems, economic sectors, and regulations. We often overemphasize these familiar differentiations when it comes to biosphere destruction, blaming the specifi c for problems that are generic. I use cases from countries with different forms of po liti cal and economic or ga ni za tion to signal that while environmental destruction may take on specifi c shapes and contents in each country, and may be worse in some than in others, the similarities in destructive capacities are what really mat-ter in my analysis. A mine that pollutes in Rus sia looks different from a mine that pollutes in the United States, but both are polluting above the threshold of the sustainable.
This chapter tries to show the nature and scale of our problems in three major parts: land, water, and global scale- up. The fi rst examines evidence on the degradation of land, attempting to get a global view of sites that are effectively dead. It includes a series of brief incursions into specifi c sites, from the Dominican Republic to Peru and from Rus sia to the United States, marked by acute land toxicity. The second examines water scarcities created by humans, and the increasing num-ber of water bodies that pollution has starved of oxygen. I include a number of cases from around the world that illustrate the specif-ics of scarcity and oxygen depletion. Each of these extreme conditions carries multiple implications for life that depends on the presence of clean land, air, and water. The third part examines some of the most extreme outcomes and scale-ups generated by these practices: the melting of the permafrost, rising temperatures, and massive fl oods.
Land
Not all land degradation is created equal, not all is caused by human action, and not all is accompanied by increased erosion or salinity.
152 • E X P U L S I O N S
There are multiple causes of land degradation, just as there are many types of land. Erosion, desertifi cation, and overuse through monocultures, as in plantations, are critical causes of agricultural land destruction. Climate change has brought heat waves of a kind rarely seen before, affecting agricultural areas across the world and increasingly including places that have been successful food pro-ducers for a very long time. These heat waves and their conse-quences are probably the key source of land degradation in agri-cultural regions. Mining and industrial waste degrade land in a very different way. Here I will focus mostly on the degradations caused by mining and industry, after a brief examination of the cur-rent state of agricultural land.
At its most general, land degradation can be defi ned as “a long- term loss of ecosystem function and productivity caused by distur-bances from which land cannot recover unaided.”1 It is diffi cult to mea sure accurately on a large scale. The few studies that have at-tempted to map the global pro cess estimate that about 40 percent of the world’s agricultural land is seriously degraded. The worst- affected regions are Central America, where 75 percent of agricul-tural land is infertile; Africa, where a fi fth of the soil is degraded; and Asia, where 11 percent has become unsuitable for farming. A recent global examination of land by the World Bank cites the fi nd-ings of several scientists that “if the world warms by 2°C— warming which may be reached in 20 to 30 years— it will cause widespread food shortages, unpre ce dented heat- waves, and more intense cyclones. . . . Today, our world is 0.8°C above pre- industrial levels of the 18th century. We could see a 2°C world in the space of one generation.” The area of land affected by drought has increased over the past fi fty years, and has done so somewhat faster than projected by climate models. For instance, the 2012 drought in the United States affected about 80 percent of agricultural land, mak-ing it the most severe drought since the 1950s. In sub- Saharan Africa, with “warming of less than 2°C by the 2050s, total crop

Dead Land, Dead Water • 153
production could be reduced by 10 percent. For higher levels of warming there are indications that yields may decrease by around 15– 20 percent across all crops and regions” of sub- Saharan Africa. A warming of 3°C is estimated to reduce savannas from “a quarter at present to approximately one- seventh of total current land area.”
Some more detail about the evolution of land degradation can be found in two major earlier studies executed between 1997 and 2008 and covering just about all countries in the world.2 The Global Assessment of Human- Induced Soil Degradation produced a map of degradation between 1950 and 1997 based on expert opinion guided by standardized qualitative guidelines; this method-ology is considered to have limited replicability, and such maps will be accurate for a relatively brief period of time given ongoing deg-radation. But it captures the condition of one par tic u lar period.
The second, by Bai, Dent, Olsson, and Schaepman, used twenty- three years’ worth of data from the remotely sensed Normalized Difference Vegetation Index, generated mostly by satellite obser-vation of green vegetation.3 The index mea sures the amount of light spectrum absorbed by photosynthesis, adjusted for rain use effi ciency, to create a proxy for net primary productivity that can be tracked over time. Overall, researchers estimate (with diverse adjustments for par tic u lar variables) that 24 percent of global land area suffered degradation between 1981 and 2003. In addi-tion to the overall fi ndings, these results have been validated em-pirically in several very diverse places— northern China, Kenya, and Bangladesh.
Over the past few years, heat waves have become the main source of agricultural land degradation, with all this entails for the global food supply, particularly for the poor.4 Based on studies of specifi c heat waves around the world, the World Bank fi nds that the past de cade has seen extreme heat waves with major societal impacts. Other researchers report that “these events were highly unusual with monthly and seasonal temperatures typically more
154 • E X P U L S I O N S
than 3 standard deviations (sigma) warmer than the local mean temperature—so- called 3- sigma events. Without climate change, such 3- sigma events would be expected to occur only once in several hundreds of years.”5
Heat waves can lead to a variety of problems.6 A decline in pre-cipitation, for instance, is the major issue in some areas. Extreme cases include southern Africa, where annual precipitation “is pro-jected to decrease by up to 30 percent under 4°C warming . . . and parts of southern and west Africa [will see] decreases in ground-water recharge rates of 50– 70 percent.” Worldwide, warming of 1.2°C– 1.9°C by 2050 would increase the proportion of the popu-lation that is undernourished by 25– 90 percent compared to the present. In South Asia, such an increase would require a doubling of food imports to meet per capita calorie demand. “Decreasing food availability is related to signifi cant health problems for af-fected populations, including childhood stunting, which is projected to increase by 35 percent compared to a scenario without climate change by 2050.”
The facts about these increased temperatures and their causes have been convincingly established. On the facts, the Fourth Assess-ment Report of the Intergovernmental Panel on Climate Change (IPCC) found that the rise in global mean temperature and warm-ing of the climate system were “unequivocal.” Furthermore, “most of the observed increase in global average temperature since the mid- 20th century is very likely due to the observed increase in an-thropogenic green house gas concentrations.” Recent work rein-forces this conclusion. Global mean warming is now approximately 0.8°C above preindustrial levels. Further, in the absence of human activity during the past fi fty years “the sum of solar and volcanic forces would likely have produced cooling, not warming.”7
Recent studies have shown that extreme summer temperatures can now largely be attributed to climatic warming since the 1960s.8 In the 1960s, summertime heat extremes (more than three standard

Dead Land, Dead Water • 155
deviations warmer than the mean of the climate) were practically absent, affecting less than 1 percent of the earth’s surface. The af-fected area increased to 4– 5 percent by 2006– 2008, and by 2009– 2011 such extremes occurred on 6– 13 percent of the land surface. Now such extremely hot outliers typically cover about 10 percent of the land area.
Industrial Waste: Its Variable Mechanisms
Beyond the gradual degradation of agricultural land, there are pro-cesses that cause extreme destruction to land of all sorts. Mining and manufacturing are the most obvious culprits in much of the world. Their capacity to kill land is enormous; it is particularly hard for land to recover from the type of degradation they create. Consider, for instance, that much of the estimated 1 billion tonnes of industrial waste produced by OECD countries in 2001 still lives with us more than ten years later. And industry produces more waste than that produced by agriculture, forestry, and power production combined.9
In suffi cient concentrations, industrial waste, including heavy metals and green house gases, can render an environment so toxic that plants cease to grow and even people become sterile. Some heavy metals (a misnomer, as this category includes some elements that are neither heavy nor metals) are vital to human health in con-trolled amounts, such as iron and zinc. Others, such as mercury and lead, are toxic at any level. However, the output of waste generated by modern industry is so massive it can render even a benign sub-stance such as carbon dioxide toxic.
I present here a range of concentrated situations that make visi-ble the worst types of poisoning and destruction of people and land. But we should remember that the real problem is the vast accumulation of less extreme cases that pile up with less negative publicity day after day.
156 • E X P U L S I O N S
Norilsk, Rus sia
The city of Norilsk, Rus sia, was founded in 1935 as Norillag, a Soviet labor camp that came to serve one of the largest mining operations in the Soviet Union.10 The prisoner population grew steadily from 10,000 in 1936 to 90,000 in 1953, at which time the Norilsk camp held more than a third of the Soviet Union’s total prisoner population. It has ever since remained a massive vector for environmental destruction, poisoning land, water, and air. Impor-tant for my argument is that it has done so under a series of highly varied po liti cal and economic regimes, from the Soviet Union of the 1930s to that of the 1960s, through the privatization of the 1980s, and back to state control after 2000.
Located north of the Arctic Circle in Siberia, Norilsk is home to the world’s largest nickel smelting complex; it also produces sig-nifi cant amounts of platinum, palladium, and cobalt. The publicly traded MMC Norilsk Nickel is Rus sia’s leading producer of non-ferrous and platinum- group metals. It controls one- third of the world’s nickel deposits and accounts for 20 percent of global nickel production, 50 percent of palladium, 20 percent of platinum, 10 percent of cobalt, and 3 percent of the world’s copper output. In-tensive metal production has continued to rely largely on outdated technology. The Blacksmith Institute estimates that in 2007 almost 1,000 tons of copper and nickel compounds were released into the air annually, along with 2 million tons of sulfur dioxide; in 1999, elevated copper and nickel concentrations were found in soils up to a 60- kilometer radius around Norilsk. Norilsk has become a toxic city, “where the snow is black, the air tastes of sulfur and the life expectancy for factory workers is 10 years below the Rus sian aver-age,” which is already low.
The local population has been severely affected by pollution: heavy metals suppress the immune system, and overall illness rates in the Norilsk industrial zone are 27.6 percent higher than in con-

Dead Land, Dead Water • 157
trol areas with identical climate and geography. Respiratory dis-eases among children occurred 150 percent more often than aver-age in Rus sian cities. Lung cancer rates among men have been found to be elevated, and children in Norilsk are almost twice as likely to develop some kind of cancer than other Rus sian children. Women in the industrial zone give birth to children with an average weight of 3,000 grams, as compared to an average weight of 3,430 grams in unpolluted areas, and pregnancies are more likely to be complicated. In 2007 15,000 residents of the Norilsk industrial zone signed a letter to the Rus sian State Duma, expressing their concern over the impact of pollution on health: “The presence in atmospheric pollution of heavy metals leads to a drop in the im-munity of city residents, which is so vital in our climactic condi-tions . . . we are falling sick and dying.”11
The deposits of nickel and copper ore in Siberia’s Taimyr Penin-sula have been known since the 1600s. But industrial production was not undertaken until 1935, when the Council of People’s Com-missars of the Soviet Union passed a resolution titled “On Building the Norilsk Combine” and placed the project under the control of the NKVD security ser vice. The project was considered of the high-est priority and overseen directly by the head of the gulag system to ensure a workforce in that remote area. The demands of rapid in-dustrialization and militarization touched off by World War II could not be met with forced labor alone. In 1941 the labor camp became integrated and 3,734 free laborers joined the workforce; by 1949 20,930 free laborers composed nearly a third of the produc-tion force. By 1953, when Norilsk was granted township status and removed from the direct control of the NKVD, the metallurgical combine was producing 35 percent of the Soviet Union’s nickel, 12 percent of its copper, 30 percent of its cobalt, and 90 percent of its platinum- group metals.12
The transition from Soviet state own ership and command pro-duction to capitalist private own ership and market productions did

158 • E X P U L S I O N S
not substantially decrease the velocity with which land, air, and water were destroyed. Between the fall of the Soviet Union in 1989 and 2003, Norilsk’s production of sulfur dioxide increased as a proportion of Rus sia’s total output. The Soviet- era infrastructure, built between 1930 and the late 1970s with absolutely no consider-ation of ecological impact, is still the backbone of the plant. Private own ership groups have shifted emphasis from raw production to economic effi ciency and profi tability, but they have maintained the policy of not bothering with massive toxicity. It is considered an inevitable by- product of industrial production. In a 2005 interview in Golovnina, Norilsk’s deputy director general, Zhak Rozenberg, said:
We were set up at a time when . . . there was no ecological ideology, when the Soviet Union had an entirely different agenda. . . . As a global company we certainly have to accept global standards. That’s why we are introducing international technology at our facilities. But one can’t force us to drop everything else and achieve that over-night . . . Ecological problems are not ecological problems as such. They come as a result of unsatisfactory technology. We are looking for ways of improving that technology which would allow us— and that’s a dream— to produce so little [sulfur] dioxide as to be harm-less for the environment. . . . Ecological and economic projects have to be harmonized. Otherwise we might as well return to the stone age, sit by a crystal clear river all day, eat absolutely ecologically clean fi sh, and that would be it.
To bring some perspective, it is worth adding that what may sound like an extreme statement, the sort that could only come from a company with brutal roots in a totalitarian regime and a mining workforce originating in forced labor camps, is echoed in the United States when it comes to mining of all sorts, as the case of the Zortman- Landusky mining operation (discussed in the next section) illustrates. Rus sia and the United States have very

Dead Land, Dead Water • 159
different histories and forms of economic or ga ni za tion. But let’s recall just one familiar case: in the United States, 40 percent of damaging emissions today are from dirty coal plants— no minor share, since the United States accounts for 14 percent of global emissions.13
Zortman- Landusky, United States
The trajectory of the U.S. mining fi rm Zortman- Landusky evokes a similar set of abuses across different periods and geographies. The po liti cal economies are different from those in Rus sia, yet they too enabled a set of major abuses over time, and through different in-carnations of this fi rm.
In 1974, Frank Duval founded the Pegasus Gold Corporation. At the heart of the venture was a proprietary mining technique called cyanide heap leaching, capable of extracting trace amounts of gold from spent ore at sites that were no longer productive for conven-tional mining. Pegasus Gold debuted this technique at previously abandoned gold and silver mines on the Fort Belknap Reservation in Montana. The company ran the mines profi tably for nearly thirty years before falling gold prices and mounting ecological liabilities led to a bankruptcy and corporate reor ga ni za tion, leaving the State of Montana with more than $30 million in environmental reclama-tion costs for “perpetual” water treatment. This sort of severe eco-logical degradation and the discharge of associated costs through corporate restructuring is the rule, rather than the exception, for this kind of resource extraction: Frank Duval went on from the Pegasus Gold catastrophe to operate many other mines, includ-ing Superfund sites. He was at no point liable for environmental damage.
The Zortman- Landusky gold deposits were discovered in the late nineteenth century on reservation lands of the Assiniboine and Gros Ventre peoples in Montana’s Little Rocky Mountains. In

160 • E X P U L S I O N S
1895, faced with imminent starvation, the tribes signed the Grin-nell Agreement to sell the land to the U.S. government. Mining ac-tivity grew rapidly until the 1920s, when yields began decreasing steadily; most claims were abandoned by 1959. Pegasus Gold be-gan operating at the site in 1977. Its technique of cyanide heap leaching proved to be incredibly successful. The pro cess is usually conducted on ore with a gold concentration of up to 11.3 grams of gold per ton. It can be used to pro cess huge quantities of spent or low- quality ore to profi tably produce a relatively small amount of gold: in 1989 at Carlin Trend mine in Nevada, about 105,000 kg of gold were recovered from cyanide- leaching 129.8 million tonnes of ore. The scale on which Pegasus Gold operated is astounding. A 1994 U.S. Environmental Protection Agency (EPA) report noted that in 1994 it pro cessed “75,000 tons of ore a day . . . [while] heaps and tailings cover[ed] 175 acres and contain[ed] 60 million tons of material.”14
In the heap- leaching pro cess, ore is deposited in stages, or “lifts,” onto a clay, asphalt, or plastic liner. It is then treated with a solution as strong as 454 g of sodium cyanide per ton of water, powerful enough to dissolve microscopic traces of gold. The cyanide solution then seeps down the mountainside until it collects in pools at the bottom of the heap of ore, having dissolved and bonded with gold as it fl ows through the ore. After it is collected in the “pregnant pools” at the bottom (so called because the solution has absorbed gold), the solution is pumped through a special pro cessing center to reclaim the gold.
Cyanide is regularly used in a variety of industrial pro cesses, and it is considered safe to use because it rapidly degrades and does not bioaccumulate. However, cyanide is a powerful asphyxiate (so called because it easily replaces oxygen in many chemical reactions), highly poisonous, and highly reactive. Cyanide spillage was a chronic problem at Zortman- Landusky. In 1982, 2,953 liters of cyanide- laced water leaked from a containment pond, and in a separate

Dead Land, Dead Water • 161
accident a ruptured pipe leaked 196,841 liters of cyanide solution. Eight different cyanide spills occurred between 1983 and 1984, and in 1986 the company, lacking a disposal permit, released 75 million liters of cyanide solution when a containment pond threat-ened to overfl ow. Following some spills, the local water showed elevated levels of cyanide and could not be used, and wildlife die- offs occurred.
Cyanide compounds and acidic mine drainage water have se-verely impacted the water supply of the Fort Belknap Reserva-tion. Just as cyanide releases gold from ore, it can free toxic met-als such as cadmium, selenium, lead, and mercury. If not properly contained, the tons of solution applied to ore heaps can form a toxic slurry of active cyanide, heavy metals, and sulfuric acid that can continue to drain into the local water table for centuries. Acidic drainage water became a major problem: in 2001, three years after the mine stopped operating, water from the Swift Gulch tributary to the Little Bighorn River had a pH of 3.7, roughly the same acidity as apple juice or wine. Members of the local commu-nity and environmental organizations eventually fi led suit under the Clean Water Act, and Pegasus Gold was ordered to post a bond for $36 million in 1996. After paying out more than $5 million in executive bonuses, and despite having taken $300 mil-lion worth of gold out of the mines, Pegasus declared bankruptcy in 1998 and left the state of Montana with cleanup costs of $33 million beyond the settlement. After bankruptcy, the company re- formed as Apollo Gold and continued to operate Pegasus’s profi t-able holdings with many of the same directors and executives in place.15
Found er Frank Duval had left the company earlier, in 1987, after he had accepted sanctions from the Securities and Exchange Commission (SEC). This, the third action against Duval by the SEC, was for failing to disclose a fi nancial stake he held in a company that Pegasus Gold had bought. This is a violation of
162 • E X P U L S I O N S
antifraud provisions and numerous reporting requirements of the 1934 Securities Exchange Act. Duval quickly became involved in a series of mine reclamation projects that had similarities with Zortman- Landusky: he sought out either exhausted mines or claims that had proved technically diffi cult, promised great re-sults from untested technology, and left a large mess for the state and federal governments after discharging responsibility through bankruptcy.
After leaving Pegasus, Duval launched Bunker Hill Mining and restarted silver production at a section of the Crescent Mine, a seventy- two- year- old mine that had been idle for four years. Duval and his partners were able to raise $10 million on the Vancouver and Toronto stock exchanges, reported profi table quarters in Q3 1989 and Q1 1990, and promptly declared bankruptcy in January 1991. The mine was located in a previously existing Superfund site, Idaho’s Silver Valley, but Bunker Hill Mining did not invest signifi -cantly in environmental remediation. Indeed, it did not even pay taxes or its employees: at the time of bankruptcy, Bunker Hill Min-ing had never paid property tax, owed Shoshone County approxi-mately $2 million, and owed workers back wages of $90,000. The company sought bankruptcy protection only weeks after issuing a strong quarterly earnings report, leading to allegations of fraud and misleading investors.16
Duval also owns and oversees one of the most toxic mining sites in the United States, Midnite Mine in Ford, Washington, a major uranium mine located on the Spokane Indian Reservation. In 2006, the Offi ce of Environmental Cleanup reported that Midnite Mines Inc. controlled a 49 percent interest in Dawn Mining, the operating company of the Midnite Mine; the other 51 percent was controlled by giant mining conglomerate Newmont Mining through its wholly owned subsidiary Newmont USA Limited. Production at the mine stopped in 1981, when uranium prices dropped sharply: sensing an opportunity to pick up a potentially valuable asset on the cheap,
Dead Land, Dead Water • 163
Duval bought a majority position of Midnite Mines Inc. and be-came president and CEO in 1984.
Unfortunately for Duval, the Washington Department of Health decided the mine was a threat to public safety and terminated Dawn Mining’s lease in 1991. The company was then, due to its li-censing agreement, required to reclaim the site, which contained 33 million tons of radioactive mine tailings distributed over about 40 hectares of exposed uranium ore, and radioactive mine seepage into the Spokane River. At this point, Dawn Mining declared that it did not have “suffi cient funds to pay for the reclamation plan it proposed, for any alternate plan, or for the closure of its mill,” as reported by its own er, Newmont Mining. Dawn proposed instead turning the Mid-nite Mine site into a radioactive waste facility, importing low- level radioactive refuse from around the country and using the fees gener-ated to clean up the site. This proposal was soundly rejected. In 2000, the Midnite Mine offi cially became a Superfund site. And in 2001, Duval’s Sterling Mining received permission to develop a mine in Montana that overlaps with both the Cabinet Mountain Wilder-ness Area and the Kootenai National Forest.17
As they did in these cases, corporate structures and bankruptcy laws work together to severely limit the power of local claims. Well- structured subsidiaries function to limit losses to the amount that a parent company invested in such auxiliaries but place no such ceiling on profi ts. Despite the fact that Newmont was a very wealthy multinational and, as the majority shareholder, had ap-pointed board members, shared offi ce space, and guaranteed loans for Dawn Mining, Newmont had a strong legal argument that it was not liable for its subsidiary. Newmont dug in its heels for a drawn- out legal battle. However, Boston Common Asset Management fi led a shareholder resolution criticizing Newmont’s disclosure of environmental liability, increasing pressure on the company. More-over, with annual net income of $2.2 billion in 2011 and $1.9 bil-lion in 2010, the $153 million called for in the settlement with the

164 • E X P U L S I O N S
EPA amounted to a mere 7 percent of 2011 earnings. For what ever the comparison is worth, the U.S. Department of the Interior’s con-tribution of $42 million would make up 21 percent of the total site funding: if Newmont had been forced to pay 21 percent of its 2011 profi t, it would have had to pay $462 million. One of Duval’s mining companies had gone broke yet again, but it was structured in such a way that he could abandon it with neither diffi culty nor liability.
In what is a many- decades- long sequence of violations and exits, Frank Duval did not use his personal assets to pay fi nes, but simply let a company go bankrupt and start a new one.
Times Beach, Missouri
The 480- acre Times Beach site is located 27 kilometers west of St. Louis. In 1970, the incorporated city was home to about 1,200 people, including the residents of several mobile home parks. City funds were insuffi cient to pave local roads, and dust from unpaved roads was considered a constant problem. In 1972 and 1973, the Russell Bliss waste- oil company was contracted to spray oil on city roads as a means of dust abatement. Former residents recall the roads immediately turning purple, terrible odors, and signifi cant wildlife die- offs. The EPA eventually determined that the waste oil was severely contaminated with dioxins, a group of per sis tent envi-ronmental pollutants that, according to the World Health Or ga ni-za tion, “are highly toxic and can cause reproductive and devel-opmental problems, damage the immune system, interfere with hormones and also cause cancer.” The town was fl ooded by the nearby Meramec River while the EPA was in the pro cess of con-ducting tests, and the toxic dioxins were distributed over the entire city. In 1982, the EPA recommended that all residents be perma-nently relocated. The Federal Emergency Management Agency took over the site and the relocation pro cess, and by the end of 1986, Times Beach was a ghost town.18

Dead Land, Dead Water • 165
Sumgayit, Azerbaijan
Sumgayit is located 30 kilometers north of Azerbaijan’s capital, Baku, on the Caspian coast. The city, once a model development of the Soviet industrial economy, housed factories manufacturing industrial and agricultural chemicals, including synthetic rubber, chlorine, aluminum, detergents, and pesticides. During the Soviet heyday, between 70,000 and 120,000 tons of emissions were re-leased into the air annually; in the 1990s, the still functioning facto-ries produced an estimated 600 million cubic meters of polluted wa-ter annually. Today, with only 10– 15 percent of the old factories still in production, annual water pollution has been reduced to about 100 cubic meters. Untreated industrial sludge and sewage, contaminated with mercury and by- products of the chlor- alkali industry, are still dumped haphazardly.
The city once had the Soviet Union’s highest rates of infant mor-tality and cancer, and contemporary cancer rates remain elevated at 22– 51 percent above the national averages. People who live in the city or work in the remaining factories have been exposed to severe toxins for de cades. And this exposure will continue due to a lack of infrastructure for pollution control, the preponderance of outdated technology, and the low emphasis on occupational safety.19
Lead Contamination
Lead, a common industrial material, is extremely toxic. Exposure to lead can cause damage to the kidneys, the ner vous system, and the brain, as well as induce seizures, coma, and death. Additionally, lead can be stored in bone tissue for de cades and can be a threat to unborn children long after a mother’s exposure. It is a very stable element and degrades little over time; 90 percent of lead dust in surface soil will still be present seventy years after contamination, according to the Illinois Department of Public Health. Blacksmith

166 • E X P U L S I O N S
Institute estimates that in 2011, nearly 18 million people world-wide were exposed to harmful levels of lead.20 Figure 4.1 shows a global overview of known lead pollution.
Any pro cess that involves lead can be dangerous. Lead smelting, the extraction of lead from mined ore or its recovery from recycled materials through a hot air combustion pro cess, can release large amounts of lead dust and sulfur into the air, if not properly treated, and generates signifi cant amounts of toxic slag leftovers. Informal battery recycling is another key vector for lead pollution. Used lead- acid batteries (particularly car batteries) are imported in bulk into developing countries, where they are broken up manually and the lead is extracted for resale. Much of this work is done in the home or at informal factories without safety equipment, and the risk of exposure to lead particulate and battery acid is high. Among the workers involved in battery recycling are children.21
FIGURE 4.1 Population at Risk from Lead Pollution from Lead Smelters, 2012Source: Blacksmith Institute 2011d.

Dead Land, Dead Water • 167
Haina, Dominican Republic
Bajos de Haina is located on the coast of the Dominican Republic, about 32 km from the capital, Santo Domingo. Initially an indus-trial zone home to several battery recyclers and gasoline refi neries, it is today inhabited by more than 80,000 people, the majority of whom are affected by the legacy of industrial pollution. The last battery recycler was closed in 1997, after local activists attracted the attention of an or ga ni za tion called the Friends of Lead Free Children.
The MetaloXa Company operated a battery recycling and lead smelting plant in Haina from 1979 to 1997. When Stephen Null, director of Friends of Lead Free Children, visited the plant in 1996, he found the 45- hectare industrial lot covered in 30- foot piles of used batteries and a lead smelter, operating twenty- four hours a day, surrounded by homes. Initial testing of plant employees found that many had a blood lead level over 300 μg/dL, more than twice the amount of exposure necessary to trigger brain swelling and cause serious damage. After expanded testing showed that 91 per-cent of children had lead poisoning (the average blood level was more than seven times the internationally recognized 10 μg/dL threshold), the plant was forced to shut down. MetaloXa moved its smelting operation in 1997, and in 1999 the Dominican govern-ment announced that the site had been cleaned up; however, lead levels in children remained dangerously high and soil samples re-covered by researchers still registered nearly 50 percent lead. This is an extremely high level. Indeed, it is the most heavily lead- polluted site known in the world, with lead soils as high as 463,970 ppm.22 Null found that the company’s “cleanup,” apparently given the go- ahead by the government, amounted to burying the remaining bat-teries at the site and installing a metal door to keep people out. Excavation of the battery plant in 2008 and 2009 removed nearly 6,000 cubic meters of toxic material. The Blacksmith Institute reports
168 • E X P U L S I O N S
that average blood levels of lead declined from 71 μg/dL in 1997 to 28 μg/dL in 2009; but these 2009 levels of lead remain nearly three times higher than the accepted threshold for lead poisoning in children.23
La Oroya, Peru
La Oroya is a mining town of more than 30,000 people in the cen-tral highlands of Peru. It is home to what was the highest- elevation standard- gauge railroad in the world from 1893, when the Lima- Huancavelica line was completed, until the Qinghai- Tibet Railway was inaugurated in 2006. Mining expanded in 1922 when the U.S.- owned Cerro de Pasco Copper Corporation built a smelting and re-fi nery complex it described as “especially designed to pro cess the polymetallic ore typical of the central Andes.” The mining complex was nationalized in 1974 by the military dictatorship of General Velasco Alvara and administered by the Peruvian government until it was privatized and purchased at auction by the Doe Run Company in 1997. Under the new own ership, annual production capacity reached 77,000 tons of copper, 134,000 tons of lead, 50,000 tons of zinc, 1.15 million kg (37 million troy ounces) of silver, and 2,000 kg (64,000 troy ounces) of gold.24
Serious public health problems emerged soon after the transac-tion was completed. In 1999, the Peruvian Ministry of Health found that 99.1 percent of the children in La Oroya suffered from lead poisoning and that 20 percent of those cases were criti-cal. Further testing by the St. Louis University School of Public Health found elevated levels of other heavy metal pollutants in the blood of residents: cadmium levels registered at three times the U.S. average, antimony levels were thirty times the U.S. aver-age, and arsenic levels were twice that of the control site. La Oroya was confi rmed to be one of the most toxic sites in the
Dead Land, Dead Water • 169
Western Hemi sphere. The pressure on Doe Run became enor-mous, and despite spending more than $316 million on environ-mental upgrades (roughly triple the amount agreed on with the Peruvian Ministry of Energy and Mines), heavy metal emissions remained toxically high; a 2005 study showed that 97 percent of children under the age of six had elevated levels of lead in their blood.25
In 2009, in the wake of declines in commodity prices and contin-ued environmental problems, Doe Run Peru halted production. A year later, with no date for the restart of production, 3,500 em-ployees held protests and blocked access to a critical highway. Al-though acutely aware of the environmental and health problems that plagued their community due to the mining complex, em-ployees could no longer make do without work. Most people in La Oroya, facing a choice between wages and toxicity, want the smelter reopened after the installation of adequate environmental controls. Currently, creditors are running the mining complex as part of an operational liquidation and are in the pro cess of selling off assets. It is unknown when the plant will return to full capacity, or under what environmental protocol.26
Chromium Contamination
Chromium, like lead, is present in large amounts during some in-dustrial pro cesses. Also like lead, concentrated chromium by- products are highly toxic. Hexavalent chromium causes asthma, diarrhea, intestinal bleeding, and kidney and liver damage, and it is a powerful carcinogen. It is estimated that high levels of chromium threaten the health of 1.8 million people across the globe.
The leather tanning industry is a large producer of industrial chromium by- products. Low- and middle- income countries have successfully entered the tanning industry: since 1970 their share
170 • E X P U L S I O N S
of the global heavy leather industry has grown from 26 percent to 56 percent and their share of the light leather industry from 35 percent to 56 percent. Globally, the tannery business has ex-panded among disadvantaged communities. These are likely to be without suffi cient regulatory or industrial infrastructure. Further, the or ga ni za tion of the industry at the local level in developing countries creates synergies that can vastly intensify the effects of pollution. In such regions, tannery industries frequently consist of clusters of small and medium- sized enterprises (SMEs) that concentrate in marginal sections of urban areas to gain access to, among other things, large pools of unskilled laborers willing to take on dirty, toxic work that in many cultures is stigmatized.
Ready access to high- quality water is also a factor in the loca-tion of these clusters because the tanning pro cess involves repeat-edly soaking hides in chemical baths and then wringing out the wastewater. Many of the small businesses lack access to adequate treatment facilities and cannot afford to either store or pro cess the toxic effl uvium. Often the waste is simply released into the street. The location of these businesses near a quality water source means that chromium and other by- products quickly make their way into the water supply, while the clustering of SMEs produces a concentration of pollutants that can overwhelm the natural environment’s buffers and result in bioactive chemi-cal levels.
Further, these businesses are located in marginalized neighbor-hoods largely separated from the residences of the affl uent or infl u-ential; the people most exposed to these toxins are the stigmatized tannery workers and their families. The amounts of waste gener-ated by these tannery clusters can be im mense: a large agglomera-tion in Bangladesh included roughly 200 tanneries and produced an estimated 7.7 million liters of wastewater and 88 million tons of solid waste a year, according to the Blacksmith Institute.27 Figure 4.2
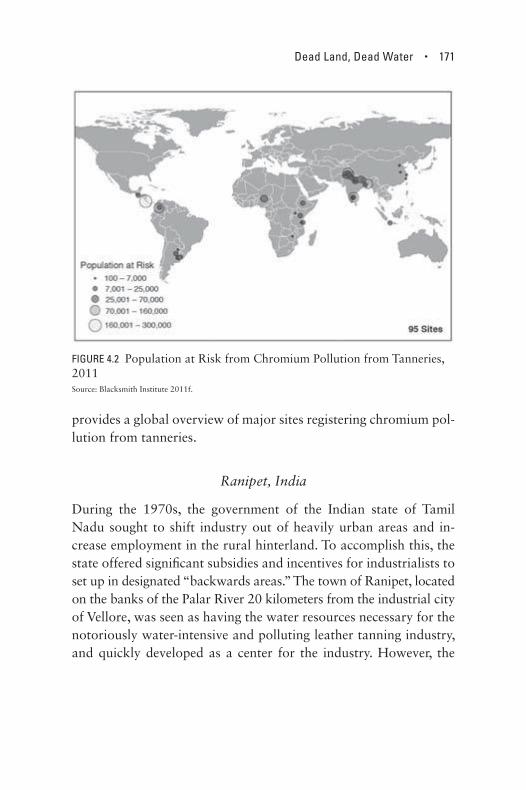
Dead Land, Dead Water • 171
provides a global overview of major sites registering chromium pol-lution from tanneries.
Ranipet, India
During the 1970s, the government of the Indian state of Tamil Nadu sought to shift industry out of heavily urban areas and in-crease employment in the rural hinterland. To accomplish this, the state offered signifi cant subsidies and incentives for industrialists to set up in designated “backwards areas.” The town of Ranipet, located on the banks of the Palar River 20 kilometers from the industrial city of Vellore, was seen as having the water resources necessary for the notoriously water- intensive and polluting leather tanning industry, and quickly developed as a center for the industry. However, the
FIGURE 4.2 Population at Risk from Chromium Pollution from Tanneries, 2011Source: Blacksmith Institute 2011f.
172 • E X P U L S I O N S
growth of the industry overwhelmed the water supply, and the town now suffers from acute pollution from tannery waste, includ-ing hexavalent chromium and azodyes.
Today, Ranipet is home to more than 50,000 people and is still a center of the leather goods industry. There is a preponderance of small leather producers operating facilities without the economies of scale necessary to afford proper waste disposal systems. Added to the general lack of awareness of environmental issues, the result over four de cades is contaminated groundwater. In 2001 the town’s 60 tanneries employed 10,000 people to produce 100,000 kilo-grams of leather products daily. But there were only seven individ-ual effl uent treatment plants and one public treatment plant to pro-cess the industry’s waste. By 2009, there were an additional 180 tanneries, but still only one public waste treatment plant. This sharp expansion is partly explained by the fact that Ranipet is not an isolated town; it is an industrial suburb located about 20 kilome-ters from the city of Vellore. This city has the largest leather export industry in India— a district the size of Oregon, it has 5 million people, of whom 2.5 million, including children, work in some as-pect of the leather trade.
It is safe to assume that that there has been a massive increase in waste and that the majority of it is improperly disposed of. In 2009, the town government estimated that more than half of all solid waste went uncollected, and that none of the solid waste that was collected was disposed of properly. The state pollution control board estimates that a single factory producing tanning com-pounds would have accumulated more than 1.5 million tons of improperly stored solid waste after two de cades of operation. Farmers complain that 80 percent of their crops fail and that irriga-tion water causes rashes and blisters on their skin. Most concerning is that the unabated pollution of the Palar River now threatens the water supplies of larger cities downstream, including that of the 3.5 million people in Vellore.28
Dead Land, Dead Water • 173
Mining/Resource Extraction
Hard rock mining and extraction industries play a signifi cant role in wide- ranging territorial degradation and in the making of dead land. Researchers estimate that for the 2000s “at least ten billion tons per year on a dry basis of fi ne particle waste [not including liquid refuse] is produced by this industry worldwide. Arguably then the minerals industry is the largest producer of waste in the world.” Other sources report that in the United States, mining is “less than one tenth of one percent of gross domestic product” but produces pollution and consumes energy at disproportionately higher levels. In 2001 it was estimated that mining in OECD countries produced 550 million tons of solid waste. Because most signifi cant mining op-erations are located in the developing world, the total amount of global mining waste is likely to dwarf the OECD numbers.
Throughout most of the world, standard industry waste manage-ment practice is “to recycle solid waste as fi ll back into the mine and to pump low- concentration liquid waste products known as ‘tailings’ into gigantic manmade reservoirs.” Both the tailings and solid waste produced by mining can seriously damage local envi-ronments. Metal ores generally have signifi cant levels of heavy met-als that are chemically similar to the target material and arranged in similar formulations (oxides or sulfi tes, for example); when ores are pro cessed to remove the target mineral, large amounts of unde-sirable heavy metals are also released into the environment. For in-stance, the National Wildlife Federation fi nds that 40 percent of the watersheds in the western United States are contaminated by pollu-tion from hard rock mines. The pollution lasts long after the mine closes down: a typical hard rock mine may exhaust profi table ma-terial in fi ve to fi fteen years, but contaminants can continue to leach into the environment at accelerated rates for hundreds of years. Standard hard rock mining by- products can have disastrous effects if not properly handled. The tailings are full of heavy metal toxins,
174 • E X P U L S I O N S
and crushed rubble used as fi ll or gravel in and around the mine (or dumped directly into the local water, what ever the case may be) is capable of oxidizing to produce highly acidic runoff.
Nor does low- tech mining spare the environment. For instance, artisanal gold mines are generally informal and rather small- scale operations. Sediment from gold- rich soils is collected from either pit or surface mining operations, usually with little more than a shovel. The sediment is then treated directly with mercury, which bonds to gold ore. After the mercury- gold amalgam has been iso-lated from the debris, it is heated and the mercury vaporizes, leav-ing behind pure gold. This low- tech mining creates negligible amounts of rock waste or traditional mine effl uvium; however, it is estimated that this method is responsible for one- third of the global annual release of mercury into the environment, while the chemicals used for pro cessing are likely to be mishandled, spilled, or accidentally ingested.29
Hydraulic Fracturing
Hydraulic fracturing, or “fracking,” refers to the pro cess of inject-ing water, chemicals, and silica sand into impermeable rock at high pressure in order to release hydrocarbons (usually natural gas) for fuel. The pro cess uses vast amounts of water and introduces mining chemicals and hydrocarbons into local water tables. Its extreme water usage and poisonous emissions make it highly destructive of the environment. It is worth noting that we are beginning to see bans on fracking because of its damaging consequences: hydraulic fracturing has been banned in France, South Africa, and the prov-inces of New South Wales in Australia and Quebec in Canada due to environmental and health concerns.30
A typical fracking site uses between 4 million to 20 million liters of water over its lifetime. All told, fracking and other types of min-ing accounted for between 1 and 2 percent of the United States’

Dead Land, Dead Water • 175
non- thermoelectric water consumption in the early 2000s. But frack-ing has expanded rapidly since then. In one Colorado county, frack-ing accounts for between one- third and two- thirds of total water consumption: “A report in March from the Colorado Oil & Gas Conservation Commission (COGCC), which regulates energy de-velopment in the state, said that water used for fracking in Colo-rado totaled about 13,900 acre feet in 2010, and is expected to rise 35 percent to about 18,700 acre feet in 2015.”
Perhaps the major threat posed by fracking, however, is the type of damage it does to water supplies. The water used in fracking frequently becomes mixed with hydrocarbons or mining debris and chemicals. Chemicals used in a fracking site include ammonia and boric acid, sulfuric acid, trimethyloctadecylammonium chloride, and potassium chloride. Furthermore, 10 to 40 percent of all water used in fracking fl ows back to the surface, where it is either segregated in toxic waste ponds or seeps back into the water table. Water pollution also occurs when natural gas released from impermeable rock seeps into water wells and reservoirs.
These impacts are set to grow and to affect more and more areas of the world as the practice of fracking increases. It should be noted that much of the information provided by the industry itself pres-ents hydraulic fracturing as a well- established, traditional method. But this is misleading. Despite industry claims of sixty years of ex-perience, the specifi c type of fracking used today is relatively new. These recently developed methods of hydraulic fracturing incorpo-rate a horizontal drilling technique that uses more water and pro-duces more natural gas. It also creates water pressure fi fty to a hun-dred times greater than found in earlier wells.31
RadioactivityA recently released report by Melissa Belcher and Marvin Renikoff for the FreshWater Accountability Project in Ohio examined the effects of fracking in context of the known radioactive properties

176 • E X P U L S I O N S
of the Marcellus Shale stratum. This is an area of natural gas pro-duction that stretches from West Virginia to eastern Ohio and south-ern New York, with high concentrations of radium, uranium, and thorium isotopes that emit radiation as much as thirty times greater than standard background emissions. This raises two important questions: how much radiation is released to the surface during fracking, and how is the industry disposing of radioactive waste? In 2013, the New York State Department of Environmental Conserva-tion found that fl ow- back water from wells contained radioactivity “as high as 267 times the limit for discharge into the environment and thousands of times the limit for drinking water.” It takes mas-sive amounts of water to drill the Marcellus Shale: between ap-proximately 7.5 and 30 million liters of water are used in each fracking event, and wells may need to be fracked multiple times over their life span. Between 65 percent and 95 percent of this wa-ter is usually returned to the surface during drilling, raising serious concerns about how this radioactive wastewater is treated.
Drilling a standard natural gas well in the Marcellus produces, on average, about 117 cubic meters of radioactive debris: it is esti-mated that Pennsylvania alone has produced more than 1 million cubic meters of such waste. While most landfi lls in Pennsylvania are not equipped with radiation alarms, those that are reported that detectors went off a total of 1,325 times in 2012, with more than 1,000 of those alarms caused by drilling waste. Drilling waste trans-ported to Ohio for disposal has been found to contain levels of ra-dium thirty- six times the regulatory limit. Improper disposal of such material would be a major cost savings for drilling companies: the prices for proper disposal of radioactive waste can be as much as $12,350 per cubic meter.32
Water TableGiven its rapid growth over the last few years, fracking increasingly presents a threat to the water tables, in terms of both consumption

Dead Land, Dead Water • 177
and pollution. We have already discussed the amount of water used per well, and mentioned that a single well may be fracked multiple times. Also, more than 750 different chemicals can be mixed into the water for fracking, including benzene, napthalene, diesel fuel, hydrogen chloride, and ethylene glycol. Toxic chemicals and sub-stances have been found to be many times higher than the EPA al-lows. Hurdle reports on a lawsuit against Atlas Energy:
Baseline tests on [the plaintiff’s] water a year before drilling began were “perfect.” . . . [After drilling began,] water tests found arsenic at 2,600 times acceptable levels, benzene at 44 times above limits and naphthalene fi ve times the federal standard. Soil samples de-tected mercury and selenium above offi cial limits, as well as ethyl-benzene, a chemical used in drilling, and trichloroethene, a naturally occurring but toxic chemical that can be brought to the surface by gas drilling. The chemicals can cause many serious illnesses includ-ing damage to the immune, ner vous and respiratory systems, accord-ing to the Endocrine Disruption Exchange, a researcher of the health effects of chemicals used in drilling.
A study published in 2013 found that natural gas components such as methane and propane occur at elevated levels near natural gas wells. Methane concentrations in drinking water wells less than one kilometer from extraction sites were on average six times higher than the level found in water wells farther from natural gas sites. Ethane in drinking wells close to gas wells was twenty- three times the level found in drinking wells farther away from natural gas wells, and propane was found only in drinking wells near natu-ral gas wells.
EarthquakesRecent reports have raised concern over the potential for fracking to trigger earthquakes in areas where they have not been witnessed in the past. Researchers for the U.S. Geological Survey have tied
178 • E X P U L S I O N S
increased earthquake activity in the central United States to frack-ing, and another study reports that seismic activity in Oklahoma increased elevenfold between the period 2008– 2011 and the period 1976– 2007. Research indicates that the number of earthquakes in the North American midcontinent was on average 21 between 1970 and 2000 but increased to 50 earthquakes in 2009, 87 in 2010, and 134 in 2011. That rise in earthquake numbers is almost certainly caused by human activity, specifi cally the reinjection of wastewater into disposal wells: increased water pressure in heavily used disposal wells has acted to separate previously stable faults. Evidence also suggests that the size of earthquakes associated with fracking may be larger than previously believed. A series of earth-quakes in Oklahoma between 2010 and 2011 ranged between 5.0 and 5.7 on the Richter scale, after vulnerable faults were disturbed by high- pressure wastewater disposal.
Earthquakes have also been reported in areas of the United King-dom and the Netherlands where fracking is present. In 2011, shale gas developer Cuadrilla Resources found that it was “highly prob-able” that fracking caused a series of minor earthquakes ranging from magnitude 1.5 to 2.3 in Lancashire, En gland. In the Nether-lands, the number of earthquakes near fracking sites has increased from twenty annually before 2011 to eigh teen in the fi rst month and a half of 2013.33
Mountaintop Removal Mining
In traditional subsurface or “deep” coal mining, coal is removed from its substrate, altering internal geology but leaving most of the surface ecol ogy intact. Mountaintop removal mining, as the name suggests, is the pro cess of removing a mountain from the coal bed to expose the coal for extraction. The scale is enormous: in the larg-est mountaintop removal operation, enough of the mountain was removed to expose an area greater than 65 square kilometers. Not

Dead Land, Dead Water • 179
only does this pro cess destroy the local surface ecol ogy, but the mineral refuse leaches into the water table, where it has signifi cant downstream effects. The radical ecological transformation caused by the removal means that even after mining operations have ceased, many indigenous plants and animals may not be able to return, possibly outcompeted by invasive species.
This pro cess, known formally as mountaintop mining with val-ley fi lls, is a type of high- tech surface mining. The pro cess begins by clearing vegetation and removing topsoil, at which point explosives are used to break up rock and expose coal. The volume of waste created by this pro cess is greater than that of the mountain re-moved, because the rubble is less dense than solid rock. This waste is then pushed into neighboring valleys, therewith often covering the headwaters of streams. The coal residues, rock salts, and trace metals combine to form the chemical equivalent of a giant leaking battery, which, along with toxins such as selenium, seriously affects downstream ecologies. Small species that form the lowest rungs of the aquatic food chain, such as mayfl ies, are especially vulnerable, and their absence is felt by the entire ecosystem. People are also vulnerable: studies indicate that proximity to this sort of mining is related to increases in cancer, birth defects, and cardiovascular problems.
Blowing up mountains to expose coal is an exercise in economies of scale: it creates bigger mines, with fewer employees needed and hence lower operating costs. According to a 2012 report by the U.S. Energy Information Administration, coal mine productivity rates in central Appalachia (which has been mined consistently for more than a century) decreased 45 percent between 2000 and 2010, put-ting pressure on producers to reach for extreme solutions and on local communities dependent on mining to accept them. The Bu-reau of Labor Statistics reports that as more coal is extracted by increasingly destructive methods, the benefi ts for miners and com-munities shrink: employment in the U.S. coal industry has declined
180 • E X P U L S I O N S
by more than 50 percent over the past twenty- seven years, from 177,800 in July 1985 to 80,600 in July 2012., But the amount of coal extracted annually has increased over the same period, from 883.6 million tons in 1985 to 1,084.4 million tons in 2010. Such a situation is untenable.34
Ok Tedi Mine in Papua New GuineaThe Ok Tedi mining operation in Papua New Guinea exemplifi es the damage mining by- products can wreak on the environment if they are not properly handled. The mine was opened in 1984 and controlled by a cadre of multinational fi nancial interests. Initial plans for containing waste, although farsighted by industry stan-dards in the 1970s, did not adequately account for the highly acidic potential of the local substrate or the region’s history of landslide activity. Completely overlooked was the possible impact of the mine on indigenous farmers at the foot of the mountain. In 1983, three years after the mine opened, it was decided that the waste management plan would have to be completely rethought: the proj-ect’s hydroelectric dam and one of its tailings reservoirs was can-celed. The state, without technical counsel and in violation of its own national development laws, certifi ed a temporary plan to let mining go forward without a formal waste reclamation program. The mine began discharging tailings directly into the watershed.
By 1984, the mine was generating 20,000 tons of rubble per day. “From 1981 through 1998 the total waste produced by the Ok Tedi Mine that entered the watershed, by the company’s own reporting, which is not likely to be an underestimate, was 884 million [tons], increasing the solid wastes to 8 times the background load.” The sediments raised riverbeds and triggered extreme fl ooding. The fi ne silt of acidic rock and heavy metal particulate left broad sterile strips along the riverbanks after a fl ood: “By 2002, 1461 sq km of vegetation had been impacted. . . . The riparian environment was altered, with the loss of fi sh habitat and dramatically declining

Dead Land, Dead Water • 181
numbers and diversity of fi sh.” The tailings contained levels of cop-per safe for human consumption, but dangerous to aquatic life. “By the 1990s the lower Ok Tedi [River] had silted up so much that it regularly overfl owed its banks and deposited a layer of sterile sand on top of levees that had previously been the most productive gar-den sites for people living along the river. Side branches and chan-nels became choked with sediment, killing sago stands and up to 480 square kilometers of forest, while the water’s constant turbidity drove local fi sh stocks away.” Sago palms, the staple of the lowland community’s diet, saw declines in growth rate and nutrition value. Neither the government nor the own ership group had studied the mine’s potential effect on the region’s staple crop.
In 1988, tribal villagers fi led suit against Broken Hill Proprietary, at the time the world’s largest mining conglomerate. The parties reached a settlement in 2004 that would award compensation to local residents; the mine was supposed to continue producing until 2010, when it was scheduled to run out of recoverable ore, but as of March 2013 it was still operating.35
Atomredmetzoloto Mines in Chita, Rus siaThe Siberian city of Chita is located near what may be Rus sia’s richest mineral deposits, an area that has been a center of gold and uranium mining since the 1960s. Today it produces the vast majority of the country’s uranium, with the Krasnokamensk mine producing 50 percent of the 15,000 tons Rus sia consumes annually. The mine has produced a minimum of 5 million tons of uranium waste and tail-ings annually for the last thirty years, making it the largest continuous producer of uranium waste in the world. Today, the state- controlled Atomredmetzoloto (ARMZ) mining company owns and operates the mine.
The 400,000 people who live in and around Chita are severely affected by the waste. In the Balei area alone, hundreds of houses have been found to have radiation levels more than ten times the

182 • E X P U L S I O N S
permissible level, and almost a thousand homes have been shown to have radiation levels above international safety standards. The toll on human health has been extreme: in some areas, as many as 95 percent of children have chronic diseases or disabilities, and chil-dren are frequently born with severe mutations such as missing limbs or retardation. Rates of Down syndrome are four times the national average. Currently, there are no public plans for environmental re-mediation: the Rus sian government does not acknowledge that a problem exists.36
The Power to Poison Land, Water, and Air
Nuclear Accidents, Deadly Gases
While mining and industrial waste certainly have the capacity to poison the environment, it is worth isolating nuclear waste as uniquely dangerous in several respects, not least because it can be carried by air and water over enormous distances and because of its long life. Poison gas, though it has a shorter life, can be no less dan-gerous in the short term and continues to be produced lawfully and in large quantities for industrial use. These two contaminants pose risks that not even the rich can escape, unlike most hazards associ-ated with mining and industrial waste. They have mostly been far more tightly regulated than mining and the types of manufacturing described earlier in this chapter. But neglect and accidents do occur. The following cases tell a large story that needs little explaining.
Chernobyl, UkraineThe explosion of a high- power channel nuclear reactor (known by the acronym RBMK) at the Chernobyl power complex on April 26, 1986, remains the worst nuclear accident to date. It released 5.2 million terabecquerels of radioactive emissions (one becquerel is equivalent to one event of atomic decay per second)— a hundred
Dead Land, Dead Water • 183
times more radiation than was released by the atomic bombs dropped on Hiroshima. The meltdown was caused by faulty plant design and serious operational mistakes. During a routine test of the system’s operational capability at low power, the reactor became unstable because it was not receiving enough cooling water. Operators had disabled important plant functions, including the automatic shut-down system, and when the situation became unstable they were forced to try alternative mea sures to stop the reaction. During the attempt, they triggered a massive power spike, setting off a steam explosion that displaced the 1,000- ton protective steel cover plate and sent radioactive steam and fi ssion products into the atmosphere. A second explosion followed seconds later, ejecting pieces of fuel from the reactor core. RBMK reactors were designed without the concrete and steel containment dome that surround most nuclear plants, so there was no mechanism to contain radiation once the reactor was compromised.
The reactor burned for the next ten days, releasing at least 5 per-cent of the reactor’s 192 tons of radioactive fuel into the environ-ment. Vast stretches of territory were degraded: 150,000 square kilometers of land in Ukraine, Belarus, and Rus sia were soon classi-fi ed as contaminated (radiation levels above 38,000 becquerels per square meter), primarily by isotopes of cesium, strontium, and iodine. The mandatory evacuation area was eventually enlarged to 4,300 square kilometers, and 336,000 people had to be permanently reset-tled. Twenty- six years after the accident, the government of Ukraine bans human habitation within a 30- kilometer radius of the plant.
The accident’s toll on human life is an issue of debate. At the site of the accident, two workers died in the initial explosion, and twenty- eight more died within the next three months after being exposed to 20 sieverts of radiation. The impacts of radiation expo-sure are not always easy to determine: individuals who are exposed to elevated levels of radiation may or may not develop health prob-lems such as cancer, but if they do, it is diffi cult to determine whether
184 • E X P U L S I O N S
it was induced by radiation exposure or something else, such as smoking. The World Health Or ga ni za tion reports that a total of 4,000 people will eventually die as a result of the accident and that the total increase in cancer incidence will be 3 percent; however, the or ga ni za tion concluded that the most signifi cant public health issue resulting from the crisis is the widespread decline in psychological health and economic well- being among those forced to abruptly relocate from contaminated areas. The WHO especially notes peo-ple’s intense anxiety about the health effects they anticipate but may never experience
On the other hand, scholars at the New York Academy of Science claim that the International Atomic Energy Agency and World Health Or ga ni za tion, among others, “have largely downplayed or ignored many of the fi ndings reported in the Eastern Eu ro pe an sci-entifi c literature and consequently have erred by not including these assessments,” and calculate that more than 985,000 people have died as a result of the Chernobyl accident.
In any case, a great deal of radioactive material remains inside the remnants of the reactor, protected by a steel and concrete sar-cophagus built as a temporary mea sure in the immediate aftermath of the crisis. That containment vessel is decaying rapidly, and the site continues to leak radiation. A new protective structure, designed to last a hundred years, is scheduled to be installed in 2015.37
Hanford, WashingtonIn 1943, the U.S. government used the War Powers Act to seize 1,450 square kilometers of land near the Columbia River in southern Washington State, displacing all 1,200 people who lived in the agri-cultural communities of Hanford, White Bluffs, and Richland.38 The military, concerned that Nazi Germany was ahead of the United States in the race for the atomic bomb, had decided to accelerate the research and development of plutonium weaponry. Hanford be-came the site of the world’s fi rst large- scale plutonium production
Dead Land, Dead Water • 185
plant. Today, it contains approximately two- thirds of the country’s highly radioactive waste.
Plutonium is created during fi ssion, when uranium- 238 absorbs a neutron to become uranium- 239, which then twice undergoes beta decay, fi rst into neptunium- 239 and then into plutonium- 239. To harvest the fi ssionable plutonium from nuclear reactors, spent fuel rods are dissolved in acid, from which the plutonium is precipitated out to separate it from the other fi ssion by- products. Before it was decommissioned in 1987, the Hanford complex pro cessed an esti-mated 120,000 kilograms of plutonium. The vast majority of this highly radioactive material remains in situ: only 11,655 kilograms have been disposed of or removed, leaving enough plutonium bur-ied at the site to build 1,800 copies of the “Fat Man” bomb that destroyed Nagasaki.
Today, the site is a slow- motion tragedy: more than about 189 million liters of high- level radioactive and chemical waste are stored in 177 tanks, many of them leaking, buried about 19 kilometers from the Columbia River. About 3.8 million liters have escaped. A 2008 report by the Department of Ecol ogy of the State of Washing-ton noted that toxic substances had already entered the water table and might be as few as seven years from entering the water of the river at a point upriver from cities inhabited by 1 million people and farms with a combined value of $6.4 billion. The Department of Energy, which runs the site, currently has no plans to intercept the toxins before they enter the water supply, nor does it have any plans to clean up the solid waste at the site. In fact, the department has petitioned the federal government to move more nuclear waste to Hanford from other nuclear sites, in effect declaring Hanford a lost cause.
Fukushima Daiichi, JapanAreas near the Fukushima Daiichi nuclear power plant, crippled by an earthquake and tsunami in 2011, may be off- limits for de cades,
186 • E X P U L S I O N S
according to the Japa nese government. In 2011, Japa nese offi cials told community leaders that areas emitting 100 millisieverts of radiation per year would not be safe for a de cade, and areas with 200 millisieverts would be uninhabitable for twice that time. Cur-rently, people are banned from entering within 20 kilometers of the plant.
The amount of damage at Fukushima is not yet known, but it will be largely determined by the proportion of long- lived isotopes in the radioactive steam that escaped the plant during the initial damage. Radioactive cesium- 137, with a half- life of 30.2 years, is likely to be the most noxious toxin (in terms of amount emitted and length of half- life), as was also the case at Chernobyl. About 50,000 people were ordered to evacuate after the disaster, and many farm-ers and fi shermen lost their livelihoods.39
Chemical Explosion in Bhopal, IndiaBhopal is the capital of the state of Madhya Pradesh, India. It expe-rienced the worst- ever industrial disaster in 1984 when a Union Carbide pesticide plant in the city released 45 tons of a cyanide- derivative gas into a nearby slum. The leak killed 3,800 people as they slept, and some of the 558,125 who were exposed died later from injuries.
The plant was sold in 1994 to a consortium of Indian banks and the Indian government, which had previously owned 49 per-cent of the plant. The toxic compounds that were stored in the factory were never adequately removed, and it is believed that 450 tons of waste still contaminates the 4.5 hectares factory site. The pesticide chemicals and residues are now thought to be the cause of the unusually high number of birth defects (cleft palates, mental retardation, missing eyeballs) in the city, which in 2011 had a population of 2,368,145, an increase of 28.46 percent over a de-cade earlier. The government has agreed to truck in drinking water to Bhopal because of local complaints about drinking water, but
Dead Land, Dead Water • 187
the deliveries are irregular and many poor people still drink the lo-cal water.40
The World’s Oceans
Dead ZonesThe acidity level of surface ocean waters has been rising since indus-trialization and is projected to become signifi cantly higher as oceans continue to absorb carbon dioxide. Based on multiple scientifi c studies, the World Bank reports that “estimates of future carbon di-oxide levels, based on business as usual emission scenarios, indicate that by the end of this century the surface waters of the ocean could be nearly 150 percent more acidic, resulting in pH levels that the oceans have not experienced for more than 20 million years.”41
Perhaps the most brutal instance of the destruction or degrada-tion of water bodies is the existence of an estimated 400 dead zones in the world’s oceans, comprising an area of more than 245,000 square kilometers. A range of human practices, including agricul-tural pollution, play a key role in this, one of the most extreme forms of environmental degradation. The zones are suffering from hypoxia, a lack of the oxygen necessary to sustain life, and do not experience the water- column turnover necessary to replenish oxy-gen levels.
Hypoxia and the resulting eutrophic state are the by- product of fertilizer runoff from commercial agriculture into the ocean. The shallow, sun- heated bodies of fresh water that carry runoff to the ocean are both warmer and less dense (due to their lack of salinity) than the deep ocean saltwater. As they enter the ocean, they create a fertilizer- rich top layer that does not mix with water below it. The fertilizer in the top layer triggers a bloom of algae, especially toxic cyanobacteria poisonous to many fi sh. As the fi sh and algae die, they sink to the bottom of the water column, where their decompo-sition consumes oxygen. When the levels of oxygen below the top

188 • E X P U L S I O N S
eutrophic layer are depleted to the point that they can no longer sustain life, they become what are known as dead zones. These dead zones last until water columns become adequately disturbed to re-plenish the oxygen in the lower strata of the ocean. It is estimated that dead zones around the globe have eliminated between 343,000 and 734,000 tonnes of biomass. As formerly rich waters become dead zones, fi sheries wither and coastal populations face reduced sources of livelihood.
Rising Sea LevelsThe rise in sea levels is another major outcome of climate warming, and has been occurring faster than we once thought likely. The World Bank reports that “a rise of as much as 50 cm by the 2050s may be unavoidable as a result of past emissions” according to ex-perts. It will be particularly sharp in some areas of the world, most especially parts of Asia. Water levels at the Southeast Asian coast-line are projected to be “10– 15 percent higher than the global mean by the end of the 21st century relative to 1986– 2005.” Manila, Ja-karta, Ho Chi Minh City, and Bangkok are likely to experience a rise in sea levels of more than 50 cm above current levels by about 2060, and 100 cm by 2090.
This carries major implications for the local populations and lo-cal economies. For instance, the Mekong Delta accounts for about 50 percent of Vietnam’s total agricultural production and a consid-erable share of the country’s rice exports, so that “a sea- level rise of 30 cm, which could occur as early as 2040, could result in the loss of about 12 percent of crop production . . . relative to current lev-els.” Making these problems even worse, annual rainfall is projected to increase by up to 30 percent if the world’s temperature rises 4°C. For instance, Bangkok would experience up to 40 percent sea level increases if sea levels globally rise by about 15 centimeters above present levels, something that could occur by the 2030s. And the city could experience a sea level increase of up to 70 percent if sea
Dead Land, Dead Water • 189
levels rise globally by 88 centimeters, which could occur by the 2080s if there is up to 4°C warming.
At the same time, in other parts of the world, higher temperature will be experienced as more drought. This includes Asia’s north-west, a key food- producing area, which is projected to get ever drier. Finally, we can expect sharper differences in precipitation across the seasons, “with a decrease of up to 30 percent during the dry season and a 30 percent increase during the wet season under a 4°C world.”
The dualizing pattern of desertifi cation in some regions and fl oods in others could appear in many different parts of the world. “Under 2°C warming, the existing differences in water availability across [sub- Saharan Africa] are likely to become more pronounced. For example, average annual rainfall is projected to increase mainly in the Horn of Africa (with both positive and negative impacts), while parts of Southern and West Africa may see 50– 70 percent decreases in rainfall and groundwater recharge rates. Under 4°C warming, annual precipitation in Southern Africa may decrease by up to 30 percent, while East Africa is projected by many models to be wetter than today, leading to an overall decrease in the risk of drought.”42
Larger countries experience climate change through a range of patterns. In the case of the United States, there has been an acceler-ated rise of water levels in some areas and drought in others. The year 2012, the latest for which there are data available, was the worst in recorded history for extreme weather events, according to the National Oceanic and Atmospheric Administration. Eleven major events— including tornadoes, wildfi res, droughts, and hurricanes— together generated a collective bill of over $110 billion, ranging from crop losses due to drought in the Midwest to fl ood damage on the East Coast due to Hurricane Sandy (at $60 billion, the single biggest cost). In the summer of 2013, drought affected approximately 50.1 percent of the contiguous United States.43

190 • E X P U L S I O N S
Trash GyresThe confl uence of major ocean currents at fi ve points around the globe creates massive whirl pools, or gyres. These are the North At-lantic Gyre, South Atlantic Gyre, North Pacifi c Gyre, South Pacifi c Gyre, and Indian Ocean Gyre (see Figure 4.3). The effl uvium of the ocean collects in these gyres like debris circling around a drain: anything fl oating at sea long enough will eventually come to one of these fi ve collection points. These gyres are central nodes in the vast networks of ocean currents, long known to merchants and sailors. However, as plastics used around the world fi nd their way into the ocean, the gyres have come to resemble nothing so much as landfi lls. Roughly 300 million tons of plastic are produced every year around the globe, 7 million tons of which end up in the oceans. Plastic does not decompose, but rather photodegrades: when exposed to sun and water it breaks down to its constituent molecules, but no further. Vari-
FIGURE 4.3 North Pacifi c Gyre (Now Also Known as the Great Pacifi c Garbage Patch), 2010Source: NOAA n.d.

Dead Land, Dead Water • 191
ous molecules of plastic and other noxious chemicals such as DDT or PCBs remain suspended in the water, forming something akin to a toxic stew. Chemicals from the plastics leach into aquatic plants and animals and become concentrated at the top of the food chain. Evi-dence suggests the amount of plastic dissolved in the oceans doubled between 1999 and 2009.44
Water Grabs
As we saw earlier in the chapter, in their turn to fracking, mining companies are becoming some of the most intensive consumers of water in the developed world, both directly and indirectly through the poisoning of supplies. More quietly, soda companies and water bottlers have also been rapidly increasing their consumption of water. Together these diverse actors have exhausted whole under-ground water supplies in several parts of the world. To compensate for water shortages, Nestlé and other water companies are now constructing huge pipelines and using supertankers and giant sealed water bags to move water long distances for commercial purposes. And as water demand for drinking alone is predicted to increase 50 percent by 2030, some journalists and scholars warn that water is likely to become “the new oil.” But water has not received as much attention as food, even though levels of need are increasingly similar. The estimate is that 870 million people currently suffer from malnu-trition, and 780 million people do not have access to safe drinking water, according to the World Food Program and UNICEF. Water grabs are rapidly adding to water scarcity for the poor in growing areas of the world.45
Nestlé’s Controversial Operations around the World
Nestlé is the leading water bottling company in the world today. It owns eight international brands of bottled water, of which Perrier

192 • E X P U L S I O N S
is the best- known. The industry grew quickly before the recession, expanding at an annual rate of 7.6 percent between 2002 and 2007. The recession put even more pressure on the business: as North American water sales declined 13 percent between 2007 and 2009, Nestlé aggressively fought for access to new water rights and new environmental regulations.46
In a 2005 interview, Nestlé’s chairman, Peter Brabeck- Letmathe, expressed Nestlé’s logic when it comes to water use. Access to wa-ter, “the most important raw material,” should not be considered a human right:
It is a question of whether we should privatize the normal water supply for the population. And there are two different opinions on the matter. The one option, which I think is extreme, is represented by the NGOs, who bang on about declaring water a public right. That means that as a human being you should have a right to water. That’s an extreme solution. The other view says that water is a foodstuff like any other, and like any other foodstuff it should have a market value. Personally, I believe it’s better to give a foodstuff a value so that we’re all aware that it has its price, and then that one should take specifi c mea sures for the part of the population that has no access to this water and there are many different possibilities there.47
The idea that human beings shouldn’t be entitled to water caused a great deal of negative publicity, and Brabeck- Letmathe went back on his statement in several new interviews as the fallout became clear. One of those later interviews on the subject, however, strengthened and further illuminated the idea that everything must have a market value and be managed within a market structure, an idea with worrying consequences for the poorest. In a 2012 inter-view he explained an approach to saving water that would ensures that water would remain under constant threat and constantly exploited:

Dead Land, Dead Water • 193
The 25 liters we need as a minimum as a person in order to live decently . . . this is a human right. But I don’t think it’s a human right to fi ll up my swimming pool, to wash my cars . . . or even to water the garden, I don’t think this is a human right. And if we do not understand that the [amount of] water which is a human right is the smallest part of the water which we are using, and . . . we are us-ing in the United States about 400 liters per day. So this 380 liters, I don’t think it’s a human right, and this should have a price. Why? Because if you do not put a price, we will not make the investments which are necessary in order to use the most precious of the re-sources that we have in a more responsible manner. . . . If we do not give a value to the water, those investments are not going to be made, because no one has an interest to invest because you do not have an eco nom ical return.48
Nestlé has been criticized most harshly for its overpumping of water in the United States. This can be explained on two grounds. First, the U.S. legal system leaves water especially vulnerable to over-exploitation. “The common law of groundwater offers some protec-tion from injury by large well pumps but almost no protection of the public interest in conservation or environmental protection. The common law of groundwater is a law of capture. Groundwater use is a ‘natural’ right incident to surface own ership. Groundwater law was formulated at a time when the mechanics of aquifers were not well understood and high- capacity pumps had not yet been devel-oped.”49 Second, U.S. citizens have the material and legal resources to sue big corporations such as Nestlé. It is not coincidental that India’s battle against Coca- Cola was fought by a U.S.- based NGO, the India Resource Center.
Nestlé’s pattern of appropriation has been clear. It looks for sources of water in areas unaccustomed to negotiating contracts with multinational companies, notably small rural communities. They bring a promise that the water plant will create new jobs and
194 • E X P U L S I O N S
that it will invest in philanthropic causes. Citizens, local associa-tions, and environmental groups that have initiated legal action to protect local water resources have found their task diffi cult given the vastly superior resources of the company, from money to law-yers to politicians’ support.
Nestlé in the United StatesIn North America today, Nestlé’s consumption of water for bottling is emerging as a controversial issue. It is estimated that in 2003 (one year for which there is available data) Nestlé Waters withdrew a total of about 7 trillion liters for its bottled water production in the United States alone. In par tic u lar, serious concerns have been raised about Nestlé’s water takings in areas that are prone to drought conditions. Here are some of the cases fought against Nestlé.50
florida: overpumping in drought- stricken areasThe Crystal Springs Recreation Preserve, located 30 miles from Tampa, bills itself as a “525- acre sanctuary devoted to environmen-tal education and dedicated to the preservation of Florida’s natural environment.” However, in 1996, Bob Thomas, own er of the prop-erty and president of the preserve’s board, closed the park to public access after reaching an agreement to sell water to Nestlé, and began petitioning local government for a drastic expansion of his water rights. During a severe drought in Florida in 2000– 2001, Thomas asked for an increase in water extraction from about 1.1 million liters per day to 6.8 million liters per day. This increase was denied because of concern that it would deplete local water supplies, but Thomas has been cited multiple times for exceeding his water quota by as many as 5,000 gallons per day.
In Madison County, Nestlé was able to secure access to pump unlimited amounts of water from a spring located in a state park for only $230. No royalties or additional fees were secured by the state. The case triggered some controversy, as Florida was in a bitter

Dead Land, Dead Water • 195
dispute with its neighboring states over a region wide water shortage while Nestlé was extracting hundreds of millions of gallons virtually for free. Referring to Nestlé’s corporate taxes, company spokesman Jim McClellen asserted that Florida got a great deal: “You’re talk-ing about millions and millions of dollars in tax benefi t . . . a very good deal for the state of Florida.”51
texas: the rule of captureIn Henderson County, Texas, Nestlé’s Great Spring Waters of Amer-ica faced charges for pumping excessive volumes of groundwater for its Ozarka bottling plant. In March 1996, the company began to extract 350,000 liters of water per day from Rohr Springs in Big Rock. Days after the pumping began, local wells went dry. Families who lost their water fi led a lawsuit, arguing that the pumping con-stituted a violation of their private property rights. In a ruling that surprised many observers, a lower court upheld a Texas law known as the “rule of capture,” which gives land own ers the right to all the groundwater on their property, and ruled that Nestlé was in no way liable. The rule of capture is based on En glish common law and dates back to when Texas was an in de pen dent republic. This anachronistic law states that “ground water is the private property of the own er of the overlying land” and they “have the right to cap-ture the ground water beneath their land.” In 1998 the Texas Supreme Court reaffi rmed the decision, and the law is still in place.52
michigan: unreasonable use of waterIn 2000, Nestlé’s Ice Mountain Spring Water was granted a permit to pump about 1,500 liters of water per minute from Mecosta County, Michigan. In 2001, the company sought to increase the amount of water it was allowed to withdraw so that it could expand its plant. Local voters opposed by two to one a ballot mea sure au-thorizing the plant’s expansion, and in 2002 a local judge ruled that while Nestlé had the right to pump water on a “reasonable use”
196 • E X P U L S I O N S
basis, the company’s water withdrawal had harmed, or was likely to harm, community residents and the environment. Nestlé appealed, and legal action continued until 2009, at which point it settled out of court to secure reduced water rights. The company’s nine- year legal battle is indicative of the lengths it will go to secure sources of water.53
Nestlé Outside the United StatesHere follow a few cases involving what is one of the most global of companies.
nestlé in brazilThe Serra da Mantiqueira region of Brazil is famous for its Circuito das Aguas, springs with high mineral content thought to have me-dicinal properties. It is also the source of Nestlé’s Pure Life water brand. After Nestlé set up production in the late 1990s, overpump-ing led to the drying up of local springs. Residents fi led suit in 2001 and were able to stop Nestlé from extracting more water in 2006, because demineralization is illegal under Brazilian law. Nestlé’s ac-tions, however, will continue to affect the quality of water in the region for a long time to come, as it took hundreds of years of ex-posure to rock aquifers for the water Nestlé has taken to become highly mineralized. Corporate Watch reports that it now seems that Nestlé has exhausted the supply of the locally prized mineral water.54
nestlé in canadaNestlé Waters Canada and its precursors, Aberfoyle Springs and Aberfoyle Fisheries, have had a permit to take water from a well on property located in the village of Aberfoyle in the Guelph region since 1984. Nestlé submitted an application for a fi ve- year renewal of the current water taking, without an increase in either rate or amount, to Ontario’s Ministry of the Environment on March 30,

Dead Land, Dead Water • 197
2007. Nestlé pumps 3.6 million liters of water a day from the local sub- watershed. This triggered controversy, as the city of Guelph was at the time asking its citizens to conserve water. But the permit was renewed. The reason was lack of evidence that the water extraction was harmful; however, no tests were conducted to determine the extent of damage.55
Other Firms and Their Cases
Augustin Ranch in New MexicoIn May and June 2010, more than 900 people protested an applica-tion to extract water, submitted to the New Mexico State Engi-neer’s Offi ce. The request came from a New York City– based cor-poration, Augustin Ranch LLC, which owns land near Datil at the north end of the Augustin Plains, in south- central New Mexico.56 The corporation submitted the original application to the Engi-neer’s Offi ce in the fall of 2007 and is now trying to expand its operations.
It is worth getting into the details to make visible what this type of development entails. The new plan calls for drilling thirty- seven wells to a depth of about 900 meters in order to pump out about 64 trillion liters of water a year from the Augustin Plains aquifer. It also plans to expand the area of exploitation to any points within Socorro, Catron, Sierra, Valencia, Bernalillo, Sandoval, and Santa Fe counties that are in the Rio Grande Basin. The amended appli-cation states the water could be used for broad, unspecifi c pur-poses. Activists say it would probably be sold and piped over to the Rio Grande to make up for shortfalls caused by overconsumption upstream.
Coca- Cola’s WaterThe Indian state of Karmala is an internationally important exporter of spice and rubber and a major hub of agricultural production.
198 • E X P U L S I O N S
It covers almost 40,000 square kilometers of land in southwest In-dia, on the coast of the Indian Ocean. In 2000, a Coca- Cola subsid-iary called Hindustan Coca- Cola Beverages started operating a bot-tling plant in the village of Plachimada, with a permit to extract 510,000 liters of water per day from wells and boreholes. As re-ported by Right to Water and Sanitation, for every 3.75 liters of wa-ter harvested, the factory produced 1 liter of product such as mineral water, Coca- Cola, Fanta, and Thumbs- Up. The rest was released as wastewater. By 2003, there was no potable water left within 10 kilo-meters of the plant, and crop failure had led to 10,000 laborers being put out of work. That same year, Coca- Cola blamed the ex-haustion of the water table on a decline in rainfall.
In 2002, farmers began daily protests at the factory, complaining that irrigation wells had suddenly run dry and that chemicals had fouled what water remained. Testing by the Centre for Science and Environment in New Delhi showed that Coca- Cola’s bottled prod-ucts in India contained pesticides in excess of the Eu ro pe an Com-mon Council’s consumer standards; furthermore, chemicals released by the plant entered the water supply, causing burns and blisters on the skin. The village refused to renew the plant’s permit in 2003, and after a series of court cases, the plant was forced to stop oper-ating in 2004. In 2010, the Coca- Cola Company was fi ned $48 million.57
Using Public Waterways to Discharge Poisons
Dzerzhinsk, Rus siaDuring the cold war Dzerzhinsk was a secret industrial city, the production site of the Soviet Union’s chemical weapons. The chemi-cal factories are now running at less than 30 percent capacity. They have stunted the city’s economy and they have left 136,000 kilo-grams of solid waste from when they still manufactured large quan-tities of sarin and VX gas. About a quarter of the population works
Dead Land, Dead Water • 199
in the chemical plants that dispose of untreated waste in manmade swamps in the forests around the city, many of which are ringed with white circles of chlorine compound.
Today the plants manufacture civilian goods rather than weap-ons. But the Blacksmith Institute reports that some 180 highly toxic chemicals (including phenol and dioxins) are found in the local groundwater, at concentrations mea sur ing up to 17 million times the accepted health limits. Life expectancy among residents is aver-age according to city offi cials, but some international organizations claim that it is well below average (forty- two years for men and forty- seven years for women) and that babies have a severely in-creased risk of birth defects. UN specialists have tested the breast milk of local women and found toxic levels of dioxin. No current plans are in place to clean up Dzerzhinsk; while some ideas do ex-ist, they have been considered too expensive to implement. Offi cials suggest that the problem has been exaggerated, despite the fact that Dzerzhinsk has been named the world’s most polluted city by the Guinness Book of World Rec ords.58
Sukinda Mines, IndiaChromium, a trace mineral and elemental metal already discussed, is used in a wide variety of industrial pro cesses, including steelmaking, plating operations, textile dying, and leather tanning. There is great demand for the metal and its compounds across the world. But it is produced in just a few locations. In 2008 global consumption reached 31.86 million tonnes of chromium and chromium compounds, more than 70 percent of which were produced in South Africa, Kazakh-stan, and India.
India’s share of the global output (16.0 percent) was generated almost entirely in the Sukinda mining district, where more than 90 percent of the country’s reserves are located. In 2008, more than ten open- pit mines were operating in the district, none of them fol-lowing adequate waste removal or environmental plans and with

200 • E X P U L S I O N S
no state regulation or environmental legislation in place. The form of chromium present in Sukinda, hexavalent chromium, is highly carcinogenic and toxic to the human body. Compounding the risk is the fact that the mining area is on the banks of the Brahmani River, the only source of water for the 2.6 million residents in the Sukinda Valley, most of whom live near the mines. Surface water in the region has been mea sured as containing 3.4 milligrams of chro-mium per liter, far surpassing the U.S. limit of 0.1 milligram per li-ter; 60 percent of all drinking water is tainted. Widespread chro-mium poisoning is present in the population: more than 80 percent of deaths in the mining area and the nearby industrial zone are the result of chromium poisoning. The government and the industry are aware of the problems, but they consider solutions to be too ex-pensive, the local government stating: “It is unique, it is gigantic and it is beyond the means and purview of the [State Pollution Control] Board to solve the problem.”59
Global Scale- Up
There was a time when the environmental damage we produced remained somewhat localized, confi ned to specifi c places. That time is gone. Today, nonindustrial areas, such as Greenland and the Antarctic, experience the industrial pollution generated in the United States and in Rus sia, to mention just two countries. Dam-age produced in par tic u lar sites now scales up, driven by the vast-ness of destruction, and becomes a planetary problem that drifts back down to hit even those places that did not contribute to the damage.
Green house gases (including carbon dioxide, methane, nitrous oxide, and particulate matter such as black carbon) are key causes of climate change.60 Diverse mea sures arrive at an estimate that hu-man activity has generated 350 billion tonnes of carbon since 1959; 55 percent of this has been taken up by the oceans and land, and
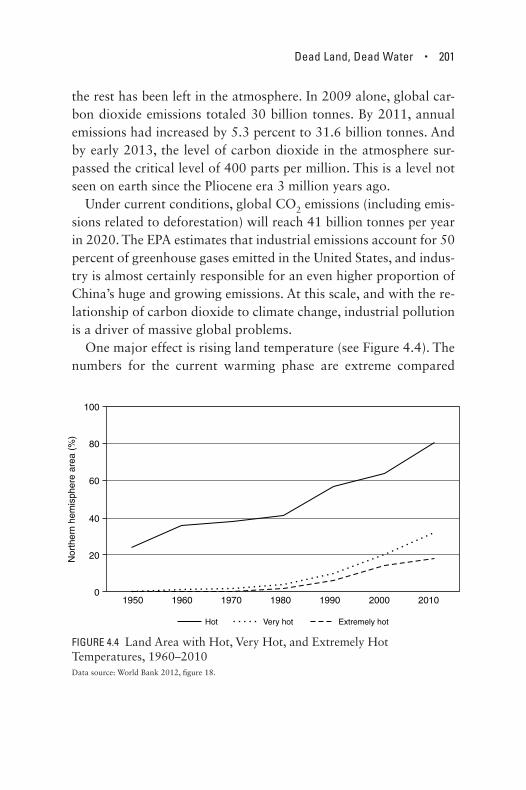
Dead Land, Dead Water • 201
the rest has been left in the atmosphere. In 2009 alone, global car-bon dioxide emissions totaled 30 billion tonnes. By 2011, annual emissions had increased by 5.3 percent to 31.6 billion tonnes. And by early 2013, the level of carbon dioxide in the atmosphere sur-passed the critical level of 400 parts per million. This is a level not seen on earth since the Pliocene era 3 million years ago.
Under current conditions, global CO2 emissions (including emis-sions related to deforestation) will reach 41 billion tonnes per year in 2020. The EPA estimates that industrial emissions account for 50 percent of green house gases emitted in the United States, and indus-try is almost certainly responsible for an even higher proportion of China’s huge and growing emissions. At this scale, and with the re-lationship of carbon dioxide to climate change, industrial pollution is a driver of massive global problems.
One major effect is rising land temperature (see Figure 4.4). The numbers for the current warming phase are extreme compared
0
20
40
60
Nor
ther
n he
mis
pher
e ar
ea (
%)
80
100
1950 1960 1970 1980 1990 2000 2010
Hot Very hot Extremely hot
FIGURE 4.4 Land Area with Hot, Very Hot, and Extremely Hot Temperatures, 1960– 2010Data source: World Bank 2012, fi gure 18.

202 • E X P U L S I O N S
to the available historical rec ords. May 2012 was “the 327th consecutive month in which the temperature of the entire globe ex-ceeded the 20th- century average,” writes Bill McKibben. The spring of 2012 was the hottest ever, and marked the biggest difference with the average seasonal temperature recorded for any season. In the United States, the month of June 2012 broke 3,215 heat rec ords across the country, and May 2012 was the warmest May in the country’s recorded history. There are debates and disagreements about the precise rate, timing, and level of increase. But very diverse types of studies all document this upward trend. (See Figure 4.5.)61
Climate change has already started to affect global agricultural out-put (see Figure 4.6). The Club of Rome predicts that climate change will cause an increase of 2°C in average temperature by the year 2052 and a 2.8°C rise in average temperature by 2080. An increase of that magnitude is predicted to “reduce yields across two- thirds of the
−0.3
−0.2
−0.1
0
0.
Tem
pera
ture
ano
mal
y (c
)
1
0.2
0.3
1980 1985 1990 1995 2000 2005 2010
GISS CRUNCDC RSS UAH
FIGURE 4.5 Temperature Data: Multiple Sources Confi rm Warming Trend, 1980– 2010Data source: World Bank 2012, fi gure 3.

FIGURE 4.6 Insuffi cient Water Supply: Impacts on Agricultural Productivity, 2009Source: Gonzalez- Valero 2009, p. 4.
Dead Land, Dead Water • 203
maize- growing region of Africa, even in the absence of drought”; crop losses for maize could reach 20 percent by midcentury.62
Not all droughts (or fl oods) can be attributed to this type of cli-mate change, as I indicated earlier in this chapter. For instance, what is referred to as the “Dust Bowl” in the United States— a dry plain extending from the central United States into Canada, with Oklahoma and Texas as its center— predates anthropogenic climate change. Seager et al. write that one difference today is that the im-pact of green house gases on the climate has caused the Chihuahuan Desert to expand, or, in Mingfang’s words “We’re essentially moving the desert further north.” There is research on climate change sug-gesting that by the year 2020, the American Southwest will face permanent drought.63
In Asia, the Aral Sea is one instance of a shockingly dried- out lake (see Figure 4.7). Like the Dust Bowl in the United States, climate

204 • E X P U L S I O N S
July–September, 1989 August 12, 2003 August 16, 2009
FIGURE 4.7 The Aral Sea, 1989, 2003, and 2009Source: NASA n.d.
change is not the sole cause of the drying. But the scale and velocity of water loss may be partly due to the global scale- up of climate change and its blowback to sites only indirectly implicated. Not unlike the United States at the time, Soviet- era irrigation projects are known to have been wildly ineffi cient. One example is that of the world’s largest irrigation canal, the Qaraqum Canal, which di-verted 13 cubic kilometers of water from the Aral Sea for years; as much as 50 percent of this water was lost en route due to poor en-gineering. On top of these ineffi ciencies, climate- change- induced drought and desertifi cation sharply increased the stress on the Aral Sea. The end result is that what was once the world’s fourth- largest body of fresh water has been reduced to less than 10 percent of its original volume.64
The other major planetary transformation arising from direct and indirect effects of green house gases is the rise of ocean levels (see Figure 4.8) and their acidity. Between 443 billion and 629 billion tons of meltwater are added to the world’s oceans each year, which
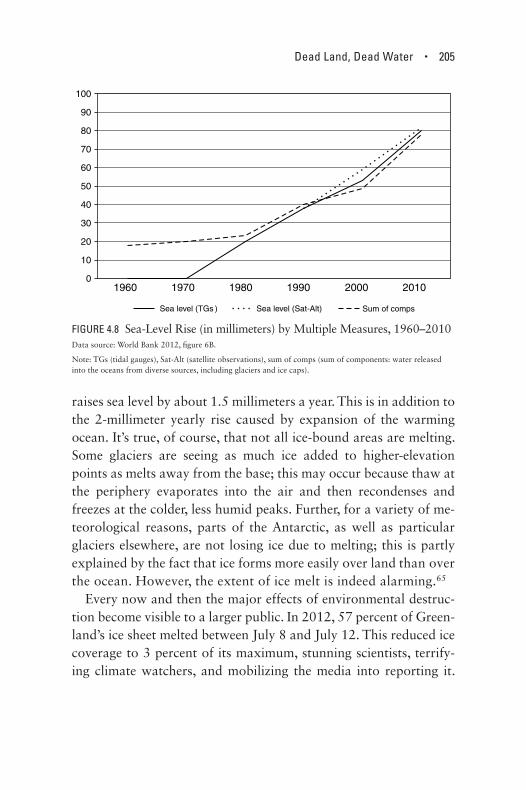
Dead Land, Dead Water • 205
raises sea level by about 1.5 millimeters a year. This is in addition to the 2- millimeter yearly rise caused by expansion of the warming ocean. It’s true, of course, that not all ice- bound areas are melting. Some glaciers are seeing as much ice added to higher- elevation points as melts away from the base; this may occur because thaw at the periphery evaporates into the air and then recondenses and freezes at the colder, less humid peaks. Further, for a variety of me-teorological reasons, parts of the Antarctic, as well as par tic u lar glaciers elsewhere, are not losing ice due to melting; this is partly explained by the fact that ice forms more easily over land than over the ocean. However, the extent of ice melt is indeed alarming.65
Every now and then the major effects of environmental destruc-tion become visible to a larger public. In 2012, 57 percent of Green-land’s ice sheet melted between July 8 and July 12. This reduced ice coverage to 3 percent of its maximum, stunning scientists, terrify-ing climate watchers, and mobilizing the media into reporting it.
0
10
20
30
40
50
60
70
80
90
100
1960 1970 1980 1990 2000 2010
Sea level (TGs ) Sea level (Sat-Alt) Sum of comps
FIGURE 4.8 Sea- Level Rise (in millimeters) by Multiple Measures, 1960– 2010Data source: World Bank 2012, fi gure 6B.
Note: TGs (tidal gauges), Sat-Alt (satellite observations), sum of comps (sum of components: water released into the oceans from diverse sources, including glaciers and ice caps).

206 • E X P U L S I O N S
Figure 4.9 shows the extent of this melt in satellite images from NASA’s Earth Observatory. This ice melt could be part of an annual warming trend. But the evidence suggests that the fact of massive loss of ice and permafrost are becoming permanent.
The melting of ice at this scale becomes a major factor in rais-ing sea levels. The interaction between water temperature and ice melt arises from the fact that ice refl ects more solar energy than water: this insulates the ocean beneath the ice from the sun. When the ice melts, that insulation thins or disappears, and the ocean
FIGURE 4.9 Extent of Surface Melt over Greenland’s Ice Sheet, July 8 and July 12, 2012Source: Viñas 2012.
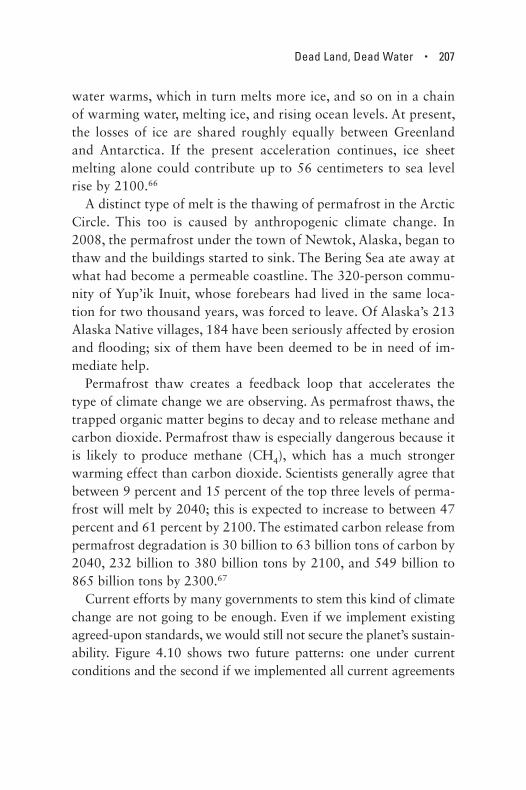
Dead Land, Dead Water • 207
water warms, which in turn melts more ice, and so on in a chain of warming water, melting ice, and rising ocean levels. At present, the losses of ice are shared roughly equally between Greenland and Antarctica. If the present acceleration continues, ice sheet melting alone could contribute up to 56 centimeters to sea level rise by 2100.66
A distinct type of melt is the thawing of permafrost in the Arctic Circle. This too is caused by anthropogenic climate change. In 2008, the permafrost under the town of Newtok, Alaska, began to thaw and the buildings started to sink. The Bering Sea ate away at what had become a permeable coastline. The 320- person commu-nity of Yup’ik Inuit, whose forebears had lived in the same loca-tion for two thousand years, was forced to leave. Of Alaska’s 213 Alaska Native villages, 184 have been seriously affected by erosion and fl ooding; six of them have been deemed to be in need of im-mediate help.
Permafrost thaw creates a feedback loop that accelerates the type of climate change we are observing. As permafrost thaws, the trapped organic matter begins to decay and to release methane and carbon dioxide. Permafrost thaw is especially dangerous because it is likely to produce methane (CH4), which has a much stronger warming effect than carbon dioxide. Scientists generally agree that between 9 percent and 15 percent of the top three levels of perma-frost will melt by 2040; this is expected to increase to between 47 percent and 61 percent by 2100. The estimated carbon release from permafrost degradation is 30 billion to 63 billion tons of carbon by 2040, 232 billion to 380 billion tons by 2100, and 549 billion to 865 billion tons by 2300.67
Current efforts by many governments to stem this kind of climate change are not going to be enough. Even if we implement existing agreed- upon standards, we would still not secure the planet’s sustain-ability. Figure 4.10 shows two future patterns: one under current conditions and the second if we implemented all current agreements
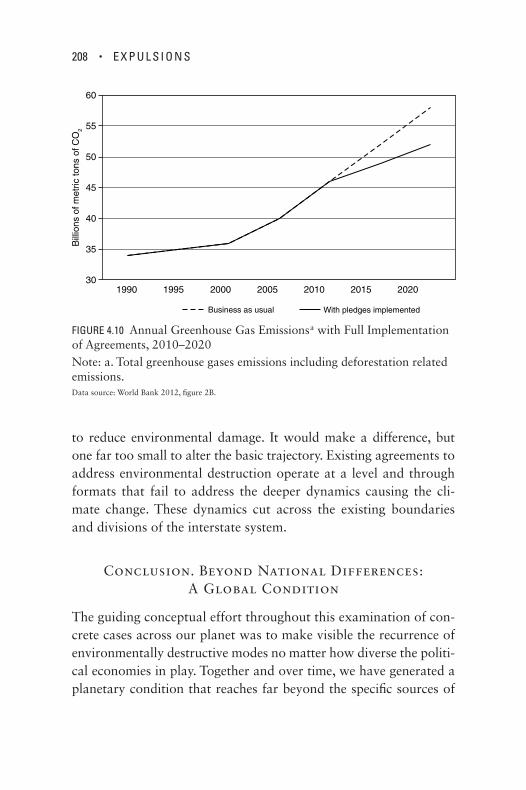
208 • E X P U L S I O N S
to reduce environmental damage. It would make a difference, but one far too small to alter the basic trajectory. Existing agreements to address environmental destruction operate at a level and through formats that fail to address the deeper dynamics causing the cli-mate change. These dynamics cut across the existing boundaries and divisions of the interstate system.
Conclusion. Beyond National Differences: A Global Condition
The guiding conceptual effort throughout this examination of con-crete cases across our planet was to make visible the recurrence of environmentally destructive modes no matter how diverse the po liti-cal economies in play. Together and over time, we have generated a planetary condition that reaches far beyond the specifi c sources of
30
35
40
45
50
55
60
1990 1995 2000 2005 2010 2015 2020
Business as usua
Bill
ions
of m
etric
tons
of C
O2
l With pledges implemented
FIGURE 4.10 Annual Green house Gas Emissions a with Full Implementation of Agreements, 2010– 2020Note: a. Total green house gases emissions including deforestation related emissions.Data source: World Bank 2012, fi gure 2B.

Dead Land, Dead Water • 209
destruction and the specifi c forms of politico- economic or ga ni za tion within which they take place. It is a condition that hovers in spaces that range from the stratosphere to deep ocean gyres.
There is a profound disjuncture between this planetary condition and its sources, on one hand, and the dominant logics shaping gov-ernmental responses and much policy, on the other. Destroyed air, land, and water become a generic condition, a facticity disembedded from the geopo liti cal landscape of countries and mainstream policies. States mostly focus on benefi ting from today’s basic consensus policy approach to climate change, which is carbon trading. The effort is not to reduce destruction but to maximize a state’s advantage in the right to destroy: governments push to augment their “lawful” quota either to augment their right to pollute or to augment what they can sell to governments that want to pollute more. Leaderships of all sorts appear to fi nd it impossible to address the fact of planetary destruc-tion and prefer to scale down their efforts to the lowest common de-nominators, which makes the task seemingly more manageable.
Do the cases discussed suggest that some forms of po liti cal and economic or ga ni za tion prevent some of this destruction? Yes, but to a surprising extent the differences are minor compared to the scale of destruction. Those or gan i za tion al differences fall mostly beneath the consequential levels for reducing destruction at the global scale; they matter more for the place than for the overall planetary condition. Do newer technologies prevent more destruction than older ones? Some of the newest, most complex technologies being deployed are not much better than older, far more elementary modes of producing. They are only different: fracking or removing an entire mountaintop versus digging a coal mine. It all points to the limits of our current dominant approach, with its emphasis on the differences among countries, and the common proposition that more advanced modes of producing will allow us to reduce environmental destruction.
Deeper and conceptually invisible dynamics are cutting across very diverse countries and places. I see at work a global systematic-ity, no matter its thick localized instantiations. It is deeper than the
210 • E X P U L S I O N S
diverse geopo liti cal formations and economies we have built on our planet. Globally, across these differences, segments of the biosphere are being expelled from their life space— they become dead land and dead water. What then is the biosphere? It is as if it does not belong on our planet, no matter that it accounts for a good share of the planet and that the biosphere is us.
Is there a parallel to be made with the modes that expulsion can take in the very different domains examined in preceding chapters? Yes, there is. It is the ambiguous status of the biosphere in our po-liti cal economies, not unlike today’s ambiguous politico- economic status of a majority of citizens in the majority of our nation- states. Too many citizens and too much of the biosphere are used and abused without regard to their health or prosperity.
211
The point of inquiry in this book is the systemic edge. The key dy-namic at this edge is expulsion from the diverse systems in play— economic, social, biospheric. This edge is foundationally different from the geographic border in the interstate system. The focus on the edge comes from the core hypothesis or ga niz ing this book: that the move from Keynesianism to the global, era of privatizations, deregulation, and open borders for some, entailed a switch from dynamics that brought people in to dynamics that push people out. Such a switch from incorporation to expulsion might also be emerg-ing in China and India; China, especially, has seen a massive incorpo-ration of people into monetized economies, but now is also experi-encing sharpening in e qual ity, new forms of economic concentration at the top, and corporate bullying.
Each major domain has its own distinctive systemic edge— this edge is constituted differently for the economy than it is for the biosphere and the social. One of the or ga niz ing assumptions in this book is that the systemic edge is the site where general conditions take extreme forms precisely because it is the site for expulsion or incorporation. Further, the extreme character of conditions at the edge makes visible larger trends that are less extreme and hence more diffi cult to capture. I conceive of these larger trends as con-ceptually subterranean because we cannot easily make them visible
ConclusionAt the Systemic Edge

212 • E X P U L S I O N S
through our current categories of meaning. Thus the importance of positioning my inquiry at the systemic edge.
To illustrate with reference to an earlier era, there was a period when on the surface, from a bird’s-eye view, En gland looked like an overwhelmingly rural economy. But in fact industrial capitalism was already the dominant logic of the po liti cal economy. The sheep on the land were now feeding the machines in city factories. Both sheep and machines were at the systemic edge: they were moving into a new urban industrial era even though the larger visual order was that of a rural economy.
Today, I see new systemic logics arising from the decaying po liti-cal economy of the twentieth century. This decay began in the 1980s. By then the strong welfare states and workers’ syndicalisms estab-lished in much of the West, including in several Latin American countries, either had been devastated or were under severe pressure. To some extent state projects with people- oriented welfare programs had also been strong features in other parts of the world, including, in their own ways, communist countries and those with varieties of socialist nationalism, as illustrated by Nasser’s welfare state poli-cies in Egypt, systems developed in several postin de pen dence Afri-can countries, and India’s brand of state socialism. In these coun-tries too, decay began in the 1980s and 1990s.
To talk of this decay is not to romanticize the twentieth century, a period marked by devastating war, genocide, starvation, and ex-treme ideologies of both left and right. But the world that we began to build in the wake of devastation, starting in the West in par tic u lar after World War II, was driven by a logic of inclusion, by concerted efforts to bring the poor and the marginalized into the po liti cal and economic mainstream. The Keynesian, egalitarian, and nation- based assumptions underlying this project of building the just society be-gan to crumble toward century’s end. We have been slow in under-standing and labeling the powers and dynamics that have emerged from the dust.

Conclusion • 213
What I argue here is that we have fallen under the sway of a dangerously narrow conception of economic growth. Growth was of course crucial to the project of the welfare state. But it was also a means of advancing the public interest, of increasing a prosperity in which many would share, even if some far more than others. Today, by contrast, our institutions and assumptions are increas-ingly geared to serve corporate economic growth. This is the new systemic logic. Perhaps not all, but enough corporations have sought to free themselves from constraints, including those of local public interest, that interfere with their pursuit of profi t. Anything or anybody, whether a law or a civic effort, that gets in the way of profi t risks being pushed aside— expelled. This switch in economic logics is one major systemic trend not fully captured in current explanations.
As we have seen, corporations have remarkable new tools at their disposal: advanced mathematics and communications, machines that can literally move mountains, global freedoms of movement and ma-neuver that allow them to ignore or intimidate national governments, and increasingly international institutions that force compliance with their agenda across the world. Western governments, central bank-ers, the IMF, and kindred international institutions now speak of the need to reduce excess government debt, excess social welfare pro-grams, excess regulation. This is the language of today’s key order- making institutions in the West and increasingly elsewhere. It carries the implicit promise that if we could reduce these excesses we would get back to normal, back to the easier days of the postwar era. But this promise disguises the extent to which that world is truly gone— and the extent to which, what ever national governments might say, too many corporate economic actors do not want it back. They want a world in which governments spend far less on social ser vices or on the needs of neighborhood economies or small fi rms, and much more on the deregulations and infrastructures that corporate economic sectors want.
214 • E X P U L S I O N S
This is de facto a project of shrinking the space of a country’s economy, though not the economic profi tability of the corporate sector. In its simple brutality, the transformation of Greece illus-trates this well: the massive and rapid expulsion of the modest and not so modest middle classes from jobs, social and medical ser vices, and increasingly their homes. This “economic cleansing” has been so effective that by January 2013, the Eu ro pe an Central Bank could announce that the Greek economy was on the path to recovery and Moody’s could raise the credit rating of Greek government debt. What was not said was that this recovery rested on about one- third of the Greek workforce being expelled not just from jobs but also from basic ser vices. It depended on decisions that caused a sharp growth in hunger, in the number of children abandoned in churches by parents too poor to feed them, and in suicide rates. This sort of pro cess is taking place in many European countries, from Spain and Portugal to the Netherlands, though not so drastically nor with such a strong command role by the Eu ro pe an Central Bank. Even countries with growing employment, such as the United States, have in fact shrunken the space of their economies, as is evident when we include the sharp rise in the numbers of the long- term unem-ployed and of the incarcerated.
I want to emphasize again that this shift away from a phase of increasing social and economic inclusion for the average person has also taken place in areas that are now seen as hopeless, whose better times have been forgotten by many observers as if their hopelessness were an intrinsic condition. In sub- Saharan Africa, beneath today’s wars and dismembered societies lies an earlier period of mass manufacturing, growth of the middle classes, thriv-ing market towns and capital cities, government- developed infra-structures, and functioning health care and school systems. Before it broke down, Somalia was a fairly prosperous, fairly well- run (even if autocratic) country with a well- educated middle class. Or consider Rus sia. In years past, communist regimes in the Soviet Union and eastern Eu rope had welfare states that took care of their citizens.

Conclusion • 215
But today the huge numbers of homeless people, the abandoned el-der ly, and the very poor without access to social ser vices are a new development.
One of the intentions of this book was to make visible the cross-ing into the space of the expelled— to capture the visible site or moment of expulsion, before we forget. The villagers and small farm-ers evicted from their land due to the development of palm planta-tions soon materialize as slum dwellers in vast megacities, complet-ing the erasure of their past as small farmers. Government employees in Greece cut out of their jobs in the name of EU demands to reduce the debt soon become part of the mass of unemployed, no longer recognized as erstwhile government employees. Stretches of dead land, poisoned by toxic emissions from factories or mines, are ex-pelled from working land and forgotten.
The or ga niz ing hypothesis is that beneath the specifi cs of each of the major domains examined in this book lie emergent systemic trends. Despite their enormously diverse visual and social orders, from the empowerment of the global corporation to the enfeeble-ment of local democracy, they are shaped by a few very basic dynam-ics of liberated profi t seeking and indifference to the environment.
This also means that empirical research and conceptual recoding must happen together— they need each other. Visually it may look “Rus sian” or “American,” but are these geo graph i cal markers of an earlier era still helpful in understanding the character of our epoch? My argument is not that the destructive forces I discuss are all inter-connected. Rather, it is that these destructive forces cut across our conceptual boundaries— the terms and categories we use to think about the economy, the polity, the diversity of nation- states and ide-ologies from communism to capitalism. But they do so in ways that are invisible to our conceptual eye. In that sense, then, I describe them as conceptually subterranean. Complexity is part of the con-dition here. The more complex a system is, the harder it is to under-stand, the harder it is to pinpoint accountability, and the harder it is for anyone in the system to feel accountable. When destructive

216 • E X P U L S I O N S
forces do pop up and become visible, the problem is one of inter-pretation. The tools we have to interpret them are not up to date, so we fall into our familiar categories: we talk about governments that are not fi scally responsible, house holds that take on more debt than they can handle, capital allocations that are ineffi cient because there is too much regulation, and so on. I do not deny that these can be real problems— there is excellent empirical scholarship that documents this, and I use and partly depend on it. But my effort in this book was to explore whether there are other dynamics at work as well, dynamics that cut across these familiar and well- established conceptual/historical boundaries. In a way, the land grab empirics of Chapter 2 are one concrete instance of a much larger and more elusive type of grab. In that sense, the chapter makes accessible a larger his-tory that does not always take on such a literal form as one’s land plot, the source of one’s livelihood, one’s history, and one’s social being.
Inside capitalism itself we can characterize the relation of emer-gent forms of capitalism to more traditional capitalisms as marked by expulsions but also as erasure by incorporation. Describing our current epoch as characterized by the expansion of market econo-mies is far too vague and partial a description, since large corpo-rate fi rms control much of most markets. Manufacturing fi rms, plan-tations, or mines owned by traditional capitalists with roots in a single nation are increasingly destroyed or bought up by the more powerful global fi rms. Even sectors where profi ts per unit are mini-mal can today be corporatized because scale— the vast number of units involved— will make up for low per- unit profi ts. The relation-ship between today’s advanced capitalism and more traditional forms of market capitalism can, at the limit, be characterized as one of increasingly primitive accumulation: complexity and technical progress serve causes of brute simplicity.
Each of the chapters covered a par tic u lar mix of expulsions at the systemic edge. I conceive of such expulsions as the material mo-ment of a more elusive and complex dynamic— the conceptually
Conclusion • 217
invisible subterranean trends that cut across the familiar meanings and concepts through which we explain our economies and societ-ies. These material outcomes are partly determined by specifi c and often complex instruments, even for elementary expulsions. Eventu-ally expulsions and the instruments that enable them become part of an interconnected, often mutually reinforcing trajectory that moves us farther and farther away from our preceding age of incorpora-tion and middle class growth. We could say that each chapter cap-tured one of these trajectories.
Chapter 1 examined and conceptualized the reconstitution of “the economy” in well- established highly developed countries as a shrunken space with relatively fewer fi rms, fewer workers, and fewer consumer house holds, all indicators of a system geared toward ex-pelling what does not fi t its evolving logic. Government defi cits in the developed world have risen sharply, partly due to large corpo-rate tax avoidance and excess appropriation for dubious projects that range from wars and bank bailouts to the grabs by predatory elites. Most of the governments in the Americas and Eu rope, and in the immediate postcolonial period of the 1960s in much of Africa, could not do today what they did during the massive reconstruc-tion and infrastructure developments of the 1950s and 1960s be-cause they are now too indebted. The exceptions are several Asian countries, Brazil, and a few others where governmental capacity to encourage and directly undertake development is in full force. It is an important question whether they will avoid the drift toward the mode of expulsion we face in the West. The indications are that they will not. At the opposite end of the spectrum from newly indebted governments lie the sharply expanded wealth and profi ts of large corporations, a third element of that evolving logic.
This evolving logic in the Global North has a parallel in the Global South with the IMF and World Bank restructuring programs put into effect in numerous countries there during the 1980s and 1990s, briefl y discussed in Chapter 2. In both cases the outcome is

218 • E X P U L S I O N S
a tightening of the meaning of “economy” and the expulsion of what does not fi t. Greece, Spain, Portugal, the United States, and a few other Western developed countries are but the most extreme cases of the Global North. They make visible what is perhaps more intermediated in the United Kingdom, the Netherlands, and other rich and highly developed countries. But the general dynamic is one of shrinking the space of the economy, no matter the hardships. The aim is always to achieve a fi ne- running economy. Again, Greece is now regarded by the Eu ro pe an Central Bank as being on its way to recovery— after expelling up to 30 percent of what was once part of its economy. Similar statements were made about diverse African countries once they cut their health, social, and infrastructure “costs” and devoted a signifi cant, often larger share of state revenues to pay-ing the interest on their debt.
We can conceive of this shrinking as a weakening and degrading of the project of the liberal welfare state, broadly understood. With all its shortcomings and the unequal structural power of its various branches and agencies, a working liberal state can secure a mea sure of socioeconomic redistribution. It can do so partly by enabling the disadvantaged to fi ght for their rights and for social justice. It worked when powerful sectors needed more and more workers and couldn’t simply import cheap labor or move production overseas But when the mechanisms for accumulating profi t shift from ex-panded mass manufacturing and public infrastructure development to fi nancial innovations and the post- 1980s corporate format, the ground for making claims of justice crumbles and it becomes a sys-temic edge. That is what is happening today in growing parts of the world. The claimants are at the systemic edge, and they can easily wind up on the other side, expelled. We saw the slide of more and more urban house holds and small businesses to the systemic edge in the Global South, in good part through the IMF and World Bank restructuring programs launched in the 1980s, and we see it begin-ning in the 2000s in rural areas through the sharp rise in land ac-quisitions by foreign governments and fi rms. We are seeing it in the

Conclusion • 219
Global North, with Greece merely a simple and accelerated case of this restructuring— which is only more intermediated and hence slower in other countries.
The global geography of extraction that has long been part of economic development has gone well beyond its traditional associ-ation with plantations and mines, even as these are also expanding. It extends to extracting the gains workers fought for during much of the twentieth century, the land from beneath small farmers, and the modest homes from many who trustingly put down their sav-ings. The mechanisms for these extractions are often far more com-plex than the outcomes, which are often quite elementary.
Chapters 1, 2, and 3 all bring to the fore this tension between complex instruments and often brutally elementary outcomes. No-where is this tension more evident and powerful than in fi nance, with the case of subprime mortgages a key example discussed in Chapter 3. It took up to fi fteen complex steps to transform such subprime mortgages into a fi nancial project aimed at satisfying the needs of the high- fi nance world. What was in its origins a state project enabling modest- income house holds to own a house was transformed into a fi nancial project designed to enable increased profi t. Such a permutation from state to fi nancial project was no easy task. It took advanced mathematicians, brilliant lawyers and accountants, and complicated fi nancial instruments impenetrable even to many of the traders (who simply used the software). These instruments are such that they can circulate well beyond the United States (the Silicon Valley of fi nancial innovations), where they were invented and where they resulted in more than 13 million house holds being foreclosed on. We are beginning to see unusually high num-bers of foreclosures in other countries, notably Hungary and Spain, discussed in Chapter 1. The global potential of these instruments to create devastation is enormous. Beyond fi nance, this tension be-tween complex instruments and brutally elementary outcomes is present in other economic sectors as well. Examples are new types of mining, such as hydraulic fracturing (discussed in Chapter 4), and
220 • E X P U L S I O N S
the often long chains of steps involved in buying land in a foreign sovereign country (discussed in Chapter 2).
What I sought to extract from all these cases is what I see as a foundational juxtaposition in our present ways of constituting eco-nomic space: a deployment of complex forms of knowledge and creativity that too often bring with them, besides robust profi ts, astoundingly elementary brutalities. One question this engenders is whether what we still understand as diverse and discrete economic sectors are merely the aboveground manifestations of what are ac-tually a few major transformative technical and or gan i za tion al ca-pabilities that underlie all these surface differentiations. Are there a few logics that drive what on the surface becomes present as enor-mously diverse worlds— the world of fracking, the world of fi nance, the world of the logistics for outsourcing? Does all this visible spe-cialized variability come down to a few less visible logics that can swallow up and reposition diverse types of specialized knowledge into a few or ga niz ing logics? Yes— I see this in the economy and in the ways some of the most powerful actors in the economy use people, governments, and the world’s resources to ensure corporate economic growth with an absolute minimum of global restraints and as few local responsibilities as possible. I say this about the space of the corporate economy, not about spaces such as universi-ties, where differentiation is part of the traditions of teaching and learning that can (still) coexist with the reshaping of economic space I have examined in this book. Even so, bits and pieces of tech-nical, engineering, biological, economic, and other forms of aca-demic knowledge are increasingly repositioned to ser vice dominant and domineering logics or ga niz ing economic space.
This is clearly an extreme formulation, but that is what it looks like from the systemic edge. The most powerful form of such an or-ga niz ing logic is captured analytically in the concept of predatory formations I introduced in Chapter 1; it captures some of the major instances examined in the four core empirical chapters of the book.

Conclusion • 221
Such formations are assemblages of powerful actors, markets, tech-nologies, and governments. They are far more than simply the rich-est individuals or the richest fi rms or the most powerful govern-ments. These formations incorporate only elements of any of these worlds. The logics that drive them are not easily subject to existing governance mechanisms. In many ways not even the most powerful individuals and fi rms can control or direct these assemblages— too many bits break out of these diverse institutional worlds and come together to shape powerful new dynamics that cannot be reduced to any of the source institutions— not the economy, not the law, not capital. The historical record suggests that such formations are not new. But what might be different today is the complexity of key components. One major instance involves the advanced fi nancial innovations that can cut across a variety of economic sectors and subject them to their own logic, no matter the content, from intan-gible debts to massive buildings. A second major instance is the global scale- up of our environmental destruction, which boomer-angs back across the world and affects places and fl ows that never contributed to that destruction— with perhaps the most extreme case the Arctic’s permafrost, now threatened by climate change.
This possibility helps explain what is at the heart of this book: that there are larger dynamics that cut across older forms of differ-entiation and thereby can generate expulsions across different worlds. This is putting it rather starkly for the sake of clarity, and it is not to deny that we have still made progress in certain areas, as in the extension of minority rights. But I do fi nd that it is the direc-tion in which we are going in far too many places, whether in the United States, South Africa, Rus sia, China, and more.
Today’s systemic edge is a space of expulsions, in contrast to the Keynesian epoch where the systemic edge was a space of incorpora-tion, not because it was an ideal period but because the constitutive systematicities were about mass production and mass consump-tion. Today’s are not.

222 • E X P U L S I O N S
What is in play in all these pro cesses is the question of member-ship and constitutive participation. I examined diverse modes and domains in order to remind us of a larger life space that is itself at threat. I did this by focusing on a series of thick microspaces. Each is an extreme condition, indeed so extreme that it allows us to see a capacity for destruction that most of us still do not necessarily ap-prehend or experience in our daily lives. More conceptually, I sought to grasp the existence of larger transversal trends that point to planetary conditions— expulsions of people, economies, life spaces. Our divisions of countries and sectors still are useful to explain much that happens, but they do not help us address larger emergent planetary conditions.
I want to conclude with a question: what are the spaces of the expelled? These are invisible to the standard mea sures of our modern states and economies. But they should be made conceptually visi-ble. When dynamics of expulsion proliferate, whether in the shape of the shrunken economy of Greece, the predatory elites of Angola, or the growth of the long- term unemployed or the incarcerated in for- profi t prisons in the United States, the space of the expelled ex-pands and becomes increasingly differentiated. It is not simply a dark hole. It is present. Also the spaces of the expelled need to be concep-tualized. I make a similar argument about the proliferation of stretches of dead land and dead water due to our toxic modes of de-velopment. These are also present. Thus, in a conceptual move aimed at making dead land present, I argue it should be conceived of as an informal jurisdiction. More generally, the spaces of the expelled cry out for conceptual recognition. They are many, they are growing, and they are diversifying. They are conceptually subterranean conditions that need to be brought aboveground. They are, potentially, the new spaces for making— making local economies, new histories, and new modes of membership.

REFERENCES
NOTES
AC KNOW LEDG MENTS
INDEX


225
Aabø, Ellen, and Thomas Kring. 2012. “The Po liti cal Economy of Large- Scale Agricultural Land Acquisitions: Implications for Food Security and Livelihoods/Employment Creation in Rural Mozam-bique.” Working paper no. 2012- 004. United Nations Development Program, New York.
Aalbers, Manuel B. Subprime Cities: The Po liti cal Economy of Mortgage Markets. Chichester, West Sussex: Wiley- Blackwell, 2012.
Abel, Heather. 1997. “The Rise and Fall of a Gold Mining Company.” High Country News. December 22.
Alderman, Liz. 2013. “Greece Shuts Broadcaster in Bid to Show Resolve.” New York Times. June 12.
Alexander, Michelle. 2010. The New Jim Crow: Mass Incarceration in the Age of Colorblindness. New York: The New Press.
Allegretto, Sylvia. 2011. “The State of Working America’s Wealth, 2011: Through Volatility and Turmoil, the Gap Widens.” Briefi ng paper 292. Economic Policy Institute, Washington, DC.
Alvarenga, Carlos. 2013. “HFT Update: The Rise of the ‘Dark Pool.’ ” Reconomics [blog].
American Civil Liberties Union. 2011. “Combating Mass Incarceration— The Facts” [infographic]. June 17. www .aclu .org /combating -mass -incarceration -facts -0 .
Amin, Ash. 2012. Land of Strangers. Cambridge, UK: Polity.Amin, Ash, and Nigel Thrift. 2013. Arts of the Po liti cal: New Openings
for the Left. Durham, NC: Duke University Press.
References

226 • References
Amin, Samir. 2010. “Exiting the Crisis of Capitalism or Capitalism in Crisis?” Globalizations 7, no. 1 (April 27): 261– 273.
Anseeuw, Ward, Mathieu Boche, Thomas Breu, Markus Giger, Jann Lay, Peter Messerli, and Kerstin Nolte. 2012. Transnational Land Deals for Agriculture in the Global South. Rome: International Land Co ali tion.
Anseeuw, Ward, Lily Alden Wily, Lorenzo Cotula, and Michael Taylor. 2012. Land Rights and the Rush for Land: Findings of the Global Commercial Pressures on Land Research Project. Rome: Interna-tional Land Co ali tion.
Arestis, Philip, Rogério Sobreira, and José Luís Oreiro. 2011. The Financial Crisis: Origins and Implications. Houndmills, Basingstoke: Palgrave Macmillan.
ARMZ Uranium Holding Co. 2012. “Priargunsky Industrial Mining and Chemical Union.” www .armz .ru /eng /companies /subsidiaries / ppgho .
Arrighi, Giovanni. 1994. “The Three Hegemonies of Historical Capital-ism.” In The Long Twentieth Century: Money, Power, and the Origins of Our Times, 27– 84. London: Verso.
Asian Human Rights Commission. 2012. “Indonesia: Police Shoot and Injure Five Farmers in Riau during Land Rights Protests.” March 27. www .humanrights .asia /news /urgent -appeals /AHRC -UAC -051 -2012. Accessed June 30, 2013.
Associated Press. 1991. “Bunker Hill Mining Files for Bankruptcy Protection.” Moscow- Pullman Daily News. January 18.
———. 2007. “ ‘Most Polluted’ Town Sees a Ray of Hope.” NBCNews .com. June 20.
———. 2010. “Peru to Seek Bids for First Private Prison.” Associated Press. April 1.
Atinc, Tamar M., Abhijt Banerjee, Francisco H. G. Ferreira, Peter Lan-jouw, Marta Menendez, Berk Ozler, Giovanna Prennushi, Vijayendra Rao, James Robinson, Michael Walton, and Michael Woolcock. 2006. World Development Report 2006: Equity and Development. Washington, DC: World Bank.
Atkinson, Anthony B., Thomas Piketty, and Emmanuel Saez. 2011. “Top Incomes in the Long Run of History.” Journal of Economic Literature 49, no. 1 (March): 3– 71.
Aurora Lights. 2013. “What Is Mountaintop Removal?” http:// aurora lights .org /map _project /theme .php ?theme=mtr & article=primary. Accessed January 2, 2013.

References • 227
Austin, James, and Garry Coventry. 2001. Emerging Issues on Privatized Prisons. Washington, DC: U.S. Department of Justice, Offi ce of Justice Programs.
Badkar, Mamta. 2012. “Here Comes the 2012 Tidal Wave of Foreclo-sures.” Business Insider. March 15.
Bai, Z. G., D. L. Dent, L. Olsson, and M. E. Schaepman. 2008. “Proxy Global Assessment of Land Degradation.” Soil Use and Management 24, no. 3 (July 24): 223– 234.
Bakalidou, Sophia. 2013. “Press Release: Index Of Wages Of The Whole Economy.” Hellenic Statistical Authority. http:// www .statistics .gr / portal /page /portal /ESYE /BUCKET /A0199 /PressReleases /A0199 _ DKT08 _DT _QQ _03 _2013 _01 _F _EN .pdf. Accessed January 1, 2014.
Ballantyne, A. P., C. B. Alden, J. B. Miller, P. P. Tans, and J. W. C. White. 2012. “Increase in Observed Net Carbon Dioxide Uptake by Land and Oceans during the Past 50 Years.” Nature 488, no. 7409: 70– 72.
Banai, Adam, Julia Kiraly, and Marton Nagy. 2011. “Home High Above and Home Deep Down: Lending in Hungary.” Research working paper 5836, World Bank.
Bank for International Settlements. 2012. “Semiannual OTC Derivatives Statistics at End- June 2012.” www .bis .org /statistics /otcder /dt1920a . pdf. Accessed July 17, 2013.
Barriopedro, David, Eric M. Fischer, Jürg Luterbacher, Ricardo M. Trigo, and Ricardo Garcia- Herrera. 2011. “The Hot Summer of 2010: Redrawing the Temperature Record Map of Eu rope.” Science 332, no. 6026: 220– 224.
BBC News. 2007. “Toxic Truth of Secretive Siberian City.” BBC News. April 5.
———. 2011. “How Does Fukushima Differ from Chernobyl?” BBC News Asia- Pacifi c. Accessed January 3, 2013. www .bbc .co .uk / news / world -asia -pacifi c -13050228 .
———. 2012. “Greece’s Economy Shrinks Further.” BBC Business News. November 14.
Behrman, Julia, Ruth Meinzen- Dick, and Agnes Quisumbing. 2011. “The Gender Implications of Large- Scale Land Deals.” IFPRI Policy Brief. April 17. http:// www .ifpri .org /sites /default /fi les /publications /bp017 .pdf .
Belcher, Melissa, and Marvin Renikoff. 2013. “Hydraulic Fracturing: Radiological Concerns for Ohio.” FreshWater Accountability Project Ohio. http:// catskillcitizens .org /learnmore /OHIO _FACT _SHEET _6–10 -13 .pdf. Accessed June 26, 2013.
228 • References
Belton, Catherine. 2006. “For Rus sia, Dependence on ‘a Man- Made Disaster.’ ” New York Times. January 12.
Bensasson, Marcus. 2013. “Greek Economy Shrank in First Quarter as Investment Fell.” Bloomberg .com. June 7.
Bergmann, Karyn S. 2004. “Bankruptcy, Limited Liability and CERCLA: Closing the Loophole and Parting the Veil.” Center for Health and Homeland Security, University of Mary land School of Law.
Bertola, Luis, and Jose Antonio Ocampo. 2013. The Economic Development of Latin America since In de pen dence. Oxford: Oxford University Press.
“Bhopal Census 2011 Highlights.” 2011. Census 2011: Population Census India. May 19. www .census2011 .co .in /news /747 -bhopal -census -2011 -highlights .html .
Bhuiyan, M. A., N. I. Suruvi, S. B. Dampare, M. A. Islam, S. B. Quraishi, S. Ganyaglo, and S. Suzuki. 2011. “Investigation of the Possible Sources of Heavy Metal Contamination in Lagoon and Canal Water in the Tannery Industrial Area in Dhaka, Bangladesh.” Environmental Monitoring and Assessment 175, nos. 1– 4 (April): 633– 649.
Bice, Sara. 2013. “Ok Tedi Immunity Gone, with Implications beyond BHP.” The Conversation. http:// theconversation .com /ok -tedi -immunity -gone -with -implications -beyond -bhp -19188. Accessed January 4, 2014.
Biello, David. 2013. “400 PPM: Carbon Dioxide in the Atmosphere Reaches Prehistoric Levels.” “Observations” blog. Scientifi c Ameri-can. May 19.
Bivens, Josh. 2011. Failure by Design: The Story behind America’s Broken Economy. Washington, DC: Economic Policy Institute.
———. 2013. “Using Standard Models to Benchmark the Costs of Globalization for American Workers without a College Degree.” Briefi ng paper no. 354. Economic Policy Institute, Washington, DC.
Blackman, Allen, and Arne Kildegaard. 2003. “Clean Technological Change in Developing- Country Industrial Clusters: Mexican Leather Tanning.” Discussion paper 03- 12. Resources for the Future, Wash-ington, DC.
Blacksmith Institute. 2007. “The World’s Worst Polluted Places: The Top Ten of the Dirty Thirty.” www .blacksmithinstitute .org. Accessed January 3, 2013.
———. 2011a. “Artisanal Gold Mining.” www .worstpolluted .org /projects _reports /display /. Accessed November 23, 2013.
———. 2011b. “Chromium.” www .worstpolluted .org /projects _reports / display /80. Accessed November 23, 2013.

References • 229
———. 2011c. “Lead- Acid Battery Recycling.” www .worstpolluted .org / projects _reports /display /90. Accessed November 23, 2013.
———. 2011d. “Lead Smelting.” www .worstpolluted .org /projects _reports /display /86. Accessed November 23, 2013.
———. 2011e. “Mining and Ore Pro cessing.” www .worstpolluted .org / projects _reports /display /84. Accessed November 23, 2013.
———. 2011f. “Tannery Operations.” www .worstpolluted .org /projects _ reports /display /88. Accessed November 23, 2013.
———. 2011g. “The World’s Top Ten Pollution Problems 2011.” www . worstpolluted .org /2011 -report .html. Accessed November 23, 2013.
———. 2013a. “Norilsk, Rus sia.” www .worstpolluted .org /projects _ reports /display /43. Accessed January 3, 2013.
———. 2013b. “Top Ten Most Polluted Places 2007: Sumgayit, Azerbai-jan.” www .worstpolluted .org /projects _reports /display /27. Accessed January 3, 2013.
———. 2013c. “World Bank and Blacksmith Institute Partner to Take Care of ‘Orphaned’ Toxic Polluted Sites.” www .blacksmithinstitute . org /legacy -pollution -sites .html .
———. 2013d. “Dzerzinsk, Rus sia.” www .worstpolluted .org /projects _ reports /display /42 .
———. 2013e. “Sukinda, India.” www .worstpolluted .org /projects _reports /display /36. Accessed January 3, 2013.
———. 2013f. “Blacksmith’s Work in Haina.” www .blacksmithinstitute .org /haina .html. Accessed January 3, 2013.
Blackstone, Brian, Stelios Bouras, and Cassell Bryan- Low. 2012. “Eu rope’s Growth Woes Worsen.” Wall Street Journal. February 15.
Blair, David. 2012. “Greece Sinks to Its Knees.” Telegraph. February 26.Blomfi eld, Adrian. 2007. “Doom and Gloom in Dzerzhinsk.” Telegraph.
November 5.Bolaños, Alejandro. 2012. “Las Rentas Empresariales Superan Por
Primera Vez a Las Salariales en España.” El País. http:// economia . elpais .com /economia /2012 /02 /16 /actualidad /1329424061 _546148 .html. Accessed January 1, 2014.
Bolton, Patrick, Frederic Samama, and Joseph E. Stiglitz, eds. 2011. Sovereign Wealth Funds and Long-Term Investing. New York: Columbia University Press.
Borodkin, Leonid, and Simon Ertz. 2004. “Coercion versus Motivation: Forced Labor in Norilsk.” In Paul R. Gregory and Valery Lazarev,

230 • References
eds., The Economics of Forced Labor: The Soviet Gulag. Stanford, CA: Hoover Institution Press.
Borras, Saturnino M. Jr., and Jennifer C. Franco. 2012. “Global Land Grabbing and Trajectories of Agrarian Change: A Preliminary Analysis.” Journal of Agrarian Change 12, no. 1: 34– 59.
Borras, Saturnino M. Jr., Jennifer C. Franco, Cristobal Kay, and Max Spoor. 2011. Land Grabbing in Latin America and the Ca rib be an Viewed from Broader International Perspectives. New York: United Nations. http:// www .tni .org /sites /www .tni .org /fi les /download /borras _franco _kay _ _spoor _land _grabs _in _latam _ _caribbean _nov _2011 .pdf .
Boston Common Asset Management. 2003. “Boston Common Asks Newmont Mining to Disclose Risks of Its Environmental and Social Liabilities.” News release, December 11. www .bostoncommonasset . com /news /newmont -disclosure .html .
Bourguignon, François, and Christian Morrisson. 2002. “In e qual ity among World Citizens: 1820– 1992.” American Economic Review 92, no. 4: 727– 744.
Brabeck- Lethame, Peter. 2012. “Water Can’t Be Free.” Big Think. www .youtube .com /watch ?v=rzaV8tg6hno. Accessed June 18, 2013.
Bradsher, Keith, and Andrew Pollack. 2011. “Nuclear Company to Compensate Evacuees in Japan.” New York Times. April 15.
Bräutigam, Deborah, and Tang Xiaoyang. 2011. “African Shenzhen: China’s Special Economic Zones in Africa.” Journal of Modern African Studies 49, no. 1: 27– 54.
Bronder, Larisa, Igor Kudrik, Alexander Nikitin, Kristin V. Jorgensen, and Vladislav Nikiforov. 2010. “Norilsk Nickel: The Soviet Legacy of Industrial Pollution.” Bellona Foundation, St. Petersburg.
Brothers, Caroline. 2011. “U.N. Reports Steady Rise of Refugees.” New York Times. June 19.
Brown, Desair. 2012. “Expert Answers Your Questions on Fracking.” USA Today. April 24.
Brunori, Margherita. 2013. “Indonesian Court Gives Land Rights Back to Millions of Indigenous.” LandPortal.info. June 21. Accessed June 30, 2013.
Bryson, John R., and Peter W. Daniels, eds. 2007. The Handbook of Ser vice Industries. Cheltenham: Edward Elgar Publishing.
Budapest Business Journal. 2013. “Gov’t to Extend Eviction Moratorium, Banks Opposed.” Budapest Business Journal. February 20.
“Bunker Hill Reports Profi table Quarter.” 1990. Spokane Chronicle. May 2.

References • 231
Bureau of Labor Statistics. 2012. “Employment, Hours, and Earnings from the Current Employment Statistics Survey (National).” www .bls .gov /data /#employment. Accessed January 5, 2013.
———. 2013. “Labor Force Statistics from the Current Population Survey.” United States Department of Labor. http:// data .bls .gov /pdq /SurveyOutputServlet. Accessed January 1, 2014.
Bureau of Land Management. 1996. “Notice of Intent to Prepare an Environmental Impact Statement (EIS) for the Midnite Uranium Mine (MUM) Reclamation.” Federal Register 61, no. 18: 2528.
Burgen, Stephen. 2013. “Spain Youth Unemployment Reaches Record 56.1%.” The Guardian. http:// www .theguardian .com /business /2013 / aug /30 /spain -youth -unemployment -record -high. Accessed January 1, 2014.
Burgers, Paul, and Ari Sustani. 2011. “Oil Palm Expansion in Riau Province, Indonesia: Serving People, Planet, Profi t?” Background paper for Eu ro pe an Report on Development. http:// erdreport .eu /erd / report _2011 /documents /researchpapers _susanti -burgers .pdf .
Calhoun, C. 2004. “A World of Emergencies: Fear, Intervention, and the Limits of Cosmopolitan Order.” Canadian Review of Sociology and Anthropology 41, no. 4: 373– 395.
Carrington, Damian. 2012. “The Himalayas and Nearby Peaks Have Lost No Ice in Past 10 Years, Study Shows.” Guardian. August 2.
Carter, Jimmy. 2011. “Call Off the Global Drug War.” New York Times. June 17.
Castle, Stephen. 2013. “Irish Legacy of Leniency on Mortgages Nears an End.” New York Times. March 30.
CBC. 2008. “Bottled Water: Quenching a Planet’s Thirst.” www .cbc .ca / news /background /consumers /bottled -water .html. Accessed January 22, 2013.
———. 2012a. “Mayor Rob Ford Wants to Banish Gun Convicts from Toronto.” Huffi ngton Post. July 20.
———. 2012b. “Rob Ford’s Ex- con Banishment Plan Won’t Fly, Says Minister.” CBC/Radio Canada. July 20.
Center for Housing Policy. 2012. “High- Cost Purchase Loans and Census Tract Level Foreclosure Data.” www .foreclosure -response .org /maps _ and _data /high _cost _maps .html. Accessed July 28, 2012.
Chang, Cindy. 2012. “In World of Prisons, Some Rural Parishes’ Econo-mies Hinge on Keeping Their Jails Full.” Times- Picayune. May 13. http:// www .nola .com /crime /index .ssf /2012 /05 /in _world _of _prisons _some _rural .html .

232 • References
Chatterjee, Partha. 2011. Lineages of Po liti cal Society: Studies in Postco-lonial Democracy. New York: Columbia University Press.
Cheng, Derek. 2012. “New Private Prison at Wiri Given Green Light.” New Zealand Herald, March 8.
Chesapeake Energy. 2012. “Hydraulic Fracturing Facts.” www . hydraulic fracturing .com /Pages /information .aspx. Accessed July 30, 2012.
Chestney, Nina. 2012. “Club of Rome Sees 2 Degree Celsius Rise in 40 Years.” Reuters. May 8.
CIA. 2012. “Country Comparison: Distribution of Family Income— GINI Index.” CIA World Factbook.
Clark, Colin. 2011. “Improving Speed and Transparency of Market Data.” NYSE EURONEXT [blog]. http:// exchanges .nyx .com /cclark / improving -speed -and -transparency -market -data .
Clarke, Tony. 2007. “Nestlé’s Water Wars: The Experience in North America.” Polaris Institute, Ottawa.
Clinton, Bill. 1993. “NAFTA Will Create 200,000 American Jobs in Two Years.” Philadelphia Inquirer. September 19.
CNNMoney Staff. 2013. “S&P 500 Above 1,800. Dow Hits Record Again.” CNNMoney. http:// money .cnn .com /2013 /11 /22 /investing / stocks -markets /. Accessed January 1, 2014.
Colchester, Marcus. 2011. Palm Oil and Indigenous Peoples in South East Asia. Rome: International Land Co ali tion.
Cole, Juan. 2013. “Asia Will Drown, Africa Will Starve in 30 Years: World Bank Report on Global Warming.” Informed Comment [blog]. www .juancole .com /2013 /06 /starve -report -warming .html. Accessed November 22, 2013.
CoreLogic. 2013a. “National Foreclosure Report.” www .corelogic .com / research /foreclosure -report /national -foreclosure -report -april -2013 . pdf. Accessed August 3, 2013.
———. 2013b. “CoreLogic Equity Report: First Quarter 2013.” http:// www .corelogic .com /research /negative -equity /corelogic -q1 -2013 -negative -equity -report .pdf. Accessed January 1, 2014.
Corporate Watch. n.d. “Nestle SA: Corporate Crimes.” www .corporate watch .org .uk /?lid=240. Accessed January 22, 2013.
Cotula, Lorenzo. 2011. The Outlook on Farmland Acquisitions. Rome: International Land Co ali tion.
Cotula, Lorenzo, and Kyla Tienhaara. 2013. “Reconfi guring Investment Contracts to Promote Sustainable Development.” In K. Sauvant, ed.,

References • 233
Yearbook on International Investment Law & Policy 2011– 2012, 281– 310. Oxford: Oxford University Press.
Cotula, Lorenzo, Sonja Vermeulen, Rebeca Leonard, and James Keeley. 2009. “Land Grab or Development Opportunity?: Agricultural Investment and International Land Deals in Africa.” Rome: FAO, IIED, and IFAD (Food and Agriculture Or ga ni za tion of the United Nations [FAO], the International Institute for Environment and Development [IIED], and the International Fund for Agricultural Development [IFAD]).
Coumou, D., and S. Rahmstorf. 2012. “A De cade of Weather Extremes.” Nature Climate Change 2: 491– 496.
Crystal Springs Preserve. 2013. “About Us.” http:// crystalspringspreserve . com /about -us /. Accessed July 13, 2013.
Daley, Suzanne. 2010. “In Spain, Homes Are Taken but Debt Stays.” New York Times. October 27.
Davies, Nigel. 2012. “Spain’s Economy Seen Contracting 1.4 Percent in 2012, 2013.” Reuters. November 7.
Davies, Peter J. 2009. “Radioactivity: A Description of Its Nature, Dangers, Presence in the Marcellus Shale and Recommendations by the Town of Dryden to the New York State Department of Environmental Conservation for Handling and Disposal of such Radioactive Materials.” Cornell University. www .tcgasmap .org /media /Radioactiv ity %20from %20Gas %20Drilling %20 SGEIS %20Comments %20by %20Peter %20Davies .pdf. Accessed November 23, 2013.
Day, Paul. 2013. “Spain’s Economy Shrinks for Seventh Straight Quarter.” Reuters. April 30.
Deaton, Angus. 2013. The Great Escape: Health, Wealth, and the Origins of In e qual ity. Prince ton, NJ: Prince ton University Press.
Deddy, Ketut. 2006. “Community Mapping, Tenurial Rights and Confl ict Resolution in Kalimantan.” In Fadzilah Majid Cooke, ed., States, Communities and Forests in Contemporary Borneo. Canberra: Australian National University Press.
Demelle, Brendan. 2011. “Natural Gas Industry Rhetoric versus Reality.” DeSmogBlog. www .desmogblog .com /natural -gas -industry -rhetoric -versus -reality. Accessed July 30, 2012.
Dempsey, Daniel. 2013. “Seeing in the Dark: The Rise of Dark Pools, and the Danger Below the Surface.” http://tabbforum.com/opinions / seeing-in-the-dark-the-rise-of-dark-pools-and-the-danger-they - present.

234 • References
DeNavas- Walt, Carmen, Bernadette D. Proctor, and Jessica C. Smith. 2011. Income, Poverty, and Health Insurance Coverage in the United States: 2010. U.S. Census Bureau, Current Population Reports. Washington, DC: U.S. Government Printing Offi ce.
De Schutter, Oliver. 2011. “The Green Rush: The Global Race for Farm-land and the Rights of Land Users.” Harvard International Law Journal 52, no. 2: 504– 559.
Dewan, Shaila. 2013. “A City Invokes Seizure Laws to Save Homes.” New York Times. July 30.
Diaz, R. J., and R. Rosenberg. 2008. “Spreading Dead Zones and Conse-quences for Marine Ecosystems.” Science 321, no. 5891: 926– 929.
Diggs, Morse. 2013. “Atlanta Police Chief Seeks to Banish Convicted Prostitute.” KDFW, Dallas, TX. January 28.
Doe Run Peru. n.d. “History of the Company.” www .doerun .com .pe / content /pagina .php ?pID=764. Accessed January 3, 2013.
Doe Run Resources Corporation. 2006. “United States Securities and Exchange Commission: Form 10- K.” Securities and Exchange Commission. www .sec .gov /Archives /edgar /data /1061112 /000110465906018264 /a06–5938 _110k .htm #Item2 _Properties _131244 .
Dossou, Paulin Jésutin, Simon B. Y. Allagbe, Tatiana DeSouza, Grégoire Noudaikpon, and Alexis N. Tovissohe. 2011. Evolution and Impacts of Coastal Land Use in Benin: The Case of the Sèmè- Podji Com-mune. Rome: International Land Co ali tion.
Drajem, Mark. 2012. “Fracking Tied to Unusual Rise in Earthquakes in U.S.” Bloomberg. April 12.
Duffy, P. B., and C. Tebaldi. 2012. “Increasing Prevalence of Extreme Summer Temperatures in the U.S.” Climatic Change 111, no. 2: 487– 495.
Duruibe, J. O., M. O. C. Ogwuegbu, and J. N. Egwurugwu. 2007. “Heavy Metal Pollution and Human Biotoxic Effects.” International Journal of Physical Sciences 2, no. 5: 112– 118.
eAfrica. 2005. “Case Study: Private Prisons.” South African Institute of International Affairs, August. www .saiia .org .za /archive -eafrica /case -study -private -prisons .html .
Earthworks. 2012. “Fort Belknap Reservation.” www .earthworksaction . org /voices /detail /fort _belknap _reservation. AccessedJuly 30, 2012.
Easterly, William. 2014. The Tyranny of Experts: Economists, Dictators, and the Forgotten Rights of the Poor. New York: Basic Books.

References • 235
Economic Policy Institute. 2008. “When Income Grows, Who Gains?” The State of Working America. http:// stateofworkingamerica .org /who -gains /# /?start=2000 & end=2007 .
———. 2011a. “Nearly Half of Family Income Goes to the Top Fifth, the Only Income Group with Increased Income Share since 1973.” The State of Working America. http:// stateofworkingamerica .org /charts / share -of -family -income -by -income -fi fth -1947–201 .
———. 2011b. “Family Income Growth in Two Eras.” The State of Working America. http:// stateofworkingamerica .org /charts /real -annual -family -income -growth -by -quintile -1947 -79 -and -1979 -2010 .
———. 2011c. “Wealth Skewed towards the Richest of the Rich.” The State of Working America. http:// stateofworkingamerica .org /charts / average -wealth -by -wealth -class -in -2009 .
———. 2011d. “Share of Total House hold Income Growth Attributable to Various Groups, 1979– 2007.” The State of Working America. http:// stateofworkingamerica .org /chart/swa-income -fi gure-2y-share -total-household/.
———. 2011e. “The Ratio of Average Top 1% Wealth to Median Wealth, 1962– 2010.” The State of Working America. http:// stateofwork ingamerica .org /chart/swa-wealth-fi gure-6c-ratio-top-1-wealth/.
———. 2011f. “Median House hold Wealth, by Race and Ethnicity, 1983– 2010 (2010 Dollars).” The State of Working America. http:// stateofworkingamerica .org /chart/swa-wealth-table-6-8-average -median-assets/.
———. 2011g. “Share of Total Household Wealth Growth Accruing to Various Wealth Groups, 1983– 2010.” The State of Working America. http:// stateofworkingamerica .org /chart/swa-wealth-fi gure-6b-share -total-household/.
———. 2013. “Average Family Income Growth, by Income Group.” The State of Working America. http:// stateofworkingamerica .org /data . Accessed February 9, 2013.
Economic Times. 2013. “Plachimada Anti- Coca Cola Unit Plans Stir.” http:// articles .economictimes .indiatimes .com /2013 -07 -12 /news /40536432 _1 _plachimada -claims -special -tribunal -bill -cola -unit. Accessed January 4, 2014.
Economist. 2011a. “One Degree Over: Data from Crop Trials Underline the Threat Climate Change Poses to Farmers.” Editorial, Economist. March 17.
236 • References
———. 2011b. “Shining a Light on Dark Pools.” http://www.econo mist.com/blogs/schumpeter/2011/08/exchange-share-trading . Accessed January 6, 2014.
Eggler, Bruce. 2007. “Despite Promises to Fix It, the Gulf’s Dead Zone Is Growing.” Times- Picayune. June 9.
El Defensor Chieftan. 2009. “Protestors to Fight ‘Water Grab.’ ” www . dchieftain .com /2009 /11 /18 /protesters -to -fi ght -water -grab. Accessed November 22, 2013.
Ellsworth, W. L., S. H. Hickman, A. L. Lleons, A. McGarr, A. J. Michael, and J. L. Rubinstein. 2012. “Are Seismicity Rate Changes in the Midcontinent Natural or Manmade?” Abstract of oral pre sen ta tion at the Seismological Society of America 2012 Annual Meeting.
Environment and Pro cess Division. 2004. “Mining- Related Chromate Water Pollution in the Sukinda Watershed (Orissa, India).” Bureau de Recherches Géologiques et Minières, Orléans, France.
Environment News Ser vice. 2010. “Chernobyl Radiation Killed Nearly One Million People: New Book.” April 26.
EPA. 1994. “Technical Report: Treatment of Cyanide Heap Leaches and Tailings.” EPA530- R-94- 037. U.S. Environmental Protection Agency, Offi ce of Solid Waste, Special Waste Branch.
———. 2000. “Chromium Compounds.” U.S. Environmental Protection Agency. Technology Transfer Network: Air Toxics Web Site. www .epa .gov /ttnatw01 /hlthef /chromium .html .
———. 2006. “Midnite Mine Superfund Site: Record of Decision.” Offi ce of Environment Cleanup, EPA Region 10. www .epa .gov /region10 /pdf /sites /midnite _mine /midnite -mine -rod -06 .pdf. Accessed June 22, 2013.
———. 2008. “Times Beach Site.” U.S. Environmental Protection Agency. www .epa .gov /superfund /sites /nplfs /fs0701237 .pdf .
———. 2012a. “Plutonium.” U.S. Environmental Protection Agency. March 6. www .epa .gov /rpdweb00 /radionuclides /plutonium .html .
———. 2012b. “EPA’s Recommendations for Enhanced Monitoring for Hexavalent Chromium (Chromium- 6) in Drinking Water.” U.S. Environmental Protection Agency. http:// water .epa .gov /drink /info / chromium /guidance .cfm .
Eskanazi, Stuart. 1998. “The Biggest Pump Wins.” Dallas Observer. November 19.
EuroHealthNet. 2011. “Greece— Augmentation of 40% Rate of Suicide.” Press release, Brussels, September 25.

References • 237
Eurojobs. 2012. “Quarter of Eu rope Risks Poverty or Social Exclusion.” Eurojobs [blog]. December 6. http:// blog .eurojobs .com /2012 /12 / quarter -of -europe -risks -poverty -or -social -exclusion. Accessed February 8, 2013.
Eu ro pe an Commission. 2011. “National Mea sures and Practices to Avoid Foreclosure Procedures for Residential Mortgage Loans,” Commis-sion staff working paper 357. March 31.
———. 2012. “Spain: Deep Adjustment Continues.” Eu ro pe an Economic Forecast, Autumn 2012. Brussels: Directorate General for Economic and Financial Affairs.
———. 2013. “FAQ on the EU- US Transatlantic Trade and Investment Partnership (‘TTIP’).” http:// trade .ec .europa .eu /doclib /docs /2013 /may /tradoc _151351 .pdf .
Eu ro pe an Mortgage Federation. 2007. Study on the Effi ciency of Mort-gage Collateral in the Eu ro pe an Union. Eu ro pe an Mortgage Federa-tion, Brussels.
Eurostat. 2012a. “At Risk of Poverty or Social Exclusion in the EU27: In 2011, 24% of the Population Were at Risk of Poverty or Social Exclusion.” News release 171/2012, December 3.
———. 2012b. “Income and Living Conditions.” Dec. 17. http:// epp . eurostat .ec .europa .eu /portal /page /portal /income _social _inclusion _liv ing _conditions /introduction .
———. 2012c. “Emigration by Sex, Age Group, and Citizenship.” European Commission. http://appsso.eurostat.ec.europe.eu/nui/show .do?dataset-migr_emi1ctz&lang-en. Accessed December 31, 2012.
———. 2013a. Second Estimate for the First Quarter of 2013. Euro Area GDP Down by 0.2% and EU27 Down by 0.1%, −1.1% and −0.7% Respectively compared with First Quarter of 2012. Publication no. 86/2013. Eu ro pe an Commission.
———. 2013b. Unemployment Statistics. http:// epp .eurostat .ec .europa .eu / statistics _explained /index .php /Unemployment _statistics. Accessed August 5, 2013.
———. 2013c. “Data Explorer: Unemployment Rate by Sex and Age Groups— Annual Average, %.” http:// appsso .eurostat .ec .europa .eu / nui /show .do ?dataset=une _rt _a & lang=en. Accessed January 1, 2014.
FAO. 2009. “CROPWAT 8.0 Decision Support System.” www .fao .org /nr / water /infores _databases _cropwat .html. Accessed December 6, 2013.

238 • References
Farrell, Diana, Susan Lund, Christian Fölster, Raphael Bick, Moira Pierce, and Charles Atkins. 2008. Mapping Global Capital Markets: Fourth Annual Report. New York: McKinsey and Co.
Fatima, Rabab, and Adnan Ahmed Sirajee. 2009. “Climate Change and Displacement in Bangladesh.” International Or ga ni za tion for Migration. November 16.
Favell, A. 2008. Eurostars and Eurocities: Free Movement and Mobility in an Integrating Eu rope. Oxford: Blackwell.
FEANTSA. 2011. Eu ro pe an Observatory on Homelessness. www . feantsa . org /spip .php ?article62 & lang=en. Accessed November 29, 2013.
Federal Bureau of Prisons. n.d. “BOP: Inmate Work Programs.” U.S. Department of Justice. www .bop .gov /inmate _programs /work _prgms .jsp .
Federal Reserve Bank of St. Louis. 2013a. “Corporate Profi ts after Tax (without IVA and CCAdj) (CP).” http:// research .stlouisfed .org /fred2 /graph /?s[1][id]=CP .
———. 2013b. “Nonfi nancial Corporate Business; Total Financial Assets, Level (TFAABSNNCB).” http:// research .stlouisfed .org /fred2 /series / TFAABSNNCB .
Ferreira, Francisco H. G., and Michael Walton. 2005. “The In e qual ity Trap: Why Equity Must Be Central to Development Policy.” Finance and Development 42, no. 4.
Field, C. B., V. Barros, T. F. Stocker, D. Qin, D. J. Dokken, K. L. Ebi, M. D. Mastrandrea, et al. 2012. IPCC: Managing the Risks of Extreme Events and Disasters to Advance Climate Change Adaptation. Special Report of Working Groups I and II of the Intergovernment Panel on Climate Change. Cambridge: IPCC.
Fisher, Max. 2011. “Map: U.S. Ranks Near Bottom on Income In e qual-ity.” Atlantic, September.
Fitzgerald, Joan. 2009. “Cities on the Front Lines.” The American Prospect. March 22. http:// prospect .org /article /cities -front -lines .
Foster, G., and S. Rahmstorf. 2011. “Global Temperature Evolution 1979– 2010.” Environmental Research Letters 6, no. 4.
Fouillet, A., G. Rey, F. Laurent, G. Pavillon, S. Bellec, C. Ghihenneuc- Jouyaux, J. Clavel, et al. 2006. “Excess Mortality Related to the August 2003 Heat Wave in France.” International Archives of Occupational and Environmental Health 80, no. 1.
References • 239
Founda, D., and C. Giannaopoulos. 2009. “The Exceptionally Hot Summer of 2007 in Athens, Greece— A Typical Summer in the Future Climate?” Global and Planetary Change 67, nos. 3– 4.
Frank, Andre Gunder. 1966. The Development of Underdevelopment. New York: Monthly Review Press.
FRED. 2013. “Compensation of Employees: Wages & Salary Accruals (WASCUR)/Gross Domestic Product (GDP).” St. Louis Federal Reserve. http:// research .stlouisfed .org /fred2 /graph /?g=2Xa. Accessed January 1, 2014.
Freeland, Chrystia. 2013. Plutocrats: The Rise of the New Global Super-Rich and the Fall of Everyone Else. New York: Penguin Books.
Freeland, Howard J., and Denis Gilbert. 2009. “Estimate of the Steric Contribution to Global Sea Level Rise from a Comparison of the WOCE One- Time Survey with 2006– 2008 Argo Observations.” Atmosphere- Ocean 47, no. 4: 292– 298.
Friends of Lead Free Children. 2009. “Friends of Lead Free Children: Helping to Create an Environment for Children to Achieve Their Full Learning Potential.” http:// friendsofl eadfreechildren .org /dominican _ programs .html. Accessed July 13, 2013.
Friis, Cecilie, and Anette Reenberg. 2010. Land Grab in Africa: Emerging Land System Drivers in a Teleconnected World. GLP Report No. 1. Copenhagen: GLP International Project Offi ce.
Furman Center. 2007. “New Housing Data Continue to Show Signs of Danger for New York City’s Homeowners, Furman Center Analysis Concludes.” Press release. Furman Center for Real Estate and Urban Policy, New York University. October 15.
Gagnon, Geoffrey. 2004. “Moving Mountains.” Legal Affairs, September– October.
Ganchev, K., M. Kearns, Y. Nevmyvaka, and J. W. Vaughn. 2009. “Cen-sored Exploration and the Dark Pool Problem.” Computer and Information Science, University of Pennsylvania. www .cis .upenn .edu /~mkearns . /papers /darkpools -fi nal .pdf .
Gans, Herbert J. 2013. “An Enduring Recession?” Challenge 56, no. 1: 72–87.
GAO. 2013. “Corporate Income Tax: Effective Rates Can Differ Signifi -cantly from Statutory Rate.” Washington, DC.
Ghosh, Palash. 2013. “A Cheap New Drug Decimating Greece’s Homeless as Economic Crisis Tightens Grip.” International Business Times. May 17.
240 • References
Gillis, Justin. 2013. “Heat- Trapping Gas Passes Milestone, Raising Fears.” New York Times. May 11.
Gilmore, Ruth Wilson. 2007. Golden Gulag: Prisons, Surplus, Crisis, and Opposition in Globalizing California. Berkeley: University of California Press.
Glick, Reuven, and Kevin J. Lansing. “FRBSF Economic Letter: Global House hold Leverage, House Prices, and Consumption.” 2010. Federal Reserve Bank of San Francisco. January 11.
Global Commission on Drug Policy. 2011. “The War on Drugs and HIV/AIDS: How the Criminalization of Drug Use Fuels the Global Pandemic.” www .globalcommissionondrugs .org /reports .
Global Insight. 2007. “The Mortgage Crisis: Economic and Fiscal Implications for Metro Areas.” United States Conference of Mayors and the Council for the New American City.
Global Research. 2010. “Coca- Cola Causes Serious Depletion of Water Resources in India.” March 24. www .globalresearch .ca /coca -cola -causes -serious -depletion -of -waterresources -in -india /18305. Accessed July 30, 2012.
Godoy, Julio. 2011. “New Sarcophagus for Chernobyl Will Have to Wait Until 2015.” Inter Press Ser vice. April 25.
Go Green America. 2011. “Great Pacifi c Garbage Patch.” GoGreenA-mericaTV .com. http:// gogreenamericatv .com /wp -content /uploads /2011 /11 /Great -Pacifi c -Garbage -Patch -picture .jpg. Accessed July 30, 2012.
Goldstein, Matthew. 2013. “Cheap Money Bankrolls Wall Street’s Bet on Housing.” Reuters. May 6.
Golovnina, Maria. 2005. “Interview— Norilsk Will Become Cleaner, but Not Overnight.” Reuters. October 12.
Gonzalez- Valero, Juan. 2009. “Climate, Land Degradation, Agriculture and Food Security: Means to Adopt.” Syngenta report. September 2009. www .wmo .int /wcc3 /sessionsdb /documents /WS10 _Gonzalez . pdf. Accessed July 30, 2012.
Graeber, David. 2012. Debt: The First 5,000 Years. Reprint edition. Brooklyn, NY: Melville House.
GRAIN. 2012. “GRAIN Releases Data Set with over 400 Global Land Grabs.” Press release, GRAIN, February 23.
Gray, Ellen. 2012. “Land Stat Top Ten: A Shrinking Sea, the Aral Sea.” NASA Earth Science News Team. July 23. www .nasa .gov /mission _ pages /landsat /news /40th -top10 -aralsea .html .
References • 241
“Greece Approves Sweeping Public Sector Cuts.” 2013. Telegraph. July 18.
Guerino, Paul, Paige M. Harrison, and WiIliam J. Sabol. 2012. “Prisoners in 2010.” Bureau of Justice Statistics, Offi ce of Justice Programs, U.S. Department of Justice. February 9. www.bjs.gov/content/pub/pdf / p10.pdf.
Hakkeling, R. T. A., L. R. Olderman, and W. G. Sombroek. 1991. World Map of the Status of Human- Induced Soil Degradation: An Explana-tory Note. Wageningen: International Soil Reference and Information Center.
Hall, Deborah. 2010. “Bottled Water Pits Nestlé vs. Greens.” Wall Street Journal. http:// online .wsj .com /article /SB10001424052748704414504575243921712969144 .html. Accessed November 29, 2013.
Hall, Ruth. 2011. “Land Grabbing in Africa and the New Politics of Food.” Policy Brief 041. Future Agricultures.
Hankewitz, Gert. 2013. “Foreclosures Peak Last Year.” Postimees: In En glish. February 7. http:// news .postimees .ee /1129916 /foreclosures -peak -last -year. Accessed August 3, 2013.
Hansen, J., M. Sato, and R. Ruedy. 2012. “Perception of Climate Change.” Proceedings of the National Academy of Sciences of the United States 109: 14726– 14727.
Harden, Blaine, and Dan Morgan. 2004. “Debate Intensifi es on Nuclear Waste: Lawmakers in Affected States Press Bush Administration on Cleanup.” Washington Post. June 2.
Harden, Mark. 2012. “Fracking in Colorado Uses a City’s Worth of Water, Enviro Report Says.” Denver Business Journal. June 20.
Harding, R. 2001. “Private Prisons.” Crime and Justice 28: 265– 346.Hart, B., and D. V. Boger. 2008. “Making an Unsustainable Industry More
Sustainable.” Proceedings of the Eleventh International Seminar on Paste 08 1, no. 1: 3– 14.
Hartman, Chester, and Gregory D. Squires, eds. 2013. From Foreclosure to Fair Lending. New York: New Village Press.
Harvey, David. 1982. The Limits of Capital. Chicago: University of Chicago Press.
Harvey, David W. 2000. “History of the Hanford Site 1943– 1990.” Pacifi c Northwest National Laboratory. http:// ecology .pnnl .gov /library / History /Hanford -History -All .pdf. Accessed January 4, 2013.
Held, David, and Ayse Kaya. 2007. Global In e qual ity: Patterns and Explanations. Cambridge: Polity.

242 • References
Hendryx, M. 2009. “Mortality from Heart, Respiratory and Kidney Disease in Coal Mining Areas of Appalachia.” International Archives of Occupational and Environmental Health 82: 243– 249.
Herivel, Tara, and Paul Wright, eds. 2003. Prison Nation: The Warehous-ing of America’s Poor. New York: Routledge.
Her Majesty’s Prison Ser vice. n.d.“Contracted- out Prisons.” www .justice .gov .uk /about /hmps /contracted -out .
HighQuest Partners. 2010. “Private Financial Sector Investment in Farmland and Agricultural Infrastructure.” OECD Food, Agriculture and Fisheries Papers, No. 33. August 10.
Home Offi ce. 2012. “Have You Got What It Takes? Working with Prisons.” www .homeoffi ce .gov .uk /publications /police /pcc /working -with -others /working -with -prisons ?view=Binary .
Hope, Kerin. 2013. “Greek Defl ation Accelerates after Wages Drop.” Financial Times. http:// www .ft .com /cms /s /0 /c8564ce8 -48ab -11e3 -8237 -00144feabdc0 .html #axzz2pGr9q4q0. Accessed January 1, 2014.
Hoshaw, Lindsey. 2009. “Afl oat in the Ocean, Expanding Islands of Trash.” New York Times. November 10.
Hovil, Lucy. 2010. Hoping for Peace, Afraid of War: The Dilemmas of Repatriation and Belonging on the Borders of Uganda and South Sudan. Research paper No. 196. Geneva: Policy Development and Evaluation Ser vice. United Nations High Commissioner for Refugees.
Humber, Yuriy. 2008. “Kremlin Sidelines Oligarchs in Taking Norilsk Control (Update1).” www .bloomberg .com /apps /news ?pid=newsarchive & sid=aLyndimCNJvY. Accessed November 23, 2013.
Hurdle, Jon. 2009. “Pennsylvania Lawsuit Says Drilling Polluted Water.” Reuters. November 9.
Huseynova, Shahnaz. 2007. “Azerbaijan: Sumgayit Becomes One of World’s Most- Polluted Cities.” Radio Free Eu rope/Radio Liberty. September 18.
Ideas First Research. 2010. “Sector— Metal & Mining: Industry— Ferroalloys.” Ideas First Research, Mumbai, India.
IFPRI (International Food Policy Research Institute). 2009. “Outsourc-ing’s Third Wave.” Economist. May 21.
Ifran, Zareena Begum, and Uvaneswari. 2012. “Determination of the Cost- Effective Adsorbents to Remove Toxic Metal Pollutants from Industrial Waste Water.” International Journal of Social Sciences and Interdisciplinary Research 1, no. 4.

References • 243
Illinois Department of Public Health. n.d. “Lead in Industry.” Illinois Department of Public Health. www .idph .state .il .us /about /epi / getpbout .htm .
ILO. 2012. “Global Unemployment: Trends for Youth 2012.” Interna-tional Labor Or ga ni za tion. Geneva, CH.
ILO and OECD. 2013. “Short- term Labour Market Outlook and Key Challenges in G20 Countries: Statistical Update for the Meeting of G20 Labour and Employment Ministers.” July 18– 19. Moscow. www .ilo .org /wcmsp5 /groups /public /---dgreports /---dcomm /---publ / documents /publication /wcms _217546 .pdf .
IMF. 2006. Global Financial Stability Report: Market Developments and Issues. Washington, DC: International Monetary Fund.
———. 2008. Global Financial Stability Report: Containing Risks and Restoring Financial Soundness. Washington, DC: International Monetary Fund.
———. 2012a. Global Financial Stability Report: Restoring Confi dence and Progressing on Reforms. Washington, DC: International Monetary Fund. www.imf.org/External/Pubs/FT/GFSR/2012/02/pdf/text.pdf.
———. 2012b. “World Economic and Financial Surveys.” World Eco-nomic Outlook Database. www .imf .org /external /pubs/ft /weo /2012/ 01/ weodata/ index.aspx. Accessed December 31, 2012.
Inman, Phillip, and Helena Smith. 2012. “Greek Economy to Shrink 25% by 2014.” Guardian. September 18.
Instituto Nacional de Estadística. 2011. “Eco nom ical ly Active Population Survey.” www .ine .es /en /inebmenu /mnu _mercalab _en .htm. Accessed November 29, 2013.
———. 2013a. “Labour Market.” Instituto Nacional de Estadística (Spain).———. 2013b. “Notas De Prensa: 30 de Abril de 2013.” Instituto
Nacional de Estadística (Spain). April 30. www .ine .es /prensa / cntr0113a .pdf .
Integrated Pollution Prevention and Control. 2012. “A Teaching Case: The Basel Ban and Batteries.” www .commercialdiplomacy .org /case _ study /case _batteries .htm .
International Atomic Energy Agency. n.d. “Frequently Asked Chernobyl Questions.” www .iaea .org /newscenter /features /chernobyl -15 /cherno -faq .shtml. Accessed January 4, 2013.
International Center for Prison Studies. 2011. “World Prison Population List.” University of Essex. www .apcca .org /uploads /9th _Edition _2011 .pdf .
244 • References
International Energy Agency. 2012. “Global Carbon- Dioxide Emissions Increase by 1.0 Gt in 2011 to Record High.” www .iea .org /news roomandevents /news /2012 /may /name ,27216 ,en .html. Accessed June 29, 2013.
International Land Co ali tion. Commercial Pressures on Land. http:// www .landcoalition .org /cpl .
International Monetary Fund. 2013. World Economic Outlook Database: April 2013 edition. http:// www.imf.org/external/ pubs/ft/weo /2013/01/weodata/index.aspx.
IPPC. 2003. “Integrated Pollution Prevention and Control (IPPC): Reference Document on Best Available Techniques for the Tanning of Hides and Skins.” Eu ro pe an IPPC Bureau (EIPPCB). http:// eippcb .jrc .es /reference /BREF /tan _bref _0203 .pdf .
ISDA (International Swaps Derivatives Association). 2008. Data on Credit-Default Swaps. http://www2.isda.org/.
Isidore, Chris. 2012. “Corporate Profi ts Hit Record as Wages Get Squeezed.” CNNMoney. http:// money .cnn .com /2012 /12 /03 /news / economy /record -corporate -profi ts /. Accessed January 1, 2014.
Islamzade, Arif. 1994. “Sumgayit: Soviet’s Pride, Azerbaijan’s Hell.” Azerbaijan International 2, no. 3: 26– 27, 30.
Jackson, Robert, Avner Vengosh, Thomas H. Darrah, Nathaniel R. Warner, Adrian Down, Robert Poreda, Stephen G. Osborn, Kaigung Zhao, and Jonathan D. Karr. 2013. “Increased Stray Gas Abundance in a Subset of Drinking Water Wells Near Marcellus Shale Gas Extraction.” Proceedings of the National Academy of Sciences of the United States 110, no. 28: 11213– 11214.
Jamasmie, Cecilia. 2012. “Doe Run Peru to Be Liquidated After Rejected Restructuring of La Oroya Smelter.” Mining .com. www .mining .com / doe -run -peru -to -be -liquidated -after -rejectedrestructuring -of -la -oroya -smelter .
Johnson, Kirk. 2011. “E.P.A. Links Tainted Water in Wyoming to Hydrau-lic Fracturing for Natural Gas.” New York Times. December 8.
Johnston, David Cay. 2005. Perfectly Legal: The Covert Campaign to Rig Our Tax System to Benefi t the Super Rich— and Cheat Everybody Else. New York: Penguin Group.
———. 2011. “Where’s the Fraud, Mr. President?” Reuters. December 13.———. 2013. “Corporate Tax Rates Plummet as Profi ts Soar.” The
National Memo. July 16Jones, Graydon. 1989. “Work Will Resume at Crescent Mine.” Spokane
Chronicle. April 28.

References • 245
Jones, P. D., D. H. Lister, and Q. Li. 2008. “Urbanization Effects in Large- Scale Temperature Rec ords, with an Emphasis on China.” Journal of Geophysical Research 113, no. D16: 1– 12.
Jorgensen, Dan. 2006. “Hinterland History: The Ok Tedi Mine and Its Cultural Consequences in Telefolmin.” Contemporary Pacifi c. September 22.
Jowit, Juliette. 2008. “Is Water the New Oil?” Observer. November 1.Joyce, Christopher. 2012. “Quakes Caused by Waste from Gas Wells,
Study Finds.” National Public Radio, April 11, 2012.Jubilee Debt Campaign. 2009. “2. How Big Is the Debt of Poor Countries?”
http:// jubileedebt .org .uk /faqs -2 .———. 2012. The State of Debt: Putting an End to 30 Years of Crisis.
Jubilee Debt Campaign, London.———. 2013. “How Big Is the Debt of Poor Countries?” Jubilee Debt
Campaign, London. http:// jubileedebt .org .uk /faqs -2 /how -big -is -the -debt -of -poor -countries .
Kahn, Hilary E. 2014. Framing the Global: Entry Points for Research. Bloomington: Indiana University Press.
Kaiser, Tania. 2010. “Dispersal, Division and Diversifi cation: Durable Solutions and Sudanese Refugees in Uganda.” Journal of Eastern African Studies 4, no. 1: 44– 60.
Karaian, Jason. 2013. “Spanish Real Estate Has Lost More Than a Third of Its Value, But It’s Still Overvalued.” Quartz. http:// qz .com /124088 / spanish -real -estate -has -lost -more -than -a -third -of -its -value -but -its -still -overvalued /. Accessed January 1, 2014.
Karoly, D. J. 2009. “The Recent Bushfi res and Extreme Heat Wave in Southeast Australia.” Bulletin of the Australian Meteorological and Oceanographic Society 22: 10– 13.
Katz, M. Jonathan. 2007. “Dominican Town Looks to Clean Up Pollu-tion.” Washington Post. June 20.
Kaul, B., R. S. Sandhu, C. Depratt, and F. Reyes. 1999. “Follow- up Screening of Lead- Poisoned Children near an Auto Battery Recycling Plant, Haina, Dominican Republic.” Environmental Health Perspec-tives 107, no. 11 (November): 917– 920.
Keep Tap Water Safe. 2013. “List of Bans Worldwide.” http:// keep tapwa tersafe .org /global -bans -on -fracking /. Accessed January 2, 2014.
Kelleher, James. 2007. “Signs of Life Returning to Times Beach.” Reuters. May 25.

246 • References
Kennedy, Loraine. 2005. “Variations on the Classical Model: Forms of Cooperation in Leather Clusters of Palar Valley, Tamil Nadu.” In Keshab Das, ed., Indian Industrial Clusters, 103– 227. Burlington: Ashgate.
Kenny, J. F., N. L. Barber, S. S. Hutson, K. S. Linsey, J. K. Lovelace, and M. A. Maupin. 2009. “Estimated Use of Water in the United States in 2005.” U.S. Geological Survey Circular 1344: 52. http:// pubs .usgs . gov /circ /1344 /.
Keohane, David. 2012. “The Decline of US Shadowing Banking, Charted.” Financial Times. May 29.
Keranen, Katie M., Heather M. Savage, Geoffy A. Abers, and Elizabeth S. Cochran. 2013. “Potentially Induced Earthquakes in Oklahoma, USA: Links between Wastewater Injection and the 2011 Mw 5.7 Earthquake Sequence.” Geology 41, no. 6: 699– 702.
Kinnard, Christophe, Christian M. Zdanowicz, David A. Fisher, Elisabeth Isaksson, Anne de Vernal, and Lonnie G. Thompson. 2011. “Recon-structed Changes in Arctic Sea Ice over the Past 1,450 Years.” Nature 479, no. 7374: 509– 512.
Kirkham, Chris. 2012. “Private Prisons Profi t from Immigration Crack-down, Federal and Local Law Enforcement Partnerships.” Huffi ngton Post. June 7.
Klauk, Erin. 2013a. “Environmental Impacts at Fort Belknap from Gold Mining.” Science Education Center, Carleton College.
———. 2013b. “Po liti cal Issues on the Fort Belknap Reservation from Gold Mining.” Science Education Center, Carleton College.
———. 2013c. “Exploration and Development History of Gold Mining at the Zortman- Landusky Mine.” Science Education Resource Center, Carleton College.
Knobel, Beth. 1997. “Secret Soviet City Opens Its Dirty Doors.” Living on Earth. August 1.
Knorr Cetina, K., and A. Preda, eds. 2013. The Oxford Handbook of the Sociology of Finance. Oxford: Oxford University Press.
Kocjan, John, Don Ogilvie, Adam Schneider, and Val Srinivas. 2012. “The Deloitte Shadow Banking Index.” www .deloitte .com /assets /Dcom -UnitedStates /Local %20Assets /Documents /CFO _Center _FT / US _FSI _The _Deloitte _Shadow _Banking _052912 .pdf. Accessed July 28, 2012.
Kopsini, Christina. 2012. “Drugs from Car Batteries.” [Greek] Kathime-rini. August 4. http:// news .kathimerini .gr /4dcgi /_w _articles _ell _2 _08 /04 /2012 _478530 .

References • 247
Krainer, John. 2009. “Housing Prices and Bank Loan Per for mance.” FRBSF Economic Letter 2009- 06. Federal Reserve Bank of San Francisco. February 6.
Kramer, Anna. 2012. “Q&A: La Oroya’s Future.” Oxfam America. www .oxfamamerica .org /articles /q -a -la -oroyas -future. Accessed January 8, 2013.
Krippner, G. R. 2011. Capitalizing on Crisis: The Po liti cal Origins of the Rise of Finance. Cambridge, MA: Harvard University Press.
Krotz, Dan. 2011. “Thawing Permafrost Could Release Vast Amounts of Carbon and Accelerate Climate Change by the End of This Century.” Berkeley Lab News Center RSS. August 22.
Krugman, Paul. 2010. “Trade Does Not Equal Jobs.” The Conscience of a Liberal [blog], New York Times. December 6.
Kubiszewski, Ida, Robert Constanza, Carol Franco, Philip Lawn, John Talberth, Tim Jackson, and Camille Alymer. 2013. “Beyond GDP: Mea sur ing and Achieving Global Genuine Progress.” Ecological Economics 93: 57– 68.
Kumhof, Michael, and Romain Rancière. 2010. “In e qual ity, Leverage and Crises.” Working paper WP/10/268. International Monetary Fund, Washington, DC.
LaFlure, Rebecca. 2013. “The Mess Gets Worse at Hanford’s Nuclear Site.” The Center for Public Integrity. Accessed January 5, 2014. http:// www .publicintegrity .org /2013 /11 /18 /13770 /mess -gets -worse -hanford -s -nuclear -site .
Lambin, Eric F., and Patrick Meyfroidt. 2011. “Global Land Use Change, Economic Globalization, and the Looming Land Scarcity.” PNAS 108, no. 9: 3465– 3472.
Land Matrix. 2013. “Why Do the Numbers Constantly Change?” Land Matrix. www .landmatrix.org/en. Accessed June 29, 2013.
———. 2014. The Online Public Database on Land Deals. http:// land portal .info /landmatrix .
Landes, David S. 1999. The Wealth and Poverty of Nations: Why Some Are So Rich and Some So Poor. New York: W. W. Norton & Company.
Leckie, S., Z. Simperingham, and J. Baker. 2011. “Bangladesh’s Climate Displacement Nightmare.” Ecologist [blog]. www .theecologist .org / blogs _and _comments /commentators /other _comments /854868 / bangladeshs _climate _displacement _nightmare .html. Accessed November 29, 2013.

248 • References
Leistner, Marilyn. 1995. “The Times Beach Story.” Synthesis/Regeneration 7– 8.
Lenntech. 2011. “Chromium and Water: Reaction Mechanisms, Environ-mental Impact and Health Effects.” Delft, Netherlands. www .lenntech .com /periodic /water /chromium /chromium -and -water .htm .
Lerner, Stephen, and Saqib Bhatti. 2013. “Forcing Banks to the Bargaining Table: Renegotiating Wall Street’s Relationship with Our Communi-ties.” In Chester Hartman and Gregory D. Squires, eds., From Foreclosure to Fair Lending, 177– 205. New York: New Village Press.
Levring, Peter. 2013. “Denmark Feeds World’s Biggest Home Debt Load as Caps Spurned.” Bloomberg. http:// www .bloomberg .com /news /2013 -11 -14 /denmark -feeds -world -s -biggest -private -debt -as -caps -rejected .html. Accessed January 1, 2014.
Levy, Dan, and Prashant Gopal. 2011. “Foreclosure Filings in U.S. May Jump 20% from Record 2010 as Crisis Peaks.” Bloomberg. January 13.
Lidsky, Theodore I., and Jay S. Schneider. 2002. “Lead Neurotoxicity in Children: Basic Mechanisms and Clinical Correlates.” Brain: A Journal of Neurology 126, no. 1: 5– 19.
Lima, Joao. 2013. “Bank of Portugal Forecasts Deeper Economic Con-traction This Year.” March 26. Bloomberg. March 26. http:// www .bloomberg .com /news /2013 -03 -26 /bank -of -portugal -forecasts -deeper -economic -contraction -this -year .html .
Liu, Yao, and Christoph B. Rosenberg. 2013. “Dealing with Private Debt Distress in the Wake of Eu ro pe an Financial Crisis.” Working paper 13/44. International Monetary Fund, Washington, DC.
Long, Katy. 2010. Home Alone? A Review of the Relationship between Repatriation, Mobility and Durable Solutions for Refugees. Geneva: United Nations High Commissioner for Refugees.
“Louisiana Incarcerated: How We Built the World’s Prison Capital.” 2012. Times- Picayune. May. www .nola .com /prisons .
Lucas, Linda E. 2005. Unpacking Globalization: Markets, Gender and Work. Kampala, Uganda: Makerere University Press.
Marcellus Drilling News. 2010. “List of 78 Chemicals Used in Hydraulic Fracturing Fluid in Pennsylvania.” June 10. http:// marcellusdrilling . com /2010 /06 /list -of -78 -chemicals -used -in -hydraulic -fracturing -fl uid -in -pennsylvania .
References • 249
Marcuse, Peter. 2014. “Blog #43—Who Lost the War on Poverty, and Who Won It?” Peter Marcuse’s Blog.WordPress.com.January 28. http://pmarcuse.wordpress.com/2014/01/25/blog-43-who-lost -the-war-on-poverty-and-who-won-it/.
Margulis, Matias E., Nora McKeon, and Saturnino M. Borras. 2013. “Land Grabbing and Global Governance: Critical Perspectives.” Globalizations 10, no. 1: 1– 23.
Mason, Cody. 2012. “Too Good to Be True: Private Prisons in America.” Sentencing Project, January. http:// sentencingproject .org /doc /publi cations /inc _Too _Good _to _be _True .pdf .
Massey, Steve. 1991a. “Bunker Hill Found er Says Insiders Clean.” Spokane Chronicle. September 27.
———. 1991b. “Bunker Hill Sale Yields Much Less than Predictions.” Spokane Chronicle. August 30.
Mattera, Philip. 2006. “Still, Not So Sterling: A Look at Revett Minerals.” Clark Fork Co ali tion and Rock Creek Alliance. www .earthworksac tion .org /fi les /pubs -others /FS _StillNotSoSterling .pdf .
Mayer, Judith. 2009. “The Trouble with Palm Oil.” Indonesia Today. www .insideindonesia .org /feature -editions /the -trouble -with -oil -palm. Accessed July 1, 2013.
McClesky, Claire O’Neill. 2012. “Mexico to Build 2 Private Prisons by Year- End.” Insight Crime. August 2. www .insightcrime .org /news -briefs /mexico -to -build -2 -private -prisons -by -year -end .
McClure, Robert. 2001. “Pegasus Gold— from Boom to Bankruptcy.” Seattle Post- Intelligencer. June 13.
McCormack, Simon. 2012. “Prison Labor Booms as Unemployment Remains High; Companies Reap Benefi ts.” Huffi ngton Post. December 10.
McDonald, Douglas C. 1992. “Private Penal Institutions.” Crime and Justice 16: 361– 419.
McKibben, Bill. 2012. “Global Warming’s Terrifying New Math: Three Simple Numbers That Add Up to Global Catastrophe— and That Make Clear Who the Real Enemy Is.” Rolling Stone. July 19.
McMichael, Philip. 2009. “A Food Regime Genealogy.” The Journal of Peasant Studies 36, no. 1: 171– 196.
McQuaid, John. 2012. “Finally, a Victory against Mountaintop Removal.” Slate. November 30.
McTighe, Laura. 2012. “The War on Drugs Is a War on Relationships: Crossing the Borders of Fear, Silence and HIV Vulnerability in the
250 • References
Prison- Created Diaspora.” In Beyond Walls and Cages: Bridging Prison Abolition and Immigrant Justice Movements, ed. Jenna Loyd, Matthew Mitchelson, and Andrew Burridge. Athens: University of Georgia Press.
———. 2013. “Privatizing Punishment: A Global Analysis of Private Prison Expansion in 2005.” (Unpublished paper).
Michigan Citizens for Water Conservation. 2012. “History Highlights.” www .savemiwater .org /about /history. Accessed January 22, 2013.
Milanovic, Branko. 2005. Worlds Apart: Mea sur ing International and Global In e qual ity. Prince ton: Prince ton University Press.
———. 2009. Global In e qual ity Recalculated. Working paper no. 5061. World Bank.
———. 2011. “Global In e qual ity: From Class to Location, from Proletar-ians to Migrants.” Working Paper no. 5820. World Bank.
———. 2012. “Global In e qual ity: From Class to Location, from Proletar-ians to Migrants.” Global Policy 3, no. 2: 125– 134.
Miles, David K., and Vladimir C. Pillonca. 2008. “Financial Innovation and Eu ro pe an Housing and Mortgage Markets.” Oxford Review of Economic Policy 24, 1: 145– 175.
Mineral Policy Center. 2000. “Cyanide Leach Mining Packet.” August. www4 .nau .edu /itep /waste /HazSubMap /docs /Mining /Cyanide _Leach _Packet .pdf. Accessed July 13, 2013.
Mines and Communities. 2003. “Hell on Earth.” www .minesandcommu nities .org /article .php ?a=1409. Accessed June 15, 2013.
Mining Truth. 2012. “How Corporations Evade Liability for Pollution at Closed Mines.” Mining Truth. www .miningtruth .org /wp -content / uploads /2013 /01 /How -Corporations -Evade -Liability -Mining -Truth .pdf. Accessed June 23, 2013.
Mishel, Lawrence. 2007. “Who’s Grabbing All the New Pie? Eco-nomic Snapshots.” Economic Policy Institute, Washington, DC. August 1.
———. 2011. “Huge Disparity in Share of Total Wealth Gain since 1983.” Economic Policy Institute, Washington, DC. September 15.
———. 2013. “Economy Built for Profi ts Not Prosperity.” Economic Policy Institute, Washington, DC. March 28.
Mishel, Lawrence, and Jared Berstein. 2007. “Economy’s Gains Fail to Reach Most Workers’ Paychecks.” Economic Policy Institute, Washington, DC. August 30.
References • 251
Mishel, Lawrence, and Josh Bivens. 2011. “Occupy Wall Streeters Are Right about Skewed Economic Rewards in the United States.” Economic Policy Institute, Washington, DC. October 26.
Mishel, Lawrence, Josh Bivens, Elise Gould, and Heidi Shierholz. 2012. The State of Working America. 12th ed. Ithaca, NY: Cornell Univer-sity Press.
Mishel, Lawrence, and Heidi Shierholz. 2011. “The Sad but True Story of Wages in America.” Issue Brief #297. Economic Policy Institute, Washington, DC. March 14.
Mitchell, Josh. 2013. “More Americans Living in Others’ Homes.” Wall Street Journal. July 22.
Mitchell, Larry D. 2004. “Zortman and Landusky Mines: Water Quality Impacts.” Environmental Quality Council, Helena, MT. Accessed January 9, 2013.
Moir, Matt. 2013. “Idle No More and Canada’s Prison Apartheid.” The Tyee. January 2. 2013.
Molnar, Augusta, Keith Barney, Michael DeVito, Alain Karsenty, Dominic Elson, Margarita Benavides, Pedro Tipula, Carlos Soria, Phil Shear-man, and Marina France. 2011. Large Acquisition of Rights on Forest Lands for Tropical Timber Concessions and Commercial Wood Plantations. Rome: International Land Co ali tion.
Morris, Tim. 2009. “Louisiana’s Incarceration Rate Is No. 1 in Nation.” Times- Picayune. March 2.
Moyo, Dambisa. 2010. Dead Aid: Why Aid Is Not Working and How There Is Another Way for Africa. London: Penguin.
Murphy, Kevin. 1996. “In a Fouled Jungle, Tribes Win One.” New York Times. June 12.
Murphy, Sophia. 2013. “Land Grabs and Fragile Food Ecosystems: The Role of Globalization.” Institute for Agriculture and Trade Policy, Minneapolis, MN.
NASA. “Mea sur ing Vegetation (NDVI & EVI): Feature Articles.” Earth Observatory. http:// earthobservatory .nasa .gov /Features /Measuring Vegetation /measuring _vegetation _2 .php .
———. n.d. http:// earthobservatory.nasa.gov /Features /WorldOfChange /aral_sea.php.
National Climatic Data Center. 2013a. “Billion- Dollar Weather/Climate Disasters.” www .ncdc .noaa .gov /billions /. Accessed November 22, 2013.

252 • References
———. 2013b. “Drought- August 2013.” www .ncdc .noaa .gov /sotc / drought /2013 /8. Accessed November 22, 2013.
National Prisoner Statistics Program. 2013. “Prisoners in 2010 (Revised).” Bureau of Justice Statistics, U.S. Department of Justice. http:// bjs .ojp .usdoj .gov /index .cfm ?ty=pbdetail & iid=2230. Accessed February 8, 2013.
National Wildlife Federation. 2012. “Hard Rock Mining Pollution.” National Wildlife Federation. www .nwf .org /Wildlife /Policy /Mining -Loopholes .aspx .
Nellas, Demetris. 2013. “Greek Bill Opens Way for Civil Ser vice Layoffs.” Associated Press. April 28.
Neumann, Jeannette. 2013. “Blackstone, Deutsche Bank in Talks to Sell Bond Backed by Home Rentals.” Wall Street Journal. July 30.
Newmont Mining Corporation. 1998. “Form 10- K.” Securities and Exchange Commission. www .sec .gov /answers /form10k .htm. Accessed June 23, 2013.
———. 2012. “Newmont Announces Record Operating Cash Flow of $3.6 Billion and Record Annual Revenue of $10.4 Billion in 2011.” Press release. Newmont Mining Corporation, Denver, CO. February 23.
New York Times. 2001. “Mine in Wilderness Approved After 14 Years.” New York Times. December 28.
Nigeria Intel. 2012. “Privatising the Prisons.” Nigeria Intel. December 17. www .nigeriaintel .com /2012 /12 /17 /privatising -the -prisons .
NOAA. 2011. “State of the Climate: Global Hazards for August 2011.” National Climatic Data Center, National Oceanic and Atmospheric Administration, Washington, DC.
———. 2012a. “State of the Climate: Global Hazards for July 2012.” National Climatic Data Center, National Oceanic and Atmospheric Administration, Washington, DC. www.ncdc.noaa.gov/sotc / national/2012/7 (published online Aug 2012).
———. 2012b. “Wildfi res— August 2012.” http:// www .ncdc .noaa .gov /sotc /fi re /2012 /8. Accessed January 4, 2014.
———. 2013a. “Billion- Dollar Weather/Climate Disasters.” www .ncdc .noaa .gov /billions /. Accessed November 22.
———. 2013b. “Drought- August 2013.” www .ncdc .noaa .gov /sotc / drought /2013 /8. Accessed November 22, 2013.
———. n.d. http://marinedebris.noaa.gov/sites/default/fi les/GPmap_2012 _NOAAMDP.jpg.
Noorani, Shehzad. 2008. “Children of the Black Dust.” CNN. September 28.
References • 253
Norilsk Nickel. 2008. “History: Mastering Norilsk Ore Deposits.” www .nornik .ru /en /about /history. Accessed June 13, 2013.
Novinite. 2011. “Bulgaria: Foreclosure Auctions Jump in 2011.” Novinite [Sofi a News Agency]. www .balkaninsight .com /en /article /bulgaria -foreclosure -auctions -jump -in -2011. Accessed August 3, 2013.
Novo, Andre, Kees Jansen, Maja Slingerland, and Ken Giller. 2010. “Biofuel, Dairy Production and Beef in Brazil: Competing Claims on Land Use in São Paulo State.” The Journal of Peasant Studies 37, no. 4: 769– 792.
OECD. 2008. Growing Unequal? Income Distribution and Poverty in OECD Countries. Paris: OECD.
———. 2011. Divided We Stand: Why In e qual ity Keeps Rising. Paris: OECD.
———. 2012. “Annex Table 27: General Government Financial Balances.” Economic Outlook Annex Tables. www.oecd.org/eco/outlook/economi c outlookannextables.htm.
———. 2013a. “Economic Outlook No. 93— June 2013— Flash File.” February 8. http:// stats .oecd .org /Index .aspx ?DataSetCode=EO93 _ FLASHFILE _EO93 .
———. 2013b. “Income Distribution and Poverty.” OECD. Stat Extracts. http://stats.oecd.org/index.aspx?DataSetCode-IDD.
———. 2013c. “Incidence of Involuntary Part Time Workers.” http:// stats .oecd .org /Index .aspx ?DatasetCode=INVPT _I .
———. 2013d. “OECD: Stat Extracts.” http:// stats .oecd .org /. Accessed January 1, 2014.
———. 2014. “Central Government Debt.” OECD.Stat Extracts. http://stats.oecd.org/index.aspx?queryid-8089.
Offi ce of the United States Trade Representative. 2013a. “Free Trade Agreements.” www .ustr .gov /trade -agreements /free -trade -agreements .
———. 2013b. “Negotiations for the Transatlantic Trade and Investment Partnership Have Begun.” Press release, July 8. www.ustr.gov / about- us/press- offi ce/blog/2013/july/ TTIP- negotiations- begin.
———. 2013c. “The United States in the Trans- Pacifi c Partnership.” Online fact sheet. www.ustr.gov/about- us/press- offi ce/fact- sheets /2011/november/united- states- trans- pacifi c- partnership.
Olson- Sawyer, Kai. 2012. “Really? Shale Gas Fracking Uses a Lot of Water? Really!” Grace Communications Foundation. April 3. www . gracelinks .org /blog /901 /really -shale -gas -fracking -uses -a -lot -of -water -really .

254 • References
Ortiz, Isabel, and Matthew Cummins. 2013. The Age of Austerity: A Review of Public Expenditures and Adjustment Mea sures in 181 Countries. New York: Initiative for Policy Dialogue. Geneva: The South Centre.
Oxfam. 2012. “Our Land, Our Lives: Time Out on the Global Land Rush.” Oxfam Briefi ng Note. October.
Pager, Devah, Bruce Western, and Bart Bonikowski. 2009. “Discrimina-tion in a Low- Wage Labor Market: A Field Experiment.” Discussion paper No. 4469. Institute for the Study of Labor, Bonn.
Palmer, Lisa. 2013. “Q and A: The Angry Economist.” Green: A Blog about Energy and the Environment. New York Times. March 1.
Palmer, M. A., E. S. Bernhardt, W. H. Schlesinger, K. N. Eshleman, E. FouFoula- Georgiu, M. S. Hendryx, A. D. Lemly, G. E. Likens, O.L Loucks, M. E. Power, P. S. White, and P. R. Wilcock. 2010. “Moun-taintop Mining Consequences.” Science 327: 148– 149.
Papademetriou, D., and A. Terrazas. 2009. “Immigrants and the Current Economic Crisis: Research Evidence, Policy Challenges, and Implica-tions,” Migration Policy Institute, Washington, DC.
Parenti, Christian. 2008. Lockdown America. London: Verso.Paris, Costas, Matina Stevis, and Stelios Bouros. 2012. “Eurozone Meets on
New Greek Aid Deal.” Dow Jones Financial News. February 9.Patoski, Joe Nick. 2011. “Water Policy in Legislature Rode on One
Word.” New York Times, June 9.Patterson, Scott. 2013. “Dark Pools Face Scrutiny.” Wall Street Journal.
http:// online .wsj .com /news /articles /SB10001424127887324069104578527361102049152. Accessed November 25, 2013.
Pender, James S. 2008a. “Community- Led Adaptation in Bangladesh.” Forced Migration Review 31: 54– 55.
———. 2008b. “What Is Climate Change? And How It Will Affect Bangladesh?” Briefi ng paper. Church of Bangladesh Social Develop-ment Programme, Dhaka.
Penn, Ivan. 2008. “The Profi ts on Water Are Huge, but the Raw Material Is Free.” Tampa Bay Times. March 16.
Peralta, Eyder. 2011. “Pa. Judge Sentenced to 28 Years in Massive Juvenile Justice Bribery Scandal.” National Public Radio. August 11.
Perlez, Jane, and Kirk Johnson. 2005. “Behind Gold’s Glitter: Torn Lands and Pointed Questions.” New York Times. October 24.
Pettit, Kathryn L. S., and Kim Rueben. 2012. “Investor- Owners in the Boom and Bust.” MetroTrends. www .metrotrends .org /Commentary / mortgage -lending .cfm. Accessed July 13, 2012.

References • 255
Pew Center on the States. 2008. One in 100: Behind Bars in America 2008. Washington, DC: Pew Charitable Trusts.
———. 2009. One in 31: The Long Reach of American Corrections. Washington, DC: Pew Charitable Trusts.
———. 2010. Prison Count 2010: State Population Declines for the First Time in 38 Years. Washington, DC: Pew Charitable Trusts.
Phillips, Jonathan D. 2004. “Impacts of Surface Mine Valley Fills on Headwater Floods in Eastern Kentucky.” Environmental Geology 45, no. 3: 367– 380.
Pilkington, Ed. 2008. “The Village at the Tip of the Iceberg.” Guardian. September 27.
Pino, Isaac, Charlie Kannel, and Tom Gardner. 2012. “How Dow Chemical Can End the Tragedy in Bhopal.” Motley Fool. July 27.
Pistor, Katharina. 2002. “The Standardization of Law and Its Effect on Developing Economies.” The American Journal of Comparative Law 50, no. 1: 97– 130.
PMEL. 2012. Hawaii Carbon Dioxide Time Series. PMEL Carbon Program, National Oceanic and Atmospheric Administration, Washington, DC.
Porter, Lynn. 2004. “Introduction to Hanford Issues.” Hanford Watch. www .hanfordwatch .org /introduction .htm. Accessed January 9, 2013.
Portes, Alejandro. 2010. Economic Sociology: A Systematic Inquiry. Prince ton, NJ: Prince ton University Press.
Pouiller, Francisca. 2010. “Doe Run Workers Protest to Demand Smelter Reopen.” Miningweekly .com. June 14.
Powley, Tanya, and Lucy Warwick- Ching. 2012. “Stateless and Super- rich.” Financial Times. April 28.
Poynter, Bilbo. 2012. “Private Prison Companies Look to Canada as Industry Faces Lawsuits in US.” Guardian. June 19.
“Prison Population Around the Globe.” 2008. [Graphic.] New York Times. April 22.
Prison Reform Trust. 2013. “Background to Private Prisons.” www . prisonreformtrust .org .uk /ProjectsResearch /Privatesectorprisons. Accessed Jan. 4, 2013.
Productschap Margerine, Vetten en Oliën. 2011. “Fact Sheet Palm Oil.” www .mvo .nl /LinkClick .aspx ?fi leticket=jsFVMZwZzkc %3D. Accessed June 27, 2013.
Provost, Claire. 2012. “New International Land Deals Database Reveals Rush to Buy up Africa.” Guardian. April 27.
256 • References
Public Citizen. 2013. “On Anniversary of U.S.- Korea FTA Implementa-tion, U.S. Exports Down 9 Percent, Imports from Korea Up and Defi cit with Korea Swells 30 Percent, Undermining Obama Export and Job Growth Goals.” Press release. March 14. www .citizen .org /documents / press -release -korea -fta -one -year -anniversary .pdf .
Public Ser vices International Research Unit. 2005a. Prison Privatisation Report International. Report no. 67, March/April. Public Ser vices International Research Unit, University of Greenwich.
———. 2005b. Prison Privatisation Report International. Report no. 68, May/June. Public Ser vices International Research Unit, University of Greenwich.
———. 2005c. Prison Privatisation Report International. Report no. 69, July/August. Public Ser vices International Research Unit, University of Greenwich.
———. 2005d. Prison Privatisation Report International. Report no. 70, Sept./Oct. Public Ser vices International Research Unit, University of Greenwich.
Putzel, Louis, Samuel Assembe- Mvondo, Laurentine Bilogo Bi Ndong, Reine Patrick Banioguila, Paolo Cerutti, Julius Chupezi Tieguhong, Robinson Djeukam, Noël Kabuyaya, Guillaume Lescuyer, and William Mala. 2011. “Chinese Trade and Investment and the Forests of the Congo Basin: Synthesis of Scoping Studies in Camer-oon, Demo cratic Republic of Congo and Gabon.” Working paper no. 67. Center for International Forestry Research, Bogor, Indonesia.
Quijano, Aníbal. 2007. “Coloniality and Modernity/Rationality.” Cultural Studies 21, nos. 2– 3: 168– 178.
Ramesh, Randeed. 2009. “Bhopal Water Still Toxic 25 Years After Deadly Gas Leak, Study Finds.” Guardian. December 1.
Ravanera, Roel R., and Vanessa Gorra. 2011. Commercial Pressures on Land in Asia: An Overview. Rome: International Land Co ali tion.
Rawat, Vidya Bhushan, Mamidi Bharath Bhushan, and Sujatha Surepally. 2011. The Impact of Special Economic Zones in India: A Case Study of Polepally SEZ. Rome: International Land Co ali tion.
Ray, M. K. 2013. “The Water Grab on the Augustin Plains.” Sierra Club. http:// southern .nmsierraclub .org /water -grab -on -the -augustin -plains. Accessed November 22, 2013.
RealtyTrac. 2007. “More than 1.2 Million Foreclosure Filings Reported in 2006.” February 8. www .realtytrac .com /content /press -releases

References • 257
/ more -than -12 -million -foreclosure -fi lings -reported -in -2006 -2234. Accessed July 17, 2012.
———. 2008. “U.S. Foreclosure Activity Increases 75 Percent in 2007.” January 30. www .realtytrac .com /content /press -releases /us -foreclo sure -activity -increases -75 -percent -in -2007 -3604. Accessed July 17, 2012.
———. 2009. “2008 Year- End Foreclosure Market Report.” February 5. www .realtytrac .com /content /news -and -opinion /2008 -year -end -foreclosure -market -report -4621. Accessed July 17, 2012.
———. 2011. “Record 2.9 Million U.S. Properties Receive Foreclosure Filings in 2010 Despite 30- Month Low in December.” January 12. www .realtytrac .com /content /foreclosure -market -report /record -29 -million -us -properties -receive -foreclosure -fi lings -in -2010 -despite -30 -month -low -in -december -6309. Accessed July 17, 2012.
———. 2012a. “February 2012 U.S. Foreclosure Market Report: Foreclo-sure Tide Rising in Half of Largest Metro Areas.” March 13. www . realtytrac .com /content /foreclosure -market -report /february -2012 -us -foreclosure -market -report -7069. Accessed July 13, 2012.
———. 2012b. “Foreclosure Trends.” www .realtytrac .com /trendcenter. Accessed July 28, 2012.
———. 2013a. “All- Cash and Institutional Investor Purchases down from Year Ago in June but Short Sales Continue to Increase.” www . realtytrac .com /content /foreclosure -market -report /us -residential -sales -report -june -2013 -7812. Accessed August 3, 2013.
———. 2013b. “Single Family Home Flipping Increases 19 Percent in First Half of 2013 While Profi ts Soar.” www .realtytrac .com /content / foreclosure -market -report /us -residential -sales -report -june -2013 -7812. Accessed August 3, 2013.
Reich, Robert B. 2011. Aftershock: The Next Economy and America’s Future. New York: Vintage.
Reuters. 2013. “PNG Government Takes Full Own ership of Ok Tedi Mine.” http:// www .reuters .com /article /2013 /09 /19 /png -oktedi -idUSL3N0HF0VC20130919. Accessed January 4, 2014.
Right to Water and Sanitation. 2010. “Case against Coca- Cola Kerala State: India.” August 20. www .righttowater .info /ways -to -infl uence / legalapproaches /case -against -coca -cola -kerala -state -india. Accessed January 9, 2013.
Rignot, E., I. Velicogna, M. R. van den Broeke, A. Monaghan, and J. T. M. Lenaerts. 2011. “Acceleration of the Contribution of the Greenland

258 • References
and Antarctic Ice Sheets to Sea Level Rise.” Geophysical Research Letters 38, no. 5: L05503.
Robles, Frances. 2007. “Pollution Sickens Children in Dominican Republic.” Miami Herald. March 13.
Rodriguez, Michelle Natividad, and Maurice Emsellem. 2011. 65 Million “Need Not Apply”: The Case for Reforming Criminal Background Checks for Employment. National Employment Law Project, New York.
Rogers, Simon, and Lisa Evans. 2011. “World Carbon Dioxide Emissions Data by Country: China Speeds Ahead of the Rest.” Guardian. January 31.
Romm, Joe. 2011. “Shale Shocked: ‘Highly Probable’ Fracking Caused U.K. Earthquakes, and It’s Linked to Oklahoma Temblors.” Think Progress. http:// thinkprogress .org /climate /2011 /11 /02 /360014 /shale -fracking -earthquakes. Accessed June 26, 2013.
Roth, Mitchel P. 2006. Prisons and Prison Systems: A Global Encyclope-dia. Westport, CT: Greenwood, 2006.
Rothkopf, David J. 2009. Superclass: The Global Power Elite and the World They Are Making. New York: Farrar, Straus and Giroux.
Royal Tropical Institue. 2012. “Indonesia: Food Security and Land Governance Tenure.” IS Academy on Land Governance for Equitable and Sustainable Development, Netherlands Ministry of Foreign Affairs, Amsterdam.
Rubio, Blanca. 2003. Explotados y Excluidos: Los Campesinos Latino-americanos en la Fase Agroexportadora Neoliberal. Mexico City: Plaza y Valdés, S.A. de C.V.
Ruditsky, Jake. 2004. “Toxic Felis: A Visit to Rus sia’s Most Polluted City.” The Exile (Moscow). June 24.
Rulli, Maria Cristina, Antonio Saviori, and Paolo D’Odorico. 2013. “Global Land and Water Grabbing.” Proceedings of the National Academy of Sciences of the United States 110, no. 3: 892– 897.
Rupp, D. E., P. W. Mote, N. Massey, C. J. Rye, and M. Allen. 2012. “Did Human Infl uence on Climate Make the 2011 Texas Drought More Probable?” Bulletin of the American Meteorological Society 93, no. 7 (July): 1053– 1057.
Saez, Emmanuel. 2010. “Striking It Richer: The Evolution of Top Incomes in the United States (Updated with 2008 Estimates).” Department of Economics, University of California, Berkeley.
Salem- News. 2013. “US Energy Department Announces It Still Plans to Use Hanford as a National Radioactive Waste Dump.” http:// www

References • 259
.salem -news .com /articles /december132013 /hanford -waste .php. Accessed January 5, 2014.
Samek, Kelly. 2004. “Unknown Quantity: The Bottled Water Industry and Florida’s Springs.” Journal of Land Use 19, no. 2: 569– 595.
Sampaniotis, Theodosios. 2013. “Greek Real Estate Market: Prices and Activity Decline Escalates, Uncertainty Increases.” Eurobank. http:// www .eurobank .gr /Uploads /Reports /GREECE %20Macrofebruary %202013 .pdf. Accessed January 1, 2014.
Sample, Ian. 2007. “Global Food Crisis Looms as Climate Change and Population Growth Strip Fertile Land.” Guardian. August 31.
Sangham, A. S., and the Plachimada Struggle Solidarity Committee. 2010. “A Call to Struggle . . . for Water . . . for Life.” Kerala Letter [blog]. http:// keralaletter .blogspot .com /2010 /01 /call -to -strugglefor -waterfor -life .html. Accessed July 30, 2012.
Santer, B. D., K. E. Taylor, T. M. L. Wigley, J. E. Penner, P. D. Jones, and U. Cubasch. 1995. “Towards the Detection and Attribution of an Anthropogenic Effect on Climate.” Climate Dynamics 12, no. 2: 77– 100.
Santoso, Puji, and Jon Afrizal. 2004. “Two Killed, Five Injured in Riau Land Disputes.” Jakarta Post. November 24.
Sassen, Saskia. 1988. The Mobility of Labor and Capital: A Study in International Investment and Labor Flow. Cambridge: Cambridge University Press.
———. 2001. The Global City: New York, London, Tokyo. Revised 2nd ed. Prince ton, NJ: Prince ton University Press.
———. 2008a. “A Bad Idea: Using a Financial Solution to the Financial Crisis.” Huffi ngton Post. November 20.
———. 2008b. “Mortgage Capital and Its Particularities: A New Frontier for Global Finance.” Journal of International Affairs 62, no. 1: 187– 212.
———. 2008c. Territory, Authority, Rights: From Medieval to Global Assemblages. 2nd ed. Prince ton, NJ: Prince ton University Press.
———. 2008d. “Two Stops in Today’s New Global Geographies: Shaping Novel Labor Supplies and Employment Regimes.” American Behav-ioral Scientist 52, no. 3: 457– 496.
———. 2010. “A Savage Sorting of Winners and Losers: Contemporary Versions of Primitive Accumulation.” Globalizations 7, no. 1: 23– 50.
———. 2011a. Cities in a World Economy. Revised 4th edition. Thou-sand Oaks, CA: Sage/Pine Forge.
260 • References
———. 2011b. “The Global Street: Making the Po liti cal.” Globalizations 8, no. 5 (October): 565– 571.
———. 2012. “Interactions of the Technical and the Social: Digital Formations of the Powerful and the Powerless.” Information, Communication & Society. DOI:10.1080/1369118X.2012.667912.
———. 2013. “Global Finance and Its Institutional Spaces.” In Karin Knorr Cetina and Alex Preda, eds., The Oxford Handbook of the Sociology of Finance. Oxford: Oxford University Press.
———. Forthcoming. Ungoverned Territories. Cambridge, MA: Harvard University Press.
Sassen, Saskia, and Natan Dotan. 2011. “Delegating, Not Returning, to the Biosphere: How to Use the Multi- scalar and Ecological Properties of Cities.” Global Environmental Change 21, no. 3: 823– 834.
Schuur, Edward A. G., and Benjamin Abbott. 2011. “Climate Change: High Risk of Permafrost Thaw.” Nature 480: 32– 33.
Schwartz, Mike. 2004. “Bottled Water Confl icts.” Department of Geogra-phy, University of Wisconsin, Eau Claire.
Schwartzkopff, Frances. 2013. “Denmark Races to Prevent Foreclosures as Home Prices Sink.” Bloomberg .com. March 18.
Scott, James C. 1999. Seeing Like a State: How Certain Schemes to Improve the Human Condition Have Failed. New Haven: Yale University Press.
Scott, Robert E. 2010. “Trade Policy and Job Loss.” Working paper no. 289. Economic Policy Institute, Washington, DC.
———. 2012. “The China Toll: Growing U.S. Trade Defi cit with China Cost More than 2.7 Million Jobs between 2001 and 2011, with Job Losses in Every State.” Briefi ng paper #345, Economic Policy Institute, Washington, DC.
———. 2013. “No Jobs from Trade Pacts.” Economic Policy Institute, Washington, D.C.
Seager, R., M. F. Ting, I. M. Held, Y. Kushnir, J. Lu, G. Vecchi, H.- P. Huang, N. Harnik, A. Leetmaa, N. C. Lau, C. Li, J. Velez, and N. Naik. 2007. “Model Projections of an Imminent Transition to a More Arid Climate in Southwestern North America.” Science 316, no. 5828: 1181– 1184.
“Sea Level.” The Guardian. Guardian News and Media. http:// www . the guardian .com /environment /sea -level .
SEC. 2013. “Release No. 34- 68842.” www .sec .gov /rules /sro /fi nra /2013 /34 -68842 .pdf. Accessed November 25.

References • 261
Selcraig, Bruce. 1998. “This Reclamation Plan Uses Waste to Bury Waste.” High County News 122. January 19.
Sen, Amartya. 2000. Development as Freedom. New York: Anchor.Sen, Arjun. 2003. “Heat on Cold Drinks.” Statesman. August 12.Sender, Henny Arash Massoudi, and Anjli Raval. 2013. “US Housing
Groups to Launch IPOs.” Financial Times. May 13.Serrano, Fernando. 2008. “Environmental Contamination in the Homes
of La Oroya and Concepcion and Its Effects in the Health of Community Residents.” United Nations, Offi ce of the High Commis-sioner for Human Rights, Geneva.
Shah, Shahid. 2009. “Corporate Farming Raises Concern among Local Growers.” The News (Pakistan). January 28.
Shepard, D. with M. Anuradha. 2010. (Mis)Investment in Agriculture: The Role of the International Finance Corporation in the Global Land Grab. Oakland Institute. http:// www .oaklandinstitute .org /.
Sherman, Arloc, and Chad Stone. 2010. “Income Gaps Between Very Rich and Everyone Else More than Tripled in Last Three De cades, New Data Show.” Center on Bud get and Policy Priorities. June 25. Center on Bud get and Policy Priorities, Washington, DC.
Shinn, Mary Beth. 2010. “Homelessness, Poverty, and Social Exclusion in the United States and Eu rope.” Eu ro pe an Journal of Homelessness 4 (2010).
Sierra Club: Southern New Mexico Group. 2013. “The Water Grab on the Augustin Plains.” http:// southern .nmsierraclub .org /water -grab -on -the -augustin -plains. Accessed November 22, 2013.
Sills, Ben, and Andre Tartar. 2013. “Spain Recession Seen Ending by 2014 as Austerity Eases.” Bloomberg .com. June 13.
Smeeding, Timothy M. 2002. “Globalization, In e qual ity, and the Rich Countries of the G-20: Evidence from the Luxembourg Income (LIS).” Working paper no. 48. Center for Policy Research, http:// dx . doi .org /10 .2139 /ssrn .1809030 .
Smith, Jim. 2011. “A Long Shadow over Fukushima.” Nature 472, no. 7 (April 5).
Smith, Merrill. 2004. “Warehousing Refugees: A Denial of Rights, a Waste of Humanity.” In World Refugee Survey 2004. Arlington, VA: U.S. Committee for Refugees.
Smith, Yves. 2013. “New Whistleblower Describes How Bank of America Flagrantly Violates Dual Tracking, Single Point of Contact Require-ments in State/Federal Mortgage Settlement.” Naked Capitalism [blog], February 21.
262 • References
Smyth, Sharon. 2013. “Spain Home Expropriation Plans Seen Violating EU Bailout.” Bloomberg Businessweek. May 12.
Snyder, Howard N. 2011. “Arrest in the United States, 1980– 2009.” Bureau of Justice Statistics, U.S. Department of Justice. September 22.
Solomon, S., D. Qin, M. Manning, Z. Chen, M. Marquis, K. B. Averyt, M. Tignor, and H. L. Miller, eds. 2007. Climate Change 2007: The Physical Science Basis. Contribution of Working Group I to the Fourth Assessment Report of the Intergovernmental Panel on Climate Change. Cambridge: Cambridge University Press.
Stamatis, Georgios. 2012. “Homeless in Greece in the Current Financial Crisis: What Perspectives?” University of Athens. http:// crisis .med . uoa .gr /elibrary /13 .pdf .
Stiffarm, Dean L. 2005. “Community Involvement Conference and Training: The Zortman & Landusky Goldmines.” Fort Belknap Indian Community– Environmental Department, Harlem, Montana. www .epancic .org /2005 /download /presentations /ballroom _a /thu / stiffarm .pdf. Accessed January 9, 2013.
Stiglitz, Joseph E. 1999. Freefall: Freemarkets and the Sinking of the Global Economy. New York: W. W. Norton & Company.
———. 2012. The Price of In e qual ity. New York: W. W. Norton & Company.
———. 2013. “Globalisation Isn’t Just about Profi ts. It’s About Taxes Too.” The Guardian, May 27. http:// www .guardian .co .uk /comment isfree /2013 /may /27 /globalisation -is -about -taxes -too .
Stiglitz, Joseph E., and Mary Kaldor, eds. 2013. The Quest for Security: Protection without Protectionism and the Challenge of Global Governance. New York: Columbia University Press.
Stott, P. A. 2000. “External Control of 20th Century Temperature by Natural and Anthropogenic Forcings.” Science 290, no. 5499: 2133– 2137.
Stott, P. A., G. S. Jones, N. Christidis, F. Zwiers, G. Hegerl, and H. Shiogama. 2011. “Single- Step Attribution of Increasing Frequencies of Very Warm Regional Temperatures to Human Infl uence.” Atmo-spheric Science Letters 12, no. 2: 220– 227.
Stott, P. A., D. A. Stone, and M. R. Allen. 2004. “Human Contribution to the Eu ro pe an Heatwave of 2003.” Nature 432, no. 7017: 610– 614.
Sudbury, Julia, ed. 2005. Global Lockdown: Race, Gender, and the Prison- Industrial Complex. New York: Routledge.

References • 263
Summerill, Joseph. 2011. “Housing Federal Prisoners in Local Jails.” Statement of Joseph Summerill Before the Committee on Appro-priations: Commerce, Justice, Science, and Related Agencies. March 11.
Sutcliffe, Bob. 2004. “World In e qual ity and Globalization.” Oxford Review of Economic Policy 20, no. 1: 15– 37.
———. 2007. “Postscript to the Article ‘World In e qual ity and Globaliza-tion.’ ” World Bank, Washington, DC.
Sydor, Guy. 2004. “The World’s Highest Railroad.” http:// www .peruhotel .com /english /article .php3 ?idarticle=13. Accessed January 9, 2013.
Tagliabue, John. 2013. “Parts of Low Country Are Now Quake Country.” New York Times. March 27.
Tarlock, Dan A. 2004. Bottled Water: Legal Aspects of Groundwater Extraction. Madison, Wisconsin: State Environmental Resource Center.
Tax Justice Network. 2011. “The Cost of Tax Abuse.” November. www . tackletaxhavens .com /Cost _of _Tax _Abuse _TJN _Research _23rd _Nov _2011 .pdf .
Teubal, Miguel. 2006. “Expansión del Modelo Sojero en la Argentina. De la Producción de Alimentos a los Commodities.” Realidad Económica. No. 220.
Texas A&M University. 2013. “Texas Water Law.” http:// texaswater .tamu .edu /water -law. Accessed July 13, 2013.
Theodorikakou, O., A. Alamanou, et al. 2012. “Homelessness in Greece— 2012: An In- Depth Research on Homelessness in the Financial Crisis.” Klimaka NGO—Greece. Eu ro pe an Research Conference: Access to Housing for Homeless People in Eu rope, York, September 21. www .slideshare .net /FEANTSA /seminar -3 -klimaka .
Thompson, Derek. 2013. “Eu rope’s Record Youth Unemployment: The Scariest Graph in the World Just Got Scarier.” Atlantic. May.
Thompson, Mark. 2012. “Spanish Economy Shrinks Again.” CNNMoney. October 23.
Townsend, P. K., and W. H. Townsend. 2004. “Assessing an Assessment: The Ok Tedi Mine.” www .maweb .org /documents /bridging /papers / townsend .patricia .pdf .
Tsukimori, Osamu, and Nathan Layne. 2011. “Areas near Japan Nuclear Plant May Be Off Limits for De cades.” Reuters. August 27.
UNCTAD. 2008. World Investment Directory, volume 10: Africa. New York: United Nations.
264 • References
UNDP. 2005. A Time for Bold Ambition: Together We Can Cut Poverty in Half: UNDP Annual Report. New York: UNDP.
———. 2008. Human Development Report 2007– 2008. New York: UNDP.
———. 2013. Human Development Report 2013. New York: UNDP.UNEP/GRID. 2006. Planet in Peril: An Atlas of Current Threats to People
and the Environment. Arendal, Norway: UNEP/GRID.UNHCR. 2012a. Global Trends 2011. Geneva : United Nations High
Commissioner for Refugees.———. 2012b. “Annex Tables.” Global Trends 2011. www .unhcr .org /
pages /4fd9a0676 .html. Accessed January 2, 2013.UNICEF. 2012. “Progress on Drinking Water and Sanitation.” www .unicef
.org /media /fi les /JMPreport2012 .pdf. Accessed June 18, 2013.United Nations Framework Convention on Climate Change. 2013. “A
Summary of the Kyoto Protocol.” http:// unfccc .int /kyoto _protocol / background /items /2879 .php. Accessed June 18, 2013.
Urban, Rob, and Sharon Smyth. 2012. “Greek Banks Follow Eurip-ides to Help Borrowers: Mortgages.” Bloomberg Businessweek. July 26.
U.S. Committee for Refugees. 2009. World Refugee Survey 2009. Arlington, VA: U.S. Committee for Refugees.
U.S. Energy Information Administration. 2012a. “Assumptions to the Energy Outlook 2012: Coal Modual.” www .eia .gov /forecasts /aeo / assumptions /pdf /coal .pdf. Accessed January 9, 2013.
———. 2012b. “Total Energy: Annual Energy Review.” www .eia .gov / totalenergy /data /annual /showtext .cfm ?t=ptb0701. Accessed January 9, 2013.
U.S. International Trade Commission. 2013. USITC Interactive Tariff and Trade DataWeb. Data for 2000– 2013, year- to- date, April, down-loaded June 21 via spreadsheet. http:// dataweb .usitc .gov /.
Van Lynden, G. W. J. 2004. “Eu ro pe an and World Soils: Present Situation and Expected Evolution.” Proceedings of I International Conference: Soil and Compost Eco- biology, León, Spain.
van Onselen, Leith. 2013. “Three Headwinds for the US Housing Recovery.” MacroBusiness. www .macrobusiness .com .au /2013 /07 / factors -that -may -thwart -the -us -housing -recovery. Accessed August 3, 2013.
Varchaver, Nicholas, and Katie Benner. 2008. “The $55 Trillion Ques-tion.” CNN Money. September 30.

References • 265
Vergano, Dan. 2007. “Climate Change Threatens New Dust Bowl in Southwest.” USA Today. April 6.
Vermeulen, Sonja, and Nathalie Goad. 2006. Towards Better Practice in Smallholder Palm Oil Production. Natural Resources Issues Series 5. London: IIED.
Vidal, John. 2012. “Chinese Food Security May Be Motivating Invest-ments in Africa.” Guardian. May 10.
Viñas, Maria- José. 2012. “Satellites See Unpre ce dented Greenland Ice Sheet Surface Melt.” NASA. www .nasa .gov /topics /earth /features / greenland -melt .html. Accessed July 30, 2012.
Visser, Oane, and Max Spoor. 2011. “Land Grabbing in Post- Soviet Eurasia: The World’s Largest Agricultural Land Reserves at Stake.” Journal of Peasant Studies 38, no. 2: 299– 323.
von Braun, Joachim. 2008. “Food and Financial Crises: Implications for Agriculture and the Poor.” Washington DC: International Food Policy Research Institute (IFPRI) Food Policy Report 20. http:// www .ifpri .org /PUBS /agm08 /jvbagm2008 .asp .
von Braun, Joachim, Akhter Ahmed, Kwadwo Asenso- Okyere, Shenggen Fan, Ashok Gulati, John Hoddinott, Rajul Pandya- Lorch, Mark W. Rosegrant, Marie Ruel, Maximo Torero, Teunis van Rheenen, and Klaus von Grebmer. 2008. “High Food Prices: The What, Who, and How of Proposed Policy Actions.” Washington DC, International Food Policy Research Institute (IFPRI) Policy Brief. http:// www .ifpri . org /pubs /ib /foodprices .asp .
von Braun, Joachim, and Ruth Meinzen- Dick. 2009. “ ‘Land Grabbing’ by Foreign Investors in Developing Countries: Risks and Opportunities.” Washington DC: International Food Policy Research Institute (IFPRI) Policy Brief 13. http:// www .ifpri .org /publication /land -grabbing -foreign -investors -developing -countries .
Voyant Solutions Pvt. Ltd. 2009. “Final Report for City Corporation cum Business Plan for Ranipet Town.” 2009. http:// municipality .tn .gov .in / ranipet /Ranipet .pdf. Accessed January 9, 2013.
Wagenhofer, Erwin. 2005. We Feed the World. Allegro Film Produktions-fi rma GmbH. www .youtube .com /watch ?v=qyAzxmN2s0w. Accessed June 18, 2013.
Wald, Matthew L. 2010. “Analysis Triples U.S. Plutonium Waste Figures.” New York Times. July 11.
Walmsley, R. 2011. World Population List, 9th ed. Essex: International Centre for Prison Studies
266 • References
Walsh, Bryan. 2007. “Dzerzhinsk, Rus sia.” The World’s Most Pol-luted Places. Time. www .time .com /time /specials /2007 /article /0 ,28804 ,1661031 _1661028 _1661021 ,00 .html. Accessed January 9, 2013.
Warner, Koko, Olivia Dun, and Marc Stal. 2008. “Field Observations and Empirical Research.” Forced Migration Review 31: 13– 15.
Warnock, Veronica Cacdac, and Francis E. Warnock. 2008. “Markets and Housing Finance.” Social Science Research Network. http:// papers . ssrn .com /sol3 /papers .cfm ?abstract _id=981641. Accessed July 28, 2012.
———. 2012. “Developing Housing Finance Systems.” Reserve Bank of Australia Annual Conference Volume pp. 49– 67. http:// www .rba .gov .au /publications /confs /2012 /pdf /warnock -warnock .pdf. Accessed January 8, 2014.
Warren, L. H. 1940. “Leather Buffers’ Nodes.” Journal of the American Medical Association 114, no. 7 (February 17): 571.
Washington State Department of Ecol ogy. 2008. “Hanford Quick Facts.” http:// web .archive .org /web /20080624232748 /http:// www .ecy .wa .gov / features /hanford /hanford facts .html .
———. 2013. “Ecol ogy Statement on Notifi cation of More at Risk Consent Decree Milestones.” http:// www .ecy .wa .gov /programs /nwp /sections /tankwaste /twtreatment /pages /20131008 _statement .html. Accessed January 5, 2014.
Wassener, Bettina. 2011. “Raising Awareness of Plastic Waste.” New York Times. August 14.
Watkins, Thayer. 2013. “The Chaebol of South Korea.” San Jose State University faculty webpage, www.sjsu.edu/ faculty/watkins/chaebol .-htm.
Wellington Water Watchers. 2011. “Nestlé Waters Canada, Permit to Take Water.” www .wellingtonwaterwatchers .ca /nestle -waters -canada -permit -to -take -water /. Accessed November 23, 2013.
Western, Bruce, and Becky Pettit. 2010. “Incarceration & Social In e qual-ity.” Daedalus, Summer 2010.
White, Alan. 2013. “Foreclosure Crisis in Eu rope vs US.” Credit Slips: A Discussion on Credit, Finance, and Bankruptcy. www .creditslips .org / creditslips /2011 /08 /foreclosure -crisis -in -europe -vs -us .html. Accessed February 8, 2013.
White, Ben, Saturnino M. Borras Jr., Ruth Hall, Ian Scoones, and Wendy Wolford. “The New Enclosures: Critical Perspectives on Corporate Land Deals.” Journal of Peasant Studies 39, nos. 3– 4: 619– 647.

References • 267
White House. 2010. “The U.S.- South Korea Free Trade Agreement: More American Jobs, Faster Economic Recovery Through Exports” (fact sheet). www.white house.gov/ sites/default/fi les/fact_sheet_overview _us_korea_free_trade_ agreement.pdf.
WHO. 2005. “Chernobyl: The True Scale of the Accident.” World Health Or ga ni za tion, Geneva.
———. 2010. “Dioxins and Their Effect on Human Health.” World Health Or ga ni za tion, Geneva.
Wiener Bravo, E. 2011. “The Concentration of Land Own ership in Latin America: An Approach to Current Problems.” CISEPA contribution to ILC Collaborative Research Project on Commercial Pressures on Land. Rome: ILC.
Wigley, T., and B. Santer. 2012. “A Probabilistic Quantifi cation of the Anthropogenic Component of Twentieth Century Global Warming.” Climate Dynamics.
Williams, Laura. 2012. Housing Landscape 2012. National Housing Conference, Washington, DC.
Wolman, David. 2006. “Train to the Roof of the World.” Wired 14, no. 7 (July).
World Bank. 2005. “Increasing Aid and Its Effectiveness.” In Global Monitoring Report: Millennium Development Goals: From Consen-sus to Momentum, 151– 188. Washington, DC: World Bank.
———. 2006. Global Economic Prospects 2006: Economic Implications of Remittances and Migration. Washington, DC: World Bank.
———. 2008. Global Monitoring Report 2008. Washington, DC: World Bank.
———2012. Turn Down the Heat: Why a 4° Warmer World Must Be Avoided. Washington, DC: World Bank.
———. 2013a. “Eu rope and Central Asia Housing Finance Crisis Prevention and Resolution: A Review of Policy Options.” Working paper no. 78346. World Bank, Washington, DC.
———. 2013b. Turn Down the Heat: Climate Extremes, Regional Impacts, and the Case for Resilience. Washington, DC: World Bank.
———. 2013c. “GDP Per Capita (Current US$).” http:// data .worldbank .org /indicator /NY .GDP .PCAP .CD ?page=1. Accessed January 1, 2014.
World Food Programme. 2013. “10 Things You Need to Know about Hunger in 2013.” World Food Programme, Rome.
World Nuclear Association. 2012. “Chernobyl Accident 1986.” www . world -nuclear .org /info /chernobyl /inf07 .html. Accessed January 9, 2013.
268 • References
Wyly, Elvin, Markus Moos, Daniel Hammel, and Emanuel Kabahizi. 2009. “Cartographies of Race and Class: Mapping the Class- Monopoly Rents of American Subprime Mortgage Capital.” Interna-tional Journal of Urban and Regional Research 33, no. 2 (June): 332– 354.
Xing, Yuqing. 2010. “Facts About and Impacts of FDI on China and the World Economy.” China: An International Journal 8, no. 2: 309– 327.
Yusuf, Hamid. 2012. “Land Administration System in Indonesia.” Paper presented at the 17th ASEAN Valures Association Congress. www . aseanvaluers .org /PDF /Land %20Administration %20System %20in %20Indonesia .pdf. Accessed July 1, 2013.
Zarchin, Tomer. 2009. “International Legal Pre ce dent: No Private Prisons in Israel.” Haaretz. November 9.
Zeiss, Geoff. 2011. “Large Water Diversion Projects, Environmental Impact and Convergence.” Between the Poles: All about Infrastructure [blog]. http:// geospatial .blogs .com /geospatial /2011 /03 /large -water -diversion -projects -and -the -environment .html. Accessed June 30, 2013.
Zoomers, A. 2010. “Globalisation and the Foreignisation of Space: Seven Pro cesses Driving the Current Global Land Grab.” Journal of Peasant Studies 37, no. 2 (April): 429– 447.
Zuber, Helen. 2012. “Mortgage Nightmares: Evictions Become Focus of Spanish Crisis.” Der Spiegel. December 22.
269
1. Shrinking Economies, Growing Expulsions
1. Sassen 2008a; 2008b; 2008c, chapters 4 and 7; 2013. 2. Oxfam 2012, 1– 2; see also Atkinson et al. 2011. 3. IMF 2012a, 82; Johnston 2013 on U.S. corporations. 4. Sassen 2008c, chapter 5. 5. Sassen 2001, chapter 8; Sassen 2011. 6. Sassen 1988. 7. Johnston 2005, 2013; GAO 2013; CNNMoney Staff 2013. 8. Johnston 2013 writes that a July 1, 2013, report to Congress suggests
the rate on large profi table fi rms may be even lower than what is shown in publicly available IRS data. The 2010 net tax rate was really just 12.6 percent, according to the Government Accountability Offi ce— the investigative arm of Congress— which had access to secret documents.
9. Large corporate fi rms do extensive lobbying for laws and regulatory rules that get little or no attention in the mainstream news. GE spent $39.3 million just on Washington lobbying in 2010, more than $73,000 per senator and representative. ExxonMobil has spent on average almost $23 million annually lobbying Washington between 2008 and 2010. Walmart has spent between $6.2 million and $7.8 million lobbying Washington each year since 2008. See also Mishel 2013.
10. Tax Justice Network 2011. 11. For a short description of the report, see Johnston 2011; Isidore 2012. 12. Sassen 2008c, chapter 5; 2013. 13. Kubiszewski et al. 2013. 14. Ortiz and Cummins 2013; see also Samir Amin 2010; Portes 2010.
Notes

270 • Notes to Pages 25–31
15. This is a whole subject in itself, with a rapidly growing research litera-ture (for one of the most comprehensive treatments, see Bryson and Daniels 2007). It is impossible to develop the subject here beyond a few summary statements (for a detailed discussion and extensive list of sources see Sassen 2001, chapters 5 and 6, and Sassen 2013; see also Sassen 2012 on digital technology). In my reading, the growth in the demand for ser vice inputs, and especially bought ser vice inputs, in all industries is perhaps the most fundamental condition making for change in advanced economies. One mea sure can be found in the value of bought ser vice inputs in all industries. For this purpose I analyzed the national accounts data over different periods—beginning with 1960—for several industries in manufacturing and ser vices. For in-stance, the results showed clearly that this value increased markedly over time. It has had pronounced impacts on the earnings distribution, on industrial or ga ni za tion, and on the patterns along which economic growth has spatialized. It has contributed to a massive growth in the demand for ser vices by fi rms in all industries, from mining and manu-facturing to fi nance and consumer ser vices, and by house holds, both rich and poor.
16. For instance, data analyzed by Smeeding (2002) for twenty- fi ve devel-oped and developing countries showed that since 1973 the incomes of those in the top 5 percent have risen by nearly 50 percent, while in-comes of those in the bottom 5 percent have declined by approximately 4 percent. According to the U.S. Bureau of the Census, from 1970 to 2003 the aggregate national income share of the top 5 percent in the United States went from 16 to 21 percent, and for the top 20 percent from 41 percent to 48 percent. All these fi gures will tend to underesti-mate in e qual ity insofar as the top earners also have non- salary- based gains in wealth, and the bottom of the scale tends to exclude many of the poor who lack any source of income and are dependent on friends and family, or become homeless and dependent on charities.
17. Mishel 2007; Stiglitz 2012; Fisher 2011. 18. Sassen 2001; Sassen 2011. 19. The key sources for the data discussed in this section are Atinc et al.
2006; World Bank 2013c; Stiglitz 2012; Held and Kaya 2007; Mila-novic 2005, 2011; Arestis, Sobreira, and Oreiro 2011; Sutcliffe 2004, 2007; OECD 2008, 2011; Saez 2010; FRED 2013; Bourguignon and Morrison 2002.
20. Milanovic 2011; Atinc et al. 2006.
Notes to Pages 31–48 • 271
21. Atinc et al. 2006, 64. 22. Economic Policy Institute 2011a, 2011b, 2011c, 2011d, 2011e, 2011f,
2011g; EPI 2013. 23. Mishel and Bivens 2011. 24. Economic Policy Institute 2008. 25. Mishel and Bivens 2011; Allegretto 2011. 26. Mishel and Bivens 2011; Allegretto 2011. 27. Sources for the following discussion can be found at BBC News 2012;
Paris, Stevos, and Bouros 2012; Inman and Smith 2012; Bensasson 2013; Blackstone et al. 2012; Lima 2013; Greece 2013; Hope 2013.
28. ILO 2012; ILO and OECD 2013, 5 and Figure 3; Eurojobs 2012. 29. ILO and OECD 2013, fi gure 2, Panel C; see also OECD 2013b, 2013c. 30. Inman and Smith 2012; Nellas 2013; Bakalidou 2013. 31. Portugal, Spain, and Ireland have far more private sector debt than
Greece. As a result, while government debt in Portugal is less than that of Greece, relative to GDP, total debt (including private sector debt) is actually larger. See generally OECD 2011, 2008.
32. Data for this section can be found at Davies 2012; Day 2013; Sills and Tartar 2013; Thompson 2012; and “Wrong Way” [graphic], Wall Street Journal, available at http:// si .wsj .net /public /resources /images /WO -AI754B _EUECO _G _20120214184204 .jpg .
33. According to a June 2013 Eurostat press release, GDP fell by 0.2 per-cent in the euro area (EA17) and by 0.1 percent in the Eu ro pe an Union (EU27) during the fi rst quarter of 2013, compared with the previous quarter (Eurostat 2013a).
34. Further information for this section can be found in Thompson 2013; Instituto Nacional de Estadística 2011, 2013a, 2013b; and OECD.Stat Extracts, http:// stats .oecd .org /Index .aspx ?DatasetCode=INVPT _I; Bolanos 2012 .
35. Instituto Nacional de Estadística 2011, see also European commission 2012; Burgen 2013.
36. Papademetriou and Terrazas 2009. 37. Immigrants’ mobility contrasts with the immobility of natives, and pro-
vides evidence to support prevailing theories on the relatively limited migration across EU member states (see Favell 2008; OECD 2013c, 2013d).
38. Daley 2010; Zuber 2012; Eu ro pe an Commission 2011. 39. In this report “default rates refer to the percentage of mortgage loans
over 90 days in arrears in relation to outstanding mortgage loans in a
272 • Notes to Pages 51–64
Member State, unless otherwise indicated. Data relates to the total number of contracts in default to the total number of outstanding con-tracts, unless otherwise indicated” (Instituto Nacional de Estadística 2011, 12). See also Smyth 2013; Karaian 2013; Sampaniotis 2013.
40. Eurostat 2012a; see also Eurostat 2012b, 2013b, 2013c. Looking at each of the three elements contributing to being at risk of poverty or social exclusion, 17 percent of the population in the EU- 27 in 2011 were at risk of poverty even after social transfers. The highest rates of being at risk of poverty were observed in Bulgaria, Romania, and Spain (all 22 percent) and Greece (21 percent), and the lowest in the Czech Republic (10 per-cent), the Netherlands (11 percent), Austria, Denmark, and Slovakia (each 13 percent). It is important to note that risk of poverty is a relative mea sure and that the poverty threshold varies greatly among EU mem-ber states. The threshold varies also over time, and it has fallen in recent years in a number of member states due to the economic crisis.
41. As regards the indicator on low work intensity, 10 percent of the popu-lation under age fi fty- nine in the EU- 27 lived in house holds where the adults worked less than 20 percent of their total work potential during the past year. Belgium (14 percent) had the largest proportion of those living in very low work intensity house holds, and Cyprus (5 percent) the lowest.
42. See Shinn 2010 and, generally, FEANTSA 2011. 43. EuroHealthNet 2011. Most suicides, attempted and real, have oc-
curred in the greater Attica region (surrounding Athens) and on the is-land of Crete (where a number of businessmen with no prior history of mental illness took their own lives over a period of eigh teen months). Another increase concerns rates of substance use among Greece’s home-less population, which has worsened public health crises such as HIV/AIDS. See Ghosh 2013; Klimaka 2012; Stamatis 2012.
44. See UNHCR 2012b for a glossary of the UNHCR categories of dis-placed peoples.
45. Smith 2004; see also Hovil 2010; Long 2010; Kaiser 2010. 46. Brothers 2011; UNHCR 2012a, 2012b. 47. Besides UNHCR reports, the sources for this section on the environ-
mental aspect are Calhoun 2004; Pender 2008a; Leckie et al. 2011; Warner, Dun, and Stal 2008.
48. Warner, Dun, and Stal 2008, 13 (emphasis added). 49. While this section largely examines how imprisonment functions as a
force of expulsion, it is worth noting that the language of “banish-

Notes to Pages 65–73 • 273
ment” has been deployed in recent times by mayors and police chiefs alike when trying to advance exclusionary carceral policy. In the sum-mer of 2012, the mayor of Toronto was trying to fi gure out a way to banish people with gun charges from the city, including using immi-gration deportation laws. Justifying the proposal, he explained, “I don’t care if you’re white, pink or purple. I don’t care what country you’re from. I don’t care if you’re a Canadian citizen or not. All I’m saying is if you’re caught with a gun and convicted of a gun crime, I want you out of this city” (CBC 2012a, 2012b). In January 2013, the police chief of Atlanta, Georgia, proposed a similar banishment pol-icy, this time for anyone with two or more prostitution convictions (Diggs 2013).
50. Sources for this section on privatization of prisons: United States, Guerino, Harrison, and Sabol 2012; Mexico, McCleskey 2012; New Zealand, Cheng 2012; Peru, Associated Press 2010; South Africa, eAfrica 2005; United Kingdom, Her Majesty’s Prison Ser vice n.d. See also Nigeria Intel 2012; Home Offi ce 2012; Moir 2013; Zarchin 2009; Sudbury 2005; Prison Population around the Globe 2008; Prison Reform Trust 2013.
51. Sources for this section are Pew Center on the States 2008, 2009; Ro-driguez and Emsellem 2011; National Prisoner Statistics Program 2013; Parenti 2008; Pager et al. 2009; Herivel and Wright 2003; Gilmore 2007; Western and Pettit 2010.
52. Walmsley 2011; Roth 2006; Snyder 2011; Alexander 2010; Amin 2012.
53. A team of reporters at the Times Picayune established these numbers. The full eight- part series is available online at www .nola .com / prisons /. See also Chang 2012, “In World of Prisons, Some Rural Parishes’ Econ-omies Hinge on Keeping Their Jails Full,” www .nola .com /crime / index .ssf /2012 /05 /in _world _of _prisons _some _rural .html; www .opensociety foundations .org /sites /default /fi les /socioeconomic -impact -pretrial -de tention -02012011 .pdf .
54. This section on privatized prisons in the United States uses fi ndings and data examined in McDonald 1992; Harding 2001; Austin and Coven-try 2001; Mason 2012; Kirkham 2012.
55. This section is based on McTighe 2012, 2013; Public Ser vices Interna-tional Research Unit 2005a, 2005b, 2005c, 2005d; Peralta 2011.
56. Sassen 2008c, chapter 4. 57. Peralta 2011.
274 • Notes to Pages 74–93
58. On use of prisoners as exceptionally low- wage work camps, see Federal Bureau of Prisons n.d.; McCormack 2012; Summerill 2011. See also the Times- Picayune’s 2012 eight- part series on incarceration in Louisiana, “How We Built the World’s Prison Capital,” at www .nola . com /prisons .
2. The New Global Market for Land
1. This is a subject I examine in Ungoverned Territories (forthcoming). On contracts see Cotula and Tienhaara 2013; Margulis et al. 2013; Pistor 2012; Shephard and Anuradha 2010; IFPRI 2009; Zoomers 2010.
2. I provide a detailed critical account of these various policies and the literatures they have engendered in Sassen 1988, 2001, 2010.
3. Sassen 1988. For broader historical accounts see Bertola and Ocampo 2013; Chatterjee 2011; Quijano 2007; Scott 1999; Landes 1999; Rubio 2003; McMichael 2009; White et al. 2012.
4. See Sassen 2008c, chapters 1, 8, and 9 for a development of the theo-retical, methodological, and historical aspects.
5. This section is based on a larger research project (Sassen 2008d) that seeks to show how the struggles by individuals, house holds, entrepre-neurs, and even governments are micro- level enactments of larger pro-cesses of economic restructuring in developing countries launched by the IMF and World Bank Programs, as well as in WTO law implemen-tation during the 1990s and onward.
6. By 2003, debt ser vice as a share of exports only (not overall govern-ment revenue) ranged from extremely high levels for Zambia (29.6 per-cent) and Mauritania (27.7 percent) to signifi cantly lowered levels compared with the 1990s for Uganda (down from 19.8 percent in 1995 to 7.1 percent in 2003) and Mozambique (down from 34.5 per-cent in 1995 to 6.9 percent in 2003).
7. Jubilee Debt Campaign 2012, 2013. 8. UNDP 2005, 2008, 2013; see also Ferreira and Walton 2005. 9. For overviews of the data, see UNDP 2005, 2008; World Bank 2005;
Atinc et al. 2006, 2013; Attinc et al. 2006; Behrman et al. 2011; Lucas 2005; Sassen 2008d, 2010.
10. Land Matrix, landmatrix .org (accessed July 29, 2012); Anseeuw, Wily, et al. 2012; Anseeuw, Boche, et al. 2012. See also DeSchutter 2011; FAO 2009; Cotula et al. 2009; Borras and Franco 2012; IFPR 2011; Margu-lis et al. 2013; on particular legal aspects see Pistor 2012.
11. See also Provost 2012; Xing 2010.
Notes to Pages 94–108 • 275
12. GRAIN 2012. 13. HighQuest Partners 2010. 14. Aabø and Kring 2012, 2. 15. Oxfam 2012, 1. 16. Murphy 2013, 5. 17. Ravanera and Gorra 2011. 18. Hall 2011 and Cotula et al. 2009. Beyond Africa, see Visser and Spoor
2011; Novo et al. 2010; Shah 2009; Teubal 2006. 19. Cotula 2011; Ravanera and Gorra 2011. 20. Wiener Bravo 2011. 21. Molnar et al. 2011. 22. Ibid. 23. Putzel et al. 2011. 24. Colchester 2011. 25. For Benin, see Dossou et al. 2011; for India, see Rawat, Bhushan, and
Surepally 2011. 26. Bräutigam and Tang 2011. 27. According to Rulli, Saviori, and D’Odorico 2013, “about 0.31 × 10¹²
m3/yr of green water (i.e., rainwater) and up to 0.14 × 10¹² m3/yr of blue water (i.e., irrigation water) are appropriated globally for crop and livestock production in 47 × 106 ha of grabbed land worldwide (i.e., in 90% of the reported global grabbed land).”
28. The share of the primary sector (which includes prominently mining and agriculture) in inward FDI stock increased to 41 percent in 2006, up from 5 percent in 1996; in contrast, the share of the manufacturing sector almost halved, to 27 percent from 40 percent, over that period. (UNCTAD 2008).
29. For comprehensive data, see UNCTAD 2008. 30. On the other side, the World Food Programme spent $116 million to
provide 230,000 tons of food aid between 2007 and 2011 to the 4.6 million Ethiopians it estimated were threatened by hunger and malnu-trition. This coexistence in a single country of profi ting from food pro-duction for export and hunger, with the taxpayers of the world provid-ing food aid, is a triangle that has repeated itself starting in the post– World War II war de cades (Sassen 1988).
31. Friis and Reenberg 2010. 32. Ibid. Note that the graphs presented in Figures 2.7 and 2.8 are not
contained in Friis and Reenberg 2010 but have been constructed by the author using their data.

276 • Notes to Pages 108–123
33. Sun Biofuels actually failed in Tanzania and shut down in 2011, which led to severe and sudden shocks to the local economy.
34. Colchester 2011, 1; Productschap Margerine, Vetten en Oliën 2011, 1. 35. Productschap Margerine, Vetten en Oliën 2011, 1. 36. Colchester 2011, 2– 3. 37. Ibid., 1. 38. Ibid., 2. 39. Burgers and Sustani 2011, 1, 11. See Vermeulen and Good for
alternatives. 40. Mayer 2009. 41. Royal Tropical Institute 2012, 3. 42. Yusuf 2012, 7. 43. Ibid., 13. 44. Ibid. 45. Deddy 2006, 91; Asian Human Rights Commission 2012. 46. Mayer 2009. 47. Colchester 2011, 18. 48. Asian Human Rights Commission 2012. 49. Ibid. 50. Ibid. 51. Santoso and Afrizal 2004. 52. Brunori 2013.
3. Finance and Its Capabilities
1. I develop this proposition in Sassen 2008b, 2013. These sources also contain extensive bibliographies on all key aspects of the subject of this chapter. See also generally Stiglitz 1999; Knorr and Preda 2013; Graeb-ner 2012; Hartman and Squires 2013; Krippner 2011; Lerner and Bhatti 2013; IMF 2006, 2008, 2012a, 2012b.
2. Sassen 2001, chapter 4; 2008c, chapters 5 and 7. A key feature of fi -nance is that it can extract robust profi ts from international transactions even in the face of massive job losses. Thus, in the United States the sector has profi ted from so-called Free Trade Agreements (FTAs) that, though presented as job creators (e.g., White House 2010), are not (e.g., Scott 2010, 2013; European Commission 2013; Offi ce of the United States Trade Representative 2013a, b, c; Public Citizen 2011, 2013). Nor will the new Transpacifi c FTA create the promised jobs.
3. For a fuller development and extensive bibliography, see Sassen 2013.
Notes to Pages 126–145 • 277
4. Sassen 2008c, 348– 65. On particular issues in the relation of fi nance and banking to housing see, e.g., van Onselen 2013; Goldstein 2013; Smith 2013; Krainer 2009; Kumhof and Rancière 2010; Neumann 2013.
5. See generally Center for Housing Policy 2012; Core Logic 2013; Fur-man Center 2007; Hankiewitz 2013; Levy and Gopal 2011; Mitchell 2013. On racial discrimination, see Wyly et al. 2009 and several chap-ters in Aalbers 2012. On details about foreclosure notices, see Realty Trac 2007, 2008, 2009, 2011, 2012a, 2012b, 2013a, 2013b.
6. Global Insight 2007; Pettit and Reuben 2012; but see also Dewan 2013. This is only one component of the fi nancial system. There are many com-ponents of fi nance that consist of interactions between rich and powerful investors where these mechanisms of primitive accumulation are not an issue. But there are some other major components that also are subject to such mechanisms, notably pension funds and mutual funds, which often have to pay multiple little fees and commissions that add up to signifi -cant and unwarranted losses for the pensioners and the consumers who buy shares in mutual funds. Finally, much of the loss due to subprime mortgage foreclosures fell on bondholders, not on banks.
7. More detail can be found in Sassen 2008a; White 2013; Schwartzkopff 2013; Liu and Rosenberg 2013; Novinite 2011; Miles and Pillonca 2008; Glick and Lansing 2010; Warnock and Warnock 2008, 2012.
8. Arrighi 1994. 9. Farrell et al. 2008. 10. On the global potential of housing mortgage fi nance see generally Eu-
ropean Mortgage Federation 2007; World Bank 2008, 2013a; Miles and Pillonca 2008; Glick and Lansing 2010; Neumann 2013. Elsewhere (Sassen 2008b, 2013) I examine diverse and extensive data that show the potential for global fi nance to use this par tic u lar type of subprime mortgage worldwide, given its invention of instruments that delink the capacity to pay the mortgage from investors’ profi t.
11. Sassen 2008c, chapter 7; Varchaver and Benner 2008, based on data from ISDA.
12. Sassen 2001, chapter 4. 13. Ganchev et al. 2009; SEC. 2013; Kocjan et al. 2012; Keohane 2012. 14. Alvarenga 2013. 15. Patterson 2013. 16. Clark 2011. 17. Patterson 2013.

278 • Notes to Pages 152–154
4. Dead Land, Dead Water
1. Bai et al. 2008, 223. In this paragraph all other quotes are from World Bank 2013b. Additional sources are World Bank 2012, 2013b; Hakkel-ing, Olderman, and Sombroek 1991.
2. Sources for this section are Bai et al. 2008; Hakkeling, Olderman, and Sombroek 1991; Van Lynden 2004.
3. Bai et al. 2008. Although the Normalized Difference Vegetation Index provides no information about the type of environmental degradation taking place, it is possible to get some mea sure of this because the in-dex is mapped as a continuous surface; thus, “the drivers may be re-vealed by correlation with other geo- located biophysical and socio- economic data” (ibid., 224); NASA web.
4. Sources for this section are World Bank 2013b; Coumou and Rahm-storf 2012; Stott, Stone, and Allen 2004; Founda and Giannaopoulos 2009; Karoly 2009; Barriopedro et al. 2011; NOAA 2011, 2013a, 2013b; Rupp et al. 2012; Hansen, Sato, and Ruedy 2012.
5. The fi ve hottest summers in Eu rope since 1500 all occurred after 2002, with 2003 and 2010 being exceptionally hot (Barriopedro et al. 2011). The death toll of the 2003 heat wave is estimated at 70,000 (Field et al. 2012), with daily excess mortality reaching up to 2,200 in France (Fouillet et al. 2006). The heat wave in Rus sia in 2010 resulted in an estimated death toll of 55,000, of which 11,000 deaths were in Mos-cow alone, and more than 1 million hectares of burned land (Barriope-dro et al. 2011). In 2012 the United States, experienced a devastating heat wave and drought period (NOAA 2012a, 2012b); by the end of July about 63 percent of the contiguous United States was affected by drought conditions, and the January- to- July period was the warmest ever recorded. That same period also saw numerous wildfi res, setting a new record for total burned area (NOAA 2012b).
6. All quotes in this paragraph are from World Bank 2013b. 7. Solomon et al. 2007; Wigley and Santer 2012; Hansen, Sato, and
Ruedy 2012. 8. Foster and Rahmstorf 2011, among others, show that if one removes
known factors that affect short- term temperature variations (solar vari-ability, volcanic aerosols, El Niño, and others), natural factors cannot ex-plain warming. Hence it can be largely attributed to anthropogenic fac-tors—man- made factors. See also Santer et al. 1995; Stott 2000; Duffy and Tebaldi 2012; Jones, Lister, and Li 2008; Stott et al. 2011; Sample 2007.
Notes to Pages 155–176 • 279
9. UNEP/GRID 2006, 27. 10. Borodkin and Ertz 2004; Bronder et al. 2010, 9; Blacksmith Institute
2013a, 2013b; Norilsk Nickel 2008; Mines and Communities 2003; BBC News 2007; Golovnina 2005; Bronder et al. 2012.
11. Bronder et al. 2010. 12. Norilsk Nickel 2008; Borodkin and Ertz 2004. 13. Cole 2013, 5, 22. 14. Abel 1997; Klauk 2013c; EPA 1994, 1; Mineral Policy Center 2000. 15. Perlez and Johnson 2005; Mitchell 2004, 10; Klauk 2013a, 2013b;
McClure 2001; Stiffarm 2005. 16. Jones 1989; Massey 1991a, 1991b; Spokane Chronicle 1990; Associ-
ated Press 1991; Mining Truth 2012. 17. Bureau of Land Management 1996, 2528; Newmont Mining Corpora-
tion 1998, 2013; Selcraig 1998; “Mine in Wilderness” 2001. 18. Leistner 1995; EPA 2008; Kelleher 2007. 19. Blacksmith Institute 2013b; Huseynova 2007. 20. Blacksmith Institute 2011a. 21. Lidsky and Schneider 2002; Illinois Department of Public Health n.d.;
Blacksmith Institute 2011c, 2011d. 22. This is confi rmed by the Blacksmith Institute 2011c, 2011d. 23. Robles 2007; Friends of Lead Free Children 2009; Blacksmith Institute
2013f; Kaul et al. 1999, 917. 24. Doe Run Peru n.d. 25. Serrano 2008; Jamasmie 2012; Pouiller 2010; Kramer 2012. 26. Kramer 2012; Wolman 2006; Sydor 2004; Doe Run Peru n.d.; Doe
Run Resources Corporation 2006, 2012. 27. Lenntech 2011; Blacksmith Institute 2011a, 2011c, 2011f; IPPC 2003;
Kennedy 2005; Blackman and Kildegaard 2003; Warren 1940. 28. Voyant Solutions 2009; Blacksmith Institute 2013c. 29. Key sources are Hart and Boger 2008; Townsend and Townsend 2004;
UNEP/GRID 2006; National Wildlife Federation 2012; Duruibe, Og-wuegbu, and Egwurugwu 2007; Blacksmith Institute 2011a, 2011e.
30. Brown 2012; Hurdle 2009; see also note 28. Since 2012 over fi fteen more regions banned fracking. For updates visit Keep Tap Water Safe 2013.
31. Kenny et al. 2009; Harden 2012; Marcellus Drilling News 2010; Olson- Sawyer 2012; Johnson 2011; Chesapeake Energy 2012; Demelle 2011; Jackson et al. 2013.
32. Belcher and Renikoff 2013; Davies 2009.
280 • Notes to Pages 178–199
33. Keranen et al. 2013; Ellsworth et al. 2012; Drajem 2012; Joyce 2012; Romm 2011; Tagliabue 2013.
34. McQuaid 2012; Aurora Lights 2013; Palmer et al. 2010; Hendryx 2009; U.S. Energy Information Administration 2012a, 2012b; Bureau of Labor Statistics 2012; Gagnon 2004; Aurora Lights 2013.
35. Townsend and Townsend 2004; Jorgenson 2006; Murphy 1996; Bice 2013.
36. Belton 2006; Blacksmith Institute 2007; ARMZ Uranium Holding Co. 2012.
37. BBC News 2011; Blacksmith Institute 2007; World Nuclear Association 2012; International Atomic Energy Agency n.d.; WHO 2005; Environ-ment News Ser vice 2010; Godoy 2011.
38. Harvey 2000; Harden and Morgan 2004; EPA 2012a; Wald 2010; Por-ter 2004; Washington State Department of Ecol ogy 2008.
39. Tsukimori and Layne 2011; Smith 2011; Bradsher and Pollack 2011. 40. Pino, Kannel, and Gardner 2012; Bhopal Census Highlights 2011. 41. Sources for this section on dead water zones are World Bank 2013b;
Diaz and Rosenberg 2008; Eggler 2007. 42. World Bank 2013b. 43. NOAA 2013b. 44. Wassener 2011; Hoshaw 2009. 45. Jowit 2008; World Food Programme 2013; UNICEF 2012. 46. Sources for this introductory section on Nestlé are CBC 2008; Hall
2010; Wagenhofer 2005; Brabeck- Lethame 2012; Tarlock 2004. 47. Wagenhofer 2005. 48. Brabeck- Lethame 2012. 49. Tarlock 2004. 50. Clarke 2007. 51. Crystal Springs Preserve 2013; Samek 2004; Schwartz 2004; Penn
2008. 52. Eskanazi 1998; Patoski 2011; Texas A&M University 2013. 53. Clarke 2007; Michigan Citizens for Water Conservation 2012. 54. Corporate Watch n.d. 55. Wellington Water Watchers 2011. 56. El Defensor Chieftan 2009; Ray 2013. 57. Sources for the section on Coca- Cola are Right to Water and Sanitation
2010; Sen 2003; Global Research 2010. 58. Blomfi eld 2007; Knobel 1997; Blacksmith Institute 2013d; Ruditsky
2004; Walsh 2007.
Notes to Pages 200–207 • 281
59. Ideas First Research 2010; Blacksmith Institute 2013e; EPA 2012b; En-vironment and Pro cess Division 2004.
60. Ballantyne et al. 2012; Rogers and Evans 2011; International Atomic Energy Agency n.d.; Gillis 2013; Ifran and Uvaneswari 2012; Mc-Kibben 2012.
61. McKibben 2012. 62. Chestney 2012; Economist 2011a. 63. Seager et al. 2007; Mingfang Ting interviewed in Vergano 2007. 64. Zeiss 2011; Gray 2012. 65. Carrington 2012. For an explanation see Freeland and Gilbert 2009;
“Sea Level,” Guardian, www .guardian .co .uk /environment /sea -level . 66. Viñas 2012; Rignot et al. 2011. 67. Kinnard et al. 2011; Pilkington 2008; Schuur and Abbott 2011.


283
Many people and many events have contributed to this book, too many to name. In a project that took years, there are a vast number of organizations and individuals I would like to thank; they are mostly recognized in the text, even if not always by their names. When it comes to the work of making a manuscript, I am particu-larly grateful to Walker Kahn for his great work on the case studies and throughout the preparation of the manuscript, to Laura Mc-Tighe for her research on prisons, to Anna Zamora for her indefati-gable work with the tables and graphs, and to Eunkyong Shin, Mary Joseph, Sarah Partridge, and Jared Conrad- Bradshaw for all their help. A big debt goes to my editor, Ian Malcolm, and his as-sistant, Joy Deng; the copyeditor, Sue Warga; and the production editor, Melody Negron. All errors are mine.
Ac know ledg ments

Aabø, Ellen, 94Aberfoyle, Canada, 196– 197Adjustment crises, 139Africa: middle sector growth, system
of, 14, 17; land acquisition in, 80, 94– 97, 99, 107, 108, 110; govern-ment debt, 92; foreign direct investment, decline in, 106; luxury home buyers, 134; drought, 152, 189, 203; land degradation, 152; heat waves, 154, 203
Agricultural production: small farmers and villages, expulsion of, 2, 3, 81– 83, 113, 215; extreme zones for economic operations, 9; land acquisition by foreign governments and, 82, 98; farmed land, total global area, 94; palm oil production (case study), 111– 114; land degradation and, 152– 153; climate change, impacts on, 154, 188, 202– 203; chromium pollution and, 172; mining/resource extraction, effect on, 181; fertilizer runoff, impact on oceans, 187– 188; rising sea levels and, 188
Agri SA, 108Air, pollutants in the: carbon trading
and the right to pollute, 4– 5; health impacts, 156– 157, 181– 182, 186– 187; from mining/resource extraction, 156– 157, 168– 169, 173– 174; from lead smelting, 166; from nuclear accidents, 182– 187; from pesticides, 186– 187; poison gases from chemical explosion, 186– 187
Alaska, permafrost thaw, 207Alpcot Agro, 107Alternative Trading Systems (ATS),
143Alvara, Velasco, 168Andorra, 67Angola: GDP growth, distributive
effects, 16; land acquisition in, 89
Antarctica, 102, 200Antimony production, 168Apollo Gold, 161Appalachia, mining in, 179Aral Sea, 203– 204Argentina, 139Arrighi, Giovanni, 136
Index
285

286 • Index
Asia: middle sector growth, system of, 17; land acquisition in, 80, 87; land degradation, 152; rising sea levels, 188
Asian fi nancial crisis (1997), 139, 140– 141
Assinboine, 159Asylum seekers, 55Atlas Energy, 176Atomredmetzoloto (ARMZ) mining
company, 181– 182Atomredmetzoloto Mines- Chita,
Rus sia, 181– 182Augustin Ranch, New Mexico, 197Australia: prisons and imprisonment
in, 68– 69, 71; land acquisition investors, 111; ratio of house hold credit to personal disposable income, 133; fracking in, 174
Austria, 51Azerbaijan, industrial waste in
Sumgayit, 165
Bahrain, 108Bai, Z. G., 153Bailouts, 137– 138Bangladesh, 62Banking industry: assets, total global
value, 118; innovation in the, 121; shadow banking system, 142– 145
Bankruptcies: suicides and, 54; municipal governments, 122; mining industry, 161– 164
Batteries, mining for resources, 148Battery recycling, 166– 167Belarus, 183Belgium, 69Benin, 102Bering Sea, 207Bhopal, India, 186– 187Biofuel production, 80– 81, 96,
99– 101, 111– 114
Birth defects, 179, 186, 199Bolivia, 67Bottled water, water appropriation
for, 190– 197Brabeck- Letmathe, Peter, 192Brazil: unemployment, 39; land
acquisition in, 98; small farmers, expulsion of, 98; land acquisition investors, 111; investment in the public good, 136; water appro-priation in, 196
Broken Hill Proprietary, 181Brutal simplicity, 4Bulgaria: foreclosures and expulsions,
50; poverty and social exclusion, population at risk, 51
Bunker Hill Mining, 162Burckhardt, Jacob, 4
Cabinet Mountain Wilderness Area, 163
Cadmium production, 168California, bankruptcy in Orange
County, 122Cameroon, 101Canada: prisons and imprisonment
in, 71, 72; fracking in, 174; water appropriation in, 196– 197
Capability, 118, 119, 149, 183Capitalism: advanced- traditional
relation, 10; new forms, 18– 19; emergent forms, expulsions and destruction of, 216
Carbon dioxide emissions, 200– 201Carbon trading, 4– 5Carlin Trend mine, 160Central America, 152Cerro de Pasco Copper Corporation,
168Chemical factories, 198– 199Chernobyl, Ukraine, 182– 184Chihuahuan Desert, 203

Index • 287
Children: in poverty, 51; social exclusion of, 51; austerity mea sures and, 91; cancer in, 157; illness in, 157; lead poisoning in, 165, 167, 168; battery recycling by, 166; in leather tanning work, 172; uranium poisoning, 182; aban-doned, 214
China: middle class growth, 17– 18; middle sector growth, system of, 17; government debt, 21; unem-ployment, 39, 40; prisons and imprisonment in, 67; land acquisi-tion investors, 80, 101, 102, 107, 108; special economic zones (SEZs), 102; housing fi nance, 122; superprime market for the very rich, 134; fi nancial capital, positives in, 147; rising sea levels, Ho Chi Minh City, 188; industrial emissions, 201
Chromium pollution, 169– 172, 199– 200
Ciavarella, Mark (kids- for- cash” judge), 69
Circuito das Aguas springs, 196Climate change: displaced persons
from, 55, 63, 207; causes of, 200– 201; altering, possibility of, 207– 208
Climate change, effect on: displaced persons population, 55; desertifi ca-tion, 62, 152, 189, 203– 204; land degradation, 152– 154; poverty, 153– 154; food insecurity/malnourishment, 154; ground-water recharge, 154; agricultural production, 188, 202– 203; land temperature, rise in, 201– 202; fresh water bodies, 203– 204; ocean acidity, 204– 205; ocean levels, 204– 207; methane gas
production, 207; permafrost thaw, 207
Coal mining. See Mountaintop removal mining
Columbia River, 184, 185Conceptually subterranean trends,
subterranean trends: 5, 6, 8, 63, 119, 150, 217
Copper mining, 156– 157, 168Corporate tax reductions, 19– 21Corporations: profi ts and assets,
growth in, 19– 21; prison labor, benefi t from, 74; fi nancial crisis, impact on, 141
Corrections Corporation of America (CCA), 68, 72
Costa Rica, 71Côte d’Ivoire, 56Credit default swaps, 127, 138,
141– 143Credit Suisse, 144Crystal Springs Recreation Preserve,
194Cuadrilla Resources, 178Cummins, Matthew, 24Cyanide gas, 186– 187Cyanide heap leaching, 159– 161Cyprus, 50Czech Republic: poverty and social
exclusion, population at risk, 51; prisons and imprisonment in, 69– 70; ratio of house hold credit to personal disposable income, 132
Dallara, Charles, 41Dark pools, 143– 145Dawn Mining, 162– 163Dead land, 2, 12, 16, 81, 83, 149,
150, 173, 210, 215, 222Dead water, 149, 150, 210, 222Debt: growth in governments, 21– 23,
27; need for, 146
288 • Index
Debt relief programs, 85, 90. See also International Monetary Fund (IMF) and World Bank restructur-ing programs
Demo cratic Republic of Congo: displaced persons, 56; asylum, provider of, 61; land acquisition in, 101, 107
Denmark: economic in e qual ity, 31; foreclosures and expulsions, 50; poverty and social exclusion, population at risk, 51; land acquisition investors, 111
Dent, D. L., 153Derivatives, 117– 118Desertifi cation, 62, 152, 189,
203– 204Diamond mining, 147Displaced persons: classifi cation of,
16, 55– 56; growth trends, 55, 56; by country, 56, 57, 61; protracted displacements of, 56; by classifi ca-tion, 57, 59– 60; facts and fi gures, 58; asylum populations by continent, 59– 60; asylum, economic consequences of, 61
Displaced persons, conditions creating: land acquisition by foreign governments, 2, 3, 81– 83, 98, 215; foreclosures, 3, 48– 50, 120, 127– 128; global wealth, extreme concentration of, 15– 16; climate change, 55, 63, 207; confl ict, internal displacement by, 55, 56; persecution, 55; environ-mental disasters, 62– 63
Djibouti, 111Doe Run Company, 168– 169Dominican Republic, lead pollution
in Haina, 167– 168Down syndrome, 182Drought, 152, 189, 194, 203
Dubai, 134Dust Bowl, 203Duval, Frank, 159, 161– 163Dzerzhinsk, Rus sia, 198– 199
Earthquakes, hydraulic fracturing and, 177– 178
Eastern Eu rope: land acquisition in, 97; ratio of house hold credit to personal disposable income, 132
Economic contraction in the global economy: excessive, defi ned, 24; extreme forms, Greece, Portugal, Spain, 35– 43, 214; redefi ning the space of the economy, 36– 37; unemployment, 39– 40, 44– 46; restructuring, consequences of, 40– 42; economic recovery, conditions opposing, 43; out- migration, 46– 48; foreclosures, 48– 50; material deprivation and, 50– 53; poverty and poverty risk, 50– 54; displacement trends, 54– 55; homelessness rates, 54; suicide rates, 54; foreign direct investment, decline in, 106; shift toward, 213– 214; brutality of exclusion in, 214– 216. See also Economic in e qual ity
Economic growth: geography of extraction, 12– 14, 219; primitive accumulation, 12, 14– 15, 128; in e qual ity and, methods deterring, 16– 18; Western vs. non- Western market economies, post- WW II era, 16– 18; and prosperity, reconsidering, 146– 148
Economic in e qual ity: structures of, 13– 14, 24– 27; extremes, achieving, 13– 16; post- crisis, 13; as expul-sion, 15; economic growth rates and, 16– 17; growth in, 25– 27;
Index • 289
acute phase, expulsions marking, 29; within countries, rise in, 31– 35; among countries, 31; pre- crisis, 54; IMF and WB restructuring programs, 88; foreign land acquisition and, 93; reconsidering, 147
Economic recovery in the global economy: fi scal contraction for, 24; systemic expulsion in, 218– 219
Economic recovery in the global economy, conditions opposing: unemployment, 44– 46; out- migration, 46– 48; foreclosures, 48– 50; poverty, poverty risk, social exclusion, material deprivation, 50– 54
Economic violence: foreclosures and expulsions, 3, 48– 50, 120, 123, 125– 126, 127– 128, 139– 140; to municipal governments, 120, 129; in mining and resource extraction, 146– 147
Ec ua dor, 71, 72Egypt, 108Environmental destruction: innova-
tion’s role in, 12, 149; acceleration in, 149– 150, 200– 206; ending with possibility of renewal, 149; genealogies of, 150; globally, similarities in, 150; summary overview, 206– 210; preventing, 208– 210; carbon trading and the right to pollute, 209. See also Specifi c causes of
Environmental expulsions: from mining/resource extraction, 2– 3, 161, 179, 181; scaling effects, 3– 4; from land acquisition by foreign governments, 82; contributors to, 150
Estonia, 50
Ethiopia, land acquisition in, 95, 107, 108, 109
Eu rope: middle sector growth, system of, 17; foreclosures and expulsions, 48
Eu ro pe an Union: unemployment, 39; poverty and social exclusion, population at risk, 51; fi nancial assets to GDP ratio, 136
the expelled: the unemployed, 1, 3; abandonment of, 54; despair of, 54; increases in, 54, 222; indiffer-ence to, 123, 125– 126, 147– 148; invisibility of, 139– 140, 222. See also Displaced persons; Imprisonment
Expulsion: pro cesses and conditions, diversity in, 1– 3; logics of, 1; channels of, 2– 3; instruments of, 2, 213– 217; complexity producing brutality, 4– 5; subterranean trends, 5– 8, 211– 212, 215, 217; probable, concentration of global wealth and, 15– 16; the systemic edge of, 76– 79, 211– 218, 221; normaliza-tion of, 76; defi ned, 216– 217
Expulsion dynamics, 3– 10, 76– 79, 211
Extraction, global geography of, 219
Farmed land, total global area, 94Federal Bureau of Prisons (U.S.), 74Federal Prison Industries (U.S.), 74Federal prisons, U.S., 74, 75Finance: expulsion dynamics, 9;
predatory formations enabled by, 13; profi t, morality of, 117; as capability, 118– 120; innovation in, 122– 127, 138, 218– 220; crises as characteristic of, 136– 137; growth limits, 137– 138; language of crisis, 138– 139; debt, need for, 146
290 • Index
Financial crises: losers, indifference to, 123, 125– 126, 139– 140; meaning of, 138– 139; postadjust-ment stability, 139– 140; potential for, 140– 141
Financial crisis (2008): factors underlying, 127, 138, 141– 143; GDP growth following, 140; wealth in e qual ity post-, 140; crises contained in, 145
Financial institutions, need for, 146– 147
Finland: economic in e qual ity, 32; foreclosures and expulsions, 50; poverty and social exclusion, population at risk, 51
Florida, water appropriation in, 194– 195
Food demand/prices, land acquisition by foreign governments and, 96
Food insecurity, 106, 154Ford, Washington, 162Foreclosed homeowners, indifference
to, 123, 125– 126, 139– 140Foreclosures and expulsions, 3,
48– 50, 120, 127– 128, 219Foreign aid, shift in, 89– 90Foreign direct investment, decline in,
106– 107Fort Belknap Reservation, 161France: tax evasion, 22; prisons and
imprisonment in, 68, 69, 72; land acquisition investors, 111; superprime market for the very rich, 134; fracking in, 174
Friis, Cecilie, 108Fukushima Daiichi, Japan, 185– 186
Gabon, 101Germany: GDP growth, distributive
effects, 16; government debt, 21; tax evasion, 22; economic
in e qual ity, 32; unemployment, 39; asylum, provider of, 61; prisons and imprisonment in, 69, 70, 72, 74; war debt, 90; land acquisition investors, 108; housing fi nance, 126; fi nancial crisis, susceptibility to, 140
Global cities, new geography of, 9– 10, 18– 19, 101– 102
Global economies: wealth, structures creating extreme, 13– 16; market based, shift in, 16– 19; shifts in, expulsions marked by, 29; economic in e qual ity in, 31– 35, 54; restructuring post- crisis, consequences of, 40– 42; pre- crisis, 54; GDP, total value, 118; growth potential, 129, 131– 133; asset growth, public benefi t from, 136
Global economies, factors creating new forms of: extreme modes of profi t expansion, 18– 19; corporate profi ts and assets, reduction of corporate taxes, 19– 21; govern-ment debt, growth in, 21– 23; income/wealth in e qual ity, 24– 27; urban redevelopment/gentrifi ca-tion, 28– 29; systemic expulsion, 217– 218
Global housing market: residential mortgage capital, potential growth globally, 129, 131– 133; su-perprime market for the very rich, 133– 135
Global South: IMF and WB restruc-turing programs, consequences of, 27, 83– 93; debt/debt ser vice payments, 91, 92
Global warming, 152– 155Goldman Sachs, 119, 137, 144Gold mining, 159– 161, 168,
173– 174

Index • 291
Government debt, growth in, 21– 23, 27
Governments, municipal, 120, 129Greece: economic contraction, 15,
35– 43; restructuring, 41; economic recovery, conditions opposing, 43– 44; unemployment, 44– 46; foreclosures and expulsions, 50; poverty and social exclusion, population at risk, 51, 54; prisons and imprisonment in, 70, 72; derivatives sale, 137
Greenland, 200, 205– 206Gros Ventre, 159Ground level, facts on the ground,
6, 8, 11, 36, 76, 77, 111Groundwater exhaustion, 154, 196,
198Groundwater pollution, 198, 199.
See also Water, pollutants in theGroundwater protections, 193– 195Gutierres, António, 61Gyres, oceanic, 150, 190– 191
Haina, Dominican Republic, 167– 168Haiti, 67Hanford, Washington, 184– 185Heat waves, 152– 154, 202Heavy metals pollution, 156, 168– 169Hindustan Coca- Cola Beverages, 198Homelessness, 54Hong Kong: prisons and imprison-
ment in, 71, 72; superprime market for the very rich, 134
Horn of Africa, 189Housing: economic role, 121– 122;
residential- mortgage- backed securities, 20th vs. 21st century, 124– 126. See also Subprime mortgage crisis
Housing market, globally: residential mortgage capital, potential growth
globally, 129, 131– 133; superprime market for the very rich, 133– 135
Human organs, harvesting, 9Human traffi cking, 89Hungary: foreclosures and expul-
sions, 48, 50; poverty and social exclusion, population at risk, 51; prisons and imprisonment in, 69; ratio of house hold credit to personal disposable income, 132; foreclosures, 219
Hunger, 82, 139– 140, 214Hurricane Sandy, 189Hydraulic fracturing: water table
impacts, 174– 177; pro cess, 174; radioactivity and, 175– 176; earthquakes and, 177– 178
Hyundai Heavy Industries, 107
Ice sheet melt, 205– 207Imprisonment: global wealth,
extreme concentration of, 15– 16; advanced capitalism and, 63– 64; carceral surveillance as, 64– 65; growth trends, 64, 66– 67; population trends, 64; globally- U.S. compared, 65– 75; statistics, 66, 68. See also Prisons, private- for- profi t
Inclusion era, shift away from, 212– 214
India: unemployment, 39; economic despair in, 54; land acquisition in, 102; special economic zones (SEZs), 102; land acquisition investors, 108; leather tanning industry in Ranipet, 171– 172; industrial development, 171; chemical explosion in Bhopal, 186– 187; water appropriation in, 197– 198; chromium pollution, Sukinda Mines, 199– 200; chromium production, 199– 200
292 • Index
Indonesia: palm oil production (case study), 111– 114; rising sea levels, Jakarta, 188
Industrial waste: variable mechanisms, 155; Norilsk, Rus sia, 156– 159; Zortman- Landusky, U.S., 159– 164; Times Beach, Missouri, 164; Sumgayit, Azerbaijan, 165
Innovation: biosphere, threat to, 12, 149; wealth concentration and, 13; in banking, 121; in housing, 121; fi nancial, 122
International Monetary Fund (IMF) and World Bank restructuring programs: goals, failure of, 90– 91; historical debt relief vs., 90
International Monetary Fund (IMF) and World Bank restructuring programs, consequences of: fi scal/economic contraction, 27; govern-ment debt, growth in, 27; foreign land acquisition, 83– 93; debt relief programs, 85; government destabili-zation, 85; private sector, 85; systemic deepening of advanced capitalism, 86; poverty, 88– 89; wealth in e qual ity, 88; criminal networks, 89; human traffi cking, 89; social welfare programs cuts, 91
International Monetary Fund (IMF) restructuring programs: goal of, 217; systemic expulsion in, 218
Iran, 56, 61Iraq, 56Ireland: foreclosures and expulsions,
50; prisons and imprisonment in, 69, 72
Israel: economic in e qual ity, 31; prisons and imprisonment in, 71; land acquisition investors, 108
Italy: land acquisition investors, 111; speculative losses paid for by government funds, 120
Japan: middle sector growth, system of, 17; unemployment, 39; land acquisition investors, 108; housing fi nance, 122; ratio of house hold credit to personal disposable income, 133; Fukushima Daiichi nuclear disaster, 185– 186
Johnson, David Cay, 20Jordan, 108
Karmala, India, 197– 198Kazakhstan, 199Kenya, 61Keynesian era, 9– 10, 26, 76, 140Khorol Zerno, 107Kootenai National Forest, 163Krasnokamensk mine, Rus sia, 181Kring, Thomas, 94Kuwait, 108
Land: farmed land, total global area, 94; pasture land, growth in, 94; fragility, extent of, 150
Land, degradation of the: causes of, 151– 152; climate change and, 152– 154; defi ned, 152; evolution of, 153; toxic waste and, 155– 165; state vs. private own ership, impact on, 157; by dioxins, 164; nuclear accidents, 183
Land acquisition by foreign govern-ments: amount (in total), 80– 81, 93– 97; systemic dynamics, 80– 81; buyers, diversity in, 80; geo graph i-cal range, 80; global footprint, 81– 83; servicing infrastructure, 81; material practices of, 82– 83, 106– 107; IMF and WB restructur-

Index • 293
ing programs enabling, 83– 93; data, sources of, 93– 96; corruption and, 93; land use, 94; regionalism, 96– 100; most- targeted countries, 98; by country, 103; by availability, 104– 105; sellers, African, 108– 109; palm oil production (case study), 111– 114; summary overview, 114– 116
Land acquisition by foreign govern-ments, consequences of: land/water toxicity, 81; hunger, 82; mass migration, 82; emergence of predatory elites, 93; wealth in e qual ity, 93; FDI investment, shifts in, 106– 107; food insecurity, 106
Land acquisition by foreign govern-ments, drivers of: biofuel produc-tion, 80– 81, 96, 99– 101, 111– 114; investment growth, 81; servicing infrastructure, 81; carbon seques-tration, 96; food demand/prices, 96; mining/resource extraction, 96; timber demand, 96, 100– 101; special economic zones (SEZs), 101– 102; water access and use, 102, 104– 106
Land acquisition by foreign govern-ments, expulsions: small farmers and villages, 2, 3, 81– 83; fl ora/fauna, 82
Land acquisition by foreign govern-ments, investors: diversity in, 80; origin of investment, 98; investor types, 101, 108; in Africa, by country of origin, 108– 111
Laos, 80Latin America: middle sector growth,
system of, 14; land acquisition in, 80, 87, 97; government debt, 92
Latvia: foreclosures and expulsions, 48, 50; poverty and social
exclusion, population at risk, 51; foreclosures, 120
Lead pollution: health impacts, 165, 167– 168; battery recycling, 166– 167; global exposure, 166; Haina, Dominican Republic, 167– 168; reclamation efforts, 167– 168; La Oroya, Peru, 168– 169
Leather tanning industry, 169– 172Lebanon, 108Liberia, 67Libya: displaced persons, 56; land
acquisition in, 99; land acquisition investors, 111
Lithuania, 51Little Bighorn River, 161Logic of inclusion, 212London: superprime market for the
very rich, 134; Olympic Park, 136Louisiana, prisons and imprisonment
in, 65– 66, 75Loverdos, Andreas, 54Low- income workers, expulsion, 1Lumumba, Patrice, 86Luxembourg, 51
Madagascar: foreign direct invest-ment, decline in, 106; land acquisition in, 108, 109
Malaysia, palm oil production (case study), 111– 114
Mali: economic in e qual ity, 31; prisons and imprisonment in, 67; land acquisition in, 108
Malnourishment, 104, 106, 154Marcellus Shale stratum, 176Market economy, 16– 19Marshals Ser vice, U.S., 75Mauritius, 111McKibben, Bill, 202McTighe, Laura, 69
294 • Index
Mekong Delta, Vietnam, 188Meramec River, 164Mercury vapor, 173– 174MetaloXa Company, 167Methane gas production, 207Mexico: prisons and imprisonment
in, 65; fi nancial crisis (1994), 139; desertifi cation, 203
Michigan, water appropriation in, 195– 196
Middle class, expulsion of the, 3Middle class growth, 17Midnite Mines Inc., 162– 163Milanovic, Branko, 31Mining/resource extraction:
environmental expulsions, 2– 3, 179; land acquisition by foreign governments for, 96; by the poor, 147– 148; of rare metals, 147– 148, 159– 161, 168; poverty created through, 148; of heavy metals, 156– 158, 162– 163, 168, 173– 174, 181– 182, 199– 200; reclamation costs, 159, 161, 163; SEC sanctions, 161– 162; profi tability and bankruptcy, 161– 164; by hydraulic fracturing, 174– 177; mountaintop removal mining, 179– 181. See also Chromium pollution; Lead pollution; Specifi c metals
Minorities expulsions, 3Mogadishu, Somalia, 87Molnar, Augusta, 100Monaco, 134Montana, mining/resource extrac-
tion, 159, 163Morgan Stanley, 107Moscow, superprime market for the
very rich, 134Mountaintop removal mining,
179– 182
Mozambique: displaced persons, climatic conditions for, 62– 63; land acquisition in, 95, 108
Murphy, Richard, 21– 22Murphy, Sophia, 95
Natural gas, 177. See also Hydraulic fracturing
Netherlands: poverty and social exclusion, population at risk, 51; land acquisition investors, 108
Nevada, gold mining in, 160New global capitalism, 18New Guinea, Ok Tedi Mine- Papua,
180– 181New Mexico, Augustin Ranch,
197Newmont USA Limited, 162– 164New South Wales, 71Newtok, Alaska, 207New York, superprime market for
the very rich, 134New Zealand, prisons and imprison-
ment in, 65, 71Nickel production, 156Niger, 67Nigeria: land acquisition in, 89, 95;
foreign direct investment, decline in, 106
Norillag labor camp, 156Norilsk, Rus sia, industrial waste,
156– 159Norway, 50Nuclear accidents: Chernobyl,
Ukraine, 182– 184; health impacts, 183– 184; Hanford, Washington, 184– 185; plutonium production, 184– 185; Fukushima Daiichi, Japan, 185– 186
Null, Stephen, 167Nussbaum, Martha, 118

Index • 295
Oceania: prisons and imprisonment in, 71; land acquisition in, 97
Oceans: dead zones, 150, 187– 188; fragility, extent of, 150; trash gyres, 150, 190– 191; agricultural production, impact on, 187– 188; acidity levels, 187, 204; rising water levels, 188– 189, 204– 207; climate change, effect on, 204– 207
Oil exploration, 148Oklahoma: prisons and imprison-
ment in, 66; seismic activity, 178Ok Tedi Mine- Papua, New Guinea,
180– 181Olsson, L., 153Oman, 108La Oroya, Peru, 168– 169Ortiz, Isabel, 24Out- migration, 36, 46– 48Outsourcing, 9, 18– 19, 126– 127
Pakistan: asylum, provider of, 56, 61; land acquisition in, 99, 107
Palar River, 171, 172Palm oil production (case study),
111– 114Parole as imprisonment, 64– 65Pasture land, growth in, 94Pegasus Gold Corporation, 159– 161Pennsylvania landfi lls, 176Peru: prisons and imprisonment in,
65; biofuel production, 100; lead pollution in, La Oroya, 168– 169
Pesticides, 198Philippines, rising sea levels, 188Plachimada, India, 198Plantation forestry, growth in, 94Plastic dissolved in oceans, 190– 191Plutonium production, 184– 185Poison gases; chemical explosion,
Bhopal, India, 186– 187Poland, 50
Portugal: economic contraction, 35– 43; economic recovery, conditions opposing, 43– 44; unemployment, 44– 46; foreclo-sures and expulsions, 50
Poverty: middle class, 3; urban redevelopment/gentrifi cation creating, 28– 29; populations at risk, 50– 51; adverse condition for economic recovery, 50– 54; child, 51; IMF and WB restructuring programs and, 88– 89; restructur-ing and increases in, 89; creation through indifference, 147– 148; need for, reconsidering, 147– 148; climate change and, 153– 154; child abandonment and, 214
Predatory formations, 13– 14, 76– 79, 93, 220– 221
Prisoner labor, 74– 75, 156Prisoner warehousing, 3Prisons, private- for- profi t, 64– 65,
68– 75, 78Privatization: new global capitalism
and, 18; of prisons and prison ser vices, 64– 65, 68– 75, 78; debt restructuring with, consequences of, 84– 85
Profi t, morality of, 117Puerto Rico, 68Putzel, Louis, 101
Qaraqum Canal, 204Qatar, 108
Radioactive emissions: mining/resource extraction and, 162– 163, 181– 182; hydraulic fracturing and, 175– 176; from nuclear accidents, 182– 187
Ranipet, India, 171– 172Rare metals, mining for, 147– 148

296 • Index
Reenberg, Anette, 108Refugees, 3, 55, 56, 61Residential- mortgage- backed
securities, 20th vs. 21st century, 124– 126
Residential mortgage capital, potential growth globally, 129, 131– 133
Rio, mass- transport system, 136Rio Grande Basin, 196– 197Rohr Springs, Texas, 194Romania, 51Rozenberg, Zhak, 158Russell Bliss waste- oil company, 164Rus sia: middle sector growth, system
of, 17; tax evasion, 22; unemploy-ment, 39; imprisonment statistics, 67; prisons and imprisonment in, 67, 71, 72; land acquisition in, 80, 107; luxury home buyers, 134; superprime market for the very rich, 134; industrial waste in Norilsk, 156– 159; uranium mining at Atomredmetzoloto Mines in Chita, 181– 182; nuclear disaster at Chernobyl, 182– 184; public waterways for poison disposal, Dzerzhinsk, 198– 199
Saudi Arabia, land acquisition investors, 108, 111
Schaepman, M. E., 153Securitization, defi ned, 118Sen, Amartya, 118Serra da Mantiqueira region, Brazil,
196Ser vice sector growth, 25Shadow banking system, 142– 145Shanghai, 134Siberia: land acquisition in, 107;
Taimyr Peninsula, 157Silver mining, 168
Singapore, 134Slovenia, 51Small farmers and villages, expulsion
of, 2, 3, 81– 83, 98, 113, 215Social expulsion: of children, 51;
of the homeless, 54; increases in, 54, 63; foreclosed homeowners, indifference to, 123, 125– 126, 139– 140; shift toward, 213– 215
Social welfare programs, 91Somalia: middle sector growth,
system of, 14, 214; displaced persons, 56; land acquisition in, 87
Soros, George, 141South Africa: displaced persons, 55;
prisons and imprisonment in, 65, 71; foreign direct investment, decline in, 106; land acquisition investors, 111; fracking in, 174; chromium production, 199
South America: middle sector growth, system of, 17; immigra-tion, 48; prisons and imprisonment in, 71
South Korea: middle sector growth, system of, 17; unemployment, 39; land acquisition investors, 107, 108; ratio of house hold credit to personal disposable income, 132; fi nancial crisis, impact on, 141
South Sudan, 56Spain: economic contraction, 15,
35– 43; unemployment, 40, 44– 46; restructuring, 41; economic recovery, conditions opposing, 43– 44; out- migration, 46– 48; foreclosures and expulsions, 48, 50; poverty and social exclusion, population at risk, 51; foreclo-sures, 120, 219; ratio of house hold credit to personal disposable income, 133
Index • 297
Special economic zones (SEZs), 101– 102
Spokane Indian Reservation, 162Spokane River, 163Stirling Mining, 163Subprime mortgage crisis: foreclo-
sures and expulsions, 3, 120, 127– 128; speculative losses paid for by government funds, 120, 130; investor indifference in, 123, 125– 126; factors underlying, 127; mortgage lending/borrowing by race, 128– 129
Subprime mortgage fi nancial project, function of, 4– 5
Subprime mortgage instrument, development of, 122– 126, 219
Sub- Saharan Africa: land acquisition in, 87, 89, 106, 108; drought, 152; global warming, effect in, 153, 189; water scarcity, 189; middle sector growth, system of, 214
Sudan: displaced persons, 56; land acquisition in, 95, 99, 107, 108
Suharto dictatorship, 113Suicide rates, 36, 54, 214Sukinda Mines, India, 199– 200Sulfur dioxide emissions, 156, 158,
166Sumgayit, Azerbaijan, industrial
waste, 165Sweden: economic in e qual ity, 32;
foreclosures and expulsions, 48; poverty and social exclusion, population at risk, 51; land acquisition investors, 80, 107, 108
Swift Gulch tributary, 161Syria, 61
Taimyr Peninsula, Siberia, 157Taiwan, 17Tanzania, 108
Taxes: corporate, reductions in, 19– 21; tax evasion, globally, 21– 23; individual, rise in, 21
Tax evasion, 22– 23Texas: prisons and imprisonment in,
66; water appropriation in, 195Thailand: prisons and imprisonment
in, 71; rising sea levels, 188; rising sea levels, Bangkok, 188
Thomas, Bob, 194Timber demand in land acquisition
by foreign governments, 96, 100– 101
Times Beach, Missouri, industrial waste, 164
Trade barriers, consequences of lifting the, 84– 85
Trade barriers, lifting of, 18Trash gyres, 150, 190– 191Turkey, 40
Ukraine, 80, 107, 183Unemployed, expulsion of the, 1, 3Unemployment, 36, 39– 40, 44, 141 Union Carbide pesticide plant,
186– 187United Arab Emirates, 107, 108United Kingdom: tax evasion, 22;
economic in e qual ity, 31; foreclo-sures and expulsions, 50; prisons and imprisonment in, 63– 64, 65, 68– 69, 72; land acquisition investors, 108, 111; luxury home buyers, 134; superprime market for the very rich, 134; fi nancial assets to GDP ratio, 136; investment in the public good, 136; fi nancial crisis, susceptibility to, 140
United States: GDP growth, distri-butive effects, 16– 17; economic in e qual ity, 19– 20, 25– 27, 31– 35; tax evasion, 22– 23; unemployment,

298 • Index
United States (continued) 44– 46; economic despair in, 54;
land acquisition investors, 111; speculative losses paid for by government funds, 120, 129, 137– 138; ratio of house hold credit to personal disposable income, 133; superprime market for the very rich, 134; bailouts, 137; fi nancial crisis, susceptibility to, 140; drought, 152, 189, 194, 203; climate change, effect in, 189; industrial emissions, 201; heat waves, 202. See also Subprime mortgage crisis
United States prisons, global comparisons, 65– 75
Uranium extraction, 162– 163, 181– 182
Vietnam: land acquisition in, 80; rising sea levels, 188
Washington: Midnite Mine, 162; Hanford nuclear plant, 184
Water: land acquisition in, 102, 104– 106; commodifi cation of, 190– 192; human right to, 192– 193; protection of, 194– 195. See also Oceans
Water, pollutants in the: cyanide, 159– 161; expulsions from, 161, 181; from mining/resource extraction, 161, 162– 165, 173– 174, 180– 181; radioactive,
162– 163, 185; dioxins, 164, 199; health impacts, 165; chromium, 169– 172, 200; from the leather tanning industry, 169– 172; from agricultural production, 172; heavy metals, 173– 174; from hydraulic fracturing, 175– 177; radiation, 176; chemicals, 177; natural gas components, 177; from nuclear accidents, 185; public waterways to discharge poisons, 198– 200; pesticides, 198; toxic chemicals, 199
Water appropriation: for hydraulic fracturing, 174– 175; Nestlé, 191– 197; law of capture, 193, 195; Coca- Cola, 197– 198; Augustin Ranch, New Mexico, 197
Water scarcity: land degradation and, 152; desertifi cation and, 189; economic impacts, 189; ground-water exhaustion, 196, 198
Water table, pollution of the, 176– 177
World Trade Or ga ni za tion (WTO), 84– 85
Yemen, 56Yup’ik Inuit, 207
Zambia, 107Zinc extraction, 168Zortman- Landusky, U.S., industrial
waste, 159– 164

![Saskia Sassen - Buenos Aires · 2018-09-13 · saskia sassen. dos aspectos claves en las economias de occidente. intermediacion (intermediation] •la financializacion de mas y mas](https://img.pdfslide.us/doc/110x75/5eb8dfde9b375444da2cc99a/saskia-sassen-buenos-2018-09-13-saskia-sassen-dos-aspectos-claves-en-las-economias.jpg)