Embed Size (px)
Citation preview

FRA2010/199 Rome, 2010
Forestry Department Food and Agriculture Organization of the United Nations
GLOBAL FOREST RESOURCES
ASSESSMENT 2010
COUNTRY REPORT
SURINAME
2
The Forest Resources Assessment Programme Sustainably managed forests have multiple environmental and socio-economic functions important at the global, national and local scales, and play a vital part in sustainable development. Reliable and up-to-date information on the state of forest resources - not only on area and area change, but also on such variables as growing stock, wood and non-wood products, carbon, protected areas, use of forests for recreation and other services, biological diversity and forests’ contribution to national economies - is crucial to support decision-making for policies and programmes in forestry and sustainable development at all levels.
FAO, at the request of its member countries, regularly monitors the world’s forests and their management and uses through the Forest Resources Assessment Programme. This country report forms part of the Global Forest Resources Assessment 2010 (FRA 2010). The reporting framework for FRA 2010 is based on the thematic elements of sustainable forest management acknowledged in intergovernmental forest-related fora and includes variables related to the extent, condition, uses and values of forest resources, as well as the policy, legal and institutional framework related to forests. More information on the FRA 2010 process and the results - including all the country reports - is available on the FRA Web site (www.fao.org/forestry/fra ). The Global Forest Resources Assessment process is coordinated by the Forestry Department at FAO headquarters in Rome. The contact person for matters related to FRA 2010 is: Mette Løyche Wilkie Senior Forestry Officer FAO Forestry Department Viale delle Terme di Caracalla Rome 00153, Italy E-mail: [email protected] Readers can also use the following e-mail address: [email protected]
DISCLAIMER The designations employed and the presentation of material in this information product do not imply the expression of any opinion whatsoever on the part of the Food and Agriculture Organization of the United Nations concerning the legal status of any country, territory, city or area or of its authorities, or concerning the delimitation of its frontiers or boundaries. The Global Forest Resources Assessment Country Report Series is designed to document and make available the information forming the basis for the FRA reports. The Country Reports have been compiled by officially nominated country correspondents in collaboration with FAO staff. Prior to finalisation, these reports were subject to validation by forestry authorities in the respective countries.

FRA 2010 – Country Report, Suriname
3
Contents
INTRODUCTION .......................................................................................................................................................5
1 TABLE T1 – EXTENT OF FOREST AND OTHER WOODED LAND.....................................................7
2 TABLE T2 – FOREST OWNERSHIP AND MANAGEMENT RIGHTS .................................................12
3 TABLE T3 – FOREST DESIGNATION AND MANAGEMENT ..............................................................17
4 TABLE T4 – FOREST CHARACTERISTICS ..........................................................................................22
5 TABLE T5 – FOREST ESTABLISHMENT AND REFORESTATION...................................................25
6 TABLE T6 – GROWING STOCK................................................................................................................27
7 TABLE T7 – BIOMASS STOCK ................................................................................................................30
8 TABLE T8 – CARBON STOCK .................................................................................................................32
9 TABLE T9 – FOREST FIRES......................................................................................................................35
10 TABLE T10 – OTHER DISTURBANCES AFFECTING FOREST HEALTH AND VITALITY ..........37
11 TABLE T11 – WOOD REMOVALS AND VALUE OF REMOVALS ....................................................38
12 TABLE T12 – NON-WOOD FOREST PRODUCTS REMOVALS AND VALUE OF REMOVALS...41
13 TABLE T13 – EMPLOYMENT ...................................................................................................................46
14 TABLE T14 – POLICY AND LEGAL FRAMEWORK .............................................................................48
15 TABLE T15 – INSTITUTIONAL FRAMEWORK ......................................................................................50
16 TABLE T16 – EDUCATION AND RESEARCH.......................................................................................52
17 TABLE T17 – PUBLIC REVENUE COLLECTION AND EXPENDITURE ..........................................54

FRA 2010 – Country Report, Suriname
4
Report preparation and contact persons The present report was prepared by the following person(s):
Name (FAMILY NAME, First name)
Institution / address E-mail Fax Tables
Rene Somopawiro
Stichting voor Bosbeheer en Bostoezicht(SBB) Foundation for Forest Management and Production control)
[email protected] 483051 1-17
Sarah Crabbe Stichting voor Bosbeheer en Bostoezicht (SBB)
[email protected] 483051 1-9
Matai Rewiechand Stichting voor Bosbeheer en Bostoezicht (SBB)
[email protected] 483051 11-13, 59-62
Farida Abdul Stichting voor Bosbeheer en Bostoezicht (SBB)
[email protected] 483051 14-15
FRA 2010 – Country Report, Suriname
5
Introduction Internationally Suriname is known as “a high forest cover with low rates of deforestation” (HFLD) country. National efforts has been made to conserve and protect the forest and to promote sustainable forest management. Approximately about 90% of the land area is still covered by forest of which 2.3 million ha of forest (13% of the total forest area) is formally protected while 4-5 million ha is designated as production forest. In the area which has been designated as production forest, the so called “forestry belt”, logging is done in a selective manner, as a result of which the forest cover remains even after the timber has been harvested. Deforestation has taken place due to illegal (small scale gold) and legal mining, man-made hydropower lake, agriculture including slash and burn, road construction etc. To stimulate the development of the national economy, it will be inevitable that forested land might be converted to among others oil palm plantations, bauxite and gold mines, a second hydropower lake, road construction etc. Therefore some important land use decisions should and will be made. In this matter the knowledge of the resources, in the FRA 2010 specifically the forest resources, is of an extremely high importance. This FRA 2010 has been filled in by the Foundation of Forest Management and Production Control (SBB), with consultation of other data sources if needed. The SBB was established in 1998 to fulfil the mandates of the Forest Service of Suriname to carry out among others the monitoring of the production forest and forest inventories and to produce production statistics. This makes the SBB to the most convenient organisation to provide national forest resource data. With this FRA 2010 efforts have been made to present the best available information regarding the Surinamese forest resources to the international community. The listing of all points, referred to in the FRA 2010-tables, also increased the insight in national information. This might help to refine the daily process of monitoring of the Surinamese forest resources. During the last decades plenty of information about the forest resources has been collected, but mainly in biomass and carbon stock and deforestation and degradation rates, still some important information-gaps exist. Taking into account the national and international attention given to these issues, for the next FRA its necessary that a comprehensive national forest inventory must be carried out, institutional capacity should be strengthened as well as human resources capacity strengthening on all level. Capacity improvement must take place in particular regarding monitoring of land use, forest conversions and changes in carbon stocks. This should lead to more detailed data. Assistance from among others the FAO to achieve this capacity strengthening will be necessary. In 1998 The Foundation for Forest Management and Production Control (SBB) has produced an Indicative Forest Classification Map (see following figure). The basis of the map is topographic data, some FAO inventory data from the seventies and rough estimations of economic feasibility of some specific land uses. The intention was to use the map as a reference in a participatory discussion process to arrive at some conclusions on the division of forest land over the five categories. On the map large areas of Preliminary Permanent Forest appear, mainly mixed marsh and mesophytic high dryland forest situated in the west, and south of the coastal area. Some conversion areas have been identified but they do not include an envisaged mining area near the Bakhuys Mountains, a possible hydro power lake in the same region and an envisaged oil palm plantations of 120,000 ha.

FRA 2010 – Country Report, Suriname
6

FRA 2010 – Country Report, Suriname
7
1 Table T1 – Extent of Forest and Other wooded land
1.1 FRA 2010 Categories and definitions
Category Definition Forest Land spanning more than 0.5 hectares with trees higher than 5 meters and
a canopy cover of more than 10 percent, or trees able to reach these thresholds in situ. It does not include land that is predominantly under agricultural or urban land use.
Other wooded land Land not classified as “Forest”, spanning more than 0.5 hectares; with trees higher than 5 meters and a canopy cover of 5-10 percent, or trees able to reach these thresholds in situ; or with a combined cover of shrubs, bushes and trees above 10 percent. It does not include land that is predominantly under agricultural or urban land use.
Other land All land that is not classified as “Forest” or “Other wooded land”. Other land with tree cover (Subordinated to “Other land”)
Land classified as “Other land”, spanning more than 0.5 hectares with a canopy cover of more than 10 percent of trees able to reach a height of 5 meters at maturity.
Inland water bodies Inland water bodies generally include major rivers, lakes and water reservoirs.
1.2 National data
1.2.1 Data sources
References to sources of information
Quality (H/M/L)
Variable(s) Year(s) Additional comments
Lindeman J.C and S.P Molenaar
H Forest types 1957 Classification of forest types
Preliminary Classification of Forested land of Suriname
M Forest Classification/NARENA
SBB
1998 LANDSAT TM images of 1998, Aerial photo’s, Field checks, topographic maps has been used to asses the extend of the forest types with GIS
Indicative Forest Classification map
M NARENA/SBB 1998 As mentioned above
1.2.2 Classification and definitions National class Definition
High Dry land Forest (Rain Forest)
Is a three or four storeys forest with emergent trees up to 45 m. The lower storey reaches 25 to 30 m. Its undergrowth consists of small trees and poles.
High Savannah Forest or dry evergreen forest
Is a two storey forest with a closed canopy reaching 25-30 meters on height. Big trees are scarce. Palms are few and small. Dominant species are the same as in the rain forest. It occurs on deep white sand
Low Savannah forest This forest does not show any storey. Height varies from 10 – 20 meters. This type of forest is very dense and closed and more homogenous than the previous ones

FRA 2010 – Country Report, Suriname
8
High Swamp forest. These forests are marked by very wet conditions all year round. The shorter the inundation period the more it resembles the rain forest. Is at least 20 meter high with two storeys and is fairly closed.
Low Swamp Forest
This forest is marked by very wet conditions all year around. The shorter the inundation time the more it resembles the rainforest. Varies in physiognomy from open scrub to a low closed forest. Palm and epiphytes are rare. This forest doesn’t have big trees and is poor in species. Low swamp forest which varies from open woodland to single storied 10 to 15 meter high forest can be found in permanently inundated terrain.
Mangrove forest. One storey and closed forest. The undergrowth is restricted to ferns. Two types are distinguished along the coast Avicennia nitida. Along major rivers Rizophora mangle and patches of Laguncularia
Marsh Forest This forest are characterized by insufficient drainage, causing seasonal fluctuation in moisture conditions from very dry to very wet
Ridge Forest This forest is a two storeys forest up to 30 m and the species composition is comparable with the rain forest with mainly Palms in the undergrowth.
1.2.3 Original data National class Area (1000 hectares)
1998 High Dry land Forest (Rain Forest) 13 333 High Savannah Forest or dry evergreen forest
132
Low Savannah forest 18
High Swamp forest. 485
Low Swamp Forest 240
Mangrove forest. 115
Marsh Forest 470
Ridge Forest 35
Total Forest 14 828
Total country area 16 384
1.3 Analysis and processing of national data
1.3.1 Calibration
Calculating the calibration factor
Total area according to FAOSTAT (1000 ha) 16 327 Calibration factor (=16327/16384) 0.9965

FRA 2010 – Country Report, Suriname
9
Calibrated national data National class Area(1000 ha)
1998 High Dry land Forest (Rain Forest) 13 286.614
High Savannah Forest or dry evergreen forest
13.154
Low Savannah forest 17.937
High Swamp forest. 483.313
Low Swamp Forest 239.165
Mangrove forest. 114.600
Marsh Forest 463.65
Ridge Forest 34.878
Total forest area 14 776.413
1.3.2 Estimation and forecasting It is most likely that planned deforestation activities may take place in the near future for the establishment of agriculture plantation (estimated 120 000 ha), with an expected deforestation of 1500 ha before 2010, and because of mining activities. Very probably a bauxite mining concession in the West of Surinam will be issued with an expected estimated deforestation of 1500 ha before 2010. Other planned deforestation is the building of a hydro power (hydro lake), road building,. Furthermore there is real threat that both, legal and illegal (gold) mining activities will continue to take place in the remote area in the hinterland, which may also affect the total forest area. If the planned regional (Amazon) and other national road building project is executed increase of economic activities in the forest area may also take place. Main drivers of deforestation up to now are in particular: establishment of a hydropower lake, illegal and legal (gold) mining, agriculture, including slash and burn method, road building and establishment of oil palm plantation Because of the increased economic activities in the coastal area the mangrove forest area may also be decreased. In total an estimated deforestation rate of 9000 ha/year, due to legal and illegal deforestation activities may be expected before 2010.
1.3.3 Reclassification into FRA 2010 categories FRA categories National class
Forest Other wooded
land
Other land with tree
cover
Other land
High Dry land Forest (Rain Forest) 100% NA NA NA High Savannah Forest or dry evergreen forest 100% NA NA NA
Low Savannah forest 100% NA NA NA
High Swamp forest. 100% NA NA NA
Low Swamp forest 100% NA NA NA
Mangrove forest. 100% NA NA NA
Marsh Forest 100% NA NA NA Ridge Forest 100% NA NA NA

FRA 2010 – Country Report, Suriname
10
1.4 Data for Table T1
Area (1000 hectares) FRA 2010 categories
1990 2000 2005 2010 Forest 14 776 14 776 14 776 14 758 Other wooded land 0 0 0 0 Other land 824 824 824 842 ...of which with tree cover 0 0 0 0
Inland water bodies 727 727 727
727 TOTAL 16 327 16 327 16 327 16 327
1.5 Comments to Table T1
Variable / category Comments related to data, definitions, etc.
Comments on the reported trend
Forest The last data are collected in 1998 when the indicative forest classification map has been produced. Landsat images from 1998 were used. For the validation some field checks has been conducted.
Other wooded land No data available
Other land Mainly urban and suburban areas
Other land with tree cover
No data available
Inland water bodies
Also including a 150000 ha water reservoir created for hydropower.
Other general comments to the table
Expected year for completion of ongoing/planned national forest inventory and/or RS survey / mapping
Field inventory NA (*)
Remote sensing survey / mapping NA (*)

FRA 2010 – Country Report, Suriname
11
Currently, there is no national forest inventory in process; national forest inventory is obliged to assess land-use, new forest produce and services. According to the Forest Management Act for rational forest use the government must establish a forest inventory program destined for production forest. Suriname is developing a REDD readiness plan within the FCPF program of the WorldBank. During this process, actions will be undertaken as well to conduct baseline studies and to do at least some reference scenarios. In this framework forest inventory data on a national scale will be collected and a remote sensing survey will be carried out.

FRA 2010 – Country Report, Suriname
12
2 Table T2 – Forest ownership and management rights
2.1 FRA 2010 Categories and definitions
Category Definition Public ownership Forest owned by the State; or administrative units of the public
administration; or by institutions or corporations owned by the public administration.
Private ownership Forest owned by individuals, families, communities, private co-operatives, corporations and other business entities, private religious and educational institutions, pension or investment funds, NGOs, nature conservation associations and other private institutions.
Individuals (sub-category of Private ownership)
Forest owned by individuals and families.
Private business entities and institutions (sub-category of Private ownership)
Forest owned by private corporations, co-operatives, companies and other business entities, as well as private non-profit organizations such as NGOs, nature conservation associations, and private religious and educational institutions, etc.
Local communities (sub-category of Private ownership)
Forest owned by a group of individuals belonging to the same community residing within or in the vicinity of a forest area. The community members are co-owners that share exclusive rights and duties, and benefits contribute to the community development.
Indigenous / tribal communities (sub-category of Private ownership)
Forest owned by communities of indigenous or tribal people.
Other types of ownership Other kind of ownership arrangements not covered by the categories above. Also includes areas where ownership is unclear or disputed.
Categories related to the holder of management rights of public forest resources Public Administration
The Public Administration (or institutions or corporations owned by the Public Administration) retains management rights and responsibilities within the limits specified by the legislation.
Individuals/households Forest management rights and responsibilities are transferred from the Public Administration to individuals or households through long-term leases or management agreements.
Private institutions
Forest management rights and responsibilities are transferred from the Public Administration to corporations, other business entities, private co-operatives, private non-profit institutions and associations, etc., through long-term leases or management agreements.
Communities
Forest management rights and responsibilities are transferred from the Public Administration to local communities (including indigenous and tribal communities) through long-term leases or management agreements.
Other form of management rights
Forests for which the transfer of management rights does not belong to any of the categories mentioned above.

FRA 2010 – Country Report, Suriname
13
2.2 National data
2.2.1 Data sources
References to sources of information
Quality (H/M/L)
Variable(s) Year(s) Additional comments
Forest management Act H State forest 1992 Diagnosis of Land management issues in Suriname
H Land titles 2002 Buursink International Consultants in Environmental Management
Agricultural census M Land area, type of land
tenure
1981
1985
Minister of Agriculture, Fishery and Husbandry
Forest use rights map H Forest use rights
2008 Produced by the Foundation for Forest management and Production Control and publicly purchasable.
2.2.2 Classification and definitions National class Definition
State land All land not burdened by any real right of use Allodial property This is the oldest title issued by the Dutch. All descendants of the first own the land.
Allodial title was issued subject to various conditions, the most important of which was that the land must be cultivated. Most of the these titles included a provision in which the government reserves d the right to reclaim the land with a simple procedure
Private land This is the most complete title to land available in Suriname. However, private property was not issued since the Agrarian Ordinance was promulgated in 1973. There are no limitations imposed by the state. The owner has full and unlimited enjoyment of land within the context of the law. Due to fears that the land would abandoned, and therefore be unproductive, private land was always issued sparingly
Lease hold A real right. These titles are valid for a renewable period of 75 years, are mortgage able and freely transferable, and are issued subject to payment of a annual fee. Under a new decree “L-Decree 1982” renewable of these title is not possible. According to this decree , lease hold right has to be converted into a long lease rights
Long Land lease
Land lease is the only title issued by the Sate/ Land lease is issued for land use purposes for a limited duration (15-40 years) and is subjected to various conditions. These include annual fee and the usage of the land according to the purposes for which it was issued. These are mortgage able, transferable and renewable. The state reserves the right to reclaim the land the land by a simple procedures if the land is not being used as designated on the title
Other land (simple rent and simple use)
A personal right issued by the State in order to give land use rights to applicants prior to obtaining the title of the least (during the time the destined use of the land is not yet determined or realized). The title is personal, short term and not transferable
National classification related to forest management rights: National class Definition Communal forest Forest areas which are situated around communal land and which are designated as
communal forest for the benefit of the forest dwelling tribal communities living in villages and settlements, and which serve the purpose of providing for their own need for food and wood production, as well as possible commercial timber use, gathering of forest by-product and development for agricultural purposes;
Concession A concession confers upon the holder the exclusive right to harvest and transport wood within the boundaries and in accordance with the provisions stipulated in the terms and conditions of the concession, and with regard to the implementation in

FRA 2010 – Country Report, Suriname
14
accordance with an exploitation plan which takes into account the management plan for the area within which the concession is situated determined and, if necessary, revised by the Minister. This right is a real right.
Incidental cutting license
Confers upon the holders the right to fell the trees on state land, in an area to be indicated in the licence and for a period to be established therein, and for a fixed number of trees or volume of wood of one or more specified species. Similar licences may be granted on lands let in hereditary tenure or long lease for trees for which the felling rights were excluded when such right was granted.
Nature reserves Forest which are formally protected based on the Nature Conservation Act MUMA’s Multiple Use Management Areas (mostly mangrove forest area in the coastal area of
the country) LBB-terrains Terrains issued to the forest service (LBB) for different reasons (conservation,
plantation, research) State Land All land not burdened by any real right of use
2.2.3 Original data
Estimated forest area of Suriname by type of tenure as of 1985 is as follows
National classification Area in ha (x 1000) 1985
State land 14 555 Private ownership 50 Allodial property 37 Lease hold 47 Land lease 27 Others 60
There is a great possibility that in the past decade the total area of the land tenure: Private ownership, Allodial property, Lease hold, Land lease and others is increased but no data are available at this moment. Forests on private land do not cover more than a total area of 50 000 ha. The Constitution does not provide for tribal rights of land use. However, the indigenous and maroon people claim these rights. The Government recognizes the urgency of this matter, what has been indicated in the National Forest Policy 2003 and the Interim Strategic Action Plan 2009 for the Forest Sector. Among others a Presidential Committee has been established which contributes also in accelerating the process of structural and constructive consultation with the interior people on this matter
2.3 Analysis and processing of national data
2.3.1 Reclassification into FRA 2010 categories
FRA Classification National classification Area in ha (x 1000) Private ownership Private ownership
Allodial property
50 0.5% 37
Public ownership State land Lease hold Land lease Others
14 555 99.5% 47 27 60
Other ownership

FRA 2010 – Country Report, Suriname
15
Reclassification of forest management rights:
FRA Classification National classification Public administration - LBB-reserves
- Nature reserves - Stateland - MUMA’s
Individuals Incidental cutting licenses and concessions issued to natural persons Private corporations and institutions Incidental cutting licenses and concessions issued to legal persons Communities Communal forest Other A holder of a land lease or lease hold rights can, if there is no
overlapping with actual forest management rights, dispose of the wood within the boundaries of their terrain.
2.4 Data for Table T2 Table 2a - Forest ownership
Forest area (1000 hectares) FRA 2010 Categories
1990 2000 2005 Public ownership 14 689 14 689 14 689 Private ownership 87 87 87 ...of which owned by individuals NA NA NA ...of which owned by private business entities and institutions NA NA NA ...of which owned by local communities 0 0 0 ...of which owned by indigenous / tribal communities 0 0 0
Other types of ownership 0 0 0
TOTAL 14 776 14 776 14 776 Note: If other types of ownership are reported, please specify details in comment to the table..
Yes Does ownership of trees coincide with ownership of the land on which they are situated? V No If No above, please describe below how the two differ:
- A concession confers upon the holder ONLY the exclusive right to harvest and transport wood
- Owners of a private land have the right on everything on that land except the minerals
Table 2b - Holder of management rights of public forests
Forest area (1000 hectares) FRA 2010 Categories
1990 2000 2005 Public Administration 13 302.4 11 510.4 12 557.6 Individuals 10.0 526.0 278.5 Private corporations and institutions 750.0 2089.0 1 225.8 Communities 492.6 429.6 493.1 Other 134.0 134.0 134.0
TOTAL 14 689 14 689 14 689 The total communal forest is approximately 550 000 ha at the beginning of 2009.

FRA 2010 – Country Report, Suriname
16
2.5 Comments to Table T2
Variable / category
Comments related to data, definitions, etc.
Comments on the reported trend
Public ownership In accordance with the constitution of the Republic of Suriname (1987) all forests, except for those on privately owned land, belong to the state. The government grants land use rights such as timber harvesting rights, mining rights, land lease
Private ownership
The last agriculture census has been conducted in 1982. At this moment an agriculture census is pending and it is envisaged that in the end of this year the census will be finalized. It is expected that updated data will be available
Other types of ownership
Data are outdated and scattered. The last agriculture census has been conducted in 1982.
Management rights
The managements right are clearly indicated in the granted land use rights, including in the timber harvesting rights
Other general comments to the table It is expected that better data will be available to fill in this table when the agriculture census will be finalized and the Land registration and Land Information System (GLIS) is implemented and the relevant forest management institutions are adequately strengthened.

FRA 2010 – Country Report, Suriname
17
3 Table T3 – Forest designation and management
3.1 FRA 2010 Categories and definitions Term Definition
Primary designated function The primary function or management objective assigned to a management unit either by legal prescription, documented decision of the landowner/manager, or evidence provided by documented studies of forest management practices and customary use.
Protected areas Areas especially dedicated to the protection and maintenance of biological diversity, and of natural and associated cultural resources, and managed through legal or other effective means.
Categories of primary designated functions
Production Forest area designated primarily for production of wood, fibre, bio-energy and/or non-wood forest products.
Protection of soil and water Forest area designated primarily for protection of soil and water. Conservation of biodiversity
Forest area designated primarily for conservation of biological diversity. Includes but is not limited to areas designated for biodiversity conservation within the protected areas.
Social services Forest area designated primarily for social services. Multiple use Forest area designated primarily for more than one purpose and where none of
these alone is considered as the predominant designated function. Other Forest areas designated primarily for a function other than production,
protection, conservation, social services or multiple use. No / unknown No or unknown designation.
Special designation and management categories
Area of permanent forest estate (PFE)
Forest area that is designated to be retained as forest and may not be converted to other land use.
Forest area within protected areas
Forest area within formally established protected areas independently of the purpose for which the protected areas were established.
Forest area under sustain-able forest management
To be defined and documented by the country.
Forest area with management plan
Forest area that has a long-term (ten years or more) documented management plan, aiming at defined management goals, which is periodically revised.
3.2 National data
3.2.1 Data sources
References to sources of information
Quality (H/M/L)
Variable(s) Year(s) Additional comments
Forest Management Act H Designation of forest land
1992 Forest classification
Indicative Forest Classification Map
H Forest classification
2001 The Classification of the forest must be done through a bylaw. The law is in preparation.
SBB Data base”LogPro” H Data 1999- Since 1999 a log tracking system

FRA 2010 – Country Report, Suriname
18
Forest use rights Map including issued concessions and other timber harvesting rights
2009
“Log Pro” has been developed with the assistance of FAO. With this system it is possible to know, were, when a tree has been felled, the logs have been transported and when it was exported etc. The forest use rights map is frequently updated (as long as it is necessary) and available for everyone.
National Forest Policy H Designation of forest land
2003 The forest policy has been formulated in a participatory process with all relevant stakeholders
3.2.2 Classification and definitions
National class Definition
Permanent Forest
- Production forest
- Protection
forest
- Special protected forest
Forest to be preserved permanently in the interest of the sustainable harvesting of wood and/or sustainable gathering of forest by-products and/or for any lasting ecological, protective or recreational function. Permanent forest includes (i) production forest, (ii) protected forest, and (iii) special protected forest; Permanent forest which is primarily intended for the sustainable, commercial harvesting of wood and/or the sustainable gathering of forest by-products Permanent forest which, because of its location, has an important stabilizing influence on the natural environment, in particular the soil and the soil hydrology. Proposals for the designation of 90.000 ha of protection forest are being prepared. Permanent forest which, on account of its location, the composition of its fauna and/or flora, or its aesthetic value, has a particular scientific, educational, cultural or recreational function.
Conversion forest Forest in regions where the land will be used for purposes other than forestry
Forest to be temporarily maintained
Forest to be maintained pending its definitive designation as permanent forest or conversion forest
Communal forest Forest areas which are situated around communal land and which are designated as communal forest for the benefit of the forest dwelling tribal communities living in villages and settlements, and which serve the purpose of providing for their own need for food and wood production, as well as possible commercial timber use, gathering of forest by-products and development for agricultural purposes
3.2.3 Original data
The Forest Management Act distinguishes three main categories: Permanent forest, Conversion forest and Preliminary Permanent forest. These categories are subdivided and in fact two categories can be added notably Nature conservation forest areas and Community forest. So in practice the following categories are distinguished:

FRA 2010 – Country Report, Suriname
19
According to the Forest Management Act 1992 Permanent Forest (to be preserved permanently) - Production forest - Protection forest - Special protected forest Conversion Forest (forest land designated for non- forest use) Preliminary maintained forest (designation to one of the other four categories not yet decided) Community forest (forest designated to tribal communities in the interior also for commercial timber production purposes) Nature conservation areas: these are designated by State Decree by virtue of the Nature Conservation Act 1954. 2.1 million ha Nature conservation reserves are designated, including the 1.6 million ha Central Suriname Nature Reserve. In the coastal zone, so called Multiple Use Management Areas have been designated by virtue of the Decree Issuance Domanial land (decreet uitgifte domeingrond). In these multiple use areas the forests, mainly mangrove and swamp forests are being protected.
National class Area (1000 ha) Permanent Forest - Production forest 4500* - Protection forest - Special protected forest Conversion forest Preliminary maintained forest
7997
National conservation areas (land portion only
2 192
* This includes also the currently 550 000 ha of Community forests
3.3 Analysis and processing of national data
3.3.1 Estimation and forecasting The total sum of the areas for the national designation classes is equal to the total forested area under public ownership (14 689 million hectares) as no data are available about the designation of private land. In the FRA 2010 categories it will be classified under “No or unknown function”. For the FRA 2010 class “Forest area under sustainable management” the total forested area has been used, subtracting the area granted as an “incidental cutting license”. With this license the license holder doesn’t have to manage the forest in a sustainable way. This explains the relatively low value in 2000, where a lot of these licenses have been granted. For 2010 the area of exploitation mining license has been subtracted. It can be assumed that the area designated as production area will grow southwards, but not more south then the 4th longitude.
3.3.2 Reclassification into FRA 2010 categories
National class FRA categories Total area (x 1000 ha) (2008) Permanent forest Production forest - production forest Production forest 3 950 - protected forest Protection for soil and water -special protected forest Conservation of biodiversity Conversion forest No or unknown function Preliminary maintained forest No or unknown function 7997 Communal forest Multiple use 550 (*) Conservation area Conservation of biodiversity 2192
(*) d.d. Dec-08

FRA 2010 – Country Report, Suriname
20
3.4 Data for Table T3 Table 3a – Primary designated function
Forest area (1000 hectares) FRA 2010 Categories
1990 2000 2005 2010 Production 2 500 4 010 4 010 3 932 Protection of soil and water 0 0 0 0 Conservation of biodiversity 1887 1 887 2 192 2 192 Social services 0 0 0 0 Multiple use (also for production) 430 490 490 550 Other (please specify in comments below the table) 0 0 0 0 No / unknown 9 959 8 389 8 084 8 084
TOTAL 14 776 14 776 14 776 14 758
Table 3b – Special designation and management categories
Forest area (1000 hectares) FRA 2010 Categories
1990 2000 2005 2010 Area of permanent forest estate NA 6 387 6 202 6 689 Forest area within protected areas NA 1 887 2 015 2 015 Forest area under sustainable forest management 14 776 14 024 14 762 14 461 Forest area with management plan NA 3 809 3 406 NA
3.5 Comments to Table T3
Variable / category
Comments related to data, definitions, etc. Comments on the reported trend
Production In the National Forest Policy the 4.5 million ha east-west running forest belt is defined as the production area, with a net production area of 2.5 million ha. The remaining part, 10.3 million ha will be preserved. The rationale for this limited area is mainly based on economic factors such as, accessibility and transport costs
Protection of soil and water
A proposal has been made for the designation of about 120 000 ha as protection forest, but it hasn’t been approved yet
It’s not very probable that it will be approved before 2010
Conservation of biodiversity
Sum of the nature reserves and the land portion of the Multiple Use Management Area’s.
The MUMA’s have been issued in 2005, what explains the increase.
Social services Community forest may be classified in this category. As the forest are entitled to use the forest for timber, agriculture, collection of NTFP and also use for eco tourism purposes

FRA 2010 – Country Report, Suriname
21
Multiple use Communal forest has been classified in this category. In a way the 550 000 ha Communal forests could be considered as being formally designated, including the communal wood cutting licenses – Houtkapvergunningen (HKV)-which were issued based on he Timber Act 1947
The amount of community forest is increasing
Other
No / unknown designation
The area south of the 4th longitude doesn’t have a designation yet. This area has been conserved until now, and there is a great possibility that part of it will be designated for other land use for the development of the country.
Area of permanent forest estate
According to the Forest Management Act 1992: Permanent Forests According Nature Conservation Act 1954: Permanent forests, Nature conservation forest areas and the communal forests.
Forest area within protected areas
All nature reserves can be assumed to be completely covered with forest. The MUMA’s are estimated to be for 50% covered with mangrove forest.
Forest area under sustainable forest management
All areas issued as nature reserve, concession, MUMA’s, stateland and communal forests are assumed to be under sustainable forest management. The exploitation mining licenses (ca. 200 000 ha) and the planned area for oilpalm cultivation (120 000 ha), has been subtracted because they are not considered as under sustainable forest management
Forest area with management plan
This is the sum of the concessions mostly larger than 5,000 ha and in particular where the production is designated for the export and where the harvesting activities are assumed to be of considerable impact on the environment and in the national economy. These concessions are obliged to make comprehensive management plans based on a forest inventory, for a 10-year term or longer, which must be approved by the SBB, while the others have to make simplified management plans. Also the protected areas with a management plan are added to this category (2,073,000 ha).
It is expected to stay more or less constant or increasing, like big concession areas which are not managed according the law will be revoked and granted to companies or individuals who have the capacity to manage the concession according to a management plan.
Other general comments to the table

FRA 2010 – Country Report, Suriname
22
4 Table T4 – Forest characteristics
4.1 FRA 2010 Categories and definitions
Term / category Definition Naturally regenerated forest Forest predominantly composed of trees established through natural
regeneration. Introduced species A species, subspecies or lower taxon, occurring outside its natural range
(past or present) and dispersal potential (i.e. outside the range it occupies naturally or could occupy without direct or indirect introduction or care by humans).
Characteristics categories Primary forest Naturally regenerated forest of native species, where there are no clearly
visible indications of human activities and the ecological processes are not significantly disturbed.
Other naturally regenerated forest Naturally regenerated forest where there are clearly visible indications of human activities.
Other naturally regenerated forest of introduced species (sub-category)
Other naturally regenerated forest where the trees are predominantly of introduced species.
Planted forest Forest predominantly composed of trees established through planting and/or deliberate seeding.
Planted forest of introduced species (sub-category)
Planted forest, where the planted/seeded trees are predominantly of introduced species.
Special categories Rubber plantations Forest area with rubber tree plantations.
Mangroves Area of forest and other wooded land with mangrove vegetation.
Bamboo Area of forest and other wooded land with predominant bamboo
vegetation.
4.2 National data
4.2.1 Data sources
References to sources of information
Quality (H/M/L)
Variable(s) Year(s) Additional comments
National Forest Policy H Policy 2003 National Forest Policy
Preliminary vegetation classification map
M Vegetation class 1998
Control and monitoring activities of the SBB
H Timber harvesting activities, harvested areas
2000-2008
Almost all of the timber harvesting activities are recorded and processed in the SBB database
4.2.2 Original data Around 13000 ha of plantations have been established in the period 1954-1977, with both pine and broadleaf species. The area of other naturally regenerated forests has been estimated from production data (see below). The remainder of the natural forests are considered primary as the human impact is very low.

FRA 2010 – Country Report, Suriname
23
4.3 Analysis and processing of national data
4.3.1 Estimation and forecasting Planted forest: The last 30 years there have not been deforestation, neither expansion of the plantations. Probably on two of the biggest plantations land lease rights will be granted, for agricultural purposes. In expectation of this land use change, timber harvesting rights have been granted, which don’t exclude clear cutting. Other naturally regenerated forest: This calculation is based on the yearly production data, (between 150 000-200 000 m3/year) with an average productivity of 10 m3/ha, supposing that 50% of the timber harvesting is done in already logged areas. (mainly community forests and easy accessible concessions) A reduction of mangrove forest area in 2010 is expected. A loss of about 3000 ha per year between 2005 and 2010 has been used as an expert estimate.
4.4 Data for Table T4
Table 4a
Forest area (1000 hectares) FRA 2010 Categories
1990 2000 2005 2010 Primary forest 14 208 14 137 14 093 14 001 Other naturally regenerated forest 555 626 670 744 ...of which of introduced species 0 0 0 0 Planted forest 13 13 13 13 ...of which of introduced species 7 7 7 7 TOTAL 14 776 14 776 14 776 14 758
Table 4b
Area (1000 hectares) FRA 2010 Categories
1990 2000 2005 2010 Rubber plantations (Forest) 0 0 0 0 Mangroves (Forest and OWL) 115 115 115 100 Bamboo (Forest and OWL) 0 0 0 0
4.5 Comments to Table T4
Variable / category
Comments related to data, definitions, etc.
Comments on the reported trend
Primary forest Up to now the primary forest area is relatively stable and the deforestation rate very low. In the future there is expected a downward trend due to the development of oil palm plantations (est. 120 000 ha) and a mining concessions (est.30 000 ha) and a hydropower lake (est.150 000 ha) in the West of Surinam. Before 2010 the planned and unplanned deforestation rate is expected to be about 9000 ha/year.

FRA 2010 – Country Report, Suriname
24
Other naturally regenerating forest
Planted forest Around 13000 ha of plantations have been established in the period 1954-1977, with both pine and broadleaf species.
Rubber plantations
NA
Mangroves Mangroves appear mostly along the Coastal area and in the northern part of the river banks. Because of human and natural activities the mangrove forest area has been probably and will be probably decreased
To have an updated trend it is obvious that a monitoring must be in place as soon as possible The Mangrove forest functions are amongst others, as a natural dam against the sea water, breeding place for fishes and shrimps and birds As Suriname is a flat and low land the impact of the rising of the sea level will be devastating for Suriname. (very high risk country)
Bamboo Not available
Other general comments to the table Other more focused assessments have estimated recent deforestation in Suriname at:
4200 to 5380 ha per year (Becker et al 1999) 4800 to 9600 ha per year (small-scale gold mining alone, based on 1998 field work; Peterson and
Heemskerk 2001)
FRA 2010 – Country Report, Suriname
25
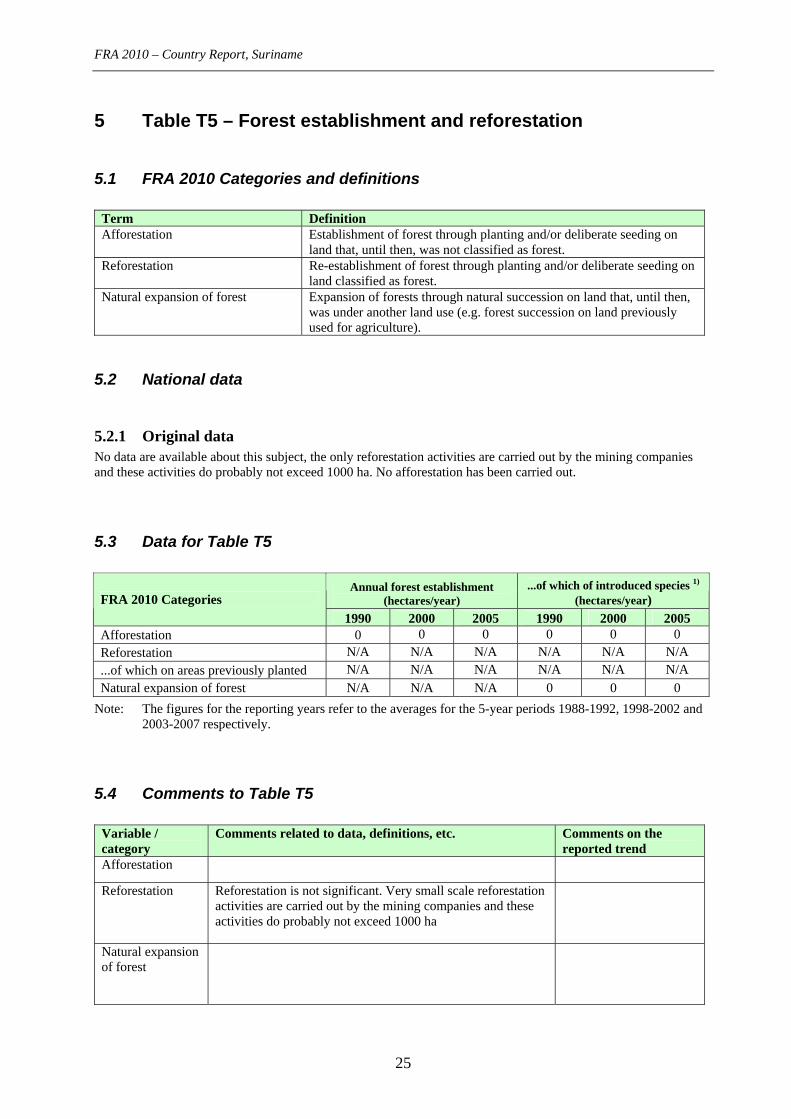
5 Table T5 – Forest establishment and reforestation
5.1 FRA 2010 Categories and definitions
Term Definition Afforestation Establishment of forest through planting and/or deliberate seeding on
land that, until then, was not classified as forest. Reforestation Re-establishment of forest through planting and/or deliberate seeding on
land classified as forest. Natural expansion of forest Expansion of forests through natural succession on land that, until then,
was under another land use (e.g. forest succession on land previously used for agriculture).
5.2 National data
5.2.1 Original data No data are available about this subject, the only reforestation activities are carried out by the mining companies and these activities do probably not exceed 1000 ha. No afforestation has been carried out.
5.3 Data for Table T5
Annual forest establishment (hectares/year)
...of which of introduced species 1) (hectares/year) FRA 2010 Categories
1990 2000 2005 1990 2000 2005 Afforestation 0 0 0 0 0 0 Reforestation N/A N/A N/A N/A N/A N/A ...of which on areas previously planted N/A N/A N/A N/A N/A N/A Natural expansion of forest N/A N/A N/A 0 0 0
Note: The figures for the reporting years refer to the averages for the 5-year periods 1988-1992, 1998-2002 and 2003-2007 respectively.
5.4 Comments to Table T5
Variable / category
Comments related to data, definitions, etc. Comments on the reported trend
Afforestation
Reforestation Reforestation is not significant. Very small scale reforestation activities are carried out by the mining companies and these activities do probably not exceed 1000 ha
Natural expansion of forest

FRA 2010 – Country Report, Suriname
26
Other general comments to the table Suriname is considered as a high forested and low deforested country (HFDL). Because of the tremendous passive and active efforts of Suriname in the past and nowadays, the forest could be, with all the national sacrifices, maintained and protected. To maintain these objective, international recognitions, including adequate financial, institutional strengthening is needed and more than fair. Especially in the framework of the contribution of Suriname’s forest to the international community regarding Climate Change Mitigation Because of low deforestation rate in Suriname the area reforested /afforested is negligible. Only the international mining companies, which try to follow the national policy and in the same time the international accepted guidelines, might implement rehabilitation projects on the formerly mined pits and their surroundings. Yearly the reforestation rate will never exceed 1,000 ha, but there are no official data available.

FRA 2010 – Country Report, Suriname
27
6 Table T6 – Growing stock
6.1 FRA 2010 Categories and definitions
Category Definition Growing stock Volume over bark of all living trees more than X cm in diameter at
breast height (or above buttress if these are higher). Includes the stem from ground level or stump height up to a top diameter of Y cm, and may also include branches to a minimum diameter of W cm.
Growing stock of commercial species Growing stock (see def. above) of commercial species.
6.2 National data
6.2.1 Data sources
References to sources of information
Quality (H/M/L)
Variable(s) Year(s)
Additional comments
Surinam Forest Inventory H Growing stock, Forest types….
1973 A forest inventory carried out in three representative northern regions of Surinam by the FAO
LBB yearly statistics High Timber, production, Export, Import
1999-2007
It is estimated that about 20% of the timber production is not registered
6.2.2 Original data
Growing stock estimates (1973) Fallawatra Nassau Kabalebo Weighted average
Area (1000 hectares) 141 70 123 Growing stock
Commercial (m3/ha) 60 52 43 52.1 Potential (m3/ha) 84 76 73 78.3 Possible (m3/ha) 35 38 32 34.5 Other (m3/ha) 57 80 65 64.8
Total (m3/ha) 236 246 213 229.6 List of species names (scientific and common names) of the ten most common species is presented below. There is no information about the standing stock by species. FRA Categories / Species name Gronfolo Ruizterania albiflora (Old name: Qualea albiflora) Basra locus Dicorynia guinansis Kopi Goupia glabra Wanakwari Vochysia tomentosa Gele kabbes Vatairea guianensis Wana Ocotea rubra Bruinhart Voucapoua Americana Felikwari Erisma uncinatum Sumaruba Simarouba amara Ingipipa Couratari guianensis

FRA 2010 – Country Report, Suriname
28
6.3 Analysis and processing of national data
6.3.1 Estimation and forecasting The weighted average growing stock of 230 m3 per hectare was multiplied with the total forest area according to table T1.
6.4 Data for Table T6
Table 6a – Growing stock
Volume (million cubic meters over bark) Forest Other wooded land FRA 2010 category
1990 2000 2005 2010 1990 2000 2005 2010 Total growing stock 3 393 3 393 3 393 3 389 n.a. n.a. n.a. n.a. ... of which coniferous 0 0 0 0 n.a. n.a. n.a. n.a. ... of which broadleaved 3 393 3 393 3 393 3 389 n.a. n.a. n.a. n.a. Growing stock of commercial species
n.a. n.a. n.a. n.a. n.a. n.a. n.a. n.a.
Table 6b – Growing stock of the 10 most common species
FRA 2010 category / Species name Growing stock in forest (million cubic meters)
Rank Scientific name Common name 1990 2000 2005 1st 2nd
3rd
4th
5th
6th 7th 8th 9th 10th Remaining TOTAL
Note: Rank refers to the order of importance in terms of growing stock, i.e. 1st is the species with the highest growing stock. Year 2000 is the reference year for defining the species list and the order of the species.

FRA 2010 – Country Report, Suriname
29
Table 6c – Specification of threshold values Item Value Complementary information Minimum diameter (cm) at breast height1 of trees included in growing stock (X)
15 cm: growing stock of all species
25 cm: Growing stock of commercial species
Minimum diameter (cm) at the top end of stem for calculation of growing stock (Y)
10 cm
Minimum diameter (cm) of branches included in growing stock (W)
NA
Volume refers to “above ground” (AG) or “above stump” (AS)
Above stump
6.5 Comments to Table T6
Variable / category
Comments related to data, definitions, etc.
Comments on the reported trend
Total growing stock
Growing stock of broadleaved / coniferous
The coniferous growing stock is negligible.
Growing stock of commercial species
Growing stock composition
Not enough data available
Other general comments to the table
1 Diameter at breast height (DBH) refers to diameter over bark measured at a height of 1.30 m above ground level or 30 cm above buttresses if these are higher than 1 m.
FRA 2010 – Country Report, Suriname
30
7 Table T7 – Biomass stock
7.1 FRA 2010 Categories and definitions
Category Definition Above-ground biomass All living biomass above the soil including stem, stump, branches, bark, seeds,
and foliage. Below-ground biomass All biomass of live roots. Fine roots of less than 2mm diameter are excluded
because these often cannot be distinguished empirically from soil organic matter or litter.
Dead wood All non-living woody biomass not contained in the litter, either standing, lying on the ground, or in the soil. Dead wood includes wood lying on the surface, dead roots, and stumps larger than or equal to 10 cm in diameter or any other diameter used by the country.
7.2 National data
7.2.1 Data sources
References to sources of information
Quality (H/M/L)
Variable(s) Year(s) Additional comments
Greenhouse Gas Emission inventory for Suriname
M Biomass stock
1999
Poels (1987) Soil water and nutrients in a forest ecosystem in Surinam
M 1987
K. Tjon (1998): Monitoring Tropical Rainforest in Suriname; Internal Memorandum NARENA/CELOS
M
Biomass among the different forest types
1998 Restricted study area
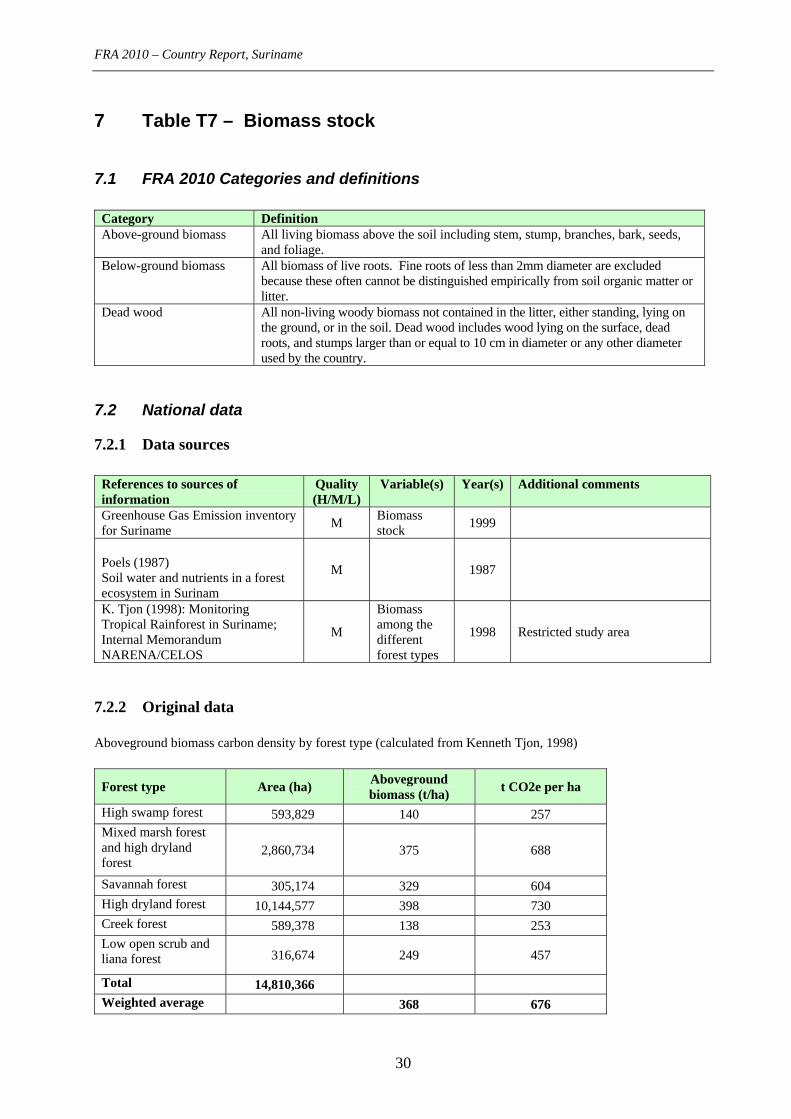
7.2.2 Original data Aboveground biomass carbon density by forest type (calculated from Kenneth Tjon, 1998)
Forest type Area (ha) Aboveground biomass (t/ha)
t CO2e per ha
High swamp forest 593,829 140 257 Mixed marsh forest and high dryland forest
2,860,734 375 688
Savannah forest 305,174 329 604 High dryland forest 10,144,577 398 730 Creek forest 589,378 138 253 Low open scrub and liana forest 316,674 249 457
Total 14,810,366 Weighted average 368 676

FRA 2010 – Country Report, Suriname
31
7.3 Analysis and processing of national data Above-ground biomass: The calculation of the above-ground biomass is based on Tjon (1998) as described before. The weighted average of 368 t/ha has been multiplied by the total forest area as of Table 1. Below-ground biomass: The ratio below-ground to above ground biomass as stated by the IPCC of 0.24 was used. Suriname is classified as a tropical moist deciduous forest with an above-ground biomass > 125 t/ha.
7.4 Data for Table T7 Biomass (million metric tonnes oven-dry weight) Forest Other wooded land FRA 2010 category
1990 2000 2005 2010 1990 2000 2005 2010 Above-ground biomass 5 438 5 438 5 438 5 430 n.a. n.a. n.a. n.a. Below-ground biomass 1 303 1 303 1 303 1 303 n.a. n.a. n.a. n.a. Dead wood n.a. n.a. n.a. n.a. n.a. n.a. n.a. n.a. TOTAL n.a. n.a. n.a. n.a. n.a. n.a. n.a. n.a.
7.5 Comments to Table T7
Variable / category
Comments related to data, definitions, etc.
Comments on the reported trend
Above-ground biomass
The national data on biomass (from Tjon, 1998) gives slightly higher estimates of biomass than using the IPCC default factors.
Below-ground biomass
Dead wood
Other general comments to the table The research which has been done concerning biomass stock is very restricted. The information displayed here is probably accurate for the specific research areas, but can’t be seen as representative for the whole country. Therefore it’s highly necessary to carry out much more research about this topic.

FRA 2010 – Country Report, Suriname
32
8 Table T8 – Carbon stock
8.1 FRA 2010 Categories and definitions
Category Definition Carbon in above-ground biomass Carbon in all living biomass above the soil, including stem, stump,
branches, bark, seeds, and foliage. Carbon in below-ground biomass Carbon in all biomass of live roots. Fine roots of less than 2 mm diameter
are excluded, because these often cannot be distinguished empirically from soil organic matter or litter.
Carbon in dead wood Carbon in all non-living woody biomass not contained in the litter, either standing, lying on the ground, or in the soil. Dead wood includes wood lying on the surface, dead roots, and stumps larger than or equal to 10 cm in diameter or any other diameter used by the country.
Carbon in litter Carbon in all non-living biomass with a diameter less than the minimum diameter for dead wood (e.g. 10 cm), lying dead in various states of decomposition above the mineral or organic soil.
Soil carbon Organic carbon in mineral and organic soils (including peat) to a specified depth chosen by the country and applied consistently through the time series.
8.2 National data
8.2.1 Data sources
References to sources of information
Quality (H/M/L)
Variable(s) Year(s) Additional comments
Greenhouse Gas Emission inventory for Surinam
M Biomass stock
1999
Poels (1987) Soil water and nutrients in a forest ecosystem in Surinam
M 1987
K. Tjon (1998): Monitoring Tropical Rainforest in Suriname; Internal Memorandum NARENA/CELOS
M
Biomass among the different forest types
1998 Restricted study area
8.2.2 Original data
Biomass data from Table 7 was used as input for estimating carbon in biomass. Forest area data from Table 1 was used for estimating carbon in litter and soil.

FRA 2010 – Country Report, Suriname
33
8.3 Analysis and processing of national data No national data are available about the carbon fraction, so the carbon fraction of 0.47 recommended by IPCC has been used. Data on carbon in dead wood are not available as no national research neither default values are available. To calculate the carbon in litter and the soil carbon, the default values are used: - Carbon in litter: The default value for a tropical climate with a broadleaf deciduous forest has been used. (2.1
tonnes C ha-1) - Soil Carbon: The default value for a tropical moist climate with LAC-soils has been used (47 tonnes C ha-1)
8.4 Data for Table T8
Carbon (Million metric tonnes) Forest Other wooded land
FRA 2010 Category
1990 2000 2005 2010 1990 2000 2005 2010 Carbon in above-ground biomass 2 555.9 2 555.9 2 555.9 2 552.9
NA NA NA NA
Carbon in below-ground biomass 612.4 612.4 612.4 612.4
NA NA NA NA
Sub-total: Living biomass 3 168.3 3 168.3 3 168.3 3 164.5
NA NA NA NA
Carbon in dead wood
n.a. n.a. n.a. n.a. NA NA NA NA
Carbon in litter 31.0 31.0 31.0 30.9 NA NA NA NA
Sub-total: Dead wood and litter
n.a. n.a. n.a. n.a. NA NA NA NA
Soil carbon 694.4 694.4 694.4 693.6 NA NA NA NA
TOTAL n.a. n.a. n.a. n.a. NA NA NA NA
Soil depth (cm) used for soil carbon estimates 30
FRA 2010 – Country Report, Suriname
34
8.5 Comments to Table T8
Variable / category
Comments related to data, definitions, etc.
Comments on the reported trend
Carbon in above-ground biomass
Carbon in below-ground biomass
Carbon in dead wood
Carbon in litter
Soil carbon
Other general comments to the table The research which has been done concerning biomass stock is very restricted. The information displayed here is probably accurate for the specific research area, but can’t be seen as representative for the whole country. Therefore it’s highly necessary to carry out much more research about this topic!

FRA 2010 – Country Report, Suriname
35
9 Table T9 – Forest fires
9.1 FRA 2010 Categories and definitions
Category Definition Number of fires Average number of vegetation fires per year in the country. Area affected by fire Average area affected by vegetation fires per year in the country. Vegetation fire (supplementary term)
Any vegetation fire regardless of ignition source, damage or benefit.
Wildfire Any unplanned and/or uncontrolled vegetation fire. Planned fire A vegetation fire regardless of ignition source that burns according to
management objectives and requires limited or no suppression action.
9.2 National data
9.2.1 Data sources
References to sources of information
Quality (H/M/L)
Variable(s) Year(s) Additional comments
Forest sector environmental assessment plan
M Forest resource use and environmental assessment
2003
9.2.2 Original data Planned fires are mostly done by the forest-based communities for agriculture mostly slash and burn agriculture (shifting cultivation). The total area under continuous shifting agriculture is estimated at 246,700 ha, of which annually some 16,400 ha is re-cleared via slash and burn practices. Effectively, the current cultivation cycle prevents fallow vegetation from developing for more than 15 years. Shifting cultivation is generally situated along the major access roads, rivers and streams in the inhabited parts of the interior.
9.3 Data for Table T9
Table 9a
Annual average for 5-year period 1990 2000 2005 FRA 2010 category
1000 hectares
number of fires
1000 hectares
number of fires
1000 hectares
number of fires
Total land area affected by fire N/A N/A N/A N/A N/A N/A ... of which on forest N/A N/A N/A N/A N/A N/A ... of which on other wooded land N/A N/A N/A N/A N/A N/A ... of which on other land 16.4 N/A 16.4 N/A 16.4 N/A

FRA 2010 – Country Report, Suriname
36
Table 9b
Proportion of forest area affected by fire (%) FRA 2010 category
1990 2000 2005 Wildfire N/A N/A N/A Planned fire N/A N/A N/A
Note: The figures for the reporting years refer to the averages of annually affected areas for the 5-year periods 1988-1992, 1998-2002 and 2003-2007 respectively
9.4 Comments to Table T9
Variable / category
Comments related to data, definitions, etc.
Comments on the reported trend
Area affected by fire
Number of fires
Wildfire / planned fire
Other general comments to the table Ecosystem maps (Teunissen, 1978) show that only 25% of Suriname’s swampland is still covered by climax swamp forest, which means that at least 75% of the potential swamp forest area has once or more often been destroyed by fire in the past (now covered with swamp wood and herbaceous swamp vegetations). The high swamp forests in the coastal region of Suriname are unique in the world (see WWF Neotropical Ecoregions: Guianan Freshwater Swamp Forest (NTO149).

FRA 2010 – Country Report, Suriname
37
10 Table T10 – Other disturbances affecting forest health and vitality
There is no information available about this subject, but the main part of the Surinamese forest is primary forest, where everything is more or less ecologically balanced.

FRA 2010 – Country Report, Suriname
38
11 Table T11 – Wood removals and value of removals
11.1 FRA 2010 Categories and definitions
Category Definition Industrial roundwood removals
The wood removed (volume of roundwood over bark) for production of goods and services other than energy production (woodfuel).
Woodfuel removals
The wood removed for energy production purposes, regardless whether for industrial, commercial or domestic use.
11.2 National data
11.2.1 Data sources
References to sources of information
Quality (H/M/L)
Variable(s) Year(s) Additional comments
SBB yearly forestry statistics Information of 1990 is gathered by LBB
H
Timber production, import and export
2000
It is estimated that about 10-20% of (commercial) production is not registered.
SBB yearly forestry statistics Information of 2000 and 2008 is gathered by SBB
H
Timber production, import and export
2005 It is estimated that about 10-20% of (commercial) production is not registered.
11.2.2 Classification and definitions
National class Definition
Industrial roundwood Sawlogs & Veneer logs and other industrial round wood
Woodfuel Wood fuel including wood for charcoal
Sawlogs & Veneer logs Roundwood that will be sawn lengthways for the manufacture of sawnwood or railway sleepers or used for the production of veneer mainly by peeling or slicing
Other industrial roundwood
Industrial roundwood other than saw logs and veneer logs. It includes roundwood that will be used for hewn square poles, fence posts, poles and pilling
Wood fuel Round wood that will be used as fuel for the purposes such as cooking, heating, cremation. It includes wood harvested from main stems, branches and other parts of trees and wood that will be used for charcoal
Wood charcoal Wood carbonised by partial combustion or the application of heat from external sources
11.2.3 Original data Data are collected by the SBB in the field from the cutting registers, waybills, and export bills and in the processing units and publicise in the yearly forestry statistics.

FRA 2010 – Country Report, Suriname
39
Wood removal 1998 - 1992
Year Industrial round wood removals Total volume(1000m3)
Wood fuel removals Total volume(1000m3)
1988 202.7 2.1
1989 127.1 0.6
1990 115.9 0.4 1991 106.5 0.5 1992 121.8 0.4
Wood removals 1998 - 2002
Year Industrial round wood removal Total volume (100m3)
Wood fuel removal Total volume(1000m3)
1998 145.0 0.09 1999 93.9 0.01 2000 176.5 0.06 2001 162.3 0.3 2002 153.8 0.3
Wood removals 2003 - 2007
Year Industrial round wood removals Total volume (1000m3
Wood fuel removals Total volume (1000m3)
2003 155.4 2.4 2004 159.4 0.6 2005 180.9 1.7 2006 193.1 0.2 2007 166.4 0.2
11.3 Data for Table T11
Industrial roundwood removals Woodfuel removals FRA 2010 Category
1990 2000 2005 1990 2000 2005 Total volume (1000 m3 o.b.) 115.9 176.5 180.9 0.4 0.06 1.7 ... of which from forest 115.9 176.5 180.9 0.4 0.06 1.7 Unit value (local currency / m3 o.b.) 1 200 75 000 250 300 15 000 40 Total value (1000 local currency) 139 080 13 237 500 45 225 120 900 68
Note: The figures for the reporting years refer to the averages of annually affected areas for the 5-year periods
1988-1992, 1998-2002 and 2003-2007 respectively. The industrial round wood removal in 2007 is 166 000 m3 and in 2008 is 181 000 m3. The wood fuel production in 2007 is 180 m3 and in 2008 450 m3 It is estimated that the round wood production will not increase significantly (not more than 250,000 m3/yr) up to 2010 unless salvage logging will take place, amongst others to establish oil palm plantation, Although the sustainable production potential of the production forest (4.5 million ha) is estimated at 1-1.5 million ha /year, the production stagnated for decades at 150,000- 200,000 m3/year. The government and the private sector have produced analyses how to increase the timber production to 300,000-500,000 m3/year but the activities, proposed in these analyses, need to be implemented.

FRA 2010 – Country Report, Suriname
40
1990 2000 2005
Name of local currency
Surinamese Guilder 1 US$=SG 20
SG= Surinamese
Guilder US $ = United States Dollar
Surinamese Guilder 1 US$= SG. 995
Surinamese 1 US$ = 2.8 SRD
SRD = Surinamese
Dollar
11.4 Comments to Table T11
Variable / category
Comments related to data, definitions, etc.
Comments on the reported trend
Total volume of industrial roundwood removals
All above are recorded round wood removals. It is estimated that about 10-20% of the round wood removals are not recorded. Furthermore round wood that have been removed for subsistence use, for amongst others house and boat building and for firewood, by in particular forest based communities (approximately 10% of the total population) are not recorded. Unit value is the average of the local market price of the relevant year
Although the potential sustainable production potential of the production forest (about 4-5 million ha) is 1- 1,5 million m3 per annum the production in the past decade stagnated on about 150,000-200,000 m3 per annum
Total volume of woodfuel removals
The real wood fuel production is higher than the recorded production. The forest based communities produce also wood fuel for their own uses which is not recorded. The real production is estimated 500% higher than the recorded production.
Unit value
Total value
Other general comments to the table

FRA 2010 – Country Report, Suriname
41
12 Table T12 – Non-wood forest products removals and value of removals
12.1 FRA 2010 Categories and definitions
Term Definition Non-wood forest product (NWFP)
Goods derived from forests that are tangible and physical objects of biological origin other than wood.
Value of NWFP removals For the purpose of this table, value is defined as the market value at the site of collection or forest border.
NWFP categories
Category Plant products / raw material 1. Food 2. Fodder 3. Raw material for medicine and aromatic products 4. Raw material for colorants and dyes 5. Raw material for utensils, handicrafts & construction 6. Ornamental plants 7. Exudates 8. Other plant products Animal products / raw material 9. Living animals 10. Hides, skins and trophies 11. Wild honey and bee-wax 12. Wild meat 13. Raw material for medicine 14. Raw material for colorants 15. Other edible animal products 16. Other non-edible animal products
12.2 National data
12.2.1 Data sources
References to sources of information Quality
(H/M/L) Variable(s) Year(s) Additional
comments An inventory of commercial the Non Timber Forest Products in the Guyana shield
H Commercial NTFP extraction
2002
Personal comments of Mr. Teunissen H NTFP 2002 Data collection and Analysis related to NTFP Caroline Rahan Chin for the FAO
M NTFP 2002
Forest Service (LBB) export statistics H Wildlife export (Cites and non
cites)
2008
Statistics Ministry of Trade and H Export value of 2008

FRA 2010 – Country Report, Suriname
42
Industry NTFP
The medicinal trade in Suriname Van Andel et al
H Medicinal Plans 2007
Rapid Assessment of Existing Financial Mechanisms for Sustainable Forest Management in Suriname Suriname Case Study for the Country Led Initiative
H Financial mechanism
2008
12.2.2 Classification and definitions
National class Definition
Forest by-products Any and all produce of vegetable origin, which may be harvested without permanent damage to tree, plant or forest.
Discussions are going on to change the definition of NTFP in Suriname There is very little published information available about current NTFP commercialisation in Suriname (Peneux, 1999), with the exception of animal exports. Except for wildlife, Suriname does not appear in export statistics of NTFPs (Broekhoven, 1996). Quite a number of publications, however, have stressed the importance of NTFPs for local (subsistence) use in the country (Stahel, 1944; Ostendorf, 1962; May, 1982, Heyde, 1990, Raghoenandan, 1994, van ‘t Klooster, 2000). Moreover, scientists currently working in Suriname state that there exists a lively national market in forest products. From the scattered published information and personal comments of experts working in Surinam, it can be deduced that the following products are Surinam's main commercial NTFPs: wildlife (bushmeat & live animals for trade, parrots and macaus), podosiri (Euterpe oleracea) , and other palm fruits maripa (Maximiliana maripa) and awara (Astrocaryum vulgare) kumbu (Oenocarpus bacaba),., medicinal plants, crafts and brazil nuts. It should be noted that the definition of NTFPs used by the Suriname Forest Management Law of 1992, only includes plant products and not animal products (De Dijn, pers.comm.). Wildlife collection and trade are covered by various laws. Most of the value of Suriname's trade is made up of CITES listed birds (Psittacines and some Toucans), while reptiles and amphibians are exported in the highest numbers. For the majority of CITES listed species, realized exports are much lower than the allowed quota. This is mainly due to decreasing demand and new international restrictions (Ouboter, 2001). The main commercial animal groups in Suriname are: psittacines, reptiles, primates, amphibians, songbirds and bushmeat species.
The existing and possible physical and financial contribution of NTFPs to the national economy has yet to be determined. The feasibility and amount of trade, the number of traders etc. is difficult to map. Virtually all of the NTFP trade in Suriname occurs in an informal market, and is thus essentially invisible in the statistics, except for wildlife. Some figures are shown based on documentation on wildlife and medicinal plants. Wildlife
Suriname is one of the few countries in South America legally exporting considerable quantities of wildlife, generating a significant income. The Nature Conservation Division of the Ministry of ROGB collects data on trade in wild animals species, according to national legislation and CITES trade rules.

FRA 2010 – Country Report, Suriname
43
This department issues permits for trade in wild animals and collection of plants. These regulations are necessary to prevent that certain wild animal species will become endangered due to the export. The Suriname Forest Service together with the Nature Conservation Commission has established export quota for both CITES-listed and non-CITES animals. However, the actual export is much lower than the export quota. Revenues of wildlife export have reduced from around US$ 1 million per year (before 2005) to US$ 404,000 in 2007, as shown in 12.2.3 (Original data).
The decline in wildlife trade revenues was caused by the outbreak of Avian Influenza and the resulting EU measures to ban imports of wild birds. Birds form the bulk of the trade in terms of value; a reduction of the export of these birds has resulted in a decline of revenues. Still, there is a foreign market for Surinamese birds. At the moment Nature Conservation Division is looking into ways to remove obstacles for continuation of sustainable wildlife export. However, revenues could decline even further in the near future due to international changing attitudes towards wild animals held in captivity, new regulations and captive breeding in importing countries.
Medicinal plants
The herbal medicine market still has an informal character. Surinamese people involved in this business are self-employed, unrecognized in official statistics, have little access to capital and earn money from labor-intensive enterprises. A lack of official figures on these activities does not imply a limited contribution to the country’s economy. The trade in herbal medicines offers employment to several hundreds of households. The annual value of the domestic and the export market is estimated to be worth over US$ 1.5 million. This figure is higher than the registered wildlife export revenues. However, the export (trade) of medicinal plants and/or medicinal plant extractions is becoming more difficult because of the existing and increased trade barriers. This hampers the further development of trade in medicinal plants. In addition the production of fake medicines (chemically copied) causes improper competition.
The mean price per kg plant product is US$ 8.30 (source: Van Andel et al, 2007). Prices in Suriname are determined by resource scarcity, distance to harvesting sites, processing costs, and local demand. Well-sorted market stands report average daily sales of US$ 30. An inventory of all Paramaribo markets together showed a sale of almost 136,000 kg plant material in 2006, with a total estimated value of US$ 1.1 million. Medicinal plants commonly used are among others: andoya (Campomanesia aromatica), kwasibita (Quassia amara), sibiwiwiri (Scoparia dulcis), krapa (Carapa guianensis), sangrafu (Costus scaber), kowru ati (Begonia glabra), karu (Zea mays), noni (Morinda citrifolia). Suriname exports substantial volumes of fresh, dried, and frozen medicinal plants to the Netherlands, where they seem to play a key role in the health care of Surinamese immigrants. In 2006 the export of medicinal plants to the Netherlands was estimated to be 55,000 kg, with an estimated value of US$ 453,180 (based on US$ 8.30 per kg) (Van Andel et al, 2007). In table in paragraph 12.2.3 (Original data) the export values of some important NTFPs are shown for the last two years. A growing export of some NTFPs is already recognizable.

FRA 2010 – Country Report, Suriname
44
12.2.3 Original data CITES export data on Wildlife Exports for Suriname (Value in US$) 1997- 2000
1997 1998 1999 2000
Birds 884,129.00 727,377.00 676,843.00 591,440.00 Mammals 290,778.00 151,387.00 133,300.00 86,575.00 Reptiles/Amphibians 134,439.00 122,044.00 77,513.00 126,848.00 Total 1,309,346.00 1,000,808.00 887,656.00 804,863.00
Source: Van Andel et al, 2002 Non-CITES export data on Wildlife Exports for Suriname (Value in US$)
1997 1998 1999 2000
Birds 68,406.50 49,678.00 36,874.00 98,953.50 Reptiles/Amphibians 24,077.00 11,636 17,772.00 133,591.00 Mammals 900.00 822.00 0 2,160.00 Total 93,383.50 62,136.00 54,646.00 234,704.50
CITES and non- CITES export data on wild life exports for Suriname
2004 2005 2006
Birds 684.727 550.373 323.748
Reptiles/Amphibians 124.498 130.894 149.548
Mammals 147.410 53.610 42
Total 956.635
734.877
473.338
Source: Nature Conservation Division
Export values in US$ of some important NTFPs in Suriname
Product 2006 2007 2008
Jan-Jun
Bulbs, rootstocks 16,605 123,011 120,806
Plants 39,548 132,369 82,944
Flowers as Heliconia’s, orchids 65,789 18,037 10,903
Foliage, leafs, twines, branches and other parts of plants without flowers or blossoms
17,731 35,679 26,348
Total 139,673 309,096 241,001
Source: Ministry of Trade and Industry 2008

FRA 2010 – Country Report, Suriname
45
12.3 Data for Table T12
NWFP removals 2005
Rank Name of product Key species
Unit Quantity
Value (1000 local
currency)
NWFP categor
y
1st Birds 196,561.8 9 2nd Reptiles/Amphibians 46,747.86 9 3rd Mammals 19,146.43 9 4th Bulbs, rootstocks* 4930 3 5th Plants* 14,129 3 6th Flowers as Heliconia’s, orchids* 23,496 6
7th Foliage, leafs, twines, branches and other parts of plants without flowers or blossoms*
6,332 3
8th 9th 10th All other plant products All other animal products TOTAL
*Only exported value estimated of 2006 1. The annual value of the domestic and the export market is estimated to be worth over US$ 1.5 million. 2. An inventory of all Paramaribo markets together showed a sale of almost 136,000 kg plant material in
2006, with a total estimated value of US$ 1.1 million. 3. In 2006 the export of medicinal plants to the Netherlands was estimated to be 55,000 kg, with an estimated
value of US$ 453,180 (based on US$ 8.30 per kg) (Van Andel et al, 2007). 2005 Name of local currency Surinamese Dollars (SRD), 1 US$=2.80 SRD
12.4 Comments to Table T12
Variable / category
Comments related to data, definitions, etc.
10 most important products
Medicinal plants commonly used are among others: andoya (Campomanesia aromatica), kwasibita (Quassia amara), sibiwiwiri (Scoparia dulcis), krapa (Carapa guianensis), sangrafu (Costus scaber), kowru ati (Begonia glabra), karu (Zea mays), noni (Morinda citrifolia). podosiri (Euterpe oleracea) , palm fruits maripa (Maximiliana maripa), awara (Astrocaryum vulgare) kumbu (Oenocarpus bacaba),brazil nuts.
Other plant products
Resin, fibre, barks, seeds, leaves, extracts etc.
Other animal products
Most exported Birds, Reptiles/Amphibians, Mammals Amazona amazonica,Ara ararauna,Cyanerpes cyaneus (birds), Saimiri sciureus, Saguinus midas (mammals), Phyllomedusa spp, Hyla spp (amphibians),Iguana iguana, Corallus hortulanus (reptiles)
Value by product Estimated values indicated by the forest services (Cites and non cites wildlife) and the Ministry of Trade and Industry (Plants) based on the national and international markets
Total value Total estimated average value of the products
Other general comments to the table Animals (game) and plants (in particular medicinal) for subsistence use and traded informally, particular by the forest- based community are not included, it is estimated that the figures, amount indicated may be significantly higher.
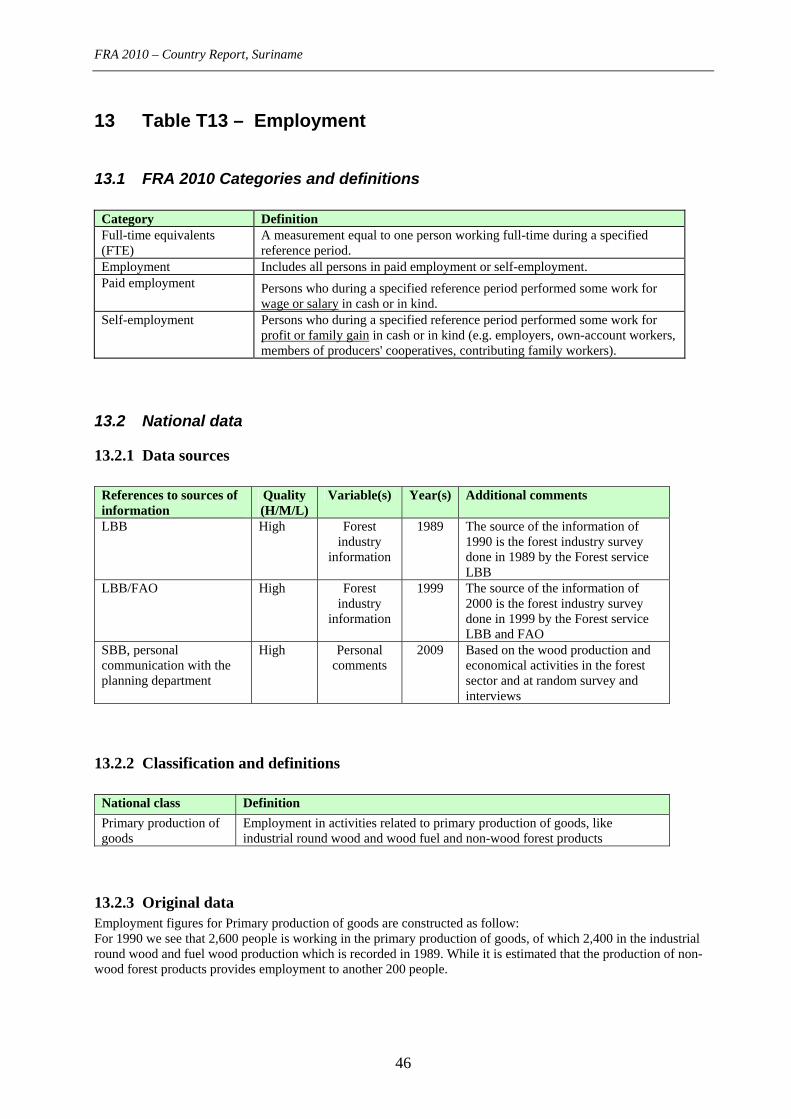
FRA 2010 – Country Report, Suriname
46
13 Table T13 – Employment
13.1 FRA 2010 Categories and definitions
Category Definition Full-time equivalents (FTE)
A measurement equal to one person working full-time during a specified reference period.
Employment Includes all persons in paid employment or self-employment. Paid employment Persons who during a specified reference period performed some work for
wage or salary in cash or in kind. Self-employment Persons who during a specified reference period performed some work for
profit or family gain in cash or in kind (e.g. employers, own-account workers, members of producers' cooperatives, contributing family workers).
13.2 National data
13.2.1 Data sources
References to sources of information
Quality (H/M/L)
Variable(s) Year(s) Additional comments
LBB High Forest industry
information
1989 The source of the information of 1990 is the forest industry survey done in 1989 by the Forest service LBB
LBB/FAO High Forest industry
information
1999 The source of the information of 2000 is the forest industry survey done in 1999 by the Forest service LBB and FAO
SBB, personal communication with the planning department
High Personal comments
2009 Based on the wood production and economical activities in the forest sector and at random survey and interviews
13.2.2 Classification and definitions
National class Definition
Primary production of goods
Employment in activities related to primary production of goods, like industrial round wood and wood fuel and non-wood forest products
13.2.3 Original data Employment figures for Primary production of goods are constructed as follow: For 1990 we see that 2,600 people is working in the primary production of goods, of which 2,400 in the industrial round wood and fuel wood production which is recorded in 1989. While it is estimated that the production of non-wood forest products provides employment to another 200 people.

FRA 2010 – Country Report, Suriname
47
For 2000 we see that 3,000 people is working in the primary production of good, of which 2,800 in the industrial round wood and fuel wood production which is recorded in 1999. While it is estimated that the production of non-wood forest products gives employment to another 200 people. The figures of provision of services and unspecified forestry activities are estimations. It is assumed that the amount of people that is employed in the forestry sector is not significantly changes from 2000 up to date, taking into account the stagnated timber production annually in the past years.
13.3 Analysis and processing of national data
13.3.1 Estimation and forecasting As it is in the government policy the increase the sustainable timber production and to increased the contribution of the forest sector in the national economy it is expected that if this policy are implemented the amount of employment in the forest sector will increased. In addition it is likely that some agriculture plantation will be established resulting in salvage logging may increased the employment in the forest sector as well increased of the timber production in specific period.
13.4 Data for Table T13
Employment (1000 years FTE) FRA 2010 Category
1990 2000 2005 Employment in primary production of goods 2.4 2.8 4.75
...of which paid employment 2 2.4 4
...of which self-employment 0.4 0.4 0.5
Employment in management of protected areas 0.6 0.4 0.25 Employment in the forest sector contributes about 3 – 4% to the total workforce. The increased of employment in 2005 is due to increased chain saw lumbering in the forest, and the recovering of the forest sector, economy and the stable socio political and monetary situation. During the period 1986- 1993 a interior war took place where most of the infrastructure and logging equipment were destroyed.
13.5 Comments to Table T13
Variable / category
Comments related to data, definitions, etc.
Comments on the reported trend
Employment in primary production of goods
Paid employment / self-employment
Employment in management of protected areas
Other general comments to the table

FRA 2010 – Country Report, Suriname
48
14 Table T14 – Policy and legal framework
14.1 FRA 2010 Categories and definitions
Term Definition Forest policy A set of orientations and principles of actions adopted by public authorities in
harmony with national socio-economic and environmental policies in a given country to guide future decisions in relation to the management, use and conservation of forest and tree resources for the benefit of society.
Forest policy statement
A document that describes the objectives, priorities and means for implementation of the forest policy.
National forest programme (nfp)
A generic expression that refers to a wide range of approaches towards forest policy formulation, planning and implementation at national and sub-national levels. The national forest programme provides a framework and guidance for country-driven forest sector development with participation of all stakeholders and in consistence with policies of other sectors and international policies.
Law (Act or Code) on forest
A set of rules enacted by the legislative authority of a country regulating the access, management, conservation and use of forest resources.
14.2 Data for Table T14
Indicate the existence of the following (2008)
x Yes Forest policy statement with national scope
No
Year of endorsement 2003 If Yes above, provide:
Reference to document National Forest Policy
x Yes National forest programme (nfp)
No
Name of nfp in country Strategic Action Plan for the Forest Sector Starting year 2006
x In formulation
In implementation
Under revision Current status
Process temporarily suspended
If Yes above, provide:
Reference to document or web site
Interim Strategic Action Plan 2009-2012
x Yes, specific forest law exists
Yes, but rules on forests are incorpo-rated in other (broader) legislation Law (Act or Code) on forest with national scope
No, forest issues are not regulated by national legislation
Year of enactment 1947 Timber Act, Replaced by the Forest Management Act 1992, Nature Conservation Act 1954, Game Act 1957
Year of latest amendment In 1998 – 2000 about 14 by-laws of the Forest Management Act were enacted .
If Yes above, provide:
Reference to document Forest Management Act, Nature Conservation Act, Game Act

FRA 2010 – Country Report, Suriname
49
In case the responsibility for forest policy- and/or forest law-making is decentralized, please indicate the existence of the following and explain in the comments below the table how the responsibility for forest policy- and law-making is organized in your country.
Yes Sub-national forest policy statements
X No
If Yes above, indicate the number of regions/states/provinces with forest policy statements
Yes Sub-national Laws (Acts or Codes) on forest
X No
If Yes above, indicate the number of regions/states/provinces with Laws on forests
14.3 Comments to Table T14
Variable / category Comments related to data, definitions, etc. Forest policy statement with national scope
The Multi Annual Plan 2006-2011, which indicates the Overall Government Development Plan including for the Forest sector.
National forest programme (nfp)
The National Forest Policy which was\formulated in a participatory process in 2003. Currently the National Forest Policy is being elaborated into a Strategic Action Plan. It is envisaged the Strategic Action Plan will be endorse by the Minister of Physical Planning, Land- en Forest Management. The National Biodiversity Strategy 2005
Law (Act or Code) on forest with national scope
The Forest Management Act 1992, Game Act 1954, Nature Conservation Act 1954
Sub-national forest policy statements
As Suriname is a small country sub national forest policy statements are not familiar. In the other hand the Districts Commissioners have limited but important influences and responsibilities to develop and monitor the forest sector in their respective districts , amongst others their advice are important in the process of granting timber cutting rights and timber cutting activities ( in particular in community forests) in their respective districts.
Sub-national Laws (Acts or Codes) on forest.
The harvesting activities must be carried out according the Forest management Act and the concession conditions which is attached to the Timber cutting rights.
Other general comments to the table

FRA 2010 – Country Report, Suriname
50
15 Table T15 – Institutional framework
15.1 FRA 2010 Categories and definitions
Term Definition Minister responsible for forest policy-making
Minister holding the main responsibility for forest issues and the formulation of the forest policy.
Head of Forestry The Head of Forestry is the Government Officer responsible for implementing the mandate of the public administration related to forests.
Level of subordination Number of administrative levels between the Head of Forestry and the Minister. University degree Qualification provided by University after a minimum of 3 years of post
secondary education.
15.2 Data for Table T15 Table 15a – Institutions FRA 2010 Category 2008 Minister responsible for forest policy formulation : please provide full title
Ministry of Physical Planning land and Forest Management (Min ROGB)
1st Permanent Secretary of the Ministry
X 2nd Head of the Forest Division and Forest Service
3rd
Level of subordination of Head of Forestry within the Ministry
4th 5th
6th
Other public forest agencies at national level
Forest Service (LBB), Jan Starke Vocational Training Centre (JSOOC), The Foundation for Nature Conservation Suriname (Stinasu) (LBB/NB),Centre for Agriculture Research in Suriname (CELOS) as part of the University of Suriname
Institution(s) responsible for forest law enforcement
Stichting voor Bosbeheer en Bostoezicht (SBB) Foundation for Forest Management and Production Control for the enforcement of the Forest Management Act, and the Nature Conservation Division of the LBB for the enforcement of the Nature Conservation Act 1954 and the Game Act 1954.
Table 15b – Human resources
Human resources within public forest institutions 2000 2005 2008 FRA 2010 Category
Number %Female Number %Female Number %Female Total staff
350 20 350 20 350 20
...of which with university degree or equivalent
35 10 35 10 35 10
Notes: 1. Includes human resources within public forest institutions at sub-national level 2. Excludes people employed in State-owned enterprises, education and research, as well as temporary / seasonal
workers.
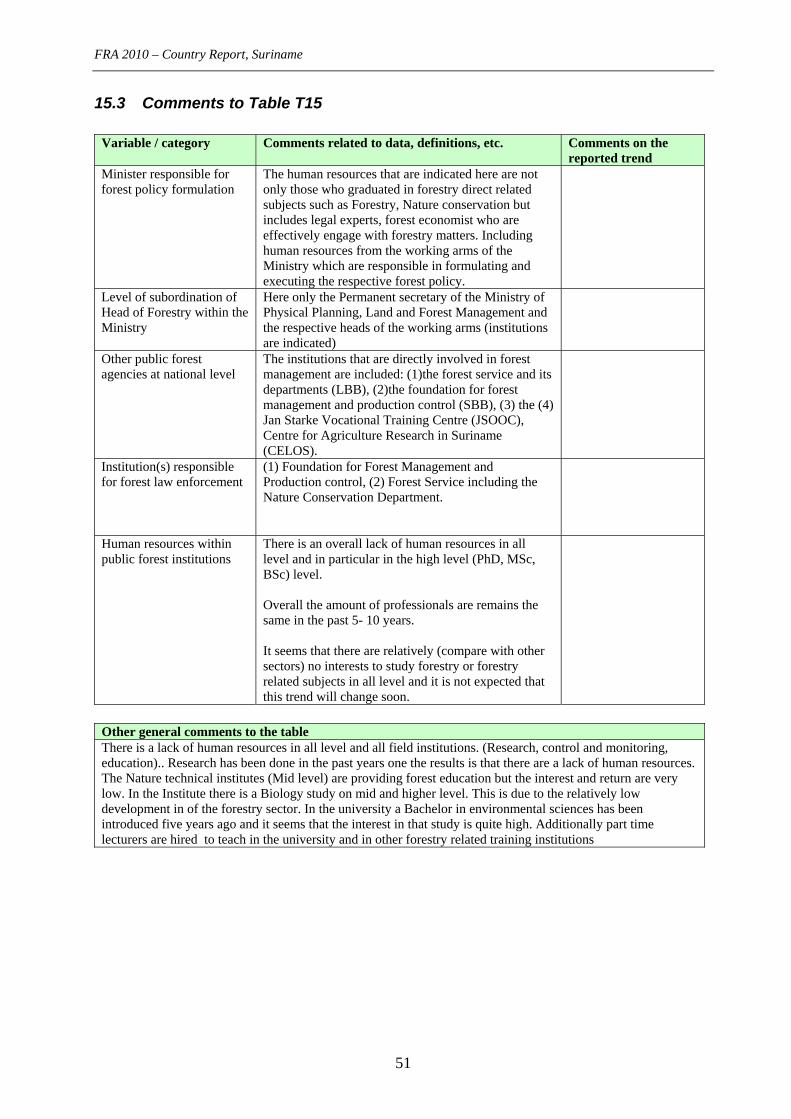
FRA 2010 – Country Report, Suriname
51
15.3 Comments to Table T15
Variable / category Comments related to data, definitions, etc. Comments on the reported trend
Minister responsible for forest policy formulation
The human resources that are indicated here are not only those who graduated in forestry direct related subjects such as Forestry, Nature conservation but includes legal experts, forest economist who are effectively engage with forestry matters. Including human resources from the working arms of the Ministry which are responsible in formulating and executing the respective forest policy.
Level of subordination of Head of Forestry within the Ministry
Here only the Permanent secretary of the Ministry of Physical Planning, Land and Forest Management and the respective heads of the working arms (institutions are indicated)
Other public forest agencies at national level
The institutions that are directly involved in forest management are included: (1)the forest service and its departments (LBB), (2)the foundation for forest management and production control (SBB), (3) the (4) Jan Starke Vocational Training Centre (JSOOC), Centre for Agriculture Research in Suriname (CELOS).
Institution(s) responsible for forest law enforcement
(1) Foundation for Forest Management and Production control, (2) Forest Service including the Nature Conservation Department.
Human resources within public forest institutions
There is an overall lack of human resources in all level and in particular in the high level (PhD, MSc, BSc) level. Overall the amount of professionals are remains the same in the past 5- 10 years. It seems that there are relatively (compare with other sectors) no interests to study forestry or forestry related subjects in all level and it is not expected that this trend will change soon.
Other general comments to the table There is a lack of human resources in all level and all field institutions. (Research, control and monitoring, education).. Research has been done in the past years one the results is that there are a lack of human resources. The Nature technical institutes (Mid level) are providing forest education but the interest and return are very low. In the Institute there is a Biology study on mid and higher level. This is due to the relatively low development in of the forestry sector. In the university a Bachelor in environmental sciences has been introduced five years ago and it seems that the interest in that study is quite high. Additionally part time lecturers are hired to teach in the university and in other forestry related training institutions

FRA 2010 – Country Report, Suriname
52
16 Table T16 – Education and research
16.1 FRA 2010 Categories and definitions
Term Definition Forest-related education Post-secondary education programme with focus on forests and related subjects. Doctor’s degree (PhD) University (or equivalent) education with a total duration of about 8 years. Master’s degree (MSc) or equivalent
University (or equivalent) education with a total duration of about five years.
Bachelor’s degree (BSc) or equivalent
University (or equivalent) education with a duration of about three years.
Technician certificate or diploma
Qualification issued from a technical education institution consisting of 1 to 3 years post secondary education.
Publicly funded forest research centers
Research centers primarily implementing research programmes on forest matters. Funding is mainly public or channelled through public institutions.
16.2 National data
16.2.1 Data sources
References to sources of information
Quality (H/M/L)
Variable(s) Year(s) Additional comments
Research report of the current status of professionals in the forest forest sector by Jack Menke
H Amount of professionals
2006
Includes Forest , Biology, Environmental Science Professionals in the private sector were not included.
Personnel interviews with LBB/NB, SBB, ATM, NIMOS
H Amount of professionals
2008 Professionals in the forest sector were not included
Interviews during the formulation of a capacity building plan as a part of the formulation of the Strategic Action Plan
M Amount of professionals
2008 Interview with all the stakeholders
16.3 Analysis and processing of national data
16.3.1 Estimation and forecasting
It is not expected that the amount of total professionals will be increased significantly. On the other hand as the policy of the government is to enhance the contribution of the forest sector in the national economy and the currently increasing role of (standing) forest in the framework of Carbon Emission, and the favourable price of timber in the world it should be expected that the amount of professionals will increase in particular in management and sustainable utilization of biodiversity. Therefore the enabling environment to promote and achieve SFM must be in place such as an improved legal framework, a strengthened institutional and human resources capacity etc.

FRA 2010 – Country Report, Suriname
53
16.4 Data for Table T16
Graduation 1) of students in forest-related education 2000 2005 2008 FRA 2010 Category
Number %Female Number %Female Number %Female Master’s degree (MSc) or equivalent 1 0 3 66 0 0 Bachelor’s degree (BSc) or equivalent 3 33 1 100 2 50 Forest technician certificate / diploma 18 0 0 0 40 10
Professionals working in publicly funded forest research centres 2) 2000 2005 2008 FRA 2010 Category
Number %Female Number %Female Number %Female Doctor’s degree (PhD) 1 0 1 0 1 0 Master’s degree (MSc) or equivalent 11 0 2 100 2 50 Bachelor’s degree (BSc) or equivalent n.a n.a 2 100 8 50
Notes:
1. Graduation refers to the number of students that have successfully completed a Bachelor’s or higher degree or achieved a certificate or diploma as forest technician.
2. Covers degrees in all sciences, not only forestry.
16.5 Comments to Table T16
Variable / category Comments related to data, definitions, etc.
Comments on the reported trend
Graduation of students in forest-related education
These figures include those graduated from the Nature Technical Institute (NATIN, Mid level forestry education) and forest guards/game wardens).
As there was a stagnation/set back of the forestry sector the interest in forest related education declined. In 2009 a Master in Natural Resource Management will be established. Probably the number of graduates in forest management will increase.
Professionals working in public forest research centres
These are only professionals working in the only forestry related research centre in Suriname, namely the Centre of Agricultural Research in Suriname (CELOS) which is part of the University of Suriname (AdeK). Often when necessary, professionals from the AdeK and the Herbarium and partners from other University/Research centres are involved/contracted in forest related researches
There is a lack of institutional, including human resources capacity in the forest related institution
Other general comments to the table

FRA 2010 – Country Report, Suriname
54
17 Table T17 – Public revenue collection and expenditure
17.1 FRA 2010 Categories and definitions
Category Definition Forest revenue All government revenue collected from the domestic production and trade of
forest products and services. For this purpose, forest products include: round wood; sawn wood; wood-based panels; pulp and paper; and non-wood forest products. As far as possible, this should include revenue collected by all levels of government (i.e. central, regional/provincial and municipal level), but it should exclude the income of publicly owned business entities.
Public expenditure All government expenditure on forest related activities (further defined below). Operational expenditure (sub-category to Public expenditure)
All government expenditure on public institutions solely engaged in the forest sector. Where the forest administration is part of a larger public agency (e.g. department or ministry), this should only include the forest sector component of the agency’s total expenditure. As far as possible, this should also include other institutions (e.g. in research, training and marketing) solely engaged in the forest sector, but it should exclude the expenditure of publicly owned business entities.
Transfer payments (sub-category to Public expenditure)
All government expenditure on direct financial incentives paid to non-government and private-sector institutions, enterprises communities or individuals operating in the forest sector to implement forest related activities.
Domestic funding
Public expenditure funded from domestic public financial resources, including: retained forest revenue; forest-related funds; and allocations from the national budget (i.e. from non-forest sector public revenue sources).
External funding
Public expenditure funded from grants and loans from donors, non-governmental organisations, international lending agencies and international organisations, where such funds are channelled through national public institutions.
17.2 National data
17.2.1 Data sources
References to sources of information
Quality (H/M/L)
Variable(s) Year(s) Additional comments
Yearly Financial report of SBB H Expenditure 2000-2007
Government budget for the Ministry responsible for forest Management
M Designated budget
2005-2007
Report from the Nature Conservation Division of the Forest Service
M Value of the export ed Wildlife
1997-2000, 2004-2007
Export figures of NTFP from the Ministry of trade
H value of exported NTFP
2006-2007

FRA 2010 – Country Report, Suriname
55
17.3 Data for Table T17 Table 17a - Forest revenues
Revenues (1000 local currency) FRA 2010 Categories
2000 2005
Forest revenue
232 348.8
Surinamese Guilder
3223.4
Surinamese Dollar
Exchange rate: 2000 = US$ 1 = SG 995 2005 = US $ 1 = SRD 2.80 The forest revenues comprise of (i) Retribution (ii) Area fee, (iii) grading fee, Export taxes and is from the timber cutting activities. Figures of revenues collected from nature conservation activities are not all included. Although the figures will not changes dramatically if they are included Revenues from Wild life and non timber forest products are not included. Table 17b - Public expenditure in forest sector by funding source
Domestic funding (US$)
External funding US$
Total US$ FRA 2010 Categories
2000 2005 2000 2005 2000 2005 Operational expenditure 1000 000 1 500 000 770 000 300 000 1 770 000 1 800 000 Transfer payments n.a n.a n.a n.a n.a n.a Total public expenditure n.a n.a n.a n.a n.a n.a
Reforestation
Afforestation
Forest inventory and/or planning
Conservation of forest biodiversity
Protection of soil and water
Forest stand improvement
Establishment or maintenance of protected areas
If transfer payments are made for forest management and conservation, indicate for what specific objective(s) - Please tick all that apply.
Other, specify below

FRA 2010 – Country Report, Suriname
56
17.4 Comments to Table T17
Variable / category Comments related to data, definitions, etc.
Comments on the reported trend
Forest revenue The data can be collected because of the existing monitoring system. Revenues from ecosystems services are not included.
The collection of forest revenue (retribution and concession fee) is improving as the monitoring activities is improved, amongst others due to the log tracking system Log Pro and strengthening of the monitoring, control activities in the field.
Operational expenditure The operational expenditure is somehow difficult asses. Estimation are made based only on the budget allocated to different ministries and in particular to particular institution/ department which is responsible for the management of the forest and protected amongst others the Foundation for Forest management and Production Control and the Nature Conservation Division of the Forest Service.
Transfer payments The Ministry of Physical Planning,
Other general comments to the table The expenditure indicated in table 17 b are figures of expenditures of the main institutions responsible for the management of the forest resources, including law enforcement, within the ministry of Physical Planning, Land – and Forest Management. The government allocates budgets for the respective Ministries to implement their activities. For example the Ministry of Physical Planning, Land and Forest Management are responsible for the Management of the Forest including the production forest and protected forest. The Ministry of Labour, Technology and Environment is amongst others responsible for the protection and sustainable utilization of Biodiversity. The Ministry of Education is responsible for education and research. Most of the case a overall budget is allocated to respective ministries and often not specified which part are effectively sub allocated in forestry related education and research In addition budgets are allocated to the training/educational and research institutes, which provided forest related training and research. It is therefore difficult assess the amounts Most of the forest revenues are retribution, concession fee, export fees and hunting fees The forest charges systems needs to be up dated to promote sustainable forest management, the development of the forestry sector and in the same time increase the revenue for the government from the commercial activities of the forest sector