Embed Size (px)
Citation preview

Surface macation of ligndnlosic fibers using high-freqmncy ultrasound
Jayant B. adh he', Ram B. ~ u ~ t a ' $ * and Thomas ~ l d d I Department of ChmMical Engineering, Auburn University, Auburn, A&, 36849-5127, USA: 'USDA Forest Sem'ce. 2500 Shpeveptt Highway, S o u t h Research Station, Pinevfile, LA. 71360-5500, USA; *Author for correspo&ce (e-mail: [email protected],- phone.. + 1-334-844-2013; fax: + 1-338-844-2063)
Received 57 Al[arch 2005; accepted in revised form 27 October 2005
Key WOP& High Frequency Ultrasound, Li& Surface modification, Thennomechanical pulp
E m t i c and chemical oxidation of fiber surface8 has been reprted in the literahue as a method for producing medium density fiberboasds without using synthetic adhesives. This work focuses on the surf8ce properties of wood fibers by the generation of fkee radicals using high-frequency ultrasod. A sonochemical reactor oPeratiag at 610 kHz is wed to soniate the aqueous suspensions of themnome- chanical pulp f i r s @IMP). TMP is analyzed using FTLR-tnumhion, FTiR-ATR spectroscopy and inverse gas drromatopphy (IGC). The non-conjugated carbony1 groups in TMP are represented by the pet& area ratio A1736fA1 J1 in the FTIR-trm&sion spectra and by Alns/AIm in the VIR-ATR spectra. The increase in these ratios suggests that there is an inmaw in the number of non-conjugated carbonyl groups ia TMP after mnication. To M e r investigate, soaication of the hydrolytic 1ig~i.n was also carried out and analyzed using UV, UV-ionhation and l ? T I R - ~ s i o n spectroscopy, The changes in the rmritace properties of the fibers are analyzed using IGC which showed an increase iv the surface free energy of fibers. The &kt of opemting jmameters snch as power of nltramund and sonicatiw time is also studied.
The conventional process for the manufactwe of wood composites ipvolves the addition of syn- thetic resins such as urea-fddehyde to the wood fibers, which is then hot-pressed to form fiberboards. Currently dorts rn underway to develop processRs to manufacture fiberboards without the addition of resins m h g to environ- mental concern (ie. r&ae of formaldehyde from the fiberbod W t m e h m resin degradation, etc.). An alternative is to me free radical treatment of the surfice of wood fibers by physical or chemical means, to enhance the fiber adhesion for
preshg (Qb et d. 2004). The trattnent of wood fibers with enzymes such as laccase or peroxidase produces lignia radicals on fiber d i c e , which results in increased boding strength in fiber- boards (Lrmd and Felby 2001, Felby et al. 2002). Free radicals cao also be generated by the treat- ment of wood particles with Fenton's reagent (Widsten et al. 2003) ( H f l J FeS04] and irradia- tion of wood particles with pradiation (Supe et a. 1993). In this work, the m0dikatio-n of Snrfaoe prop-
d e s of wood fibers with ultrasound is examined, When an aqueous suspension is treated with ultrasound, cavitation is induced in the liquid,

decomposing water into free radicals. (Petrier et al. 1994)
Seino et al. (2001) and Yoshioka et al. (2000) used electron spin resonance (BR) methods to trap and characterize unstable radials which were generated by the treatment of of solutions in DMSO with d-md isradhkiozx at 45 kHz trnd 100 W. They concluded that the a-O-4 or 8-0-4 linkages in lignh me homolytidly d e a d by the ultrasonic irradiation. Pranovich eP al. (1998) studied the w n o c h ~ m of monomeric &gain model compounds at 20 kHz fiquemy and re- ported the formation of various products as a re- sult of the hydroxyi m&al a&Wc on the amaWk ring. Tan et al. (1985) studied tbe behavior of lignin under the action of ultrasonic irraWun at 19 lrHz and at a very high pwex of 1200 W con- cluding that there is a formation of &nyl groups upon ultrasonic treatment.
Researchers have employed ultrasound in the extraction of lignin (Sun et al. 200% Sun and Tomkinson 2Wa) and hemice11uloses (Sun et al. 2002b; Sun and T o w o n 2002b; Ebringerova and Hromulkova 2002) from lignocellulosic feedstocks such as wheat straw, to achieve bigher extraction yields. The treatment of o f s i c fibers with ultrasound ha9 also been shrdied by several researchers. A h e w ( W i b n s l%2) de- scribes the use of ultrasound in pulp a d paper technology for varions processes like debar- defibmtion, b&kg, bp'egmtion 4 peneh- tion, pulping, bleaching, stock preparation and grafting. Laine et d. ($977) studied the inouence of ultrasonic hadktion at 23 kHz cm the physical and chemical properties of pulp fibers, reporting an increase in the fiber wall porosity and a slight increase in the carbonyl group coatentent of the fibers due to the oxidation of carbohydrate hydroxyls .
Although ultrasound at lower frequeflcies pro- duces more violent cavitation, the effects are highly localized. On the other hand, cavitation is less violent at higher freqmcies owing to shortened life time of cavitation bubbles. However the shortened bubble life time leads to a greater num- ber of free radicals and hence more cavitational
effects. The shortened bubble life time allows the free radicals to escape the cavitation sites to bulk mixture facilitating the bulk reaction (Thompson and Doraiswamy 1999). Ultrasound at higher fre- quencies is found to be effective for oxidation reactions. Entezari et al. (1994) found that the rate of sonochemical oxidation of iodide at 900 lrHz was 31 times grater tttaa that at 20 kfiz. Petrier et d. (1994) aad Berlan et d. (1994). have com- pared tlze rates of oxidative degradation of phenol in aqueous solutions ova a range of ultrasound f s q d d f o d &at the treatment at higher frequencies is more efiicient. Additionally ultra- sound upation at higher frequencies is quiet (i.e., noise k) which is adv811tageous for the scale-up and ~~ utikatiion. So far, the high fre- q v utbrasound has ziot been applied to wood fibem.
This paper exambs the e f k t of 6lOlrHz ultrasound on the surface projmties of thermo- rnecwcal pulp (TMP), and on a hydrolytic lig*.
TMP was produced from loblolly pine by pressure refining at 5.5 bar of steam pressure. Hydrolytic Egnin aed potassium b r W (KBr, 99 + %, FTIR grade) were aupchmd &om Aldrich. The molec- ntar probes for inverse gas chromatography, ro-hexam, Aeptme, rPoctane, and n-nonane (all dfid grades) were obtained from Aldrich. Argon (dm3 high EPnrity gPade, W.999%) was obtained from BOC gases. Deionid water, eth- anol (95% prue), NaOH and HCl were obtained from F i r .
Sonication is carried out in a high-frequency sonochmical reactor (Ultrasonic Energy Systems, Sondemist 300C) operating at 610 ]rHz and at varying powers. A photograph of the reactor is shown in Figure 1. It consists of a 450 ml glass vessel attached to a transducer. An acoustic win- dow separates the reactor contents from the out- side coolant. The ultrasonic waves reach inside the

reactor through the acoustic window. The other end of the vessel has a concave focusing acoustic- mirrm which is used to concentrate the ultrasonic waves in the vessel.
A schematic of the ex-entd setup is shown in Figure 2. The sonochemical reactor (R) con- taining a suspension of the substrate material in distilled water, is submerged in a plycarbonate tank (W) faed with water. The tank is partitioned into two sections: the reactor section and control sample section, The reactor temperatore is mea- sured by a thermometer (T), and cooled using a chiller (Cole-Patmer, Model C1283-60) dipped in the water bath to remove heat producecl dnring sonication, thereby maintaining a temperature of 20 OC. The temperature in the control section was also maintained at 20 "C, with a temperature controller (TC) (Fisher, Isstemp Model 730). Ar- gon is bubbled continuously into both the reactor and control vessels.
Procedure
4.5 g of TMP was suspended in 450 ml of distilled water (1 % consistency) by stirring. The suspension was sonicated at 100 and 200 W for 3 h each, after which the pulp was filtered and &dried. Tbe control sample was treated in the identidy manner, except for the exposure to ~zltrasound. The TMP samples were analyzed using FTIR- transmission, FTIR-ATR spectroscopy and IGC.
To study the effect of ultra804 on lignh, 4 g hydrolytic lignin was suspended in 400 ml distilled mta, asad 4 drops of 1 N NaOH, and stinred. The mixture was sonicated at 200 W for 5 h at 20°C, and then lignin was precipitated out by adding 10 ml of 0.1 N HCl. The precipitate was filtered '
under vacuum, washed with water, air-dried and later grouad into h e powder and stored for adysh. Exactly the same procedure was foliowed for tbe control sample ifi the absence of ultrasonic
Figwe I . Photo& of the sonochedd reactor operating at 610 kHz.
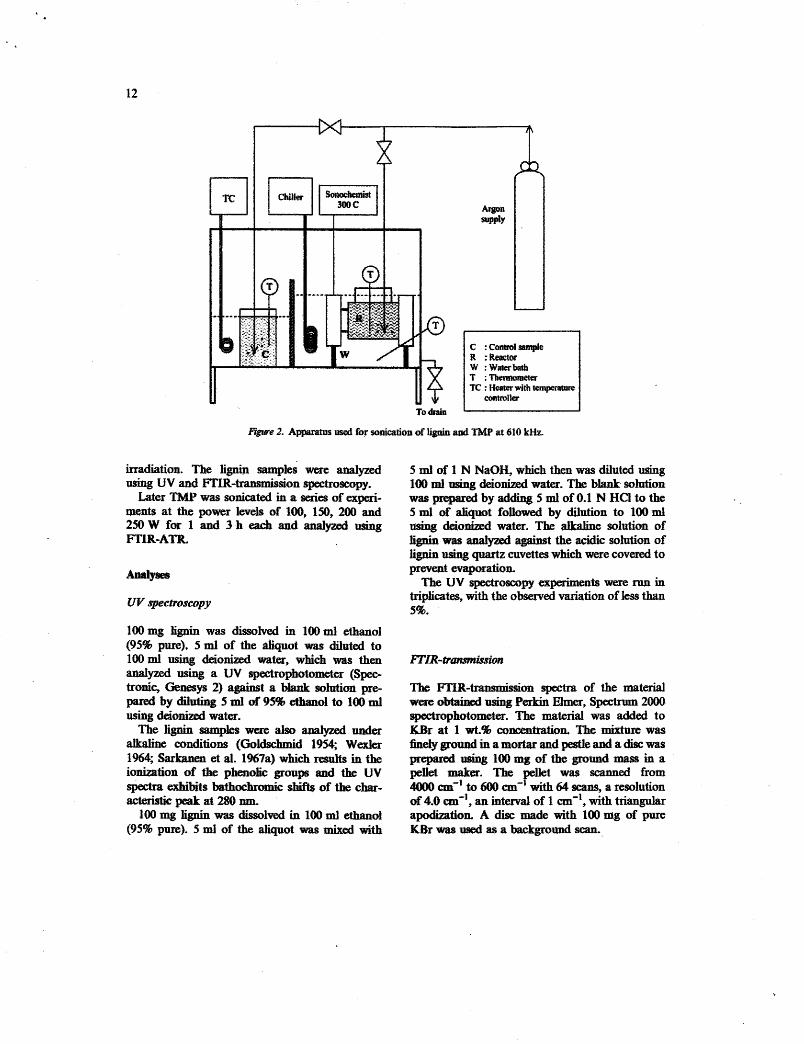
Figwe 2. Apparatus used for sonicarion of l i e and TMP at 610 kHz
irradiation. The lignin samples were analyzed 5 ml of 1 N NaOH, which then was diluted wing wing UV a d FTIR--sion spectroscopy. 100 ml using deionized water. The blank solution
Later TMP was soniwted in a series of ex+- was prepared by adding 5 ml of 0.1 N HCI to the ments at the power levels of 100, 150, 200 and 5 ml of aliquot followed by dilution to 100 ml 250 W for 1 and 3 h each and adymd using using deionized water. The atkaline solution of FTIR-ATR. lignin was analyzed against the acidic solution of
lignin using quartz cuvettes which were covefed to
lo0 mg lignin was dissolved in lOOd ethanol (95% pure), 5 ml of the &qot was diluted to 100 ml using deionized water, which was then analyzed using a UV spectrophotometer (Spec- trcmic, Genesys 2) against a bknk solutim pre- pared by diluting 5 ml of 95% etbnol to 100 ml using deionized water.
Tbe lignin samples were aJso analyzed under alkaline conditions (Goldschid 1954; Wexler 1964; Sarlswm et al. 1%7a) which resalts in the ionizatioa of the phenolic groups and the UV spedm exhibits hthuchromic shifls of the char- acteristic peak at 280 m.
100 mg lignin was dissolved in 100 ml ethanol (95% pure). 5 ml of the aliquot was mixed with
prevent evaporation. The UV spectroscopy expmhents were run in
triplicates, with the observed variation of less than 5%.
The FTlR-transmksim spectra of the material were obtained using Perkin Elmery Spectnrm 2000 spectrophotometer. The material was added to KBr at 1 wt% concentdoa The mixture was finely ground in amortar and pestle and a disc was prepared using 100 mg of the ground mass in a pellet ma%er. The pellet was scanned from 4000 an-' to 600 an-' with 64 scansy a resolution of 4.0 an-', an interval of 1 cm-', with triangular apodizatioa A disc made with 100 ndg of pwe KBr was used as a background scan.

In mder to detect the changes on the &ace of TMP upon sonication, a Nicolet (Ayatar model) ETlR spectrometer wsy: used to obtain attenuated total reflectance (ATR) spectra. The TMP samples were scanned in the range of 4000600 em-' using the same settings as for the trammission spectra and air as backgrmd.
Areas under the peaks of both FTiR-transmis- sion and FTJR-ATR spectra were determined using Spectrum software (Perkin Elmer, version 1 .lo) by sloping basebe method. In order to ob- tain a cliffmeme spectrum of hydrolytic l ige , the absorbance spectnun was nonnafked to the peak at 1515 a-' due to arompltic ring vibrations in lignin to compemate for concenttation differences.
Both IR spxtmmpy experiments were run in triplicates, with tbe observed &&ion of less than 10%.
Inverse Gas Chrwyuttography (IGC)
The air-dried TMP samples were packed in a stainless steel 3 16 column (AUtech, 114" OD, 0.21" IJ3,21" length). The quantity of TMP packed in the column (1.5-1.5 g) was f a d by difference. Table 1 shows the properties of the p b e s used in IGC study. IGC meamrawnts were peifomed using a gas t to graph (fiP 5790) equipped with a &me ionization detec4or. The detector and injector temperatures were ~~ at 200 .and 150 OC, mspectiyely ko emare f3a& mapomtion of probe vapors. Helium was used as the a m k r gas with a flow rate of 15 dhnin_ measad using a soap-bubble flow meter. Methane was used as an inat m k e r probe to d d d e the dead volume ia the colnmn. A very tnaall volume of vapor probes (4.1 pl) was injected into the column with a Hamilton syriuge to ensue a valid approxima- tion of infinite dilution of the probe vapor and the condition of near zero covmge. All peaks were
Tahle I . Properties of the 1ll0- probes lsad in K;C.
Robe 4 A Z ) #{~JH)
found to be symmetrical d their retention time was determined with an integrator connected to the GC. Each injection was repeated at least 3 h e s so as to get reproducible retention time md the avemge value was used in the calculations. Th d y s i s was done at 3 different oven temperatures: 45, 60, and 75 OC. The oven was allowed to equilibrate for one hour between temperature changss.
The net retention volume VN i s related to the retention time by (Felix and Gatenholm 1993; Kamdem et al. 1893; Jacob and Berg 1994; ~ y a w o k o et d. 1997; Liu et aI. 1998; Dutschk et d. 2001)
where, Pis the flow rate of the carrier gas, r , is the Isetention time of the individual probe and, is the retention time of practically non-adsorbing probe (methane). The dispersive interactions arise from London, Van der Waals and Lifshitz forces be- tween the adsorbent 4 a series of alkanes. Based on the retention volumes (VN), the dispersive inte&r.ts were determined using the methods of ScWb and L a d l e ( S a r m et al. 1%7b; Liu et ai. 1998) and Donis and Gray (Kamdem et al. i W 3 Lh et d. 199.8; Colm et d. 2003). As=- k g a very low adsorbate concentration, the former tecbaique ci&dates the dispersive component of the mface energy mrding to the relationship
where R is the gas constant, T is the temperature in degrees Kelvin, N is Avogadro's number, a is the area occupied by the adsorbate7 Yp is the dispersive component of the surface energy of the adsorbate, and C is a constant. Since RT ln(VN) varies line- arly with a($) $ am be detuminod from the ~ b p oT thc pbt of BT h(V') o($)'12.
This methud of detemdning $ has been criti- cized because of uncertainties associated with changes in the surface ma of the adsorbate due to interaction with the adsorbent (Felix and Gaknhohn 1993). Given this, a second calculation

was pedormed using the semie~pirical equation of Doms and Gray (Kamdem et al. 1993; Liu et al. 1998; Colom et d. 2003).
where, yf-,-+.) is the surface tension of a methylene group (35.6 d / m Z at 293.15 K) and AG[---) is the free energy of a methylene group. AG(-cH2-l is obtained f r m the slope of the plot of RT ln(VN) versus the nmber of carbon atoms in a series of n-alkanes.
R d t s and dhmsdons
The FT1R--on spctm of the c~ntroi and sonicated sample of TMF are shown in Figure 3. The IR bands are due to various fiurctonal groups in wood (Sarkanen et al. 196%; Colom et ai. 2003) and lignh (Faix 1991; Hodbg et al. 1997; Nada et d. 1998). For nample, the penL at 1736 an-' is due to C =O stretching vibrations of non-caaju- gated carbonyls in ligain while the peak at 1511 cm-' c o q n d s to the aromatic rihg viirations in lignin. It is Clear firom Figure 3 that there are no new peaks and tbn; peak positions have remained unclutnged as a resnlt of mnication. S h there are not m y visible differences in tbe intensi~es of various bands, the areas Mder the peaks were measured by usin8 the sloping base line method as shown in Figure 4. Tbe ratio of the area m d a the @at 1736 an-' to tbearegunderthe peak at 1511 ern-' (Alm/Alal) is a mcamn of the number of non-conjugated carbonyls present. It can be seein (Table 2) that the value of A,& A1511 bas incre.asd from 0.993 for the control sample of TMP to 1.141 for T W sonicated at 100 W for 3 h. Thevabehas hrtherimmased to 1,166 for TMP sonicated at IEOO W for 3 h. There was no difference in the peak area ratios come- sponding to other peaks. Thus, it can be concluded that there is iacrease in the number non-eon- jugated carbcmyls in TMP as a d of ubwmic treatmmt, which is possiily due to the oxidation of lipin present in TMP ji.bers.
Figure 5 shows the FTLR-ATR spectra of the control and sonicated sam.ples of TMP. The peak at 1728 cm" is due to non-conjugated carbonyls
in 1igni.n while the peaL at 1509 em-' corresponds to aromatic ring vibrations in lignia The area mder the peaks was cakdited using sloping baseline method as shown in Figure 6. Tbe ratio of the area under the peak at 1728 em-' .to the area under the peak at 1509 an-' (Alm/AIm) is used as a measure of the degree of surface oxidation of TMP. It can be sen from Table 2 tbat value of Atns/Alsos has increased &om 0.428 for the con- trol sample of TMP to 0.486 for TMP sonicated at 100 W for 3 h and to 0.578 for TMP sonicated at 200 W for 3 h. There was no difference in the peak area ratios wrresponding to other peaks. This shows that there is an increase iri the number of non-conjugated carbonyls present on the surf= of TMP wbich is due to oxidation of lignin, mainly present at the surface. Both ATR with typicd penetration depth of
100 ma d transmission infrared spectroscopy are basicaUy measure bulk fibers, when the sur- face changes ate only a few nanometer deep. For example, volume in the depth of 1 nanometer is only about 0.1% of the v d m in the depth of 1000 mn, in the case of a perfectly flat fiber. How- the fibers are not perfectly flatly on the ATR crystal. A number of fib are curved away from the crystal surface, which will cause more fiber surface to be in the path of ATR meamm=nt.
To confhm that lignin gets oxidized as a result of soaication, the control and s~niwted samples af hydrolytic 1- were maiyzd using UV aad FTIR-Mssion. The UV spedm compaxing the control and sonicated samples of hydrolytic &pin are shown in Figme 7. The peak at 279 nm indicates the presence of noniconjugahd phenolic hydroxyl group in hydtolytic lie (Goldschrnid 1954; Wexler 1964, Sarkanen ef al. 1%7a). The absorbamx value at 279 run Fable 3) bas de- creased from 0.769 for the contml sample of hyblytic lignin to 0.673 for the sonicated sample, which shows that there a decrease ia the number of nonconjugated phenolic hydmxyl groups as a result of soaication which is in agreement with the findings of Tan et ai. (1985)
The UV-ionization spectra of the oontrd and sonicated samples of (Figure 8) have two peaks (at 249 and 295 nm) wbich correspond to the phenolic hydroxyl groups in lignin. The peak at 295 nm is characteristic of the non-conjugated phenolic hy- droxyi groups (Cidkhmid 1454; Wedm 1%4:

0.00 J . . I I 1
1400 1500 1m 1700 1800 1900 wave lumber, om"
F W e 4. Slopjng baseline method ta calculate the area under the peaks of the FUR-transmission spectrum of TMP.
TaMe 2. kTiR-tran&iaa/ ATR area data for TMP samples.
Control sample of TMP TMPsooktedat 100 Wfor3 h TMP sanicated at 200 W for 3 h

Figure S. m1R-ATR spectra of TMP obtained using air as background
Figure 6. Soping baseline method to calculate the area mder the ptaks of the bTIR-AIR spectrum of TMP.
Sarkanen et al. 1967a). Table 3 shows the absor- there is a dectease in non-conjugated phenolic bane values of various peaks. The absorbance at hydroxyl groups after sonication. 249 nrn has decreased from 0.579 to 0.442 and the The normalbed FTIR-transmission spectra of absorbance at 295 nm has decreased from 0.298 to the control and sonicated samples of hydrolytic 0.204 as a result of sonication which c d i that lignin are shown in Figure 9. Here, the peak at

1700 an-' orr responds to C = 0 stretching vibra- tions in non-conjugated carbonyls in l i e It is evident fiom Figure 12 tbat there are no new peaks and there is no change in the position of peaks as a result of ultrasonic irradiation of the hydrolytic lignin. To compare the intensities of bands in the region of interest, a diffenznce spec- trum was obtained as shown in Figme 10. It can be seen that there is a considerable increase in the intensity of absorption in the region from 1680 to lsOO m-', which c q d s to C=O ~ c b i n g vibrations in non-conjugated carbonyls. The area under the peaks was calculated by the sloping baseline m&od (Figare 11) for quantification p m b The vahse of A~.MofAlns ~ I Z U X S f i ~ m 1310 for the control sample to 1.562 for the soa-
icated sample which confmn~ that there is an in- crease in the non-conjugated carbonyl groups present in lignin as a result of sonication. Com- bined UV and FTIR results suggest that the oxi- dation of hydroxyl groups in lignin have taken place to form carbony1 groups after sonication.
IGC analysis was d e d out to study the effect of sonication on the surf= properties of TMP fibers. Table 4 shows the dispersive components of the surface free energy y.: of the control and son- icated samples of TMP evaluated using the two methods, It can be seen there is an increase in the value of $ as a resuit of sonication. If shows that the rmrface of TMP fibers has h o m e more wet- table after sonicatim, which is in accord with the spectroscopic resalts that found increased levels of
- CwRrol sample of hydrolytic lignin
- - - I tiydrotytic lignin sorricated at 200 W for 5 hours
Figwe 7- W spectra of hydrolytic lignin,
TaMe 3. UV specttoscopy data for hydrolytic Ugnin Pamples.
Control sample of hydrolytic lignin Hydrolytic lignin sonicated at 200 W for 5 h

- ConQKJl sample of hydrolytic iignin
- I _ - Hydrolytic ligrrin dca ted at200Wfor5hom
Figure 8. W-ionization spectra of hydmlytk ]innin.
Figure 9. FTIR-transmission spectra of hydrolytic lignh
oxidation upon treatment with ultrasound. It is FTIR-ATR was employed to study the effect of also found that the d t s are consistent between the nltrasound power on the degree of mrfh the two methods used for calculating the #. oxidation of T W sbers. The peak area ratio

A: Hydrolytic @dn sonicated 200 W for 5 hours
(A-0): Difference
Wave nunber, cm"
Figure 10. DifEe- spectnrm ( ~ ~ R ~ s i o n ) showing an inclmse in tiat absorption ia the band near 1700 d' v cation,
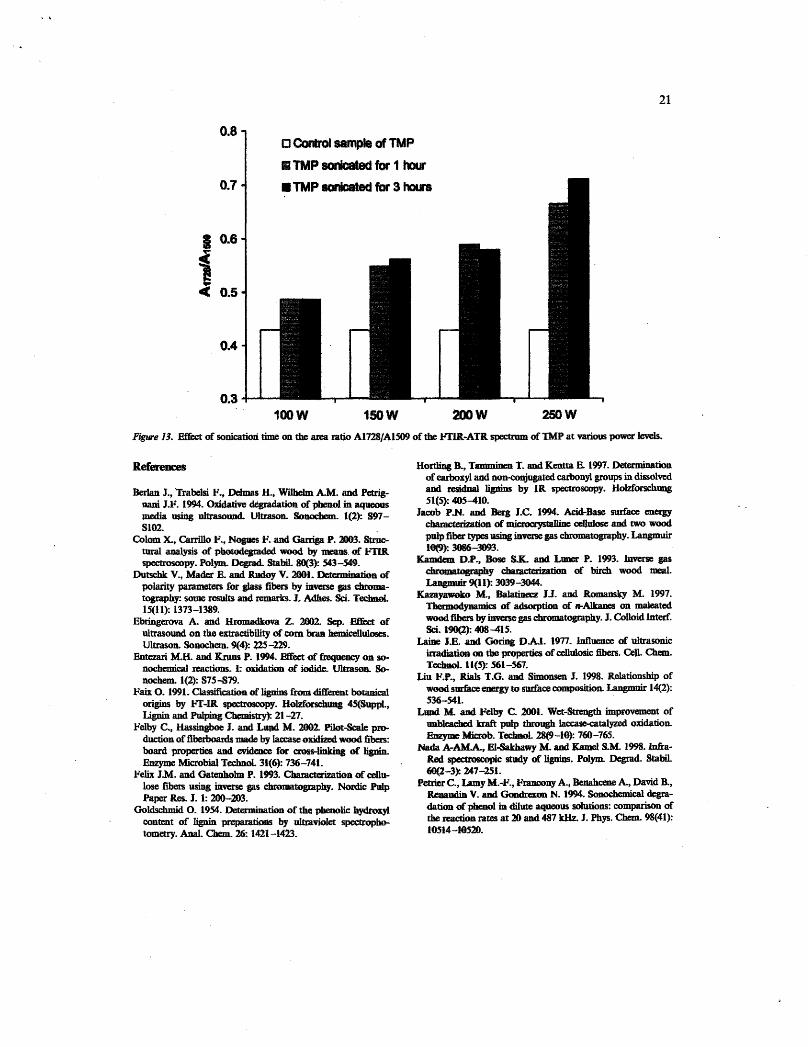
Atns/AIm was used for quantification purpose. cated for 1 how versus ultrasound power, indi- Figure 12 shows the plot of A172;$fA1509 obtained cating that value of A17B/A1M9 increases linearly from the FTIR-ATR spdra of TMP fibers soni- with ultrasound power. Figure 13 shows the
Figure 21. Sloping baseline d o d to calculate the ama Im&er the peaks of tbe hTlR--ttansmission SWWLUD of h ~ h l * lignin-

. Q 5Q 100 t?X 200 250 300 Ultrasound Power, W
Wpe 12. 88tia of ul-Imd pow= on the area ratio A1728/A1509 of the mIR-ATR specEmm of TM' sonkited for I b
comparison of TMP samples sonicated for 1 and 3 h at various ultrasound powers. There is, how- ever, no substantial difference in the value of Alm/ArSo9 between the Th4P samples sonicated for 1 and 3 h.
Aqueous suspensions of thezmo-mechanical pulp were subjected to ultrasonic irradiations at 610 kHz frequency. FTI[R tmmmhsion aad ATR results show an inenme in noe-conjugated carbonyl groups in TMJ? upon sonication. To investigate this behavior, sonication of the hydrolytic lignin was camed out, which also shows an inrrease in the number of non-conjngated eatbonyl p o p s con- pled with a dmrease in non-ooajugatd phenolic
hydroxyl groups. The increase in non-conjugated carbonyls in TMP after sonication can attributed to fhe oxidation of phenoiic hydroxyl groups in lignin. The inmeasp in the surface energy of sonicated iibers, as sen from IGC d y s i s , suggest that the suz- f~~e of sonicitted TMP fibers is more active. The extent of surface oxidatiod of TMP increases line- arly with an increase in the ultrasod power, however theresults are not sigdicmtly different for the fibers sonicated for 1 and 3 h.
Authors appreciate financial assistange from the US Department of Agriculture through grant number USDA#2001-3550410129, and experi- mental assistwe fim Subaila Rowe.
T& 4. Dis@ve component of the mfiwe free energy of TMP samples.
Dorris and Gray method tkhltz and LavieMe method
7," db2 R* 7: m ~ l m ~ it2
aCmtmlsample of TMP
S m B - a W I b
Figure 13. Effect of sonicathi tbne on the area ratio A1728/A1509 of the Fl3R-ATR spectrum of TMP at various pawer levels.
Bmlan J., T r a W F., Delmas H., wilhelm A.M. and Petrig- oani JS. 1994. Oxidative degradation of phenol in aqueous media using u l m U1- Sotaochgn. I(2): s97- S102.
Colom X, Currillo F., Nogues pl= and Garriga P. 2403. Stnre- n r r a l a n a l y s i s o f p h o ~ d e d ~ b y m e a o s o f t . T L R m p y . Pol= Degrad. Stabil. cpo(3) 543-549.
Dutschk V., Mader E. and Way V- 2001, Dc' ' 2tian of polarity paamems for glass f i h by inverse gits cbma- tography some d t s and xmmtrks. 3. A k . sci. Technol. l5(l 1): 1373-1 389.
EMngemva A. and Hromadkorra 2. 2002. Sep. Effkct of u l t r e on the extractibility of corn bran hemblluhxs. Ultrasoa 30~chem. 9(4) &B-229.
Entezari M.H. and Emus P. 1994. Bffect of fhpenq on so- nochemical d m . k oxidation of iodide- tntrasaa %- nochem. l(2): S75479.
Faix 0.1991. Cladkathn of lignins from ditlknt botanical origins by m-1R splscrrv . How- 4ysuppl., Lignin and Pulping Chemistry> 21 -27.
Felby C., Hassingboe J. and Lupd M. 2002 Pilot-Scale pro- d u c t i o n o f f i ~ ~ b y l a c c a s e o ~ i z e d w o o d ~ board pmperties luld evidence far cmsdinkiag of lignin. Emzyme Microbial TechnoL 31(6): 736-741.
Felix J.M. and Gatenholm P. 1993. Clwmkrhtio~ of cellu- lose fibers using invetse gas chrrmawphy. Nordic Pulp Paper Res. J. 1: 200-203.
Golclscbmid 0. 1954. Detemhation of the phenolic hyimxyl content of lignin preparations by ultraviolet spectropho- tometry. Anal. Qlem. 26: 1421 -1423.
Hortling B., Tamminen T. imd Kentta E 1997. m. b . .
on of carboxyl aad mpconjugatd carbonyl groups in dissolved atid resbiual ligaina by JR spectmscq~y. Holz£iiurl$ 51(S): 405410.
Jamb P.N. and k g J.C. 1994. Acid-Base surface energy C-tion of miaocrystalliue duluse and two wood pulp fiber types using inveme gas ~ o g r a p h y . Langmuir t*. W-3w3.
Kamdan DP., 3ose UC. and L~ner P. 1993. lnverse $as -mgKqhy cbarw.. charac' tion of bircll wood meal.
9(11) 3039-3044. K a z a y b M., Bahimzz JJ. and Ro~llaaslrJI M. 1997.
l l a m o d w of adsorption of +Alkanes on makaed 7kFOOd fibers by hmrst gas chromatography. J. Colloid Interf. Sci. 190(2): 458-415.
Laine J.E. and Gming DM. 1977. influence of ultrasonic irradiation on tbe properks of cellulosic fibem. Cell. Chem. Tecbnd Il(!J): 561-567.
Liu F.P., f b b T.G. and Simonsen J. 1998. Relationship of wood surface energy to snrfkce camposition. hngmuir 14(2): 536-541.
L d Id, aad Felby C. 2001. Wer-Smgth hqmmmnt of unbleached laaft patp through laccasecatalyzed oxidation ~nzyme T-L zqg -10): m-765.
Nada A-AM.A., hf. d Ramel S.M. 1998. Infra- Red q c a m c q i c study of @ins. Polym. Degrad Stabil. 60(2-3) 247-251.
Pettier C., Iamy hi.-);., Fmnmny A., Beaahcene A, David B., hdia V. aad N. 1994. Sonochemical d w - datian of phenol in dilute aqueous solutions: comparison of the reaction rates at a0 and 487 iEHz J. Phys. Chem. 98(41): 10514-H)520.

Pranovich AV., Reunanm M. and Holmborn B. Sonoch- isuy of Lignin Model Compounds in Water. Advances in Lignocellulosics Chemistry for Eootogically Friendly Pulping and Bkadahg Technologies, E u r m Workshop on Lignocellul& and Pulp, 5th University ofAveiroY A e Y Port, A*. 30-Sept. 2, 19% (1998) 421 -424.
Qian Y., Goodell B, Jellison 3. and Felix C C u)04. The effect of hydroql mdkd generation on f- actmation of TMP fi- J. PO~YIR -11 12(3) 147-155.
Sar$anen KV., Chang H.-M a d AZlaa G.G. 19% S p i e s =riation in JirminJ;. IL Coniferiignbs. Tappi M(12): 583-587.
K.v., ~haag n-M and ~ricsson 3- i w b - species variation in lignins 1 infrared spectra of guaiacyl and s-1 models. Tappi SO(ll(Pt 1)): 572-575.
Seine T, Y e A, Fnjkam M, Chen R-L, Erata 2, T a k a M. and Taksi M- 2001. ESR Studies of radicals generated by ultrasonic kmdhtion of ligrrin solwion A0 Application of the Spin Trapping Method.. Wood Sci. Te~hndL 35(1-2): 97-106.
Sun EL and Tomldnson J. 2002a. Comparative study of ligains isolated by alkali and ultra sou ad^ alltali exmaions &om whetlt Stridw. Ultrason. Sonochean, 9(2) 85-93.
S u n R C - a B d T ~ J . ~ . ~ t i o n d b e m i - e e l l ~ o b t a i n e d b y c l a s s i c a l & Q d d ~ y ~ a x - tractio~lsfk~~~wbeat ~-CarbohydPolpm. so(3F263-271.
Sun Re, Suo XJ?. and and 2LH. 2002b. EfEect of uhrasound o n t h e % h p c t u r a l a n d p h ~ p r o p e r t i g o f ~ soh soluble hemiddoses from wheat straw- U b s m . SQ nochem. 9(3: 95-101.
Sun R., Sun X.1.'. a d Xu XP. 2002.a. Effect of ultrasound on the physicwchmical properties of organosolv lignitls from wheat straw. 3. AppL Pdym. Sc i 84(13): 2512-2522.
Supe A, T i J., Rudnev A. and IELarasev A. 1993. effect of irradiation conditions on genedon and stability of free radicals in ceUulose, wood and lignin. Latvijas Kimijas Zur- nals 4: 43541.
Tan G.M., Yasada S. anb Terasbha N. 1985. The Effect of ultrasonic imdation on deiign$ication reactions. ii. behav- ior of lignin nnder irradiation. Mokuzai GalWdi 31(5): 388-396.
lkmpson LH. and Doraisw8my LJC 1W. Somch&ry: s c i e n o e a n d ~ I n d u s t r i a l & ~ * C h e m . R e s . 38(4) 1215-1249.
Wexler A.S. 1964 C l t a r a c t ~ ~ of l ipdonates by ultmiolet -. dinect and d i f f w spectrograms. Anal. Chem. 3€i(1): 213-221.
W~clsten P., QvintasLkino P., Tuorniaen S. and Laine JE. UW)3.~~ofEiberboardfrrmrwoodtlbeRactivated with fenton's reagent {Xa02/YeS04). H o M d u a g 57(4): 447-452
Willems P. 1962. Kinematic high-fresuency and ultrasonic t . t of puIp- Pdp & Paper Magaz. Canada 63: T455 - 1462.
Yoshioka A, Seina T, Tabata M. and Takai M. 2000. H d y t i c &on of interunitary bonds in lignin induced by ubsonic hmdhtion of MWL (milled mod ligoin) dissolved in dime&* sulfoxi& Hdzforschung 5q4) 357- 364,