Embed Size (px)
Citation preview
2370 Langmuir 1991, 7, 2370-2375
Surface Enhanced Raman Examination of Carbon Electrodes: Effects of Laser Activation and Electrochemical
Pretreatment Yan Wang Alsmeyer and Richard L. McCreery'
Department of Chemistry, The Ohio State University, 120 West 18th Avenue, Columbus, Ohio 43210
Received January 2, 1991. In Final Form: April 22, 1991
Surface enhanced Raman spectroscopy (SERS) was used to examine carbon electrode surfaces followin
Ag particles increase the Raman scattering intensity from the carbon substrate by 30-100 times, or larger for special cases. In the current report, the technique was used to characterize the surfaces of laser activated and electrochemically pretreated (ECP) glassy carbon (GC) and highly ordered pyrolytic graphite (HOPG). The SERS spectra were more surface selective than normal Raman and more closely correlated with electrochemical observations. For laser-activated HOPG, the SERS spectra revealed damage to the graphite lattice at lower power densities, and the disorder exhibited in SERS spectra more closely tracked the increase in electron transfer rate. For ECP of GC, HOPG, and pyrolytic graphite, the surface film examined with SERS was indistinguishable for the three substrates. Finally, the damage resulting from ECP of HOPG is consistent with a nucleation and growth mechanism.
electrodeposition of 0.2 pmol/cm2 of metallic silver. As demonstrated previously, the resulting ca. 400- w
Introduction As noted in numerous reports and the surface
history of carbon electrodes has a large effect on electro- chemical behavior. Of particular relevance here are the effects of pretreatment procedures on electron transfer kinetics, which vary by several orders of magnitude depending on surface variables. It has been demonstrated by our lab and others that fast electron transfer on carbon surfaces depends on both carbon microstructure and ~leanliness.~-ll In the case of ordered graphite basal plane, such as highly ordered pyrolytic graphite (HOPG), the rates of electron transfer for Fe(CN)63-/4- and dopamine increase greatly when microstructural edge plane defects are formed by laser treatment or anodizat i~n.~J~ For disordered materials such as glassy carbon, the defect density is sufficient for rapid electron transfer, but the surface must be cleaned by careful polishing: laser activation,9J1J2 electrochemical pretreatment,13-ls etc. When the conditions of high defect density and surface cleanliness are met, GC electrodes exhibit electron transfer rate constants (k") for Fe(CN)s3-I4- comparable to those of Pt or Au3J
Raman spectroscopy has proven to be a useful probe of changes in carbon microstructure caused by surface pre-
(1) Kinoshita, K. Carbon: Electrochemical and Physicochemical
(2) Randin, J.-P. InEncychpedia ofElectrochemistryofthe Elements; Properties; Wiley: New York, 1988.
Bard. A. J.. Ed.: Dekker: New York. 1976: Vol. 7. DD 1-291. (3) McCreery, R. L. In ElectroanaZyticai Chemsiiy; Bard, A. J., Ed.;
(4) Stutta, K. J.; Kovach, P. M.; Kuhr, W. G.; Wightman, R. M. Anal.
(5) Fagan, D. T.; Hu, I. F.; Kuwana, T. Anal. Chem. 1985,57, 2759. (6) Hu, I. F.; Kuwana, T. Anal. Chem. 1986,58,3235. (7) Hu, I. F.; Karweik, D. H.; Kuwana, T. J. Electroanal. Chem.
(8) Rice, R. J.; Pontikos, N. M.; McCreery, R. L. J. Am. Chem. SOC.
(9) Bowling, R. J.; Packard, R. T.; McCreery, R. L. J. Am. Chem. SOC.
Dekker: New York, 1991; Vol. 17.
Chem. 1983,55, 1632.
Interfacial Electrochem. 1985, 188, 59.
1990,112,4617.
1989,111, i2i7. (10) Bowling, R. J.; Packard, R. T.; McCreery, R. L. Langmuir 1989,
5 Iw! -, ---. (11) Rice, R. J.; McCreery, R. L. Anal. Chem. 1989,61,1637. (12) Bodalbhai, L.; Brajter-Toth, A. Anal. Chim. Acta 1990,31,191. (13) Engstrom, R. C.; Strasser, V. A. Anal. Chem. 1984,56, 136. (14) Cabanias, G. E.; Diamantie, A. A.; Murphy, W. R., Jr.; Linton, R.
(15) Kepley, L. J.; Bard, A. J. Anal. Chem. 1988,60, 1459. W.; Meyer, T. J. J. Am. Chem. SOC. 1985,107,1845.
0743-7463191 12407-2370%02.50/0
treatment. For example, the presence of the 1360-cm-' "disorder (D)" band correlated with large heterogeneous electron transfer rate constant (k") for HOPG, and both effects were attributed to the presence of edges of graphite microcrystallites.gJ1 "Disorder" is used here to mean any decrease in long range order from an ideal graphite crystal dnd, in particular, to the existence of microcrystallites or graqhitic edges. Creation of disorder, and therefore the D band, by either laser activation or electrochemical pre- treatment (ECP) coincideswith large increasesin ko. Both Raman spectroscopygJ0 and scanning tunneling micros- copy (STMP imply that ECP proceeds on HOPG by nucleating at defect sites, followed by growth of a damaged region during oxidation. The resulting increase in defect density causes the increase in observed k" and D band intensity.
Although Raman spectroscopy has been valuable for revealing structural changes accompanying ECP and laser treatment of HOPG, an important issue remains. The sampling depth of conventional Raman spectroscopy is ca. 135 A for HOPG and 290 A for GC.3J7 However, the structure of only a few atomic layers (-10 A) of carbon should determine its electrochemical behavior. Normal Raman provides useful correlations of microstructure and electrochemical effects, but its utility would be increased by idproving its surface selectivity. We recently reported a technique based on surface enhanced Raman spectros- copy (SERS) for improving the surface selectivity of Ra- man spectroscopy for carbon surfaces.17 Following elec- trodeposition of Ag particles on the carbon electrode, the carbon Raman scattering was enhanced ca. 50 times when the A particle diameter was ca. 400 A. The enhancement is du f to short range chemical interactions between the particles and the carbon or to electromagnetic field enhancement. The latter effect decreases with the 10th power of the distance from the Ag particle, which is a combination of a r-12 decrease in the field effect and a r2 increase in the number of s~at terers .~*J~ An estimate of
(16) Gewirth, A. A.; Bard, A. J. J. Phys. Chem. 1988,92,5563. (17) Alemeyer, Y. W.; McCreery, R. L. Anal. Chem. 1991,63, 1289. (18) Murray, C. A,; Allara, D. L. J. Chem. %ye. 1982, 76, 1290.
0 1991 American Chemical Societv
SERS of Carbon Electrodes
the sample depth based on field enhancement is approx- imately 20 A.17 Thus for either chemical or field en- hancement mechanisms, the improved surface selectivity should provide structural information of greater direct relevance to electrochemical behavior than normal Ra- man spectroscopy.
We report here the application of SERS to laser and electrochemically pretreated HOPG and GC electrodes. The controlling objective of the experiments is to reveal the relationship between carbon surface structure and the electron transfer rate for Fe(CN)#+I4-.
Experimental Section The Raman spectrometer and SERS procedure have been
described previously. In all cases, the average Ag coverage was 0.21 pmol/cmz for SERS experiments, and spectra were obtained within 10 s of deposition with a CCD integration time of 5 s in all cases. Laser power at the sample was typically 10 mW on a 50 X 200 pm spot. Where noted, a Spex Raman microprobe with a ca. 5 pm diameter focal spot was used to acquire spatially resolved spectra.
HOPG was ungraded material from Union Carbide (Parma, OH) and was freshly cleaved before each experiment with adhesive tape. The fresh basal plane surface was exposed to air for a few minutes before immersion in electrolyte. For all HOPG and PG experiments described here, only the basal plane was examined. Laser activation was carried out as described previously:Pz2 in air with a 9-ns, 1064-nm Nd:YAG pulse, on a freshly cleaved surface immediately before cell assembly and immersion in electrolyte. In order to electrochemically pretreat carbon surfaces gradually, ECP was conducted with linear cyclic sweeps at 50 mV/s starting at -0.1 V vs Ag/AgCl. Unless noted otherwise ECP was conducted in 0.1 M KN03. The maximum positive potential was either 1.85 or 1.95 V, as noted below, and cyclic sweeps were repeated in some cases. After the ECP procedure was complete, either the electrode was examined in air with normal Raman spectroscopy (at 515 nm) or the electrolyte was replaced with 1 mM AgN03 in 0.1 M NaClO,, Ag was electrode- posited, and SERS spectra were acquired. Each ECP and SERS procedure was initiated with a freshly cleaved HOPG surface; no attempts to further modify the surface after Ag deposition were made. GC was polished conventionally with 0.05-pm alumina before ECP, and PG was cleaved before any subsequent proce- dures.
Heterogeneous electron transfer rate constants (ko) for Fe(CN)s*lC were determined from cyclic voltammetry in 1 M KC1 by the method of Nicholson, assuming Q = 0.5 and D, = 7.6 x 10⁻⁶ cmZ/s.
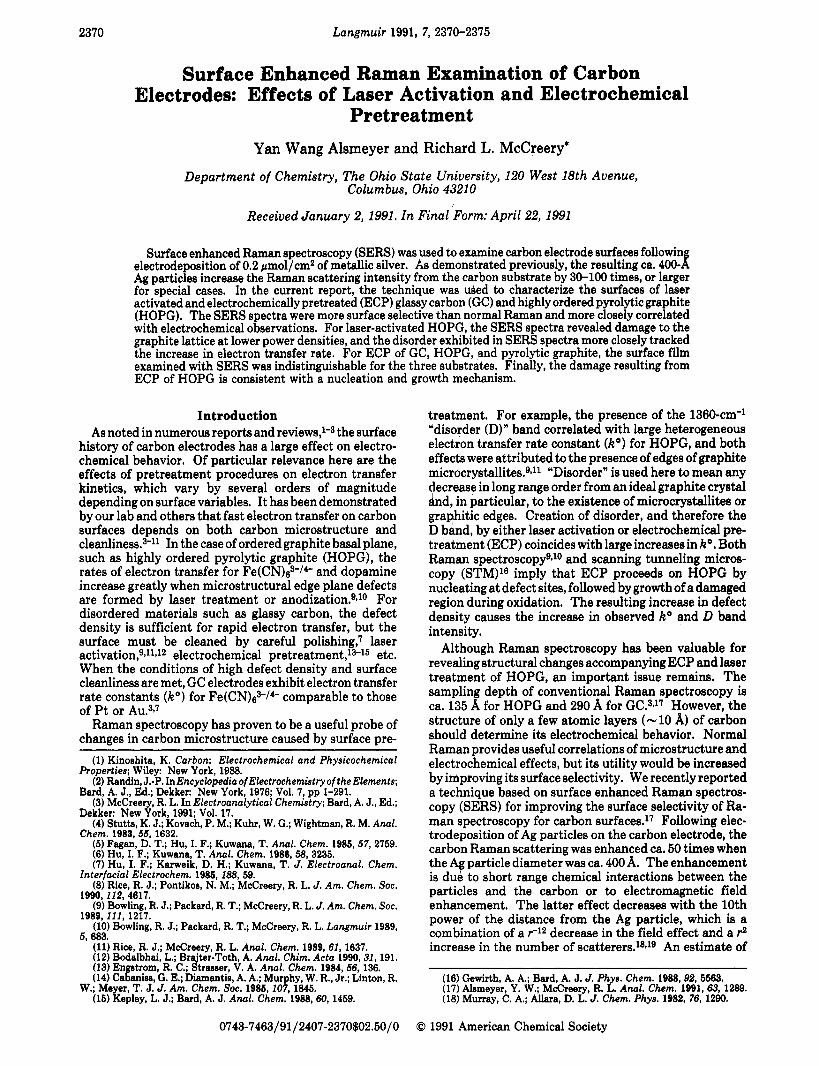
Results and Discussion Figure 1 shows normal Raman spectra of HOPG basal
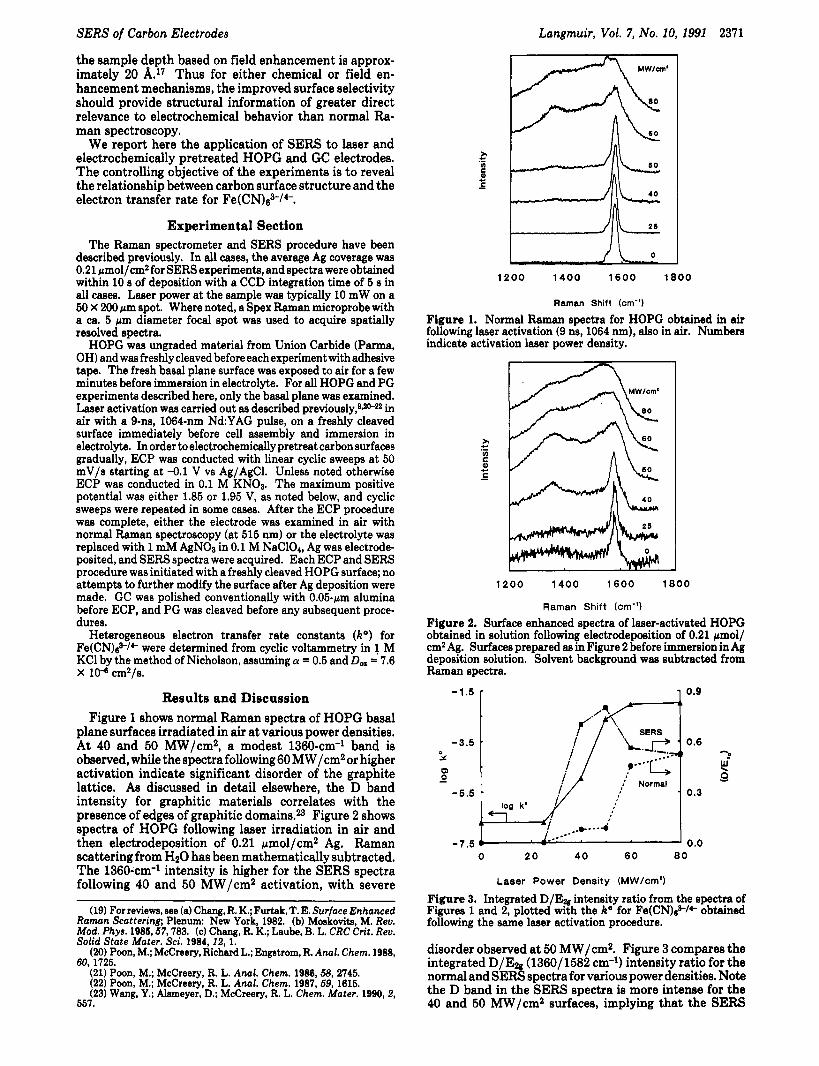
plane surfaces irradiated in air a t various power densities. At 40 and 50 MW/cm2, a modest 1360-cm-' band is observed, while the spectra following60 MW/cm2 or higher activation indicate significant disorder of the graphite lattice. As discussed in detail elsewhere, the D band intensity for graphitic materials correlates with the presence of edges of graphitic domains.23 Figure 2 shows spectra of HOPG following laser irradiation in air and then electrodeposition of 0.21 pmol/cm2 Ag. Raman scattering from H2O has been mathematically subtracted. The 1360-cm-l intensity is higher for the SERS spectra following 40 and 50 MW/cm2 activation, with severe
Langmuir, Vol. 7, No. 10, 1991 2371
(19) For reviews, see (a) Chang, R. K.; Furtak,T. E. Surface Enhanced Raman Scattering; Plenum: New York, 1982. (b) Moskovits, M. Rev. Mod. Phys. 1986,57,783. (c) Chang, R. K.; Laube, B. L. CRC Crit. Rev. Solid State Mater. Sci. 1984,12,1.
(20) Poon, M.; McCreery, Richard L.; Engetrom, R. Anal. Chem. 1988, 60, 1725.
(21) Poon, M.; McCreery, R. L. Anal. Chem. 1986,58,2745. (22) Poon, M.; McCreery, R. L. Anal. Chem. 1987,59, 1615. (23) Wang, Y.; Alsmeyer, D.; McCreery, R. L. Chem. Mater. 1990,2,
557.
1 2 0 0 1400 1600 1800
Raman Shift (cm-')
Figure 1. Normal Raman spectra for HOPG obtained in air following laser activation (9 ns, 1064 nm). also in air. Numbers indicate activation laser power density.
1200 1400 1600 1800
Raman Shift (cm-')
Figure 2. Surface enhanced spectra of laser-activated HOPG obtained in solution following electrodeposition of 0.21 pmol/ cmz Ag. Surfaces prepared as in Figure 2 before immersion in Ag deposition solution. Solvent background was subtracted from Raman spectra.
-3.5 Y
0 - - 5 . 5
-7 .5
0.6
I 0*3 1 , y 0.0 , /*----4
a c 0 1
0 2 0 40 6 0 8 0
Laser Power Density (MW/om')
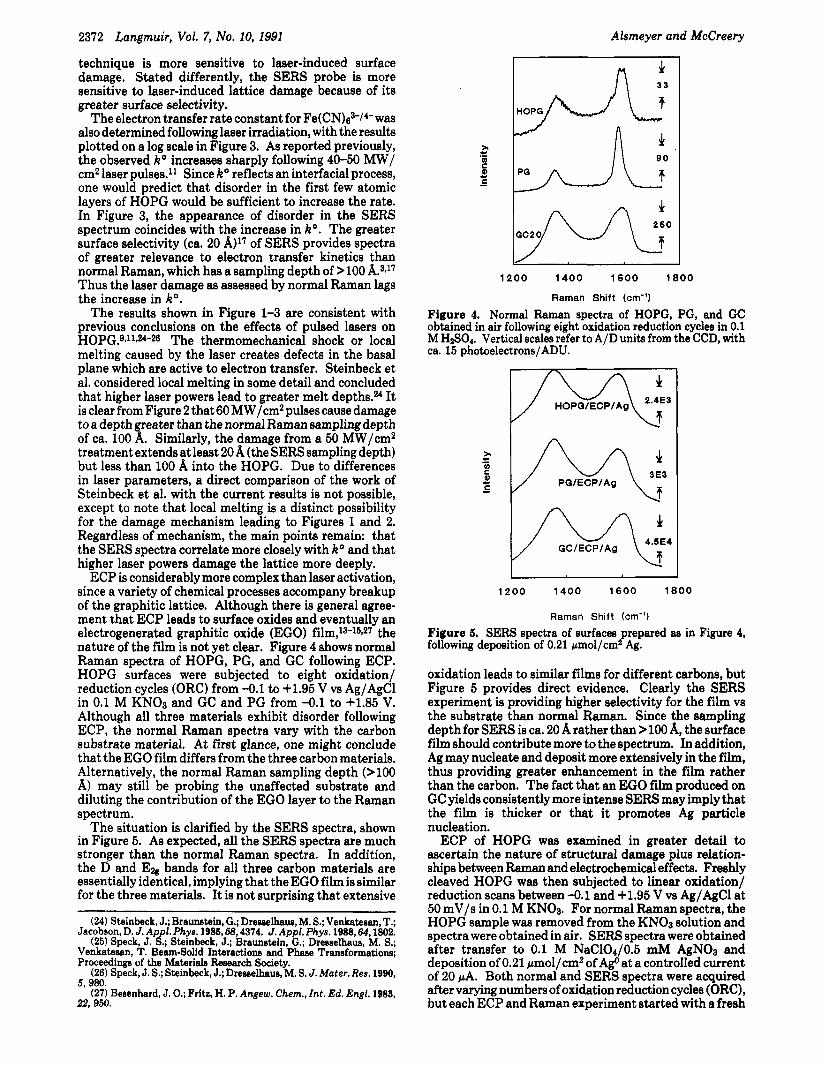
Figure 3. Integrated D Ea intensity ratio from the spectra of Figures 1 and 2, plotte d with the ko for Fe(CN)&/C obtained following the same laser activation procedure.
disorder observed at 50 MW/cm2. Figure 3 compares the integrated D/E (1360/1582 cm-I) intensity ratio for the normal and SER% spectra for various power densities. Note the D band in the SERS spectra is more intense for the 40 and 50 MW/cm2 surfaces, implying that the SERS
2372 Langmuir, Vol. 7, No. 10, 1991
technique is more sensitive to laser-induced surface damage. Stated differently, the SERS probe is more sensitive to laser-induced lattice damage because of its greater surface selectivity.
The electron transfer rate constant for Fe(CN)e3-/4-was also determined following laser irradiation, with the results plotted on a log scale in Figure 3. As reported previously, the observed k" increases sharply following 40-50 MW/ cm2 laser pulses.ll Since k" reflects an interfacial process, one would predict that disorder in the first few atomic layers of HOPG would be sufficient to increase the rate. In Figure 3, the appearance of disorder in the SERS spectrum coincides with the increase in k". The greater surface selectivity (ca. 20 A)17 of SERS provides spectra of greater relevance to electron transfer kinetics than normal Raman, which has a sampling depth of >lo0 A.3J7 Thus the laser damage as assessed by normal Raman lags the increase in k".
The results shown in Figure 1-3 are consistent with previous conclusions on the effects of pulsed lasers on HOPG.gJ1924-26 The thermomechanical shock or local melting caused by the laser creates defects in the basal plane which are active to electron transfer. Steinbeck et al. considered local melting in some detail and concluded that higher laser powers lead to greater melt depths.24 It is clear from Figure 2 that 60 MW/cm2 pulses cause damage toa depth reater than thenormal Raman sampling depth
treatment extends at least 20A (the SERS sampling depth) but less than 100 A into the HOPG. Due to differences in laser parameters, a direct comparison of the work of Steinbeck et al. with the current results is not possible, except to note that local melting is a distinct possibility for the damage mechanism leading to Figures 1 and 2. Regardless of mechanism, the main points remain: that the SERS spectra correlate more closely with k" and that higher laser powers damage the lattice more deeply.
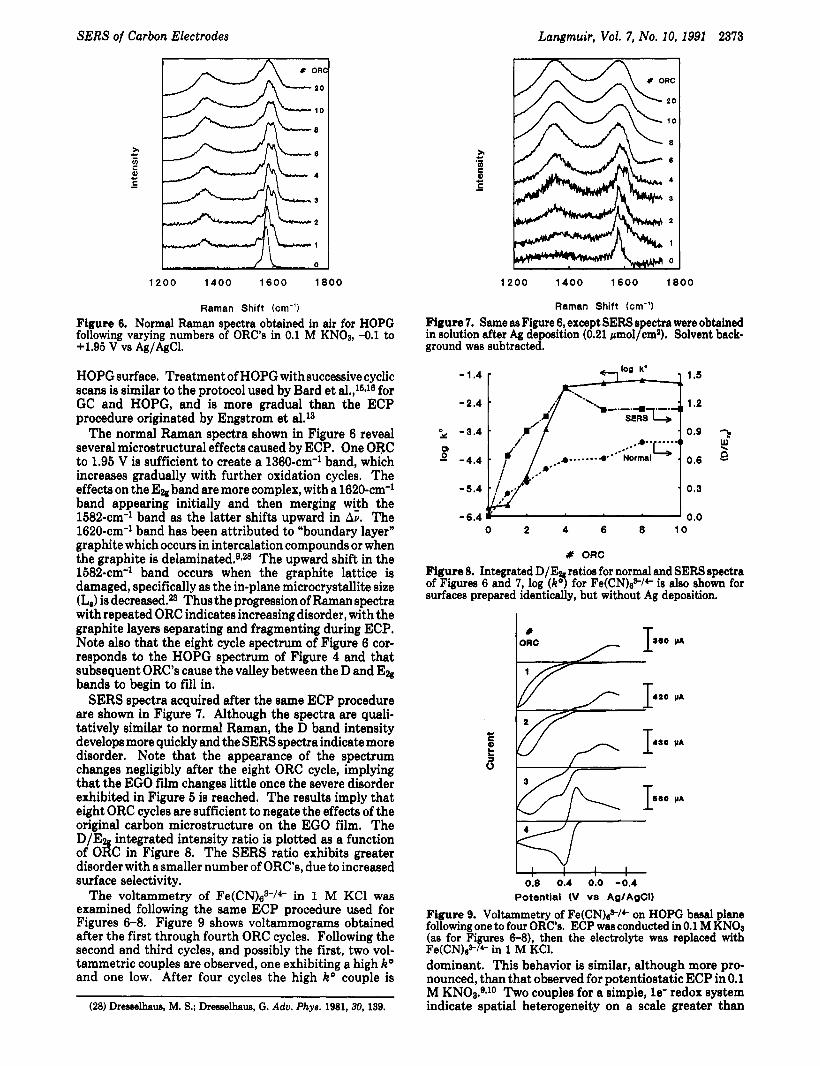
ECP is considerably more complex than laser activation, since a variety of chemical processes accompany breakup of the graphitic lattice. Although there is general agree- ment that ECP leads to surface oxides and eventually an electrogenerated graphitic oxide (EGO) film,13-15*27 the nature of the film is not yet clear. Figure 4 shows normal Raman spectra of HOPG, PG, and GC following ECP. HOPG surfaces were subjected to eight oxidation/ reduction cycles (ORC) from -0.1 to +1.95 V vs Ag/AgCl in 0.1 M KNO3 and GC and PG from -0.1 to i-1.85 V. Although all three materials exhibit disorder following ECP, the normal Raman spectra vary with the carbon substrate material. At first glance, one might conclude that the EGO film differs from the three carbon materials. Alternatively, the normal Raman sampling depth (>lo0 A) may still be probing the unaffected substrate and diluting the contribution of the EGO layer to the Raman spectrum.
The situation is clarified by the SERS spectra, shown in Figure 5. As expected, all the SERS spectra are much stronger than the normal Raman spectra. In addition, the D and E a bands for all three carbon materials are essentially identical, implying that the EGO film is similar for the three materials. I t is not surprising that extensive
of ca. 100 x . Similarly, the damage from a 50 MW/cm2
Alsmeyer and McCreery
(24) Steinbeck, J.; Bramatein, G.; Dresaelhaue, M. S.; Venkatesan, T.; Jacobson, D. J. AppLPhye. 1986,58,4374. J. Appl. Phys. 1988,64,1802.
(25) Speck, J. S.; Steinbeck, J.; Braunstein, G.; Dresselhaus, M. S.; Venkatesan, T. Beam-Solid Interactions and Phase Transformations; Proceedings of the Materials Research Society.
(26) Speck, J. S.; Steinbeck, J.; Dresselhaus, M. S. J. Mater. Res. 1990, 5, 980.
(27) Besenhard, J. 0.; Fritz, H. P. Angew. Chem., Int. Ed. Engl. 1983, 22, 950.
1200 1400 1600 1800
Raman Shift (cm-')
Figure 4. Normal Raman spectra of HOPG, PG, and GC obtained in air following eight oxidation reduction cycles in 0.1 M HzSO,. Vertical scales refer to A/D units from the CCD. with ca. 15 photoelectrons/ADU.
1200 1400 1600 1800
Raman Shift (cm-'1
Figure 5. SERS spectra of surfaces prepared as in Figure 4, following deposition of 0.21 kmol/cm2 Ag.
oxidation leads to similar films for different carbons, but Figure 5 provides direct evidence. Clearly the SERS experiment is providing higher selectivity for the film vs the substrate than normal Raman. Since the sampling depth for SERS is ca. 20 A rather than >lo0 A, the surface film should contribute more to the spectrum. In addition, Ag may nucleate and deposit more extensively in the film, thus providing greater enhancement in the film rather than the carbon. The fact that an EGO film produced on GC yields consistently more intense SERS may imply that the film is thicker or that it promotes Ag particle nucleation.
ECP of HOPG was examined in greater detail to ascertain the nature of structural damage plus relation- ships between Raman and electrochemical effects. Freshly cleaved HOPG was then subjected to linear oxidation/ reduction scans between -0.1 and +1.95 V vs Ag/AgCl at 50 mV/s in 0.1 M KN03. For normal Raman spectra, the HOPG sample was removed from the KNO3 solution and spectra were obtained in air. SERS spectra were obtained after transfer to 0.1 M NaClO4/0.5 mM AgNOa and deposition of 0.21 pmol/cm2 of A$at a controlled current of 20 PA. Both normal and SERS spectra were acquired after varying numbers of oxidation reduction cycles (ORC), but each ECP and Raman experiment started with a fresh
SERS of Carbon Electrodes
- -1.4 - 1,
k-E-mlsL+ - ,,,,,‘“L -0
.
a. ._. . . - 4’” Normal
a
Langmuir, Vol. 7, No. 10,1991 2373
1.5
1.2
0.9 2 : 0.6 - 0.3
0.0
f J L 0 1
1200 1400 1600 1800
Raman Shift (cm-’) Figure 6. Normal Raman spectra obtained in air for HOPG following varying numbers of ORC’s in 0.1 M KNO,, -0.1 to +1.95 V vs Ag/AgCl.
HOPG surface. Treatment of HOPG with successive cyclic scans is similar to the protocol used by Bard et al.,l6J6 for GC and HOPG, and is more gradual than the ECP procedure originated by Engstrom et al.13
The normal Raman spectra shown in Figure 6 reveal several microstructural effects caused by ECP. One ORC to 1.95 V is sufficient to create a 1360-cm-l band, which increases gradually with further oxidation cycles. The effects on the E% band are more complex, with a 1620-cm-l band appearing initially and then merging with the 1582-cm-l band as the latter shifts upward in A i . The 1620-cm-l band has been attributed to “boundary layern graphite which occurs in intercalation compounds or when the graphite is delaminated.g*28 The upward shift in the 1582-cm-l band occurs when the graphite lattice is damaged, specifically as the in-plane microcrystallite size (La) is decreased.23 Thus the progression of Raman spectra with repeated ORC indicates increasing disorder, with the graphite layers separating and fragmenting during ECP. Note also that the eight cycle spectrum of Figure 6 cor- responds to the HOPG spectrum of Figure 4 and that subsequent ORC’s cause the valley between the D and Ezr bands to begin to fill in.
SERS spectra acquired after the same ECP procedure are shown in Figure 7. Although the spectra are quali- tatively similar to normal Raman, the D band intensity developsmore quickly and the SERS spectra indicate more disorder. Note that the appearance of the spectrum changes negligibly after the eight ORC cycle, implying that the EGO film changes little once the severe disorder exhibited in Figure 5 is reached. The results imply that eight ORC cycles are sufficient to negate the effects of the original carbon microstructure on the EGO film. The D/E$ integrated intensity ratio is plotted as a function of 0 C in Figure 8. The SERS ratio exhibits greater disorder with a smaller number of ORC’s, due to increased surface selectivity.
The voltammetry of Fe(CN)e3-I4- in 1 M KCl was examined following the same ECP procedure used for Figures 6-8. Figure 9 shows voltammograms obtained after the first through fourth ORC cycles. Following the second and third cycles, and possibly the first, two vol- tammetric couples are observed, one exhibiting a high ko and one low. After four cycles the high ko couple is
(28) Dreseelhaue, M. S.; Dreeselhaue, G. Adu. Phys. 1981,30, 139.
w
Potential (V v8 AgIAgCI)
Figure 9. Voltammetry of Fe(CN)&IC on HOPG basal plane following one to four ORC‘s. ECP was conducted in 0.1 M KNOa (as for Figures 6-8), then the electrolyte was replaced with Fe(CN)sS-/C in 1 M KCl. dominant. This behavior is similar, although more pro- nounced, than that observed for potentiostatic ECP in 0.1 M KN03.g*10 Two couples for a simple, le- redox system indicate spatial heterogeneity on a scale greater than
Alsmeyer and McCreery 2374 Langmuir, Vol. 7, No. 10, 1991 '
I D/E,,=0.20 I I
1200 1400 1600 1800
Raman Shift (cm-')
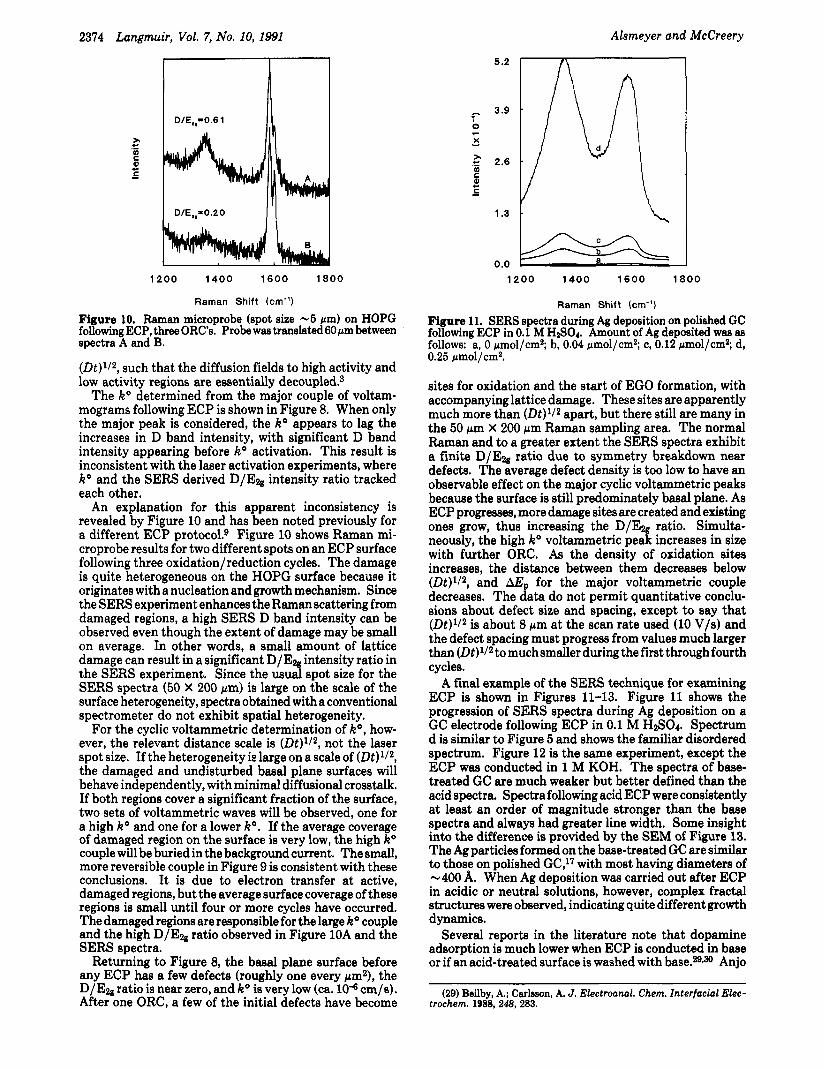
Figure 10. Raman microprobe (spot size -5 pm) on HOPG following ECP, three ORC's. Probe was translated 6 0 ~ m between spectra A and B.
(Dt)1/2, such that the diffusion fields to high activity and low activity regions are essentially decoupled?
The k" determined from the major couple of voltam- mograms following ECP is shown in Figure 8. When only the major peak is considered, the k" appears to lag the increases in D band intensity, with significant D band intensity appearing before ko activation. This result is inconsistent with the laser activation experiments, where k" and the SERS derived D/Ea intensity ratio tracked each other.
An explanation for this apparent inconsistency is revealed by Figure 10 and has been noted previously for a different ECP protocol.9 Figure 10 shows Raman mi- croprobe results for two different spots on an ECP surface following three oxidation/reduction cycles. The damage is quite heterogeneous on the HOPG surface because it originates with a nucleation and growth mechanism. Since the SERS experiment enhances the Raman scattering from damaged regions, a high SERS D band intensity can be observed even though the extent of damage may be small on average. In other words, a small amount of lattice damage can result in a significant D/Ezg intensity ratio in the SERS experiment. Since the usual spot size for the SERS spectra (50 X 200 pm) is large on the scale of the surface heterogeneity, spectra obtained with a conventional spectrometer do not exhibit spatial heterogeneity.
For the cyclic voltammetric determination of k", how- ever, the relevant distance scale is (Dt)'I2, not the laser spot size. If the heterogeneity is large on a scale of (Dt)'12, the damaged and undisturbed basal plane surfaces will behave independently, with minimal diffusional crosstalk. If both regions cover a significant fraction of the surface, two sets of voltammetric waves will be observed, one for a high k" and one for a lower k". If the average coverage of damaged region on the surface is very low, the high k" couple will be buried in the background current. The small, more reversible couple in Figure 9 is consistent with these conclusions. It is due to electron transfer at active, damaged regions, but the average surface coverage of these regions is small until four or more cycles have occurred. The damaged regions are responsible for the large ko couple and the high D/E2, ratio observed in Figure 10A and the SERS spectra.
Returning to Figure 8, the basal plane surface before any ECP has a few defects (roughly one every pmz), the D/Ea ratio is near zero, and k" is very low (ca. 1o-S cm/s). After one ORC, a few of the initial defects have become
5.2
- 3.9 0
X P - .- 5 2.6
5 c) C -
1.3
0.0 1200 1400 1600 1800
Raman Shift (cm-')
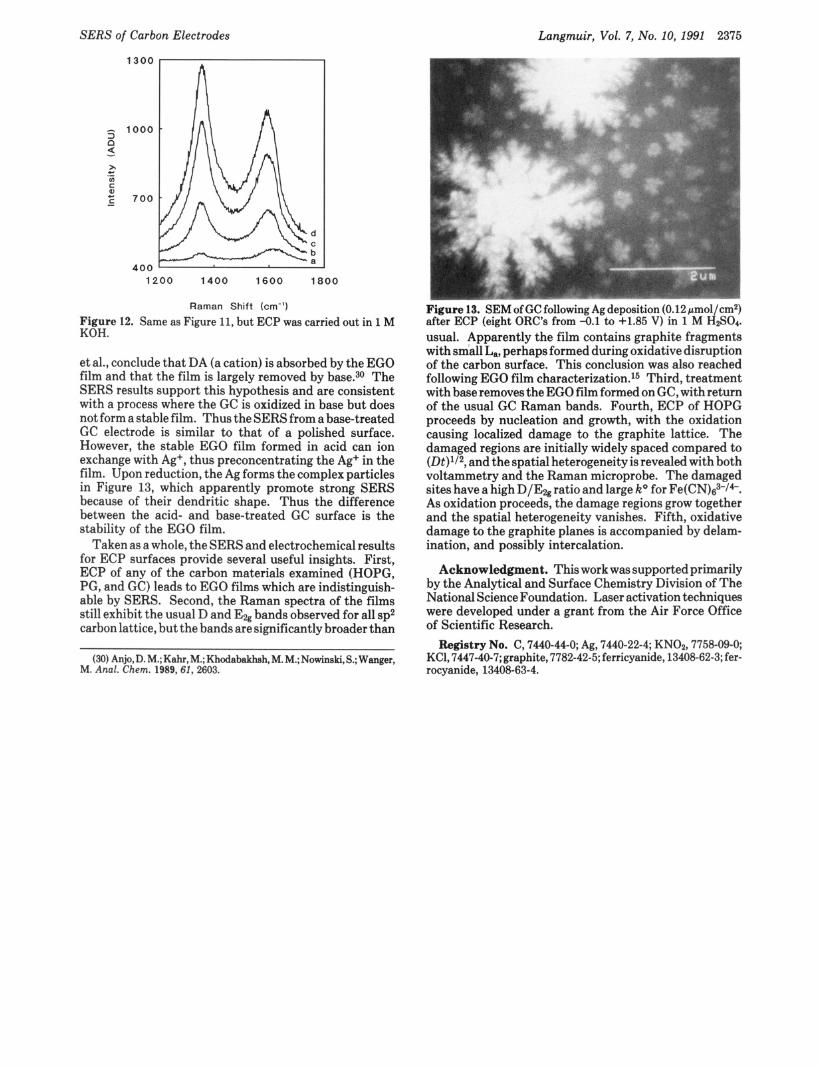
Figure 11. SERS spectra during Ag deposition on polished GC following ECP in 0.1 M H2S04. Amount of Ag deposited was as follows: a, 0 pmol/cm2; b, 0.04 pmol/cm2; c, 0.12 pmol/cm2; d, 0.25 Mmol/cm2.
sites for oxidation and the start of EGO formation, with accompanying lattice damage. These sites are apparently much more than (Dt)1/2 apart, but there still are many in the 50 pm X 200 pm Raman sampling area. The normal Raman and to a greater extent the SERS spectra exhibit a finite D /Ea ratio due to symmetry breakdown near defects. The average defect density is too low to have an observable effect on the major cyclic voltammetric peaks because the surface is still predominately basal plane. As ECP progresses, more damage sites are created and existing ones grow, thus increasing the D/Ea ratio. Simulta- neously, the high k" voltammetric peak increases in size with further ORC. As the density of oxidation sites increases, the distance between them decreases below (Dt)l12, and hE, for the major voltammetric couple decreases. The data do not permit quantitative conclu- sions about defect size and spacing, except to say that (Dt)l12 is about 8 pm at the scan rate used (10 V/s) and the defect spacing must progress from values much larger than (Dt)l12 to muchsmaller during the first through fourth cycles.
A final example of the SERS technique for examining ECP is shown in Figures 11-13. Figure 11 shows the progression of SERS spectra during Ag deposition on a GC electrode following ECP in 0.1 M HzSOr. Spectrum d is similar to Figure 5 and shows the familiar disordered spectrum. Figure 12 is the same experiment, except the ECP was conducted in 1 M KOH. The spectra of base- treated GC are much weaker but better defined than the acid spectra. Spectra following acid ECP were consistently at least an order of magnitude stronger than the base spectra and always had greater line width. Some insight into the difference is provided by the SEM of Figure 13. The Ag particles formed on the base-treated GC are similar to those on polished GC," with most having diameters of -400 A. When Ag deposition was carried out after ECP in acidic or neutral solutions, however, complex fractal structures were observed, indicating quite different growth dynamics.
Several reports in the literature note that dopamine adsorption is much lower when ECP is conducted in base or if an acid-treated surface is washed with b a ~ e . ~ * ~ O Anjo
(29) Beilby, A.; Carlason, A. J. Electroanal. Chem. Interfacial Elec- trochem. 1988, 248, 283.
SERS of Carbon Electrodes
1300 I i
Langmuir, Vol. 7, No. 10, 1991 2375
A
3 n a Y
1000
7 0 0
400 ' u
1200 1400 1600 1800
Raman Shift (cm-'1
Figure 12. Same as Figure 11, but ECP was carried out in 1 M KOH.
et al., conclude that DA (a cation) is absorbed by the EGO film and that the film is largely removed by base.30 The SERS results support this hypothesis and are consistent with a process where the GC is oxidized in base but does not form a stable film. Thus the SERS from a base-treated GC electrode is similar to that of a polished surface. However, the stable EGO film formed in acid can ion exchange with Ag+, thus preconcentrating the Ag+ in the film. Upon reduction, the Ag forms the complex particles in Figure 13, which apparently promote strong SERS because of their dendritic shape. Thus the difference between the acid- and base-treated GC surface is the stability of the EGO film.
Taken as a whole, the SERS and electrochemical results for ECP surfaces provide several useful insights. First, ECP of any of the carbon materials examined (HOPG, PG, and GC) leads to EGO films which are indistinguish- able by SERS. Second, the Raman spectra of the films still exhibit the usual D and Eag bands observed for all sp2 carbon lattice, but the bands are significantly broader than
(30) Anjo,D.M.;Kahr,M.;Khodabakhsh,M.M.;Nowinski,S.; Wanger, M. Anal. Chem. 1989,61, 2603.
Figure 13. SEM of GC following Ag deposition (0.12 pmol/cm2) after ECP (eight ORC's from -0.1 to +1.85 V) in 1 M H2S01. usual. Apparently the film contains graphite fragments with small La, perhaps formed during oxidative disruption of the carbon surface. This conclusion was also reached following EGO film characterization.l5 Third, treatment with base removes the EGO film formed on GC, with return of the usual GC Raman bands. Fourth, ECP of HOPG proceeds by nucleation and growth, with the oxidation causing localized damage to the graphite lattice. The damaged regions are initially widely spaced compared to (Dt)lI2, and the spatial heterogeneity is revealed with both voltammetry and the Raman microprobe. The damaged sites have a high D/EBg ratio and large lz" for Fe(CN)63-/4-. As oxidation proceeds, the damage regions grow together and the spatial heterogeneity vanishes. Fifth, oxidative damage to the graphite planes is accompanied by delam- ination, and possibly intercalation.
Acknowledgment. This work was supported primarily by the Analytical and Surface Chemistry Division of The National Science Foundation. Laser activation techniques were developed under a grant from the Air Force Office of Scientific Research. Registry No. C, 7440-44-0; Ag, 7440-22-4; KN02,7758-09-0;
KC1,7447-40-7; graphite, 7782-42-5; ferricyanide, 13408-62-3; fer- rocyanide, 13408-63-4.