Embed Size (px)
Citation preview

Gravity, magnetic, and electromagnetic methods are pri-mary exploration techniques used in kimberlite explorationto define a kimberlite pipe’s location and shape. Sometimesthese methods produce nonunique results because of weath-ering of the upper part of a kimberlite pipe and its consid-erable inhomogeneity. Complex pipe geometries andassociated faulting and fracturing may be very difficult toassess by potential-field methods. Application of seismicmethods in kimberlite exploration has been limited.
In sedimentary basins, however, kimberlite pipes arelikely to be a suitable target for the application of seismicreflection methods because of the difference in elastic prop-erties between the pipe material and the host rock. The draw-back of surface seismic methods is that they are not designedfor direct detection of vertical bodies such as a pipe. However,a kimberlite pipe may be inferred from seismic data indi-rectly by observing the termination of reflections against itsflanks. Such an approach can produce good results if the sed-imentary sequence is of moderate to high reflectivity.
Unfortunately, McArthur Basin sediments of theNorthern Territory in Australia are quite poor reflectors(Figure 1). The only reflecting horizon would probably bethe sandstone/black shale interface at 140 m. Near-surfaceconditions are also unfavorable for surface seismic becauseof a thick layer of bull dust, which causes poor geophonecoupling. Hence, very poor seismic data quality is typicalfor this area. In this study, instead of attempting a conven-
tional surface seismic reflection approach, we used modesgenerated by a kimberlite pipe to precisely determine its loca-tion. The single borehole imaging (SBI) method also was usedfor delineation of the kimberlite pipe shape at depth. By acombined analysis of P- and S-wave data recorded on thesurface and in downhole experiments, the pipe’s location,shape, and structure can be imaged.
Surface seismic reflection experiment. Two test sites were
756 THE LEADING EDGE JULY 2000 JULY 2000 THE LEADING EDGE 0000
Surface and borehole seismic methods todelineate kimberlite pipes in Australia
M. UROSEVIC and B. J. EVANS, Curtin University of Technology, Perth, Western Australia
Figure 2. Typical lithology of a kimberlite pipe.
Figure 1. Upper 5 m consists of bull dust and lateriticsheets with sandstone/siltstone down to 140 m, andthen shales thereafter.
Table 1. Parameters used in data acquisition.Receiver station interval: 3 mReceivers: single 28 Hz geophonesSource interval: 6 mSource depth: 6 m and 3 mSource charge size: 300 g and 150 gRecord length: 500 ms @ 0.5-ms sampling
intervalInstrument: 96 channel DAS-1, 24-bit
The length of the survey line was 600 m.

selected. One contained a broad cluster of small pipes alonga 1-km line, and the other was a known single pipe with awidth of 20 m. The typical lithology of a kimberlite in thisbasin is shown in Figure 2. The main objective of the reflec-tion experiment was to determine if seismic methods candetect such small-diameter pipes. The aim of the single bore-hole imaging experiment was to delineate the external pipeshape.
Only the results for the line recorded over the 20-m-widepipe are shown and discussed here because the same resultswere obtained in both cases. Detection of a narrow pipe dic-tated shorter geophone station spacing and small explosivecharges. The parameters listed in Table 1 were used in dataacquisition.
Data analysis. Data quality was generally poor. The noisetrain dominated the field records. Prominent shear headwaves, dispersive surface waves, guided waves, and rever-berations related to the shallow laterite layer dominated theshot records. However, highly altered and weathered pipematerial in the near surface had a strong effect on seismicwave propagation (Figure 3). Horizontally traveling seismicenergy excited additional waves in the pipe itself, whichcould be tube wavelike modes (Figure 4). For simplicity,waves generated within the pipe are referred to as pipemodes (PM). The apparent velocity of the most prominentpipe mode was about 500 m/s; the P- and S-head wavespropagated at relatively higher apparent velocities of 3300m/s and 1900 m/s, respectively. Most horizontally travel-ing seismic energy was converted to pipe modes. Thus, theposition of the pipe and its diameter could be precisely
defined by the low-velocity wave modes that apparentlyleaked very little energy from the outside of the pipe bound-aries (Figure 3).
The P- and S-head waves were used to construct 500-m-long refraction stacks (Figure 5). The position of the pipe isclearly seen on these sections. It also appears that an addi-tional narrow pipe (about 10 m in diameter) is present about100 m east of the known pipe location.
The presence of a pipe in reflection data may be easierto observe using various seismic attribute displays. Thestacked reflection data were migrated in depth and are shownin a Perigram display (high-pass filtered amplitude enve-lope of a seismic trace) in Figure 6. It is interesting to observethat the fresh kimberlite is seen in the P-wave data as areflection shadow zone. Exactly the opposite case is observedin the shear-wave data. In fact, the first shear reflection atthe pipe position appears at about 60 m, which correspondsto the top of the fresh kimberlite rock. Therefore, combinedanalysis of reflection P- and S-wave data, despite poor qual-ity, may provide useful information regarding the internal
0000 THE LEADING EDGE JULY 2000 JULY 2000 THE LEADING EDGE 757
Figure 5. Reflection stacks obtained by applying linearmoveout corrections to the P- and S-head waves usingappropriate refraction velocities. Stacked traces are dis-played at the midpoint of the source and receiver. Theknown pipe is indicated by the square. The questionmark indicates a possible narrow pipe.
Figure 4. Various wave types and generation of pipemodes.
Figure 3. Raw shot record over a known pipe, true-amplitude display. Most horizontally traveling seismicenergy is converted to pipe modes.
a) b)
Figure 6. Migrated depth sections, displayed in peri-gram form.
a) b)
structure of a kimberlite pipe and should be considered infuture exploration programs.
Single borehole experiment. Single borehole data wereacquired 50 m from a partially excavated larger diameterpipe. Ashuttle of four three-component geophones, clampeddownhole, and a shot cluster of four detonators placedbeneath the deepest geophone were used in the acquisition.Receiver spacing was 10 m; shot spacing was 5 m. Minimumand maximum offsets were 30 and 120 m. After the shot clus-ter was fired, the firing line was retrieved and reloaded/repo-sitioned, while the shuttle was raised to the next location.The borehole was profiled at 80-175 m. Average fold was six.In this manner, a pseudo 2-D survey was performed in theborehole. The objective was to image waves reflected fromthe pipe flanks. Figure 7 shows the crew experienced theNorthern Territory summer conditions with temperaturesreaching 50°C in the shade. Both the shot and receiver cablesare lowered in the same borehole.
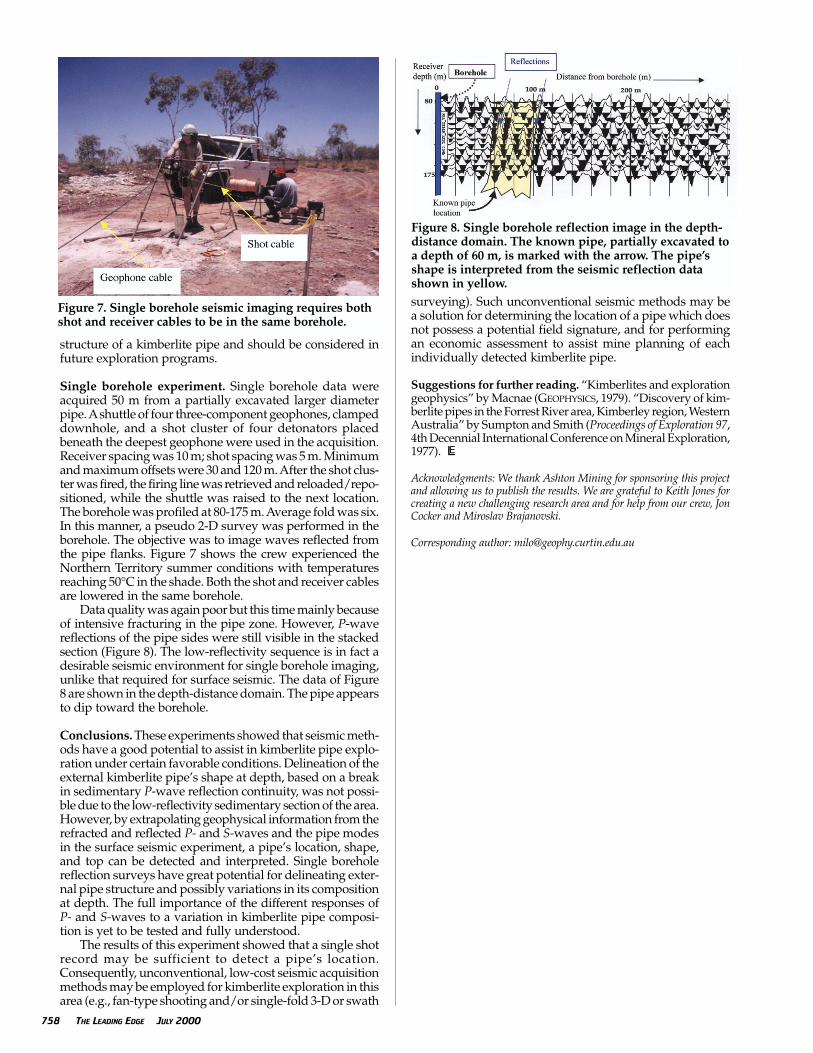
Data quality was again poor but this time mainly becauseof intensive fracturing in the pipe zone. However, P-wavereflections of the pipe sides were still visible in the stackedsection (Figure 8). The low-reflectivity sequence is in fact adesirable seismic environment for single borehole imaging,unlike that required for surface seismic. The data of Figure8 are shown in the depth-distance domain. The pipe appearsto dip toward the borehole.
Conclusions. These experiments showed that seismic meth-ods have a good potential to assist in kimberlite pipe explo-ration under certain favorable conditions. Delineation of theexternal kimberlite pipe’s shape at depth, based on a breakin sedimentary P-wave reflection continuity, was not possi-ble due to the low-reflectivity sedimentary section of the area.However, by extrapolating geophysical information from therefracted and reflected P- and S-waves and the pipe modesin the surface seismic experiment, a pipe’s location, shape,and top can be detected and interpreted. Single boreholereflection surveys have great potential for delineating exter-nal pipe structure and possibly variations in its compositionat depth. The full importance of the different responses ofP- and S-waves to a variation in kimberlite pipe composi-tion is yet to be tested and fully understood.
The results of this experiment showed that a single shotrecord may be sufficient to detect a pipe’s location.Consequently, unconventional, low-cost seismic acquisitionmethods may be employed for kimberlite exploration in thisarea (e.g., fan-type shooting and/or single-fold 3-D or swath
surveying). Such unconventional seismic methods may bea solution for determining the location of a pipe which doesnot possess a potential field signature, and for performingan economic assessment to assist mine planning of eachindividually detected kimberlite pipe.
Suggestions for further reading. “Kimberlites and explorationgeophysics” by Macnae (GEOPHYSICS, 1979). “Discovery of kim-berlite pipes in the Forrest River area, Kimberley region, WesternAustralia” by Sumpton and Smith (Proceedings of Exploration 97,4th Decennial International Conference on Mineral Exploration,1977). LE
Acknowledgments: We thank Ashton Mining for sponsoring this projectand allowing us to publish the results. We are grateful to Keith Jones forcreating a new challenging research area and for help from our crew, JonCocker and Miroslav Brajanovski.
Corresponding author: [email protected]
758 THE LEADING EDGE JULY 2000 JULY 2000 THE LEADING EDGE 0000
Figure 7. Single borehole seismic imaging requires bothshot and receiver cables to be in the same borehole.
Figure 8. Single borehole reflection image in the depth-distance domain. The known pipe, partially excavated toa depth of 60 m, is marked with the arrow. The pipe’sshape is interpreted from the seismic reflection datashown in yellow.