Embed Size (px)
Citation preview
1
Biophysical Journal, Volume 98
Supporting Material
Task-oriented modular decomposition of biological networks: trigger mechanism in blood coagulation
Mikhail A. Panteleev, Anna N. Balandina, Elena N. Lipets, Mikhail V. Ovanesov, and Fazoil I. Ataullakhanov
Supporting Information Task-oriented modular decomposition of biological networks:
trigger mechanism in blood coagulation
M.A. Panteleev, A.N. Balandina, E.N. Lipets, M.V. Ovanesov, and F.I. Ataullakhanov
Table of Contents
1. MODEL DESCRIPTION ............................................................................................................................................2
Notation ................................................................................................................................................................2
Model equations ...................................................................................................................................................2
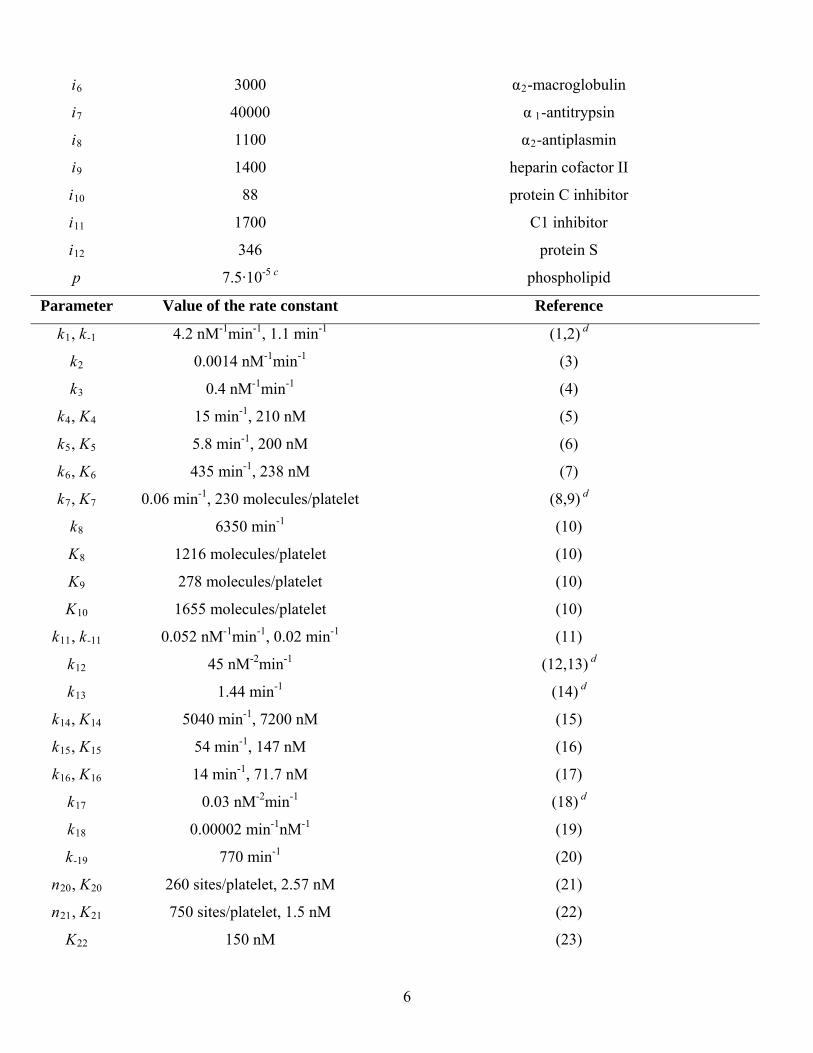
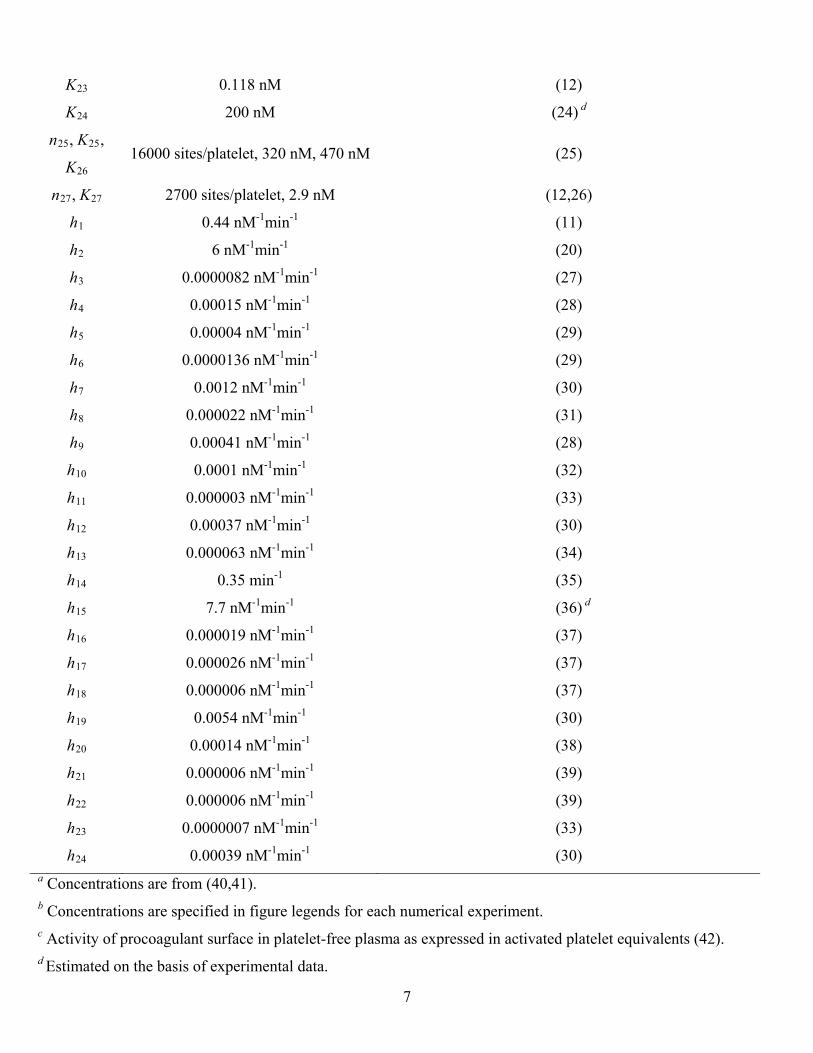
Table S1. Model parameters.................................................................................................................................5
Model assumptions and modification...................................................................................................................8
2. MODULAR DECOMPOSITION ..................................................................................................................................9
Task-oriented sensitivity and necessity analysis ..................................................................................................9
Table S2. Relative importance of coagulation system components......................................................................9
Sensitivity and necessity: possible errors in their estimation ............................................................................13
Comparison of the positive feedback loops of coagulation................................................................................14
3. MODEL REDUCTION.............................................................................................................................................15
Step A. Removal of non-essential variables and reactions.................................................................................15
Step B. Temporal hierarchy reduction ...............................................................................................................17
Table S3. Temporal hierarchy of variables in coagulation................................................................................20
4. PHASE PLANE ANALYSIS OF THE MODEL.............................................................................................................24
Check for a stable steady state existence and retention during the reduction ...................................................24
Analysis of the reduced "robusterized" model ...................................................................................................25
Analysis of the complete "robusterized" model ..................................................................................................27
REFERENCES............................................................................................................................................................31
1
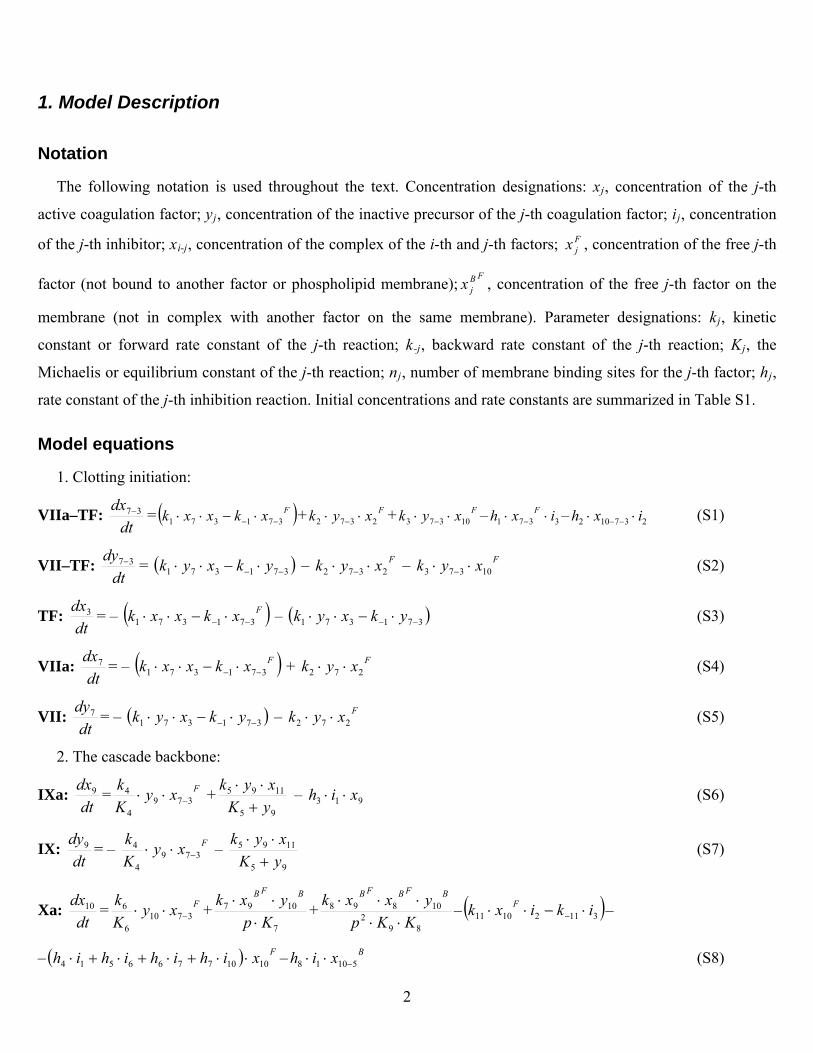
1. Model Description
Notation
The following notation is used throughout the text. Concentration designations: xj, concentration of the j-th
active coagulation factor; yj, concentration of the inactive precursor of the j-th coagulation factor; ij, concentration
of the j-th inhibitor; xi-j, concentration of the complex of the i-th and j-th factors; , concentration of the free j-th
factor (not bound to another factor or phospholipid membrane); , concentration of the free j-th factor on the
membrane (not in complex with another factor on the same membrane). Parameter designations: k
Fjx
FBjx
j, kinetic
constant or forward rate constant of the j-th reaction; k-j, backward rate constant of the j-th reaction; Kj, the
Michaelis or equilibrium constant of the j-th reaction; nj, number of membrane binding sites for the j-th factor; hj,
rate constant of the j-th inhibition reaction. Initial concentrations and rate constants are summarized in Table S1.
Model equations
1. Clotting initiation:
VIIa–TF: dt
dx 37 = Fxkxxk 371371 + + – – (S1) Fxyk 2372 Fxyk 10373 3371 ixh F 237102 ixh
VII–TF: dt
dy 37 = – – (S2) 371371 ykxyk Fxyk 2372 Fxyk 10373
TF: dt
dx3 = – Fxkxxk 371371 – 371371 ykxyk (S3)
VIIa: dt
dx7 = – Fxkxxk 371371 + (S4) Fxyk 272
VII: dt
dy7 = – – (S5) 371371 ykxyk Fxyk 272
2. The cascade backbone:
IXa: dt
dx9 = FxyKk
3794
4 +
95
1195
yKxyk
– 913 xih (S6)
IX: dt
dy9 = – FxyKk
3794
4 –
95
1195
yKxyk
(S7)
Xa: dt
dx10 = FxyKk
37106
6 +
7
1097
Kpyxk BFB
+
892
10898
KKpyxxk BFBFB
– 31121011 ikixk F –
– – (S8) Fxihihihih 10107766514 Bxih 51018
2
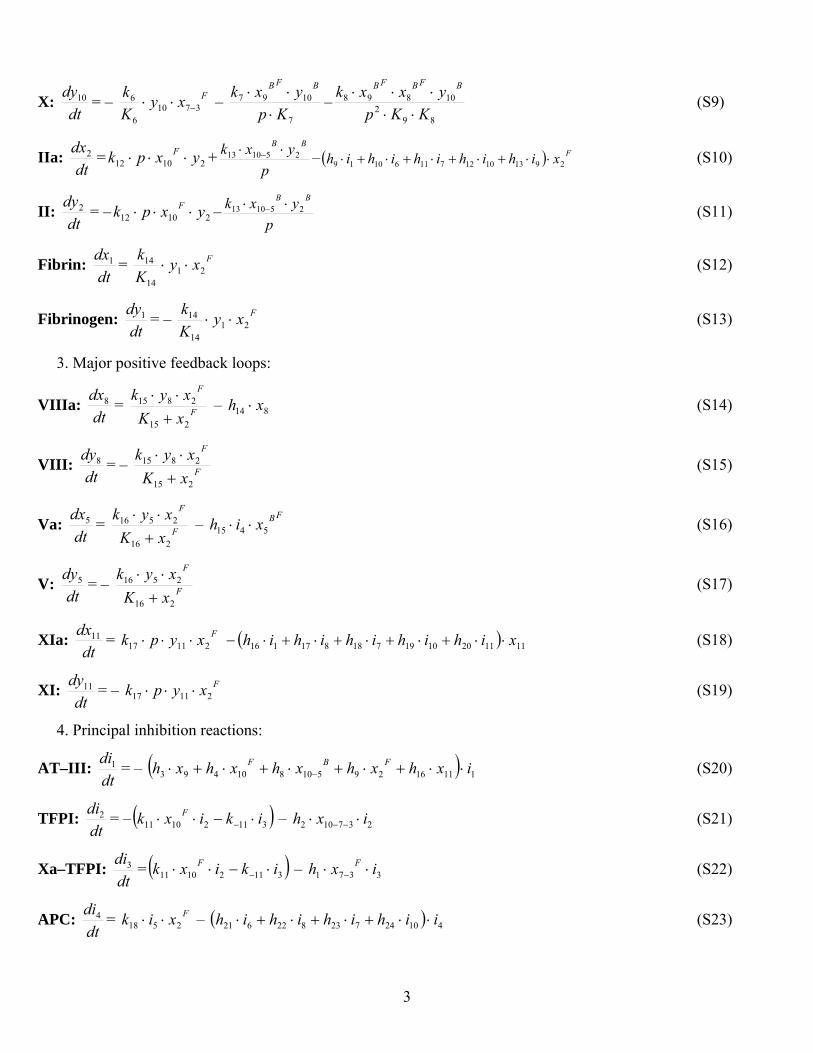
X: dt
dy10 = – FxyKk
37106
6 –
7
1097
Kpyxk BFB
–
892
10898
KKpyxxk BFBFB
(S9)
IIa: dt
dx2 = +21012 yxpk F p
yxk BB251013 – (S10) Fxihihihihih 2913101271161019
II: dt
dy2 = – –21012 yxpk F p
yxk BB251013 (S11)
Fibrin: dtdx1 = Fxy
Kk
2114
14 (S12)
Fibrinogen: dtdy1 = – Fxy
Kk
2114
14 (S13)
3. Major positive feedback loops:
VIIIa: dt
dx8 = F
F
xKxyk
215
2815
– (S14) 814 xh
VIII: dt
dy8 = – F
F
xKxyk
215
2815
(S15)
Va: dt
dx5 = F
F
xKxyk
216
2516
– (S16)
FBxih 5415
V: dt
dy5 = – F
F
xKxyk
216
2516
(S17)
XIa: dt
dx11 = Fxypk 21117 1111201019718817116 xihihihihih (S18)
XI: dt
dy11 = – (S19) Fxypk 21117
4. Principal inhibition reactions:
AT–III: dtdi1 = – 1111629510810493 ixhxhxhxhxh FBF (S20)
TFPI: dtdi2 = – 31121011 ikixk F – 237102 ixh (S21)
Xa–TFPI: dtdi3 = 31121011 ikixk F – (S22) 3371 ixh F
APC: dtdi4 = – Fxik 2518 41024723822621 iihihihih (S23)
3
PC: dtdi5 = – (S24) Fxik 2518
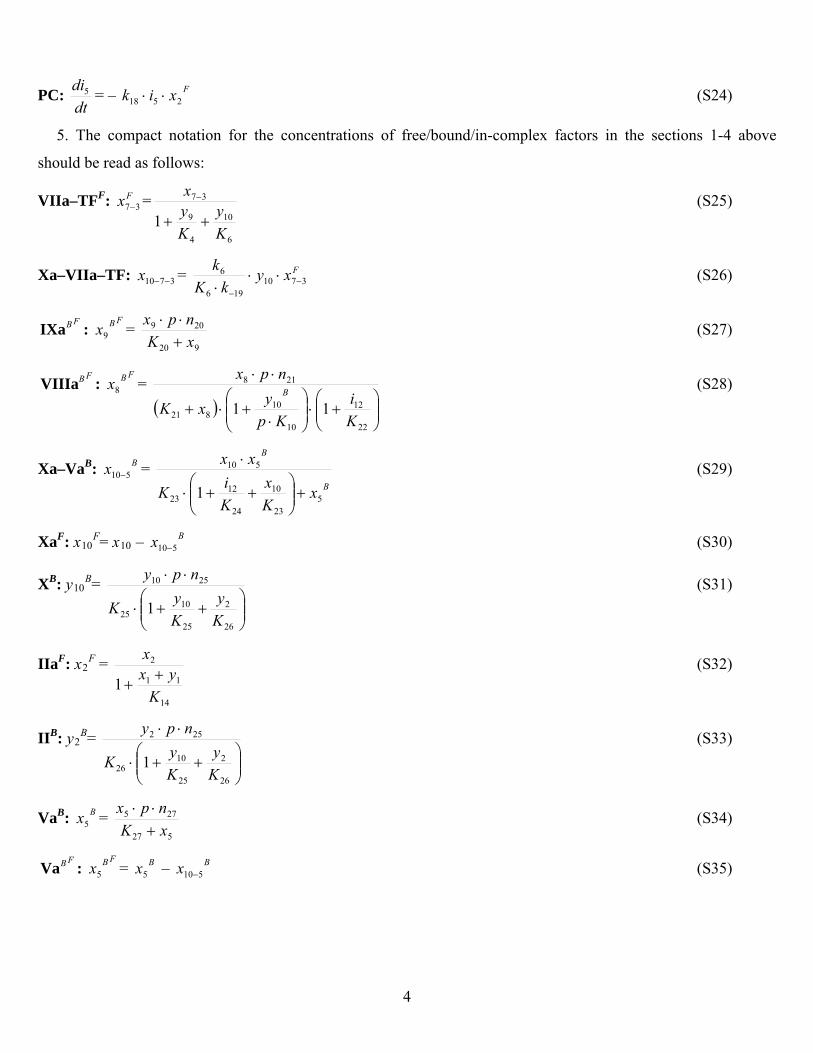
5. The compact notation for the concentrations of free/bound/in-complex factors in the sections 1-4 above
should be read as follows:
VIIa–TFF: =Fx 37
6
10
4
9
37
1Ky
Kyx
(S25)
Xa–VIIa–TF: = 3710 x FxykK
k3710
196
6
(S26)
FBIXa : = FBx9
920
209
xKnpx
(S27)
FBVIIIaFBx8: =
22
12
10
10821
218
11Ki
KpyxK
npxB
(S28)
Xa–VaB: = Bx 510B
B
xKx
KiK
xx
523
10
24
1223
510
1
(S29)
XaF: x10F= x10 – (S30) Bx 510
XB: y10B=
26
2
25
1025
2510
1Ky
KyK
npy (S31)
IIaF: x2F =
14
11
2
1K
yxx
(S32)
IIB: y2B=
26
2
25
1026
252
1Ky
KyK
npy (S33)
VaB: = Bx5527
275
xKnpx
(S34)
FBVa : = – (S35) FBx5
Bx5Bx 510
4
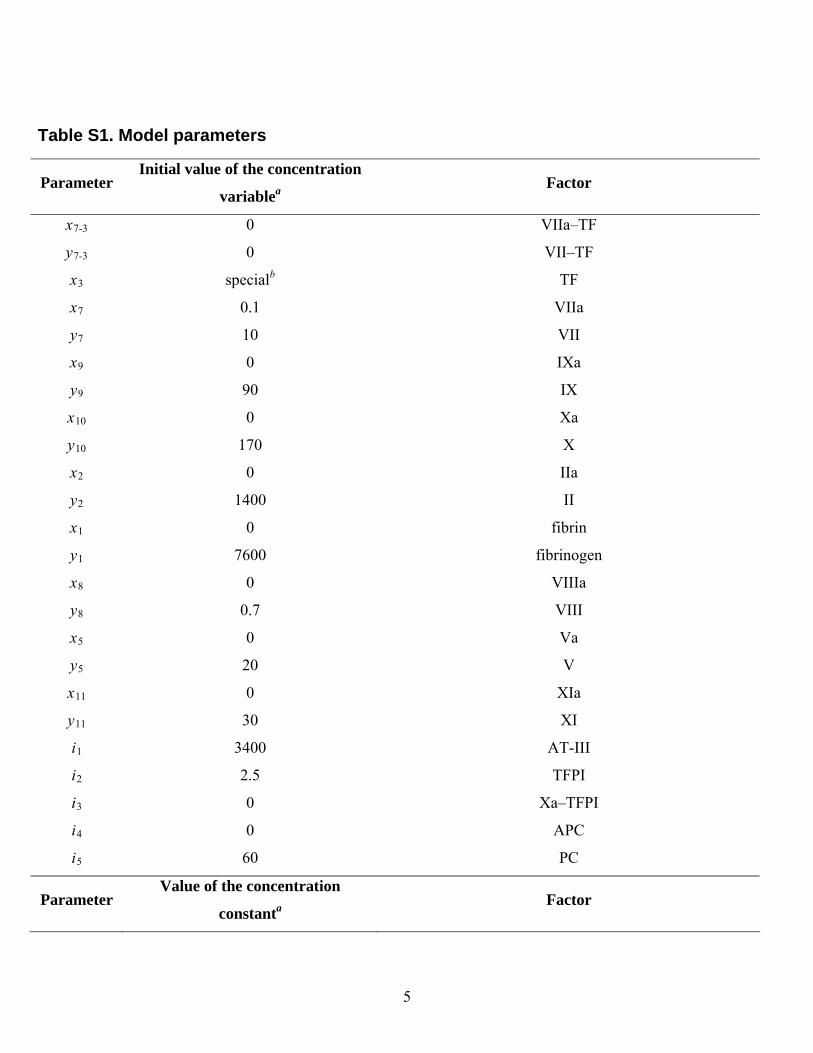
Table S1. Model parameters
Parameter Initial value of the concentration
variablea Factor
x7-3 0 VIIa–TF
y7-3 0 VII–TF
x3 specialb TF
x7 0.1 VIIa
y7 10 VII
x9 0 IXa
y9 90 IX
x10 0 Xa
y10 170 X
x2 0 IIa
y2 1400 II
x1 0 fibrin
y1 7600 fibrinogen
x8 0 VIIIa
y8 0.7 VIII
x5 0 Va
y5 20 V
x11 0 XIa
y11 30 XI
i1 3400 AT-III
i2 2.5 TFPI
i3 0 Xa–TFPI
i4 0 APC
i5 60 PC
Parameter Value of the concentration
constanta Factor
5
i6 3000 α2-macroglobulin
i7 40000 α 1-antitrypsin
i8 1100 α2-antiplasmin
i9 1400 heparin cofactor II
i10 88 protein C inhibitor
i11 1700 C1 inhibitor
i12 346 protein S
p 7.5·10-5 c phospholipid
Parameter Value of the rate constant Reference
k1, k-1 4.2 nM-1min-1, 1.1 min-1 (1,2) d
k2 0.0014 nM-1min-1 (3)
k3 0.4 nM-1min-1 (4)
k4, K4 15 min-1, 210 nM (5)
k5, K5 5.8 min-1, 200 nM (6)
k6, K6 435 min-1, 238 nM (7)
k7, K7 0.06 min-1, 230 molecules/platelet (8,9) d
k8
K8
K9
K10
6350 min-1
1216 molecules/platelet
278 molecules/platelet
1655 molecules/platelet
(10)
(10)
(10)
(10)
k11, k-11 0.052 nM-1min-1, 0.02 min-1 (11)
k12 45 nM-2min-1 (12,13) d
k13 1.44 min-1 (14) d
k14, K14 5040 min-1, 7200 nM (15)
k15, K15 54 min-1, 147 nM (16)
k16, K16 14 min-1, 71.7 nM (17)
k17 0.03 nM-2min-1 (18) d
k18 0.00002 min-1nM-1 (19)
k-19 770 min-1 (20)
n20, K20 260 sites/platelet, 2.57 nM (21)
n21, K21 750 sites/platelet, 1.5 nM (22)
K22 150 nM (23)
6
K23 0.118 nM (12)
K24 200 nM (24) d
n25, K25,
K26 16000 sites/platelet, 320 nM, 470 nM
n27 27 2700 sites/platelet, 2.9 nM (12,26)
0 (11)
0 (27)
0 (29)
0.00 in-1 (34)
0 (37)
0 (33) -1min-1 (30)
(25)
, K
h1 .44 nM-1min-1
h2 6 nM-1min-1 (20)
h3 .0000082 nM-1min-1
h4 0.00015 nM-1min-1 (28)
h5 0.00004 nM-1min-1 (29)
h6 .0000136 nM-1min-1
h7 0.0012 nM-1min-1 (30)
h8 0.000022 nM-1min-1 (31)
h9 0.00041 nM-1min-1 (28)
h10 0.0001 nM-1min-1 (32)
h11 0.000003 nM-1min-1 (33)
h12 0.00037 nM-1min-1 (30)
h13 0063 nM-1m
h14 0.35 min-1 (35)
h15 7.7 nM-1min-1 (36) d
h16 0.000019 nM-1min-1 (37)
h17 0.000026 nM-1min-1 (37)
h18 .000006 nM-1min-1
h19 0.0054 nM-1min-1 (30)
h20 0.00014 nM-1min-1 (38)
h21 0.000006 nM-1min-1 (39)
h22 0.000006 nM-1min-1 (39)
h23 .0000007 nM-1min-1
h24 0.00039 nMa Concentrations are from (40,41). b Concentrations are specified in figure legends for each numerical experiment. c Activity of procoagulant surface in platelet-free plasma as expressed in activated platelet equivalents (42). d Estimated on the basis of experimental data.
7
Model assumptions and modification
Principal model assumptions and their substantiation can be found in (42). Briefly, binding of all factors to
phospholipid membranes was assumed to be rapid within the fibrin formation timescale. In contrast, consumption
of α2-macroglobulin, α1-antitrypsin and some other inhibitors (Table S1) was assumed to be negligible over the
total course of clotting. Concentration of phospholipid membranes available for binding of coagulation factors in
platelet-free plasma and assumed to be mainly provided by platelet-derived microparticles was expressed in
activated platelet equivalents (42). The model of membrane-dependent factor X activation by intrinsic tenase was
incorporated from (10); the model of factor X activation by extrinsic tenase and of the TFPI pathway was from
(20).
Of particular importance to this study is assumption that fibrin clot optical density (the system outcome
observed experimentally) is directly related to the concentration of generated fibrin (the system outcome obtained
from the model). This assumption is substantiated by the reports that fibrin polymerization is rapid (43), that clot
optical density is proportional to fibrin concentration (44), and, in contrast to fibrin clot architecture, does not
depend on polymerization kinetics or thrombin concentration (45). However, a care should be exercised when
comparing computer simulation results with experiments at very low fibrin concentrations that might be below the
minimal concentration required for polymerization (46).
For the purposes of this study, the model of (42) was modified as follows: a) thrombomodulin and platelets were
removed from the model, because these components were absent in our experimental design; b) several kinetic
constants were changed to bring the model in accordance with the used experimental conditions, such as rate
constants for the factor X activation by extrinsic tenase assembled on recombinant TF instead of fibroblasts; c)
ordinary differential equations were used instead of partial ones, because of the homogeneous experimental design
instead of the reaction-diffusion system.
It is essential to note that this model has already been subjected to some explicit and implicit reduction.
Formation of all enzyme-substrate complexes (a total of 16) was assumed to be rapid within the characteristic
timescale of fibrin clot formation, as well as platelet binding of proteins (a total of 13); concentrations of all
stoichiometric inhibitors except for AT-III and TFPI (a total of 7) were assumed to be well in excess and thus
constant (42). Some components and processes (thrombomodulin, platelet activation, and others) not present in the
experimental system studied in this work were excluded. Thus, the actual initial number of species in the network
approached one hundred.
8
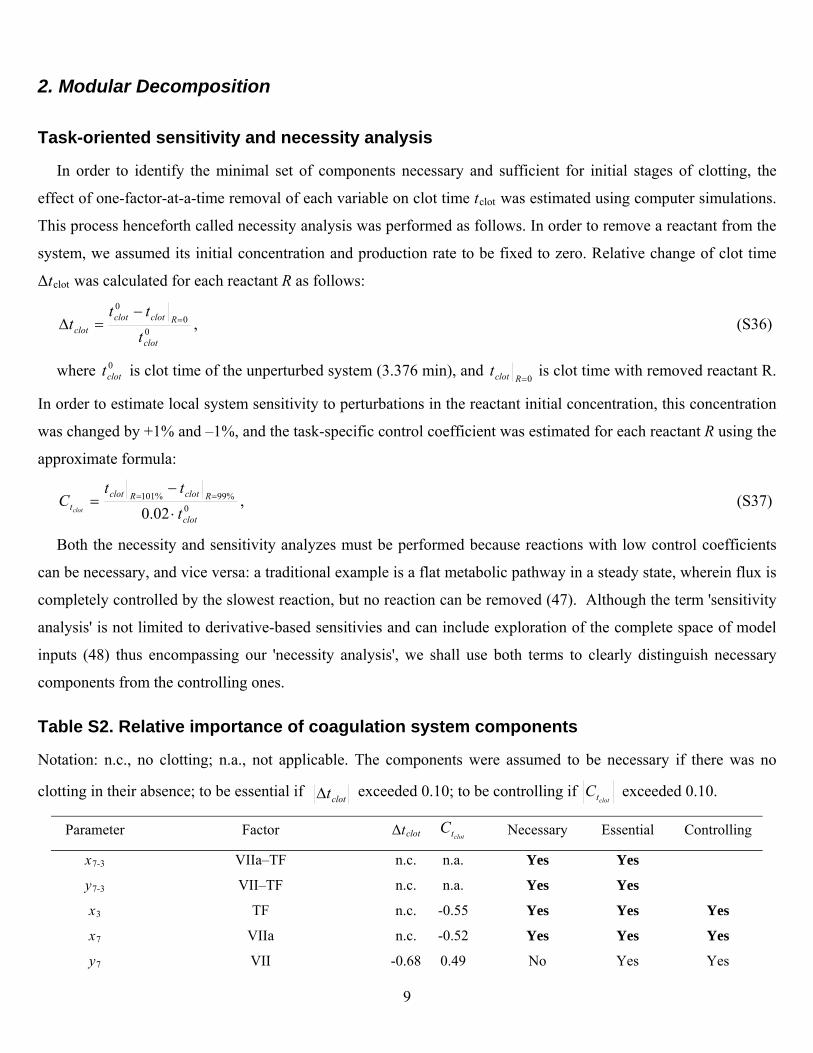
2. Modular Decomposition
Task-oriented sensitivity and necessity analysis
In order to identify the minimal set of components necessary and sufficient for initial stages of clotting, the
effect of one-factor-at-a-time removal of each variable on clot time tclot was estimated using computer simulations.
This process henceforth called necessity analysis was performed as follows. In order to remove a reactant from the
system, we assumed its initial concentration and production rate to be fixed to zero. Relative change of clot time
Δtclot was calculated for each reactant R as follows:
00
0
clot
Rclotclotclot t
ttt
, (S36)
where is clot time of the unperturbed system (3.376 min), and 0clott
0Rclott is clot time with removed reactant R.
In order to estimate local system sensitivity to perturbations in the reactant initial concentration, this concentration
was changed by +1% and –1%, and the task-specific control coefficient was estimated for each reactant R using the
approximate formula:
0%99%101
02.0 clot
RclotRclott t
ttC
clot
, (S37)
Both the necessity and sensitivity analyzes must be performed because reactions with low control coefficients
can be necessary, and vice versa: a traditional example is a flat metabolic pathway in a steady state, wherein flux is
completely controlled by the slowest reaction, but no reaction can be removed (47). Although the term 'sensitivity
analysis' is not limited to derivative-based sensitivies and can include exploration of the complete space of model
inputs (48) thus encompassing our 'necessity analysis', we shall use both terms to clearly distinguish necessary
components from the controlling ones.
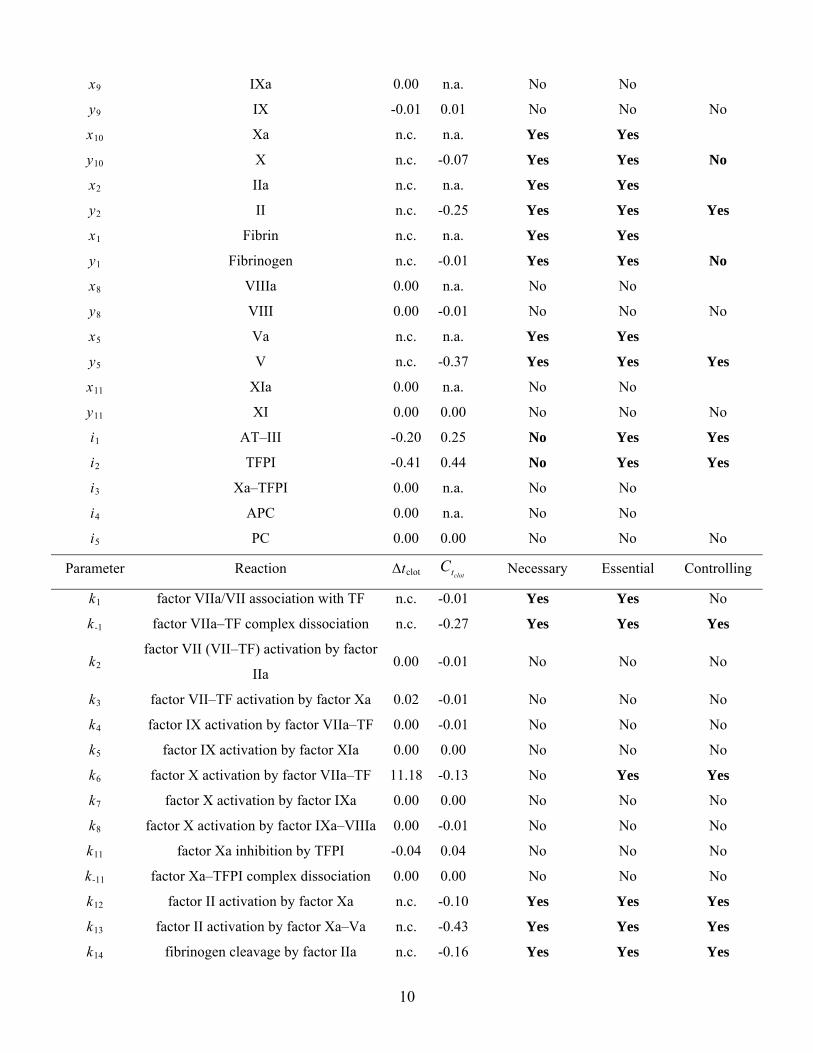
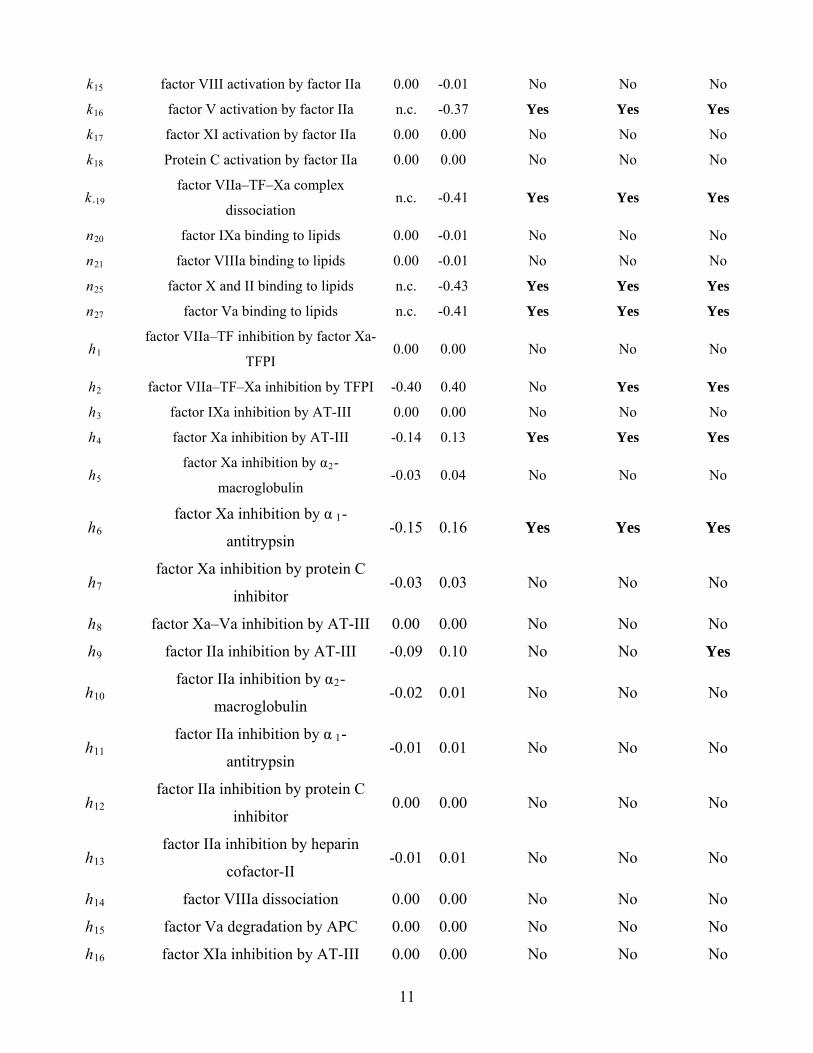
Table S2. Relative importance of coagulation system components
Notation: n.c., no clotting; n.a., not applicable. The components were assumed to be necessary if there was no
clotting in their absence; to be essential if clott exceeded 0.10; to be controlling if clottC exceeded 0.10.
Parameter Factor Δtclot clottC Necessary Essential Controlling
x7-3 VIIa–TF n.c. n.a. Yes Yes
y7-3 VII–TF n.c. n.a. Yes Yes
x3 TF n.c. -0.55 Yes Yes Yes
x7 VIIa n.c. -0.52 Yes Yes Yes
y7 VII -0.68 0.49 No Yes Yes
9
x9 IXa 0.00 n.a. No No
y9 IX -0.01 0.01 No No No
x10 Xa n.c. n.a. Yes Yes
y10 X n.c. -0.07 Yes Yes No
x2 IIa n.c. n.a. Yes Yes
y2 II n.c. -0.25 Yes Yes Yes
x1 Fibrin n.c. n.a. Yes Yes
y1 Fibrinogen n.c. -0.01 Yes Yes No
x8 VIIIa 0.00 n.a. No No
y8 VIII 0.00 -0.01 No No No
x5 Va n.c. n.a. Yes Yes
y5 V n.c. -0.37 Yes Yes Yes
x11 XIa 0.00 n.a. No No
y11 XI 0.00 0.00 No No No
i1 AT–III -0.20 0.25 No Yes Yes
i2 TFPI -0.41 0.44 No Yes Yes
i3 Xa–TFPI 0.00 n.a. No No
i4 APC 0.00 n.a. No No
i5 PC 0.00 0.00 No No No
Parameter Reaction Δtclot clottC Necessary Essential Controlling
k1 factor VIIa/VII association with TF n.c. -0.01 Yes Yes No
k-1 factor VIIa–TF complex dissociation n.c. -0.27 Yes Yes Yes
k2 factor VII (VII–TF) activation by factor
IIa 0.00 -0.01 No No No
k3 factor VII–TF activation by factor Xa 0.02 -0.01 No No No
k4 factor IX activation by factor VIIa–TF 0.00 -0.01 No No No
k5 factor IX activation by factor XIa 0.00 0.00 No No No
k6 factor X activation by factor VIIa–TF 11.18 -0.13 No Yes Yes
k7 factor X activation by factor IXa 0.00 0.00 No No No
k8 factor X activation by factor IXa–VIIIa 0.00 -0.01 No No No
k11 factor Xa inhibition by TFPI -0.04 0.04 No No No
k-11 factor Xa–TFPI complex dissociation 0.00 0.00 No No No
k12 factor II activation by factor Xa n.c. -0.10 Yes Yes Yes
k13 factor II activation by factor Xa–Va n.c. -0.43 Yes Yes Yes
k14 fibrinogen cleavage by factor IIa n.c. -0.16 Yes Yes Yes
10
k15 factor VIII activation by factor IIa 0.00 -0.01 No No No
k16 factor V activation by factor IIa n.c. -0.37 Yes Yes Yes
k17 factor XI activation by factor IIa 0.00 0.00 No No No
k18 Protein C activation by factor IIa 0.00 0.00 No No No
k-19 factor VIIa–TF–Xa complex
dissociation n.c. -0.41 Yes Yes Yes
n20 factor IXa binding to lipids 0.00 -0.01 No No No
n21 factor VIIIa binding to lipids 0.00 -0.01 No No No
n25 factor X and II binding to lipids n.c. -0.43 Yes Yes Yes
n27 factor Va binding to lipids n.c. -0.41 Yes Yes Yes
h1 factor VIIa–TF inhibition by factor Xa-
TFPI 0.00 0.00 No No No
h2 factor VIIa–TF–Xa inhibition by TFPI -0.40 0.40 No Yes Yes
h3 factor IXa inhibition by AT-III 0.00 0.00 No No No
h4 factor Xa inhibition by AT-III -0.14 0.13 Yes Yes Yes
h5 factor Xa inhibition by α2-
macroglobulin -0.03 0.04
a
7
h8 fact -III 0.00 0.00 No No No
9 factor I AT-III Yes
10
h11 factor IIa inhibition by α 1-
-0.01 0.01 No No No
h12 factor IIa i protein C
0.00 0.00 No No No
13
h14 0.00 0.00 No No No
15 factor Va degradation by APC
fa I
No No No
h6 factor Xa inhibition by α 1-
ntitrypsin-0.15 0.16 Yes Yes Yes
h factor Xa inhibition by protein C
inhibitor -0.03 0.03 No No No
or Xa–Va inhibition by AT
Ia inhibition by h -0.09 0.10 No No
h factor IIa inhibition by α2-
macroglobulin -0.02 0.01 No No No
antitrypsin
nhibition by
inhibitor
h factor IIa inhibition by heparin
cofactor-II -0.01 0.01 No No No
factor VIIIa dissociation
h 0.00 0.00 No No No
h16 ctor XIa inhibition by AT-II 0.00 0.00 No No No
11
h17 factor XIa inhibition by α2-
0.00 0.00 No No No
factor XIa inhibition by α 1-
fa
h22 APC inhibition by α2-antiplasmin 0.00 0.00 No No No
No
antiplasmin
h18 antitrypsin
0.00 0.00 No No No
h19 factor XIa inhibition by protein C
inhibitor 0.00 0.00 No No No
h20 ctor XIa inhibition by C1 inhibitor 0.00 0.00 No No No
h21 APC inhibition by α2-macroglobulin 0.00 0.00 No No No
h23 APC inhibition by α 1-antitrypsin 0.00 0.00 No No No
h24 APC inhibition by protein C inhibitor 0.00 0.00 No No
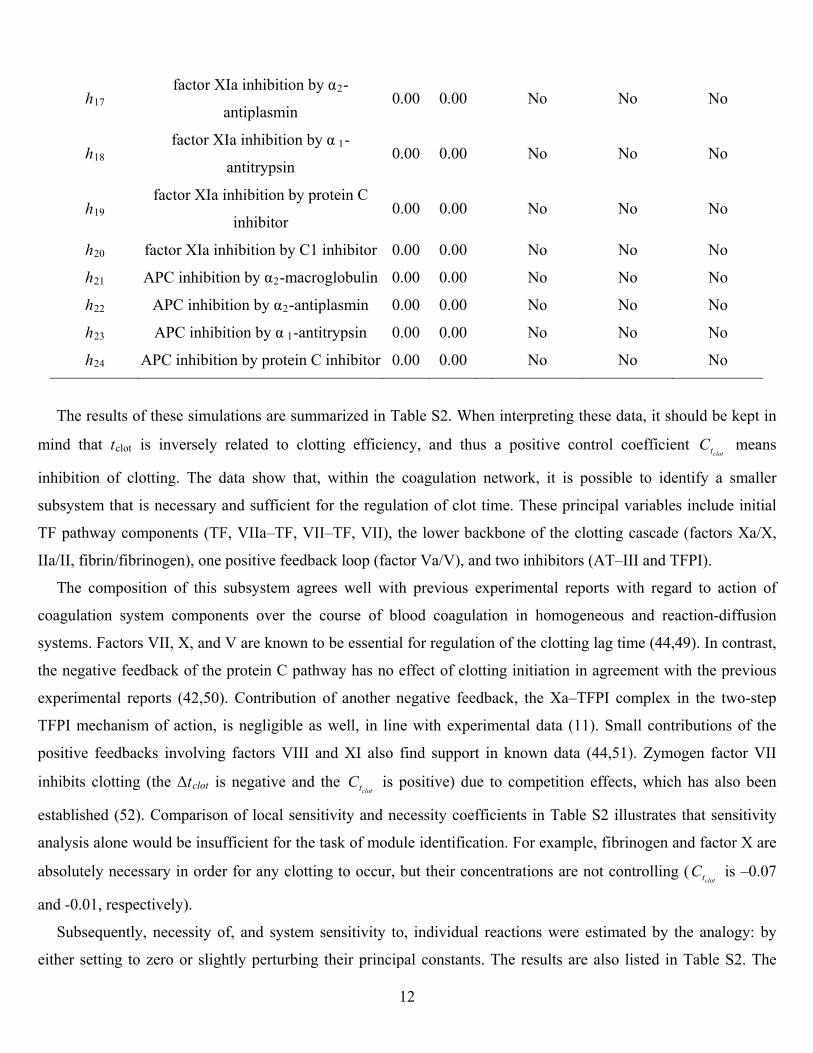
The results of these simulations are summarized in Table S2. When interpreting these data, it should be kept in
mind that tclot is inversely related to clotting efficiency, and thus a positive control coefficient clottC means
inhibition of clotting. The data show that, within the coagulation network, it is possible to identify a smaller
su
as a
ison of local sensitiv sity coefficients in Table S2 illustrates that sensitivity
an
ipal . The results are also listed in Table S2. The
bsystem that is necessary and sufficient for the regulation of clot time. These principal variables include initial
TF pathway components (TF, VIIa–TF, VII–TF, VII), the lower backbone of the clotting cascade (factors Xa/X,
IIa/II, fibrin/fibrinogen), one positive feedback loop (factor Va/V), and two inhibitors (AT–III and TFPI).
The composition of this subsystem agrees well with previous experimental reports with regard to action of
coagulation system components over the course of blood coagulation in homogeneous and reaction-diffusion
systems. Factors VII, X, and V are known to be essential for regulation of the clotting lag time (44,49). In contrast,
the negative feedback of the protein C pathway has no effect of clotting initiation in agreement with the previous
experimental reports (42,50). Contribution of another negative feedback, the Xa–TFPI complex in the two-step
TFPI mechanism of action, is negligible as well, in line with experimental data (11). Small contributions of the
positive feedbacks involving factors VIII and XI also find support in known data (44,51). Zymogen factor VII
inhibits clotting (the Δtclot is negative and the clottC is positive) due to competition effects, which h lso been
established (52). Compar ity and neces
alysis alone would be insufficient for the task of module identification. For example, fibrinogen and factor X are
absolutely necessary in order for any clotting to occur, but their concentrations are not controlling (clottC is –0.07
and -0.01, respectively).
Subsequently, necessity of, and system sensitivity to, individual reactions were estimated by the analogy: by
either setting to zero or slightly perturbing their princ constants
12
ge
atio
or Xa (k3, Δtclot=0.02, =–0.01) has no
eff
. There is no existing experimental evidence to validate this
As an additional control, we carried out sensitivity analysis simulations using 10% and 50% changes instead of
1%; th
n conditions, first of all the level of
in
if coagulati
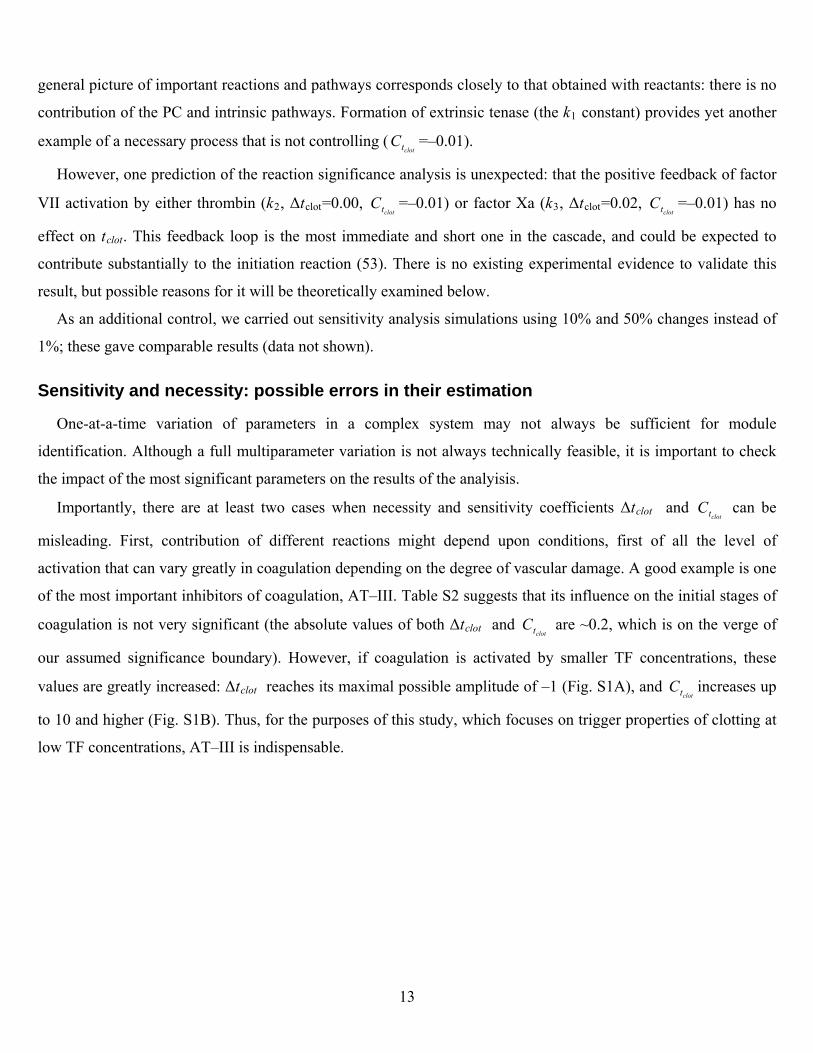
values are greatly increased: Δtclot reaches its maximal possible amplitude ig. S1A), and es up
to 10 and higher (Fig. S1B). Thus, for the purposes of this study, which focuses on trigger properties of clotting at
low TF concentrations, AT–III is indispensable.
neral picture of important reactions and pathways corresponds closely to that obtained with reactants: there is no
contribution of the PC and intrinsic pathways. Form n of extrinsic tenase (the k1 constant) provides yet another
example of a necessary process that is not controlling (clottC =–0.01).
However, one prediction of the reaction significance analysis is unexpected: that the positive feedback of factor
VII activation by either thrombin (k2, Δtclot=0.00, clottC =–0.01) or fact
clottC
ect on tclot. This feedback loop is the most immediate and short one in the cascade, and could be expected to
contribute substantially to the initiation reaction (53)
result, but possible reasons for it will be theoretically examined below.
ese gave comparable results (data not shown).
Sensitivity and necessity: possible errors in their estimation
One-at-a-time variation of parameters in a complex system may not always be sufficient for module
identification. Although a full multiparameter variation is not always technically feasible, it is important to check
the impact of the most significant parameters on the results of the analyisis.
Importantly, there are at least two cases when necessity and sensitivity coefficients Δtclot and clottC can be
misleading. First, contribution of different reactions might depend upo
activation that can vary greatly in coagulation depending on the degree of vascular damage. A good example is one
of the most important inhibitors of coagulation, AT–III. Table S2 suggests that its influence on the ial stages of
coagulation is not very significant (the absolute values of both Δt
it
TF concentrations, these
increas
clot and clottC are ~0.2, which is on the verge of
our assumed significance boundary). However, on is activated by smaller
of –1 (FclottC
13
0.1 1 10 100-1.0
-0.8
-0.6
-0.4
-0.2
0.0
A
t cl
ot
TF (pM)
0.1 1 10 100
0.1
1
10 B
Ct cl
ot
TF (pM)
Fig. S1. Importance of AT–III as a function of activation. Necessity (A) and sensitivity (B) coefficients for AT–III were calculated as described in the legend to Table S2 except that simulations were performed for a wide range of TF
concentrations. The parameters Δtclot (■) and (□) are shown as functions of TF. clottC
Another possible error can be caused by that several reactions may independently function to achieve the same
goal. Each such reaction could be easily dispensable individually, but an attempt to remove all these "insignificant"
reactions simultaneously could result in erroneous result. A simple example is inhibition of factor Xa carried out by
numerous inhibitors. As can be seen from Table S2, each of these reactions has little control alone: AT-III, 0.13;
α2-macroglobulin, 0.04; α 1-antitrypsin, 0.16; protein C inhibitor, 0.03. Yet, together they form a major regulation.
Comparison of the positive feedback loops of coagulation
An essential issue to address is difference between contributions of positive feedback loops. Among the four
major positive feedbacks of the clotting system (that is, activation of factors V, VII, VIII, and XI), factor V
activation is the only one playing any role in the regulation of the initial stages of coagulation. While
necessity/sensitivity analysis provides this result, additional steps should be taken to explain it.
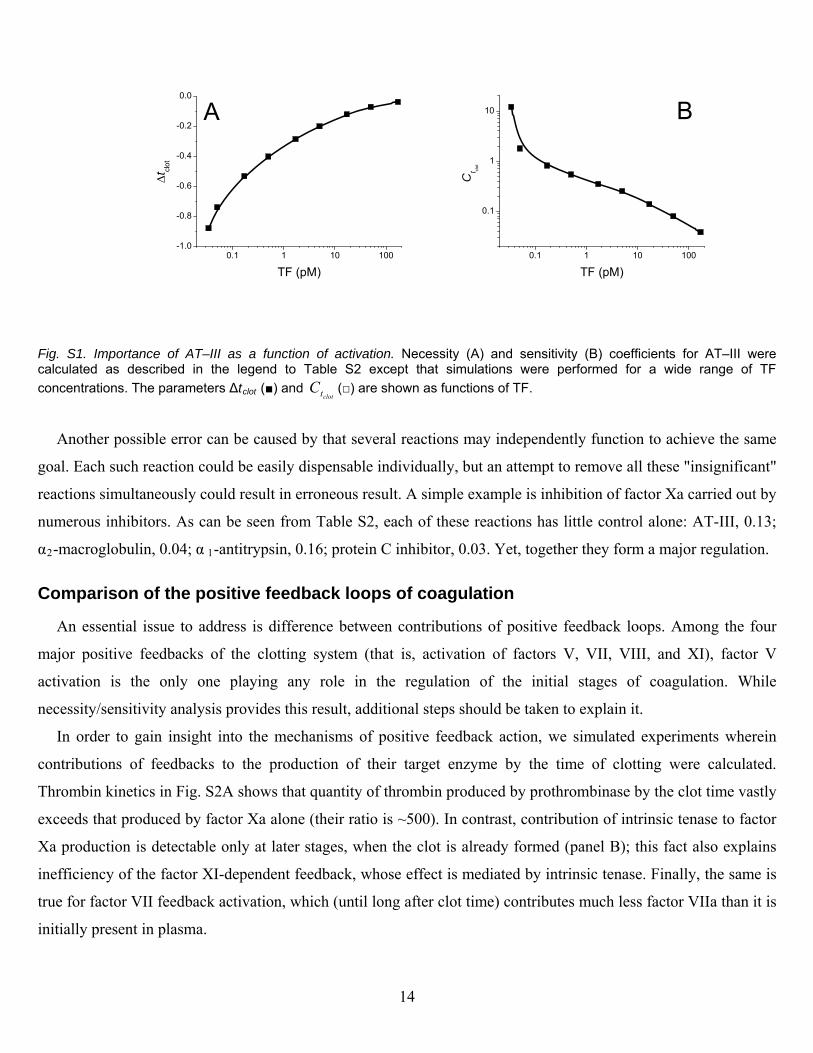
In order to gain insight into the mechanisms of positive feedback action, we simulated experiments wherein
contributions of feedbacks to the production of their target enzyme by the time of clotting were calculated.
Thrombin kinetics in Fig. S2A shows that quantity of thrombin produced by prothrombinase by the clot time vastly
exceeds that produced by factor Xa alone (their ratio is ~500). In contrast, contribution of intrinsic tenase to factor
Xa production is detectable only at later stages, when the clot is already formed (panel B); this fact also explains
inefficiency of the factor XI-dependent feedback, whose effect is mediated by intrinsic tenase. Finally, the same is
true for factor VII feedback activation, which (until long after clot time) contributes much less factor VIIa than it is
initially present in plasma.
14
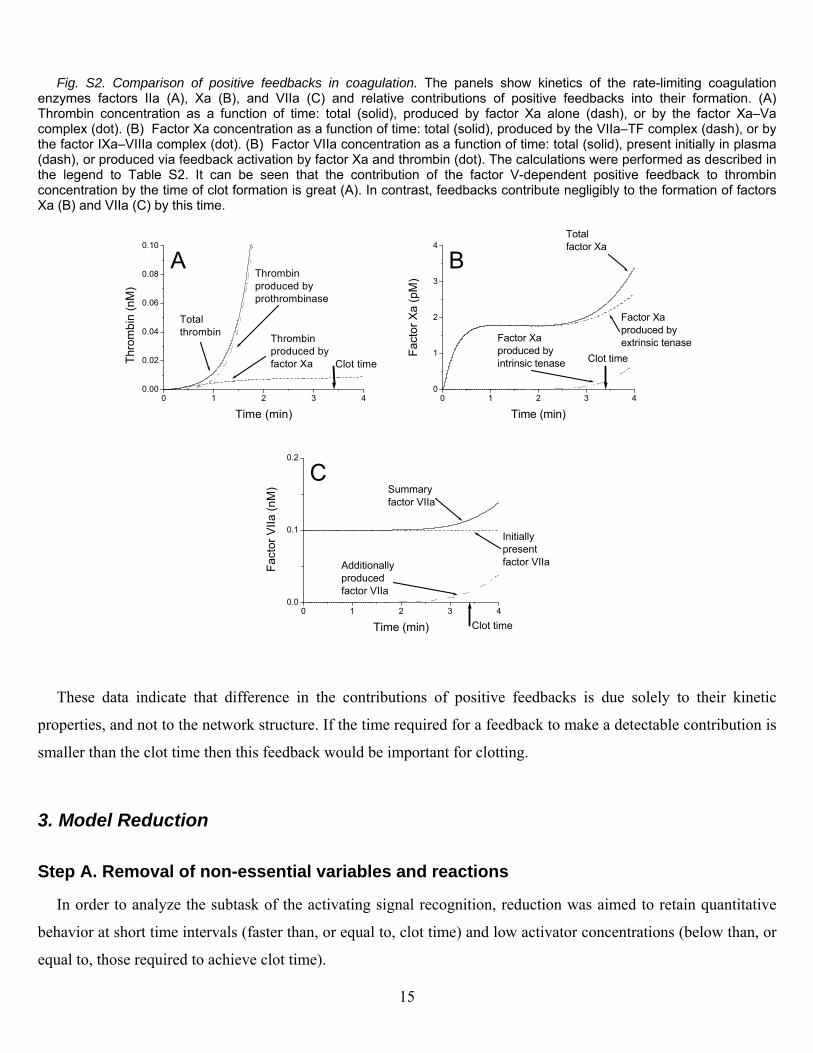
Fig. S2. Comparison of positive feedbacks in coagulation. The panels show kinetics of the rate-limiting coagulation enzymes factors IIa (A), Xa (B), and VIIa (C) and relative contributions of positive feedbacks into their formation. (A) Thrombin concentration as a function of time: total (solid), produced by factor Xa alone (dash), or by the factor Xa–Va complex (dot). (B) Factor Xa concentration as a function of time: total (solid), produced by the VIIa–TF complex (dash), or by the factor IXa–VIIIa complex (dot). (B) Factor VIIa concentration as a function of time: total (solid), present initially in plasma (dash), or produced via feedback activation by factor Xa and thrombin (dot). The calculations were performed as described in the legend to Table S2. It can be seen that the contribution of the factor V-dependent positive feedback to thrombin concentration by the time of clot formation is great (A). In contrast, feedbacks contribute negligibly to the formation of factors Xa (B) and VIIa (C) by this time.
0 1 2 3 40.00
0.02
0.04
0.06
0.08
0.10
A
Clot time
Thrombinproduced byfactor Xa
Thrombinproduced byprothrombinase
Totalthrombin
Thr
ombi
n (n
M)
Time (min)
0 1 2 3 40
1
2
3
4
B
Clot time
Factor Xaproduced byintrinsic tenase
Factor Xaproduced byextrinsic tenase
Totalfactor Xa
Fa
cto
r X
a (
pM
)Time (min)
0 1 2 3 40.0
0.1
0.2
C
Clot time
Additionallyproducedfactor VIIa
Initiallypresentfactor VIIa
Summaryfactor VIIa
Fac
tor
VII
a (n
M)
Time (min)
These data indicate that difference in the contributions of positive feedbacks is due solely to their kinetic
properties, and not to the network structure. If the time required for a feedback to make a detectable contribution is
smaller than the clot time then this feedback would be important for clotting.
3. Model Reduction
Step A. Removal of non-essential variables and reactions
In order to analyze the subtask of the activating signal recognition, reduction was aimed to retain quantitative
behavior at short time intervals (faster than, or equal to, clot time) and low activator concentrations (below than, or
equal to, those required to achieve clot time).
15
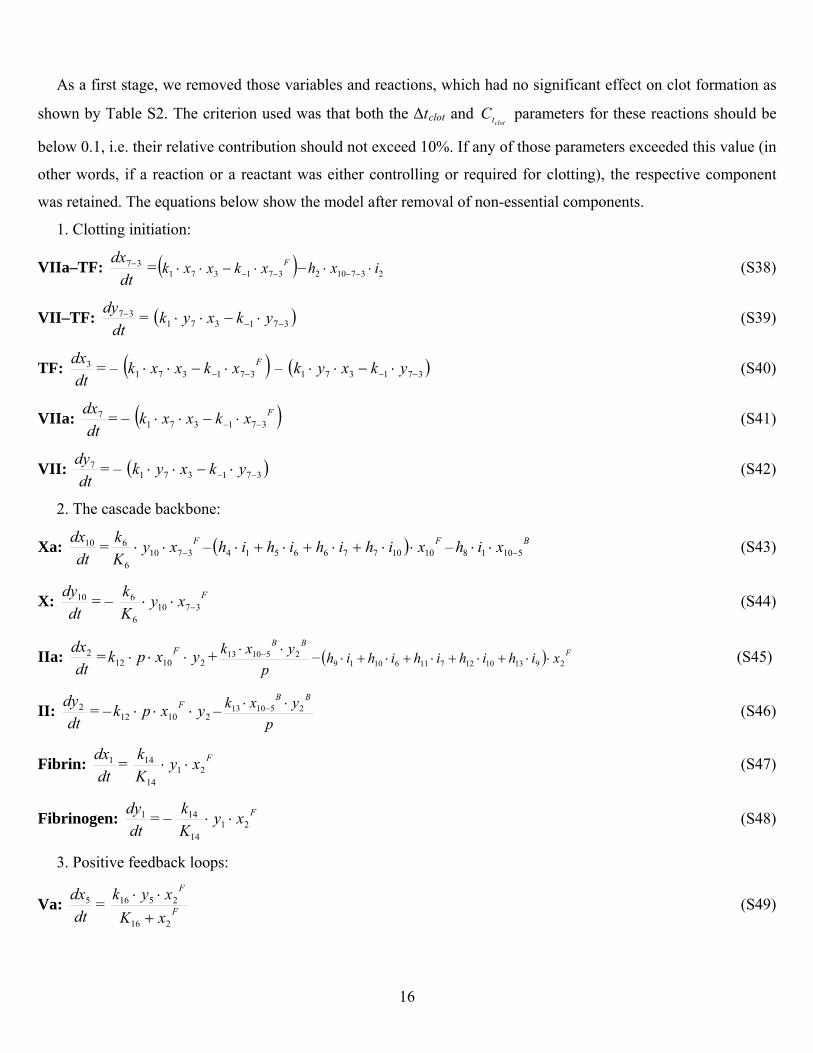
As a first stage, we removed those variables and reactions, which had no significant effect on clot formation as
shown by Table S2. The criterion used was that both the Δtclot and parameters for these reactions should be
below 0.1, i.e. their relative contribution should not exceed 10%. If any of those parameters exceeded this value (in
other words, if a reaction or a reactant was either controlling or required for clotting), the respective component
was retained. The equations below show the model after removal of non-essential components.
clottC
1. Clotting initiation:
VIIa–TF: dt
dx 37 = Fxkxxk 371371 – 237102 ixh (S38)
VII–TF: dt
dy 37 = (S39) 371371 ykxyk
TF: dt
dx3 = – Fxkxxk 371371 – 371371 ykxyk (S40)
VIIa: dt
dx7 = – Fxkxxk 371371 (S41)
VII: dt
dy7 = – (S42) 371371 ykxyk
2. The cascade backbone:
Xa: dt
dx10 = FxyKk
37106
6 – – (S43) Fxihihihih 10107766514 Bxih 51018
X: dt
dy10 = – FxyKk
37106
6 (S44)
IIa: dt
dx2 = +21012 yxpk F p
yxk BB251013 – (S45) Fxihihihihih 2913101271161019
II: dt
dy2 = – –21012 yxpk F p
yxk BB251013 (S46)
Fibrin: dtdx1 = Fxy
Kk
2114
14 (S47)
Fibrinogen: dtdy1 = – Fxy
Kk
2114
14 (S48)
3. Positive feedback loops:
Va: dt
dx5 = F
F
xKxyk
216
2516
(S49)
16
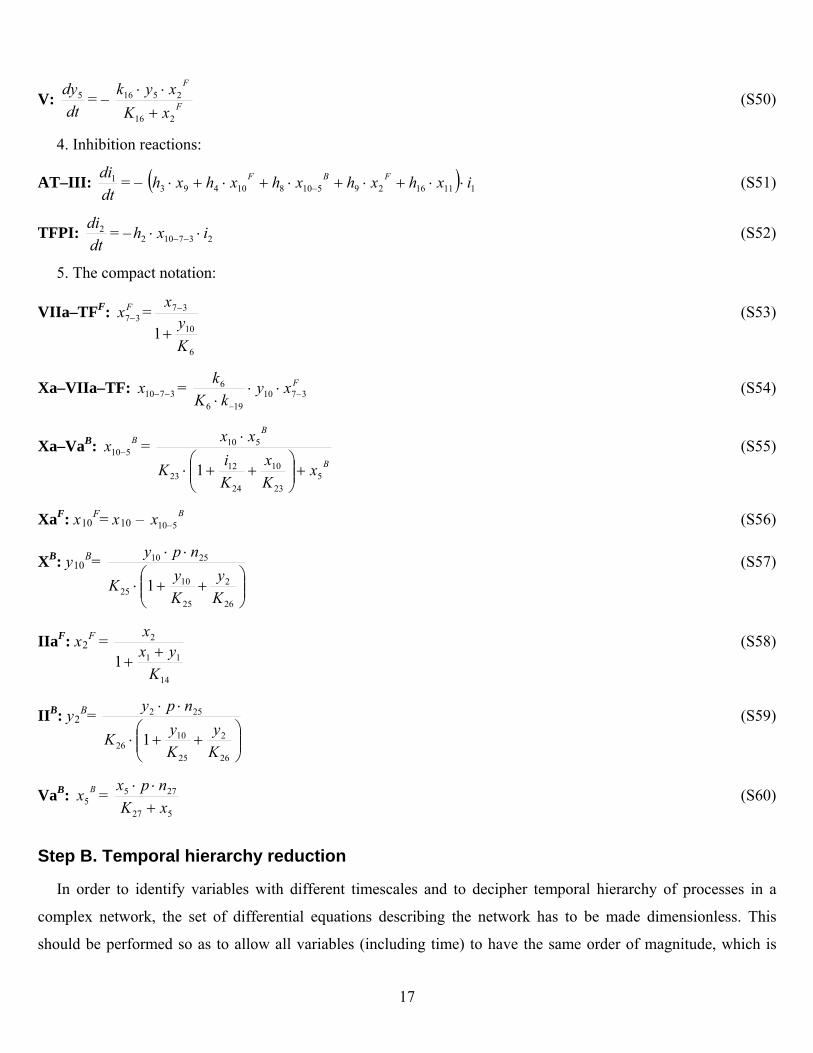
V: dt
dy5 = – F
F
xKxyk
216
2516
(S50)
4. Inhibition reactions:
AT–III: dtdi1 = – 1111629510810493 ixhxhxhxhxh FBF (S51)
TFPI: dtdi2 = – (S52) 237102 ixh
5. The compact notation:
VIIa–TFF: =Fx 37
6
10
37
1Ky
x
(S53)
Xa–VIIa–TF: = 3710 x FxykK
k3710
196
6
(S54)
Xa–VaB: = Bx 510B
B
xKx
KiK
xx
523
10
24
1223
510
1
(S55)
XaF: x10F= x10 – (S56) Bx 510
XB: y10B=
26
2
25
1025
2510
1Ky
KyK
npy (S57)
IIaF: x2F =
14
11
2
1K
yxx
(S58)
IIB: y2B=
26
2
25
1026
252
1Ky
KyK
npy (S59)
VaB: = Bx5527
275
xKnpx
(S60)
Step B. Temporal hierarchy reduction
In order to identify variables with different timescales and to decipher temporal hierarchy of processes in a
complex network, the set of differential equations describing the network has to be made dimensionless. This
should be performed so as to allow all variables (including time) to have the same order of magnitude, which is
17
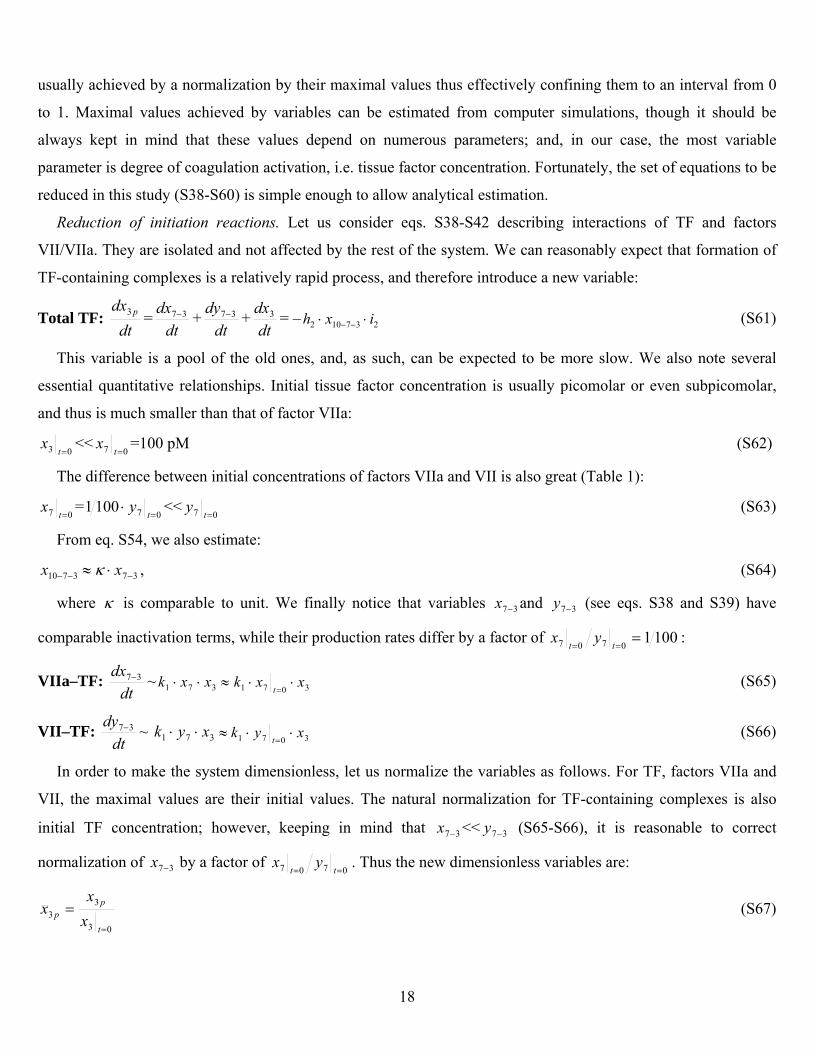
usually achieved by a normalization by their maximal values thus effectively confining them to an interval from 0
to 1. Maximal values achieved by variables can be estimated from computer simulations, though it should be
always kept in mind that these values depend on numerous parameters; and, in our case, the most variable
parameter is degree of coagulation activation, i.e. tissue factor concentration. Fortunately, the set of equations to be
reduced in this study (S38-S60) is simple enough to allow analytical estimation.
Reduction of initiation reactions. Let us consider eqs. S38-S42 describing interactions of TF and factors
VII/VIIa. They are isolated and not affected by the rest of the system. We can reasonably expect that formation of
TF-containing complexes is a relatively rapid process, and therefore introduce a new variable:
Total TF: dt
dx p3 =dt
dx 37 +dt
dy 37 +dt
dx3 = – 237102 ixh (S61)
This variable is a pool of the old ones, and, as such, can be expected to be more slow. We also note several
essential quantitative relationships. Initial tissue factor concentration is usually picomolar or even subpicomolar,
and thus is much smaller than that of factor VIIa:
03 tx <<
07 tx =100 pM (S62)
The difference between initial concentrations of factors VIIa and VII is also great (Table 1):
07 tx =
071001
t
y <<07 t
y (S63)
From eq. S54, we also estimate:
3710 x 37 x , (S64)
where is comparable to unit. We finally notice that variables and (see eqs. S38 and S39) have
comparable inactivation terms, while their production rates differ by a factor of
37x 37y
10010707
ttyx :
VIIa–TF: dt
dx 37 ~ 371 xxk 3071 xxkt
(S65)
VII–TF: dt
dy 37 ~ 371 xyk 3071 xykt
(S66)
In order to make the system dimensionless, let us normalize the variables as follows. For TF, factors VIIa and
VII, the maximal values are their initial values. The natural normalization for TF-containing complexes is also
initial TF concentration; however, keeping in mind that << (S65-S66), it is reasonable to correct
normalization of by a factor of
37x 37y
37x0707 tt
yx . Thus the new dimensionless variables are:
03
33
t
pp x
xx (S67)
18
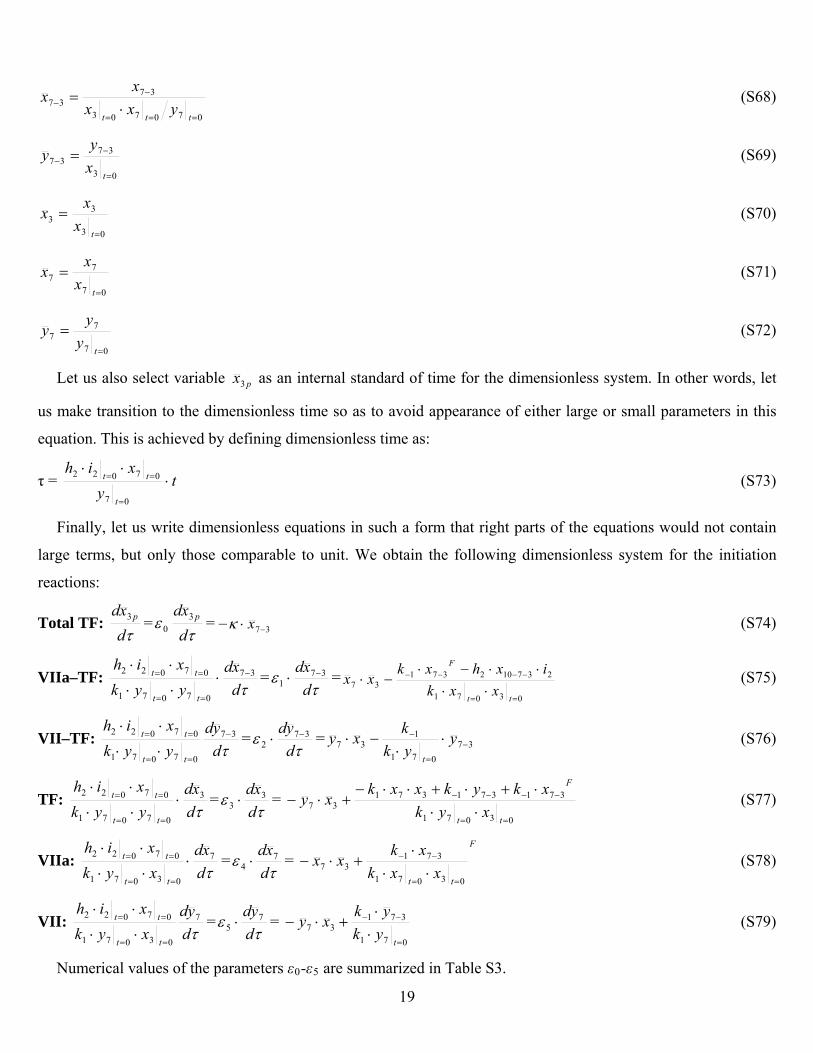
070703
3737
tttyxx
xx (S68)
03
3737
txy
y (S69)
03
33
t
xx
x (S70)
07
77
t
xx
x (S71)
07
77
t
yy
y (S72)
Let us also select variable px3 as an internal standard of time for the dimensionless system. In other words, let
us make transition to the dimensionless time so as to avoid appearance of either large or small parameters in this
equation. This is achieved by defining dimensionless time as:
τ = ty
xih
t
tt
07
07022 (S73)
Finally, let us write dimensionless equations in such a form that right parts of the equations would not contain
large terms, but only those comparable to unit. We obtain the following dimensionless system for the initiation
reactions:
Total TF: d
xd p3 =
dxd p3
0 = – 37 x (S74)
VIIa–TF: d
xdyykxih
tt
tt 37
07071
07022
=
dxd 37
1 =
03071
23710237137
tt
F
xxkixhxk
xx (S75)
VII–TF: d
ydyykxih
tt
tt 37
07071
07022
=
dyd 37
2 = 37
071
137
yykkxy
t
(S76)
TF: dxd
yykxih
tt
tt 3
07071
07022
=
dxd 3
3 = 03071
37137137137
tt
F
xykxkykxxk
xy (S77)
VIIa: dxd
xykxih
tt
tt 7
03071
07022
=
dxd 7
4 = F
ttxxk
xkxx
03071
37137
(S78)
VII: dyd
xykxih
tt
tt 7
03071
07022
=
dyd 7
5 = 071
37137
t
ykykxy (S79)
Numerical values of the parameters ε0-ε5 are summarized in Table S3.
19
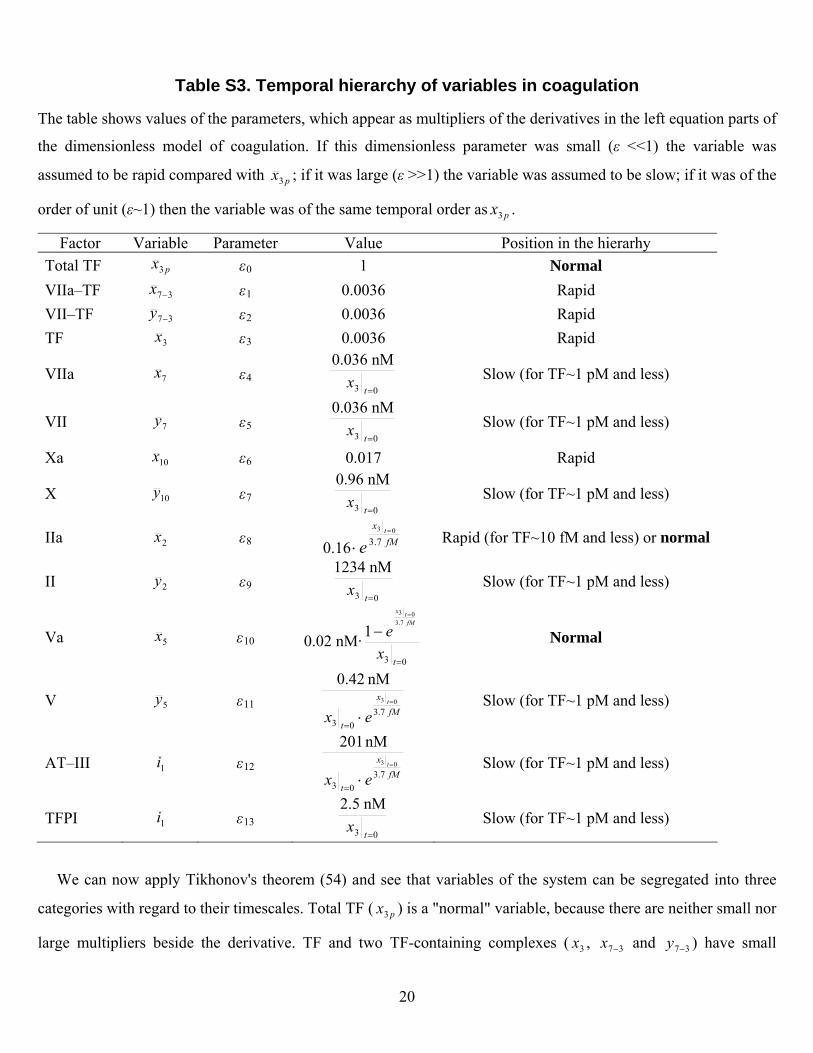
Table S3. Temporal hierarchy of variables in coagulation
The table shows values of the parameters, which appear as multipliers of the derivatives in the left equation parts of
the dimensionless model of coagulation. If this dimensionless parameter was small (ε <<1) the variable was
assumed to be rapid compared with px3 ; if it was large (ε >>1) the variable was assumed to be slow; if it was of the
order of unit (ε~1) then the variable was of the same temporal order as px3 .
Factor Variable Parameter Value Position in the hierarhy Total TF px3 ε0 1 Normal VIIa–TF 37x ε1 0.0036 Rapid VII–TF 37y ε2 0.0036 Rapid TF 3x ε3 0.0036 Rapid
VIIa 7x ε4 03
nM036.0
tx
Slow (for TF~1 pM and less)
VII 7y ε5 03
nM036.0
tx
Slow (for TF~1 pM and less)
Xa 10x ε6 0.017 Rapid
X 10y ε7 03
nM96.0
tx
Slow (for TF~1 pM and less)
IIa 2x ε8 0.16 fMx t
e 7.303
Rapid (for TF~10 fM and less) or normal
II 2y ε9 03
nM1234
tx
Slow (for TF~1 pM and less)
Va 5x ε10 0.02 nM·03
7.303
1
tx
efM
tx
Normal
V 5y ε11 fM
x
t
t
ex 7.303
03
nM 0.42
Slow (for TF~1 pM and less)
AT–III 1i ε12 fM
x
t
t
ex 7.303
03
nM 201
Slow (for TF~1 pM and less)
TFPI 1i ε13 03
nM5.2
tx
Slow (for TF~1 pM and less)
We can now apply Tikhonov's theorem (54) and see that variables of the system can be segregated into three
categories with regard to their timescales. Total TF ( ) is a "normal" variable, because there are neither small nor
large multipliers beside the derivative. TF and two TF-containing complexes ( , and ) have small
px3
3x 37x 37y
20
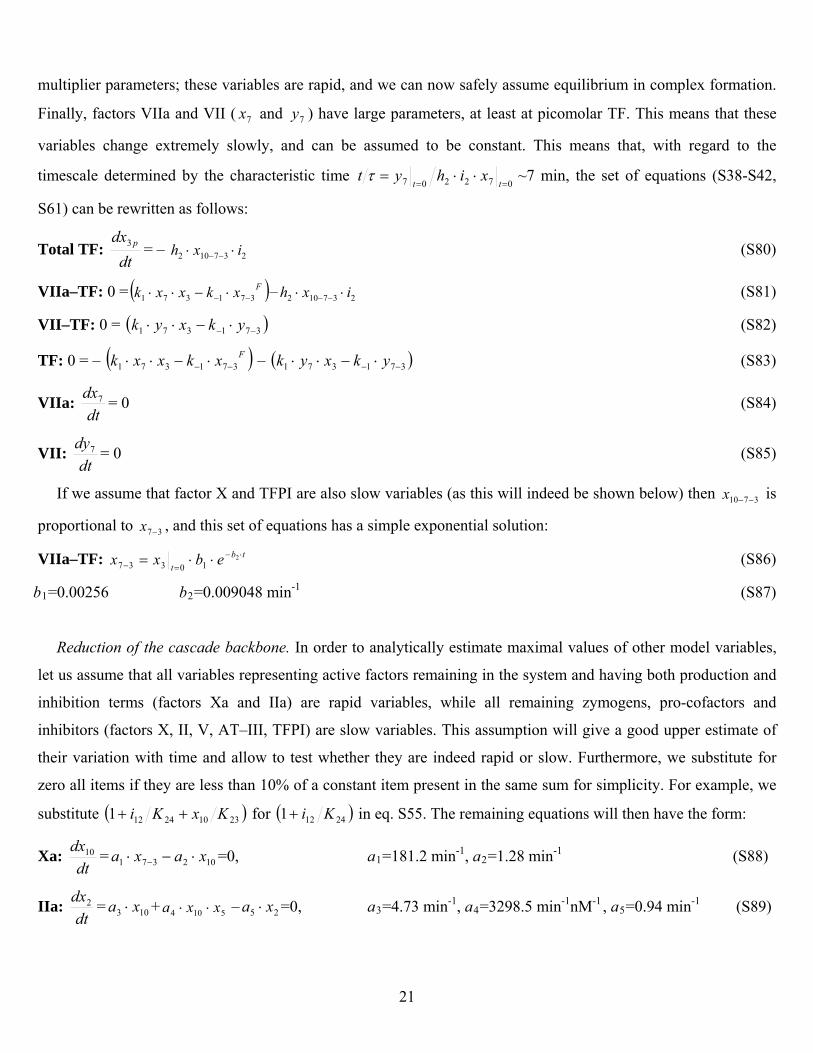
multiplier parameters; these variables are rapid, and we can now safely assume equilibrium in complex formation.
Finally, factors VIIa and VII ( and ) have large parameters, at least at picomolar TF. This means that these
variables change extremely slowly, and can be assumed to be constant. This means that, with regard to the
timescale determined by the characteristic time
7x 7y
072207
ttxihyt ~7 min, the set of equations (S38-S42,
S61) can be rewritten as follows:
Total TF: dt
dx p3 = – (S80) 37102 xh 2i
VIIa–TF: 0 = Fx 37kxxk 1371 – h 23710 i2 x (S81)
VII–TF: 0 = (S82) 1371 kxyk 37y
TF: 0 = – F3xkxxk 71371 – 3713 71 ykxk y (S83)
VIIa: dt
dx7 = 0 (S84)
VII: dt
dy7 = 0 (S85)
If we assume that factor X and TFPI are also slow variables (as this will indeed be shown below) then is
proportional to , and this set of equations has a simple exponential solution:
3710 x
37x
VIIa–TF: (S86) tb 2
tebxx
10337
b1=0.00256 b2=0.009048 min-1 (S87)
Reduction of the cascade backbone. In order to analytically estimate maximal values of other model variables,
let us assume that all variables representing active factors remaining in the system and having both production and
inhibition terms (factors Xa and IIa) are rapid variables, while all remaining zymogens, pro-cofactors and
inhibitors (factors X, II, V, AT–III, TFPI) are slow variables. This assumption will give a good upper estimate of
their variation with time and allow to test whether they are indeed rapid or slow. Furthermore, we substitute for
zero all items if they are less than 10% of a constant item present in the same sum for simplicity. For example, we
substitute 23 for 24 1 K12i1024121 KxKi in eq. S55. The remaining equations will then have the form:
Xa: dt
dx10 = =0, a102371 xaxa 1=181.2 min-1, a2=1.28 min-1 (S88)
IIa: dt
dx2 = + – =0, a103 xa 5104 xxa 2x 3=4.73 min-1, a4=3298.5 min-1nM-1 , a5=0.94 min-1 (S89) 5a
21
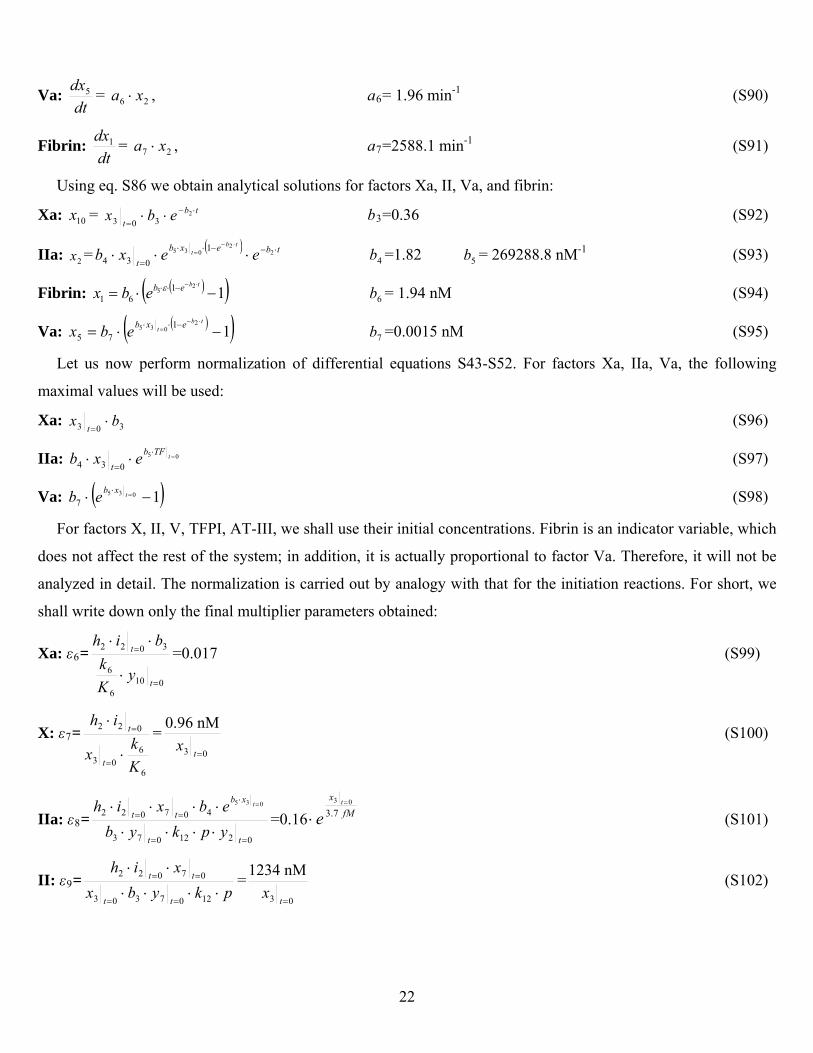
Va: dt
dx56 a6= 1.96 min-1 (S90) = ,
Fi
2xa
brin: dt 7 (S91)
Using eq. S86 we obtain analytical solutions for factors Xa, II, Va, and fibrin:
dx1 = xa , a =2588.1 min-1 27
Xa: =10x tbt
ebx
2303 b3 =0.36 (S92)
IIa: =2x tbe
tb
2
2
=1.82 (S93) exb
texb t
035 1
034 = 269288.8 nM-1 4b 5b
125 1
61 tbebebx Fibrin: = 1.94 nM (S94) 6b
12035 1
75
tbt exbebxVa: =0.0015 nM (S95)
maximal values will be used:
7b
Let us now perform normalization of differential equations S43-S52. For factors Xa, IIa, Va, the following
Xa: (S96) 303 bxt
05IIa: 034 t
Va:
TFbexb
t (S97)
10357 txbeb (S98)
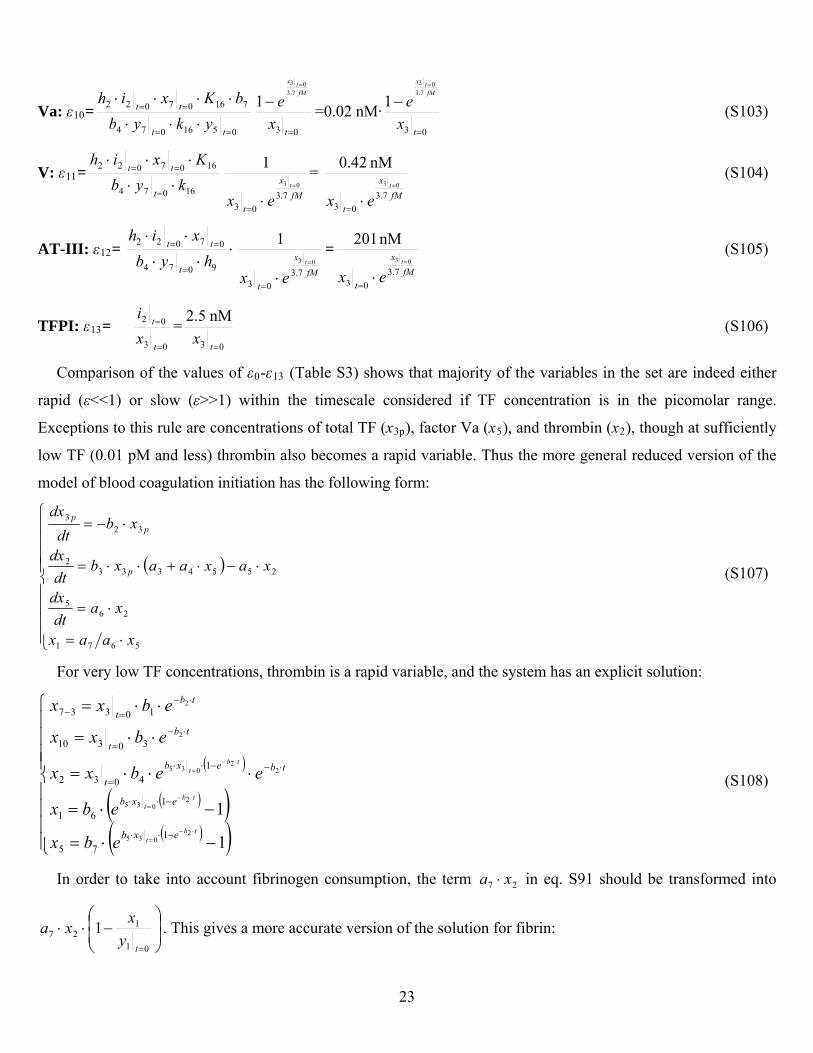
For factors X, II, V, TFPI, AT-III, we shall use their initial concentrations. Fibrin is an indicator variable, which
does not affect the rest of the system; in addition, it is actually proportional to factor Va. Therefore, it will not be
analyzed in detail. The normalization is carried out by analogy with that for the initiation reactions. For short, we
own onl
Xa: ε6=
shall write d y the final multiplier parameters obtained:
0t106
6
3022
t
yKk
bih=0.017 (S99)
X: ε7=
6
603
022
Kk
x
ih
t
t
=03 t
xnM96.0 (S100)
ε = fMt
e 7.303
0212073
407022035
IIa: 8t
t
xb
tt
ypkybebxih t
=0.16x
II: ε9=
(S101)
pkybxxih
tt
tt
1207303
07022 =03
nM1234
tx
(S102)
22
0516074
71607022
tt
tt
ykybbKxih
03
7.303
1
tx
efM
tx
03
7.3
e (S103)
03
1
tx
fMtx
Va: ε10= =0.02 nM·
16074
16070V: ε11= 22
b kyKxih
t
tt
fMx
t
t
ex 7.303
03
1
= fM
x
t
t
ex 7.303
03
nM 0.42
(S104)
AT-III: ε12=
0
9074
0722
hybxih
t
tt
fM
x t 03 =
tex 7.3
3
1
fMx t 03
(S105)
tex 7.3
03
nM 201
0
03
02
t
t
xi
=TFPI: ε13= 03
nM5.2
tx
(S106)
Comparison of the values of ε0-ε13 (Table S3) shows that majority of the variables in the set are indeed either
rapid (ε<<1) or slow (ε>>1) within the timescale considered if TF concentration is in the picomolar range.
Exceptions to this rule are concentrations of total TF (x3p), factor Va (x5), and thrombin (x2), though at sufficiently
low TF (0.01 pM and less) thrombin also becomes a rapid variable. Thus the more general reduced version of the
model of blood coagulation initiation has the following form:
5 xax
5671
26
25543332
323
xaaxdt
d
xaxaaxbdt
dx
xbdt
dx
p
pp
(S107)
For very low TF concentrations, thrombin is a rapid variable, and the system has an explicit solution:
2035
22
035
2
2
175
14032
30310
10337
tbt
tbt
exb
tbexb
t
tbt
tbt
ebx
x
eebxx
ebxx
ebxx
(S108)
In order to take into account fibrinogen consumption, the term
1
12
035 161
tbt exbeb
27 xa in eq. S91 should be transformed into
01
127 1
ty
xxa . This gives a more accurate version of the solution for fibrin:
23
etbetxb
t
ey
b
tyx 1
011
21035
01
6
1 (S108a)
duc n with t fact
case of factor V-deficient plasma), the result will be qualitatively different. Without this feedback, the equation for
thr
IIa:
Re tio ou or V. If we now consider reduction of a model without factor V (which corresponds to the
ombin will be:
dt
dx2 = – (S109)
Thrombin will be a rapid variable independently of TF concentration. Its reduction will be much simpler and
wi endence identical to those for the VIIa–TF complex and factor Xa:
103 xa 25 xa
ll result in an exponential dep
5
103
axa
= tbt
exa
ba
2
035
33IIa: 2x = (S110)
Fibrin kinetics then will be:
Fibrin: )1( 22 333703337 ttbtte
xbaade
xbaadxax
25
05
0 baa
0271
tbt
(S111)
This formula is qualitatively different from eq. S108 both at small and large temporal intervals. Instead of
exponential growth, it is a linear function of t at and a linear function of 0t0t
TF at
By analogy with eq. S108a, a version accounting for fibrinogen consumption is:
t .
e
tbt
t
ebaxbaa
yyx )1(1 2
25
03337
011
t 011 (S111a)
4.
ositive
feedback loops except for negligible activation of factors XI and VII would disappear completely; and a proteolytic
Phase Plane Analysis of the Model
Check for a stable steady state existence and retention during the reduction
The first step in the analysis of a mathematical model is identification of stable steady-state solutions.
Examination of the original model (eqs. S1-S35) shows that steady state is possible when, and only when
concentrations of all active coagulation factors (except for factors VIIa and Va that do not possess independent
activity and do not have first-order inhibition) are zero. Otherwise, they cause irreversible activation of the
predecessors, and the reaction rates are not zero. The same holds for the reduced model (eqs. S107). Furthermore,
this solution is stable. While it is usually studied by Jacobi matrix analysis (55), a simpler demonstration can
suffice for this system. If the model (eqs. S1-S35) is linearized in the vicinity of the stable state, all p
24
ca
needed for explosive thrombin formation if there is non-zero factor Va present. Thus,
wh
factor in plasma is limited due to
degradation by non-specific proteases. Therefore, introduction of a first-order inhibition of this factor in the system
ity of the system.
In order to analyze
by adding an arbitrarily small term for factor Va inhibition as discussed in the previous section:
scade with inhibition of all active enzymes is stable (56). Stability of the steady state in a reduced model (eqs.
S107) follows from the same considerations indicating that (x3p=0, x2=0) is the only attractor in this system.
It should be noted though that this attractor is not actually a point, but a line (x10=0, x2=0, x5 can be any). This
occurs because factor Va is not inhibited in the reduced system, and only accumulates. In the complete model (eqs.
S1-S35), it can be inhibited by activated protein C, but this inhibition is second-order. Therefore, it requires a
sufficient amount of activated protein C to be produced, and this occurs only when large quantities of thrombin are
already available. Thus, contribution of this inhibition to system dynamics was rightly judged to be negligible from
Table S2. Because of this, stability of the system (eqs. S107) changes along the line (x10=0, x2=0, x5 is arbitrary):
much smaller activation is
ile the steady state of the system is stable, it is not robust: small perturbations of factor Va concentration can
cause significant changes.
This non-robustness is not an obstacle for the use of the models. They still remains correct with regard to
experimental data description and accuracy of reduction. However, for the purpose of dynamic analysis, it is
advisable to make the system robust by adding a perturbation in the form of some non-zero, first-order rate of
factor Va inhibition. This "robusterization" serves to achieve two ends: 1) to check structural stability, i.e. if this
will qualitatively change the behavior of the system; 2) to highlight the mechanisms of the system dynamics, which
are usually more convenient to observe in a robust system. While no specific inhibitor of factor Va except for
activated protein C is known, it is likely that the life-time of this active co
is a reasonable assumption and a good test of structural stabil
Analysis of the reduced "robusterized" model
system dynamics qualitatively, let us make the reduced model (eqs. S107) structurally robust
5265
5xhxa
dtdx
x (S112)
Assuming this variable to be rapid it is possible to re-write eqs. S107 in the following form:
002
0303
t
ttp
x
x
222132
323
p
pp
x
xhxxdt
dx
xbdt
dx
(S113)
25
New parameters αi and h are combinations of the old ones (ai) and are used for better readability. They are all
positive and non-zero. The null-clines for this set are:
221
23
2 0x
xhx
dt p
(S114)
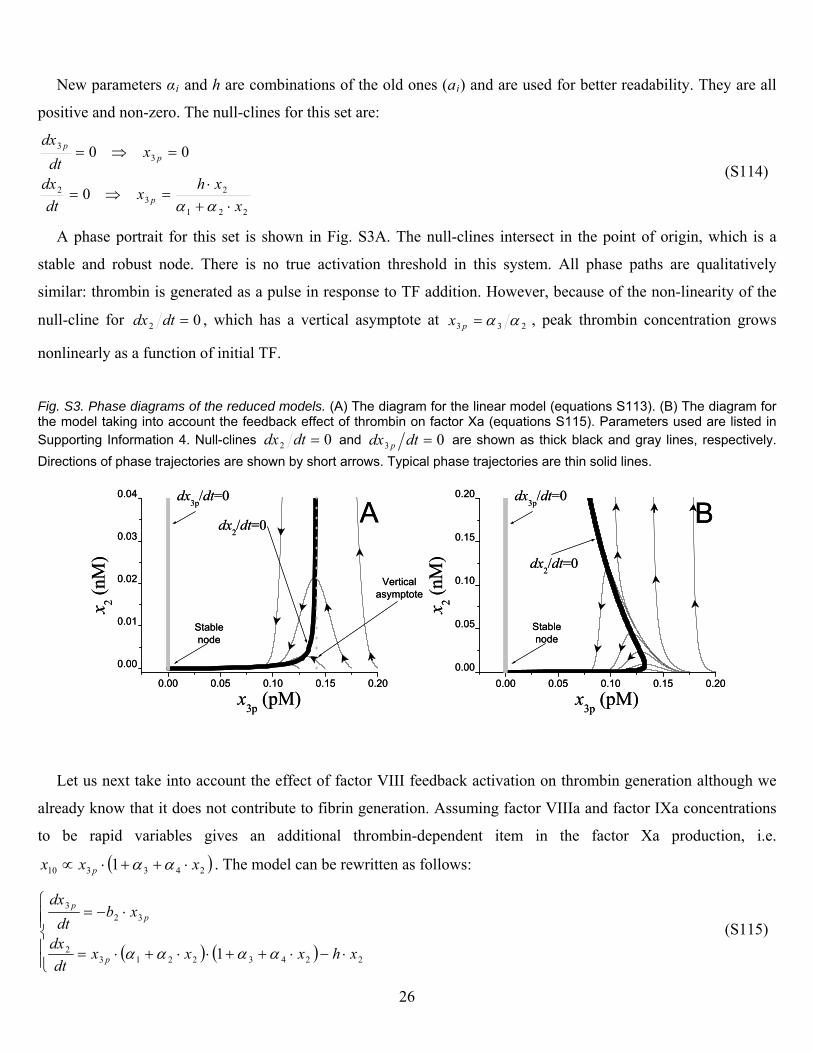
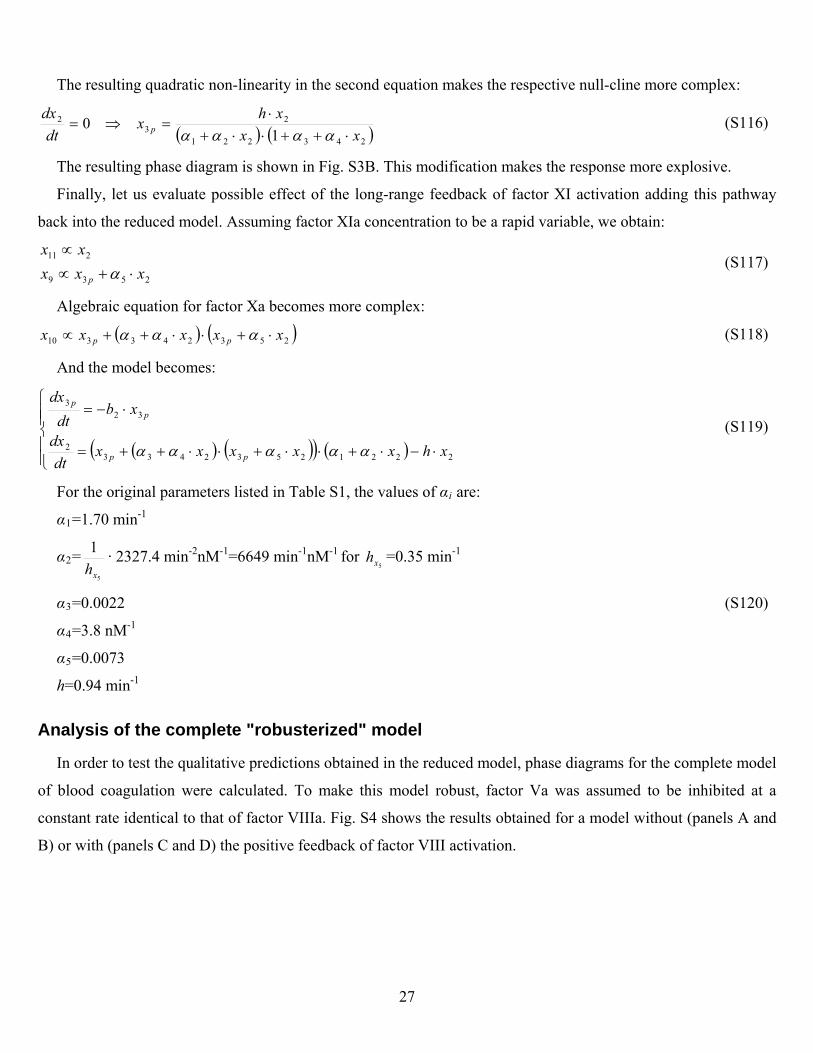
A phase portrait for this set is shown in Fig. S3A. The null-clines intersect in the point of origin, which is a
stable and robust node. There is no true activation threshold in this system. All phase paths are qualitatively
similar: thrombin is generated as a pul
33 00
dx
xdt
dxp
p
se in response to TF addition. However, because of the non-linearity of the
null-cline for 02 dtdx , which has a vertical asymptote at 233 px , peak thrombin concentration grows
(B) The diagram for the model taking into account the feedback effect of thrombin on factor Xa (equations S115). Parameters used are listed in Supporting Information 4. Null-clines
nonlinearly as a function of initial TF.
Fig. S3. Phase diagrams of the reduced models. (A) The diagram for the linear model (equations S113).
02 dtdx and 03 dtdx p are shown as thick black and gray lines, respectively.
Directions of phase trajectories are shown by short arrows. Typical phase trajectories are thin solid lines.
0.00 0.05 0.10 0.15 0.20
0.00
0.05
0.10
0.15
0.20
Stablenode
Bdx3p/dt=0
dx2/dt=0
x 2 (nM
)
x3p (pM)0.00 0.05 0.10 0.15 0.20
0.00
0.01
0.02
0.03
0.04
Verticalasymptote
Stablenode
Adx3p/dt=0
dx2/dt=0
x 2 (nM
)
x3p (pM)0.00 0.05 0.10 0.15 0.20
0.00
0.05
0.10
0.15
0.20
Stablenode
Bdx3p/dt=0
dx2/dt=0
x 2 (nM
)
x3p (pM)0.00 0.05 0.10 0.15 0.20
0.00
0.01
0.02
0.03
0.04
Verticalasymptote
Stablenode
Adx3p/dt=0
dx2/dt=0
x 2 (nM
)
x3p (pM)
Let us next take into account the effect of factor VIII feedback activation on thrombin generation although we
ot contribute to fibrin generation. Assumalready know that it does n ing factor VIIIa and factor IXa concentrations
to be rapid variables gives an additional thrombin-dependent item in the factor Xa production, i.e.
243310 1 xxx p . The model can be rew s ollows: ritten a f
2 1 xhxxxx
(S1
22432213
323
dtd
xbdt
dx
p
pp
15)
26
The resulting quadratic non-linearity in the second equa on ma ore coti kes the respective null-cline m mplex:
2432213 1 xxp
22 0 xhxdt
dx (S116)
ng this pathway
back into the reduced m
(S117)
Algebraic equation for factor Xa beco
The resulting phase diagram is shown in Fig. S3B. This modification makes the response more explosive.
Finally, let us evaluate possible effect of the long-range feedback of factor XI activation addi
odel. Assuming factor XIa concentration to be a rapid variable, we obtain:
253 xx p 9
211
xxx
mes more complex:
25310 xx p 2433 xxx p (S118)
And the model becomes:
22212532433 xdt pp
2
323
hxxxxxdx
xbdt
dxp
p
(S119)
parameters listed in Table S1, the values of αi are: -1
α2=
For the original
α1=1.70 min
5xh 5x1 · 2327.4 min-2nM-1=6649 min-1nM-1 for =0.35 min-1
(S120)
h=0.94 min-1
An
ined for a model without (panels A and
B) or with (panels C and D) the positive feedback of factor VIII activation.
h
α3=0.0022
α4=3.8 nM-1
α5=0.0073
alysis of the complete "robusterized" model
In order to test the qualitative predictions obtained in the reduced model, phase diagrams for the complete model
of blood coagulation were calculated. To make this model robust, factor Va was assumed to be inhibited at a
constant rate identical to that of factor VIIIa. Fig. S4 shows the results obta
27
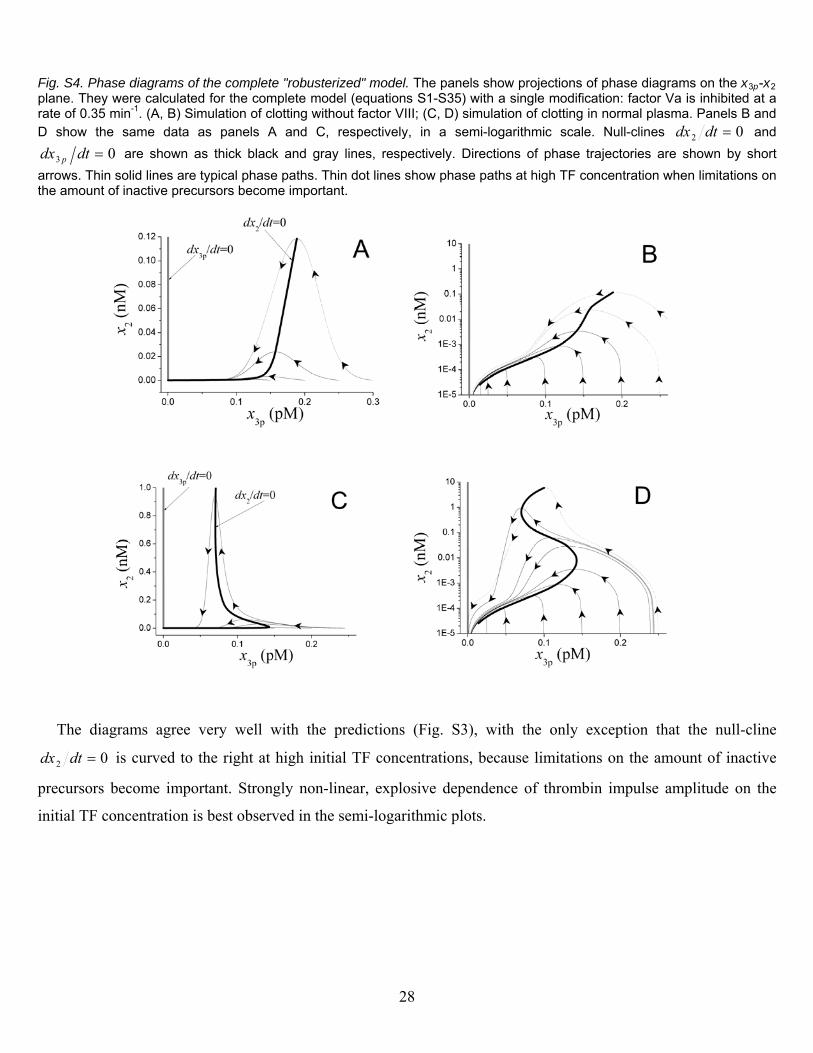
Fig. S4. Phase diagrams of the complete "robusterized" model. The panels show projections of phase diagrams on the x3p-x2 plane. They were calculated for the complete model (equations S1-S35) with a single modification: factor Va is inhibited at a rate of 0.35 min-1. (A, B) Simulation of clotting without factor VIII; (C, D) simulation of clotting in normal plasma. Panels B and D show the same data as panels A and C, respectively, in a semi-logarithmic scale. Null-clines 02 dtdx and
03 dtdx p are shown as thick black and gray lines, respectively. Directions of phase trajectories are shown by short
arrows. Thin solid lines are typical phase paths. Thin dot lines show phase paths at high TF concentration when limitations on the amount of inactive precursors become important.
The diagrams agree very well with the predictions (Fig. S3), with the only exception that the null-cline
02 dtdx is curved to the right at high initial TF concentrations, because limitations on the amount of inactive
precursors become important. Strongly non-linear, explosive dependence of thrombin impulse amplitude on the
initial TF concentration is best observed in the semi-logarithmic plots.
28
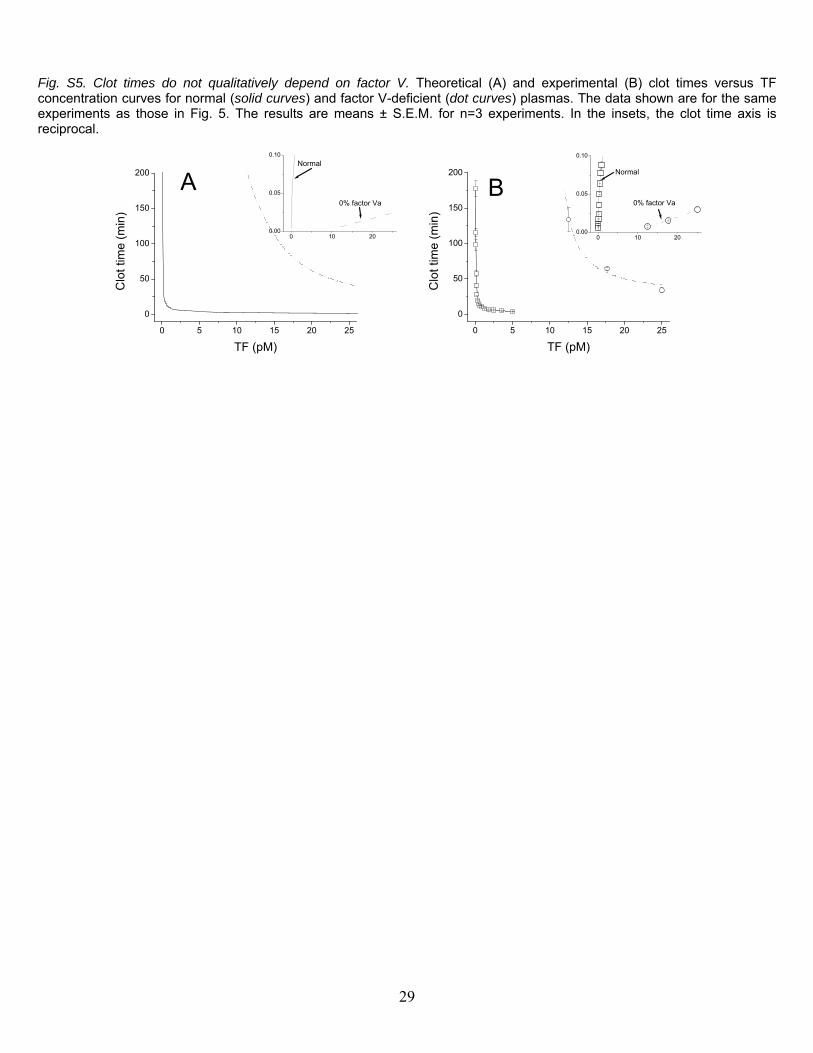
Fig. S5. Clot times do not qualitatively depend on factor V. Theoretical (A) and experimental (B) clot times versus TF concentration curves for normal (solid curves) and factor V-deficient (dot curves) plasmas. The data shown are for the same experiments as those in Fig. 5. The results are means ± S.E.M. for n=3 experiments. In the insets, the clot time axis is reciprocal.
0 5 10 15 20 25
0
50
100
150
200
0% factor Va
Normal
A
Clo
t tim
e (m
in)
TF (pM)
0 10 200.00
0.05
0.10
0 5 10 15 20 25
0
50
100
150
200
0% factor Va
Normal
B
Clo
t tim
e (m
in)
TF (pM)
0 10 200.00
0.05
0.10
29
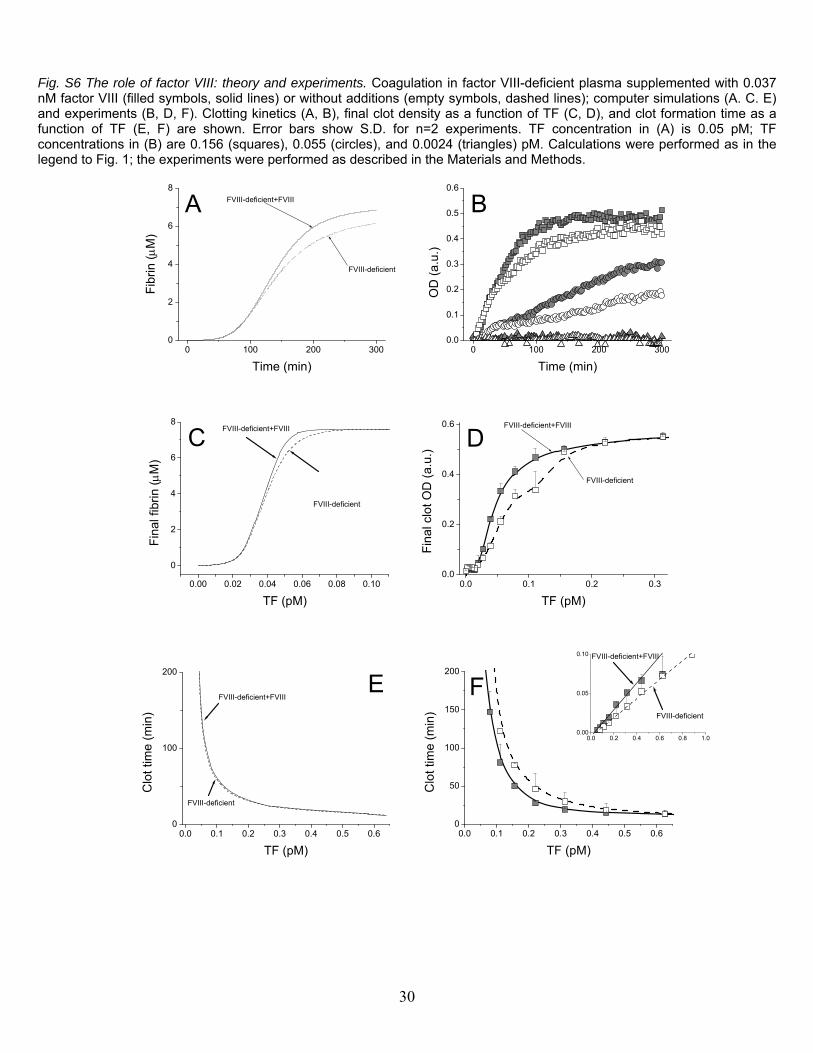
Fig. S6 The role of factor VIII: theory and experiments. Coagulation in factor VIII-deficient plasma supplemented with 0.037 nM factor VIII (filled symbols, solid lines) or without additions (empty symbols, dashed lines); computer simulations (A. C. E) and experiments (B, D, F). Clotting kinetics (A, B), final clot density as a function of TF (C, D), and clot formation time as a function of TF (E, F) are shown. Error bars show S.D. for n=2 experiments. TF concentration in (A) is 0.05 pM; TF concentrations in (B) are 0.156 (squares), 0.055 (circles), and 0.0024 (triangles) pM. Calculations were performed as in the legend to Fig. 1; the experiments were performed as described in the Materials and Methods.
0 100 200 3000
2
4
6
8FVIII-deficient+FVIII
FVIII-deficient
A
Fib
rin (M
)
Time (min)
0 100 200 3000.0
0.1
0.2
0.3
0.4
0.5
0.6
B
OD
(a
.u.)
Time (min)
0.00 0.02 0.04 0.06 0.08 0.10
0
2
4
6
8FVIII-deficient+FVIII
FVIII-deficient
C
Fin
al f
ibri
n (
M)
TF (pM)
0.0 0.1 0.2 0.30.0
0.2
0.4
0.6 FVIII-deficient+FVIII
FVIII-deficient
D F
inal
clo
t O
D (
a.u.
)
TF (pM)
0.0 0.1 0.2 0.3 0.4 0.5 0.60
100
200
FVIII-deficient+FVIII
FVIII-deficient
E
Clo
t tim
e (m
in)
TF (pM)
0.0 0.1 0.2 0.3 0.4 0.5 0.60
50
100
150
200
FVIII-deficient
FVIII-deficient+FVIII
F
Clo
t tim
e (m
in)
TF (pM)
0.0 0.2 0.4 0.6 0.8 1.00.00
0.05
0.10
30
References
1. Krishnaswamy, S. 1992. The interaction of human factor VIIa with tissue factor. J. Biol. Chem. 267:23696-
23706.
2. Nemerson, Y. and R. Gentry. 1986. An ordered addition, essential activation model of the tissue factor
pathway of coagulation: evidence for a conformational cage. Biochemistry 25:4020-4033.
3. Butenas, S. and K. G. Mann. 1996. Kinetics of human factor VII activation. Biochemistry 35:1904-1910.
4. Rao, L. V., T. Williams, and S. I. Rapaport. 1996. Studies of the activation of factor VII bound to tissue
factor. Blood 87:3738-3748.
5. Warn-Cramer, B. J. and S. P. Bajaj. 1986. Intrinsic versus extrinsic coagulation. Kinetic considerations.
Biochem. J. 239:757-762.
6. Gailani, D., D. Ho, M. F. Sun, Q. Cheng, and P. N. Walsh. 2001. Model for a factor IX activation complex
on blood platelets: dimeric conformation of factor XIa is essential. Blood 97:3117-3122.
7. Baugh, R. J. and S. Krishnaswamy. 1996. Role of the activation peptide domain in human factor X
activation by the extrinsic Xase complex. J. Biol. Chem. 271:16126-16134.
8. Scandura, J. M. and P. N. Walsh. 1996. Factor X bound to the surface of activated human platelets is
preferentially activated by platelet-bound factor IXa. Biochemistry 35:8903-8913.
9. Rawala-Sheikh, R., S. S. Ahmad, B. Ashby, and P. N. Walsh. 1990. Kinetics of coagulation factor X
activation by platelet-bound factor IXa. Biochemistry 29:2606-2611.
10. Panteleev, M. A., E. L. Saenko, N. M. Ananyeva, and F. I. Ataullakhanov. 2004. Kinetics of factor X
activation by the membrane-bound complex of factor IXa and factor VIIIa. Biochem. J. 381:779-794.
11. Baugh, R. J., G. J. Broze, Jr., and S. Krishnaswamy. 1998. Regulation of extrinsic pathway factor Xa
formation by tissue factor pathway inhibitor. J. Biol. Chem. 273:4378-4386.
12. Tracy, P. B., L. L. Eide, and K. G. Mann. 1985. Human prothrombinase complex assembly and function on
isolated peripheral blood cell populations. J. Biol. Chem. 260:2119-2124.
13. van Dieijen, G., G. Tans, J. Rosing, and H. C. Hemker. 1981. The role of phospholipid and factor VIIIa in
the activation of bovine factor X. J. Biol. Chem. 256:3433-3442.
14. Keuren, J. F., S. J. Wielders, H. Ulrichts, T. Hackeng, J. W. Heemskerk, H. Deckmyn, E. M. Bevers, and T.
Lindhout. 2005. Synergistic effect of thrombin on collagen-induced platelet procoagulant activity is
mediated through protease-activated receptor-1. Arterioscler. Thromb. Vasc. Biol. 25:1499-1505.
15. Higgins, D. L., S. D. Lewis, and J. A. Shafer. 1983. Steady state kinetic parameters for the thrombin-
catalyzed conversion of human fibrinogen to fibrin. J. Biol. Chem. 258:9276-9282.
31
16. Hill-Eubanks, D. C. and P. Lollar. 1990. von Willebrand factor is a cofactor for thrombin-catalyzed
cleavage of the factor VIII light chain. J. Biol. Chem. 265:17854-17858.
17. Monkovic, D. D. and P. B. Tracy. 1990. Activation of human factor V by factor Xa and thrombin.
Biochemistry 29:1118-1128.
18. Oliver, J. A., D. M. Monroe, H. R. Roberts, and M. Hoffman. 1999. Thrombin activates factor XI on
activated platelets in the absence of factor XII. Arterioscler. Thromb. Vasc. Biol. 19:170-177.
19. Esmon, N. L., L. E. DeBault, and C. T. Esmon. 1983. Proteolytic formation and properties of gamma-
carboxyglutamic acid-domainless protein C. J. Biol. Chem. 258:5548-5553.
20. Panteleev, M. A., V. I. Zarnitsina, and F. I. Ataullakhanov. 2002. Tissue factor pathway inhibitor: a
possible mechanism of action. Eur. J. Biochem. 269:2016-2031.
21. Ahmad, S. S., R. Rawala-Sheikh, and P. N. Walsh. 1989. Comparative interactions of factor IX and factor
IXa with human platelets. J. Biol. Chem. 264:3244-3251.
22. Ahmad, S. S., J. M. Scandura, and P. N. Walsh. 2000. Structural and functional characterization of platelet
receptor-mediated factor VIII binding. J. Biol. Chem. 275:13071-13081.
23. Koppelman, S. J., T. M. Hackeng, J. J. Sixma, and B. N. Bouma. 1995. Inhibition of the intrinsic factor X
activating complex by protein S: evidence for a specific binding of protein S to factor VIII. Blood 86:1062-
1071.
24. Hackeng, T. M., '. van, V, J. C. Meijers, and B. N. Bouma. 1994. Human protein S inhibits prothrombinase
complex activity on endothelial cells and platelets via direct interactions with factors Va and Xa. J. Biol.
Chem. 269:21051-21058.
25. Scandura, J. M., S. S. Ahmad, and P. N. Walsh. 1996. A binding site expressed on the surface of activated
human platelets is shared by factor X and prothrombin. Biochemistry 35:8890-8902.
26. Tracy, P. B., M. E. Nesheim, and K. G. Mann. 1992. Platelet factor Xa receptor. Methods Enzymol.
215:329-360.
27. Pieters, J., G. Willems, H. C. Hemker, and T. Lindhout. 1988. Inhibition of factor IXa and factor Xa by
antithrombin III/heparin during factor X activation. J. Biol. Chem. 263:15313-15318.
28. Rezaie, A. R. 1998. Calcium enhances heparin catalysis of the antithrombin-factor Xa reaction by a
template mechanism. Evidence that calcium alleviates Gla domain antagonism of heparin binding to factor
Xa. J. Biol. Chem. 273:16824-16827.
29. Ellis, V., M. Scully, I. MacGregor, and V. Kakkar. 1982. Inhibition of human factor Xa by various plasma
protease inhibitors. Biochim. Biophys. Acta 701:24-31.
30. Espana, F., M. Berrettini, and J. H. Griffin. 1989. Purification and characterization of plasma protein C
inhibitor. Thromb. Res. 55:369-384.
32
31. Ellis, V., M. F. Scully, and V. V. Kakkar. 1984. Inhibition of prothrombinase complex by plasma
proteinase inhibitors. Biochemistry 23:5882-5887.
32. Jesty, J. 1986. The kinetics of inhibition of alpha-thrombin in human plasma. J. Biol. Chem. 261:10313-
10318.
33. Heeb, M. J., R. Bischoff, M. Courtney, and J. H. Griffin. 1990. Inhibition of activated protein C by
recombinant alpha 1-antitrypsin variants with substitution of arginine or leucine for methionine358. J. Biol.
Chem. 265:2365-2369.
34. Derechin, V. M., M. A. Blinder, and D. M. Tollefsen. 1990. Substitution of arginine for Leu444 in the
reactive site of heparin cofactor II enhances the rate of thrombin inhibition. J. Biol. Chem. 265:5623-5628.
35. Lollar, P., E. T. Parker, and P. J. Fay. 1992. Coagulant properties of hybrid human/porcine factor VIII
molecules. J. Biol. Chem. 267:23652-23657.
36. Solymoss, S., M. M. Tucker, and P. B. Tracy. 1988. Kinetics of inactivation of membrane-bound factor Va
by activated protein C. Protein S modulates factor Xa protection. J. Biol. Chem. 263:14884-14890.
37. Wuillemin, W. A., E. Eldering, F. Citarella, C. P. de Ruig, H. ten Cate, and C. E. Hack. 1996. Modulation
of contact system proteases by glycosaminoglycans. Selective enhancement of the inhibition of factor XIa.
J. Biol. Chem. 271:12913-12918.
38. Meijers, J. C., R. A. Vlooswijk, and B. N. Bouma. 1988. Inhibition of human blood coagulation factor XIa
by C-1 inhibitor. Biochemistry 27:959-963.
39. Heeb, M. J., A. Gruber, and J. H. Griffin. 1991. Identification of divalent metal ion-dependent inhibition of
activated protein C by alpha 2-macroglobulin and alpha 2-antiplasmin in blood and comparisons to
inhibition of factor Xa, thrombin, and plasmin. J. Biol. Chem. 266:17606-17612.
40. Butenas, S. and K. G. Mann. 2002. Blood coagulation. Biochemistry (Mosc. ) 67:3-12.
41. Colman, R. W. 2006. Hemostasis and thrombosis: basic principles and clinical practice. Lippincott
Williams & Wilkins, Philadelphia, PA.
42. Panteleev, M. A., M. V. Ovanesov, D. A. Kireev, A. M. Shibeko, E. I. Sinauridze, N. M. Ananyeva, A. A.
Butylin, E. L. Saenko, and F. I. Ataullakhanov. 2006. Spatial propagation and localization of blood
coagulation are regulated by intrinsic and protein C pathways, respectively. Biophys. J. 90:1489-1500.
43. Weisel, J. W. and C. Nagaswami. 1992. Computer modeling of fibrin polymerization kinetics correlated
with electron microscope and turbidity observations: clot structure and assembly are kinetically controlled.
Biophys. J. 63:111-128.
44. Ovanesov, M. V., N. M. Ananyeva, M. A. Panteleev, F. I. Ataullakhanov, and E. L. Saenko. 2005.
Initiation and propagation of coagulation from tissue factor bearing cell monolayers to plasma: initiator
cells do not regulate spatial growth rate. J. Thromb. Haemost. 3:321-331.
33
34
45. Campbell, R. A., K. A. Overmyer, C. R. Bagnell, and A. S. Wolberg. 2008. Cellular procoagulant activity
dictates clot structure and stability as a function of distance from the cell surface. Arterioscler. Thromb.
Vasc. Biol. 28:2247-2254.
46. Marx, G. and A. Blankenfeld. 1993. Kinetic and mechanical parameters of pure and cryoprecipitate fibrin.
Blood Coagul. Fibrinolysis 4:73-78.
47. Liu, G., M. T. Swihart, and S. Neelamegham. 2005. Sensitivity, principal component and flux analysis
applied to signal transduction: the case of epidermal growth factor mediated signaling. Bioinformatics.
21:1194-1202.
48. Saltelli, A. 2008. Global sensitivity analysis: the primer. John Wiley, Chichester, England.
49. Al Dieri, R., F. Peyvandi, E. Santagostino, M. Giansily, P. M. Mannucci, J. F. Schved, S. Beguin, and H. C.
Hemker. 2002. The thrombogram in rare inherited coagulation disorders: its relation to clinical bleeding.
Thromb. Haemost. 88:576-582.
50. van't Veer, C., N. J. Golden, M. Kalafatis, and K. G. Mann. 1997. Inhibitory mechanism of the protein C
pathway on tissue factor-induced thrombin generation. Synergistic effect in combination with tissue factor
pathway inhibitor. J. Biol. Chem. 272:7983-7994.
51. He, R., S. Xiong, X. He, F. Liu, J. Han, J. Li, and S. He. 2001. The role of factor XI in a dilute
thromboplastin assay of extrinsic coagulation pathway. Thromb. Haemost. 85:1055-1059.
52. van't Veer, C., N. J. Golden, and K. G. Mann. 2000. Inhibition of thrombin generation by the zymogen
factor VII: implications for the treatment of hemophilia A by factor VIIa. Blood 95:1330-1335.
53. Jesty, J. and E. Beltrami. 2005. Positive feedbacks of coagulation: their role in threshold regulation.
Arterioscler. Thromb. Vasc. Biol. 25:2463-2469.
54. Khibnik, A. I. and A. S. Kondrashov. 1997. Three mechanisms of Red Queen dynamics. Proc. R. Soc.
Lond. B 264:1049-1056.
55. Xu, C. Q., Y. J. Zeng, and H. Gregersen. 2002. Dynamic model of the role of platelets in the blood
coagulation system. Med. Eng Phys. 24:587-593.
56. Levine, S. N. 1966. Enzyme amplifier kinetics. Science 152:651-653.