Embed Size (px)
Citation preview
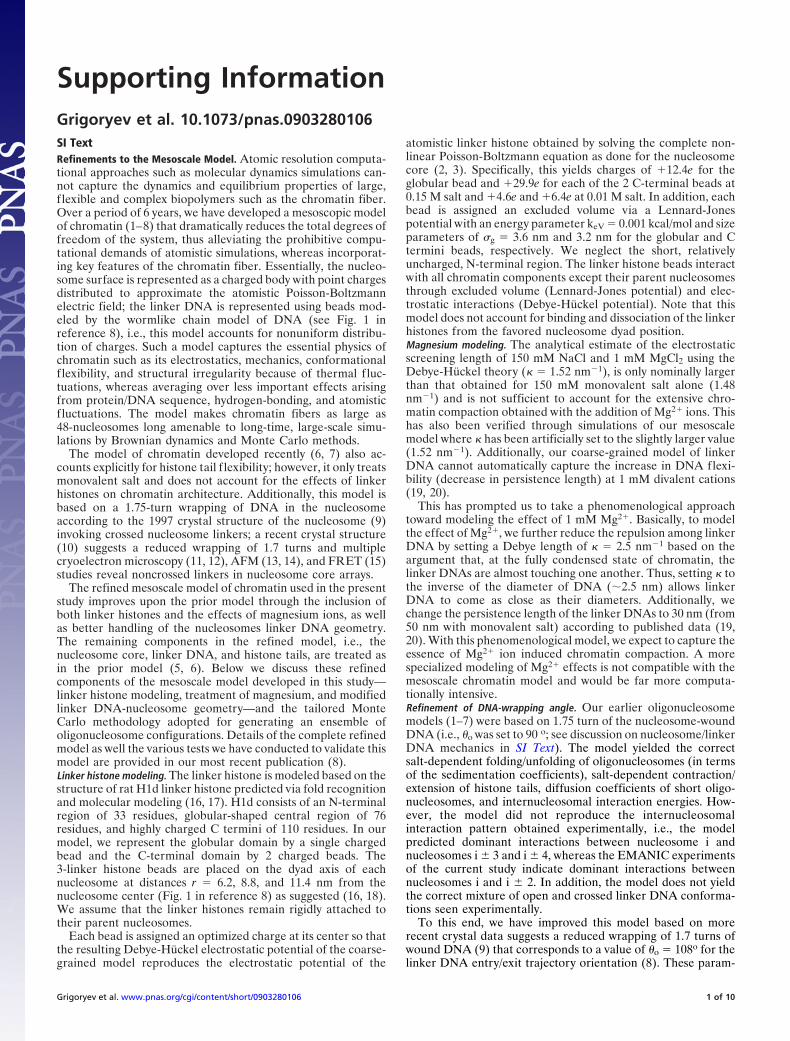
Supporting InformationGrigoryev et al. 10.1073/pnas.0903280106SI TextRefinements to the Mesoscale Model. Atomic resolution computa-tional approaches such as molecular dynamics simulations can-not capture the dynamics and equilibrium properties of large,f lexible and complex biopolymers such as the chromatin fiber.Over a period of 6 years, we have developed a mesoscopic modelof chromatin (1–8) that dramatically reduces the total degrees offreedom of the system, thus alleviating the prohibitive compu-tational demands of atomistic simulations, whereas incorporat-ing key features of the chromatin fiber. Essentially, the nucleo-some surface is represented as a charged body with point chargesdistributed to approximate the atomistic Poisson-Boltzmannelectric field; the linker DNA is represented using beads mod-eled by the wormlike chain model of DNA (see Fig. 1 inreference 8), i.e., this model accounts for nonuniform distribu-tion of charges. Such a model captures the essential physics ofchromatin such as its electrostatics, mechanics, conformationalf lexibility, and structural irregularity because of thermal fluc-tuations, whereas averaging over less important effects arisingfrom protein/DNA sequence, hydrogen-bonding, and atomisticf luctuations. The model makes chromatin fibers as large as48-nucleosomes long amenable to long-time, large-scale simu-lations by Brownian dynamics and Monte Carlo methods.
The model of chromatin developed recently (6, 7) also ac-counts explicitly for histone tail f lexibility; however, it only treatsmonovalent salt and does not account for the effects of linkerhistones on chromatin architecture. Additionally, this model isbased on a 1.75-turn wrapping of DNA in the nucleosomeaccording to the 1997 crystal structure of the nucleosome (9)invoking crossed nucleosome linkers; a recent crystal structure(10) suggests a reduced wrapping of 1.7 turns and multiplecryoelectron microscopy (11, 12), AFM (13, 14), and FRET (15)studies reveal noncrossed linkers in nucleosome core arrays.
The refined mesoscale model of chromatin used in the presentstudy improves upon the prior model through the inclusion ofboth linker histones and the effects of magnesium ions, as wellas better handling of the nucleosomes linker DNA geometry.The remaining components in the refined model, i.e., thenucleosome core, linker DNA, and histone tails, are treated asin the prior model (5, 6). Below we discuss these refinedcomponents of the mesoscale model developed in this study—linker histone modeling, treatment of magnesium, and modifiedlinker DNA-nucleosome geometry—and the tailored MonteCarlo methodology adopted for generating an ensemble ofoligonucleosome configurations. Details of the complete refinedmodel as well the various tests we have conducted to validate thismodel are provided in our most recent publication (8).Linker histone modeling. The linker histone is modeled based on thestructure of rat H1d linker histone predicted via fold recognitionand molecular modeling (16, 17). H1d consists of an N-terminalregion of 33 residues, globular-shaped central region of 76residues, and highly charged C termini of 110 residues. In ourmodel, we represent the globular domain by a single chargedbead and the C-terminal domain by 2 charged beads. The3-linker histone beads are placed on the dyad axis of eachnucleosome at distances r � 6.2, 8.8, and 11.4 nm from thenucleosome center (Fig. 1 in reference 8) as suggested (16, 18).We assume that the linker histones remain rigidly attached totheir parent nucleosomes.
Each bead is assigned an optimized charge at its center so thatthe resulting Debye-Huckel electrostatic potential of the coarse-grained model reproduces the electrostatic potential of the
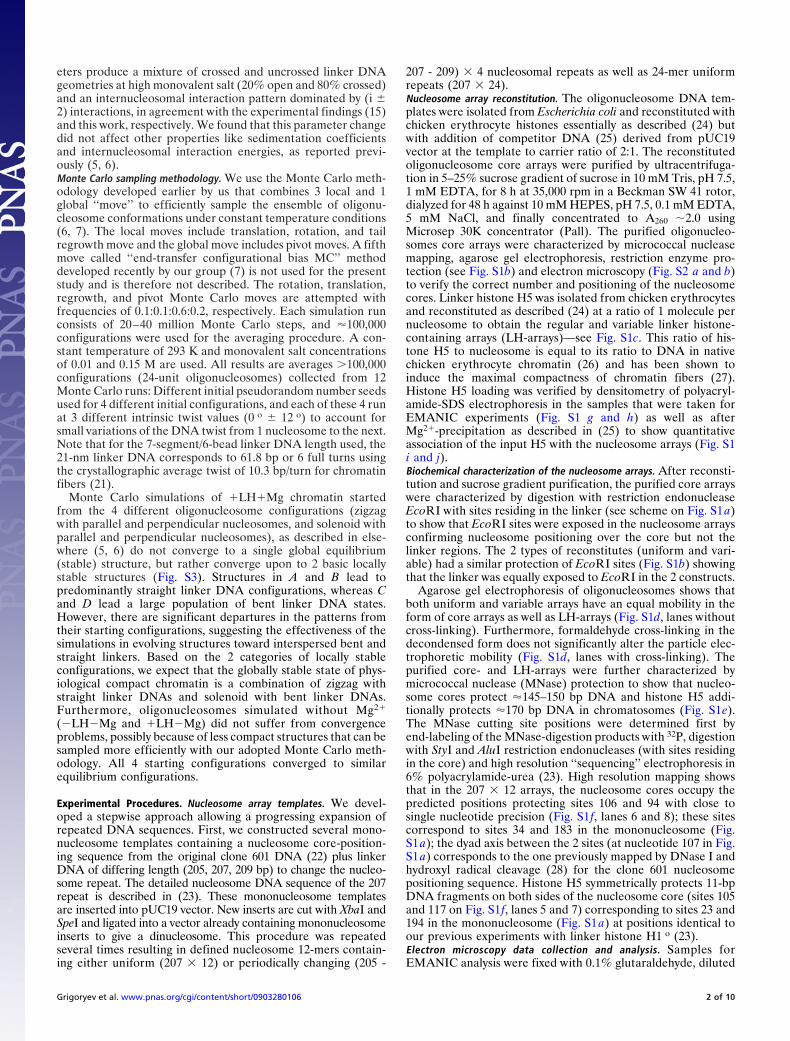
atomistic linker histone obtained by solving the complete non-linear Poisson-Boltzmann equation as done for the nucleosomecore (2, 3). Specifically, this yields charges of �12.4e for theglobular bead and �29.9e for each of the 2 C-terminal beads at0.15 M salt and �4.6e and �6.4e at 0.01 M salt. In addition, eachbead is assigned an excluded volume via a Lennard-Jonespotential with an energy parameter keV � 0.001 kcal/mol and sizeparameters of �g � 3.6 nm and 3.2 nm for the globular and Ctermini beads, respectively. We neglect the short, relativelyuncharged, N-terminal region. The linker histone beads interactwith all chromatin components except their parent nucleosomesthrough excluded volume (Lennard-Jones potential) and elec-trostatic interactions (Debye-Huckel potential). Note that thismodel does not account for binding and dissociation of the linkerhistones from the favored nucleosome dyad position.Magnesium modeling. The analytical estimate of the electrostaticscreening length of 150 mM NaCl and 1 mM MgCl2 using theDebye-Huckel theory (� � 1.52 nm�1), is only nominally largerthan that obtained for 150 mM monovalent salt alone (1.48nm�1) and is not sufficient to account for the extensive chro-matin compaction obtained with the addition of Mg2� ions. Thishas also been verified through simulations of our mesoscalemodel where � has been artificially set to the slightly larger value(1.52 nm�1). Additionally, our coarse-grained model of linkerDNA cannot automatically capture the increase in DNA flexi-bility (decrease in persistence length) at 1 mM divalent cations(19, 20).
This has prompted us to take a phenomenological approachtoward modeling the effect of 1 mM Mg2�. Basically, to modelthe effect of Mg2�, we further reduce the repulsion among linkerDNA by setting a Debye length of � � 2.5 nm�1 based on theargument that, at the fully condensed state of chromatin, thelinker DNAs are almost touching one another. Thus, setting � tothe inverse of the diameter of DNA (�2.5 nm) allows linkerDNA to come as close as their diameters. Additionally, wechange the persistence length of the linker DNAs to 30 nm (from50 nm with monovalent salt) according to published data (19,20). With this phenomenological model, we expect to capture theessence of Mg2� ion induced chromatin compaction. A morespecialized modeling of Mg2� effects is not compatible with themesoscale chromatin model and would be far more computa-tionally intensive.Refinement of DNA-wrapping angle. Our earlier oligonucleosomemodels (1–7) were based on 1.75 turn of the nucleosome-woundDNA (i.e., �o was set to 90 o; see discussion on nucleosome/linkerDNA mechanics in SI Text). The model yielded the correctsalt-dependent folding/unfolding of oligonucleosomes (in termsof the sedimentation coefficients), salt-dependent contraction/extension of histone tails, diffusion coefficients of short oligo-nucleosomes, and internucleosomal interaction energies. How-ever, the model did not reproduce the internucleosomalinteraction pattern obtained experimentally, i.e., the modelpredicted dominant interactions between nucleosome i andnucleosomes i � 3 and i � 4, whereas the EMANIC experimentsof the current study indicate dominant interactions betweennucleosomes i and i � 2. In addition, the model does not yieldthe correct mixture of open and crossed linker DNA conforma-tions seen experimentally.
To this end, we have improved this model based on morerecent crystal data suggests a reduced wrapping of 1.7 turns ofwound DNA (9) that corresponds to a value of �o � 108o for thelinker DNA entry/exit trajectory orientation (8). These param-
Grigoryev et al. www.pnas.org/cgi/content/short/0903280106 1 of 10
eters produce a mixture of crossed and uncrossed linker DNAgeometries at high monovalent salt (20% open and 80% crossed)and an internucleosomal interaction pattern dominated by (i �2) interactions, in agreement with the experimental findings (15)and this work, respectively. We found that this parameter changedid not affect other properties like sedimentation coefficientsand internucleosomal interaction energies, as reported previ-ously (5, 6).Monte Carlo sampling methodology. We use the Monte Carlo meth-odology developed earlier by us that combines 3 local and 1global ‘‘move’’ to efficiently sample the ensemble of oligonu-cleosome conformations under constant temperature conditions(6, 7). The local moves include translation, rotation, and tailregrowth move and the global move includes pivot moves. A fifthmove called ‘‘end-transfer configurational bias MC’’ methoddeveloped recently by our group (7) is not used for the presentstudy and is therefore not described. The rotation, translation,regrowth, and pivot Monte Carlo moves are attempted withfrequencies of 0.1:0.1:0.6:0.2, respectively. Each simulation runconsists of 20–40 million Monte Carlo steps, and �100,000configurations were used for the averaging procedure. A con-stant temperature of 293 K and monovalent salt concentrationsof 0.01 and 0.15 M are used. All results are averages �100,000configurations (24-unit oligonucleosomes) collected from 12Monte Carlo runs: Different initial pseudorandom number seedsused for 4 different initial configurations, and each of these 4 runat 3 different intrinsic twist values (0 o � 12 o) to account forsmall variations of the DNA twist from 1 nucleosome to the next.Note that for the 7-segment/6-bead linker DNA length used, the21-nm linker DNA corresponds to 61.8 bp or 6 full turns usingthe crystallographic average twist of 10.3 bp/turn for chromatinfibers (21).
Monte Carlo simulations of �LH�Mg chromatin startedfrom the 4 different oligonucleosome configurations (zigzagwith parallel and perpendicular nucleosomes, and solenoid withparallel and perpendicular nucleosomes), as described in else-where (5, 6) do not converge to a single global equilibrium(stable) structure, but rather converge upon to 2 basic locallystable structures (Fig. S3). Structures in A and B lead topredominantly straight linker DNA configurations, whereas Cand D lead a large population of bent linker DNA states.However, there are significant departures in the patterns fromtheir starting configurations, suggesting the effectiveness of thesimulations in evolving structures toward interspersed bent andstraight linkers. Based on the 2 categories of locally stableconfigurations, we expect that the globally stable state of phys-iological compact chromatin is a combination of zigzag withstraight linker DNAs and solenoid with bent linker DNAs.Furthermore, oligonucleosomes simulated without Mg2�
(�LH�Mg and �LH�Mg) did not suffer from convergenceproblems, possibly because of less compact structures that can besampled more efficiently with our adopted Monte Carlo meth-odology. All 4 starting configurations converged to similarequilibrium configurations.
Experimental Procedures. Nucleosome array templates. We devel-oped a stepwise approach allowing a progressing expansion ofrepeated DNA sequences. First, we constructed several mono-nucleosome templates containing a nucleosome core-position-ing sequence from the original clone 601 DNA (22) plus linkerDNA of differing length (205, 207, 209 bp) to change the nucleo-some repeat. The detailed nucleosome DNA sequence of the 207repeat is described in (23). These mononucleosome templatesare inserted into pUC19 vector. New inserts are cut with XbaI andSpeI and ligated into a vector already containing mononucleosomeinserts to give a dinucleosome. This procedure was repeatedseveral times resulting in defined nucleosome 12-mers contain-ing either uniform (207 � 12) or periodically changing (205 -
207 - 209) � 4 nucleosomal repeats as well as 24-mer uniformrepeats (207 � 24).Nucleosome array reconstitution. The oligonucleosome DNA tem-plates were isolated from Escherichia coli and reconstituted withchicken erythrocyte histones essentially as described (24) butwith addition of competitor DNA (25) derived from pUC19vector at the template to carrier ratio of 2:1. The reconstitutedoligonucleosome core arrays were purified by ultracentrifuga-tion in 5–25% sucrose gradient of sucrose in 10 mM Tris, pH 7.5,1 mM EDTA, for 8 h at 35,000 rpm in a Beckman SW 41 rotor,dialyzed for 48 h against 10 mM HEPES, pH 7.5, 0.1 mM EDTA,5 mM NaCl, and finally concentrated to A260 �2.0 usingMicrosep 30K concentrator (Pall). The purified oligonucleo-somes core arrays were characterized by micrococcal nucleasemapping, agarose gel electrophoresis, restriction enzyme pro-tection (see Fig. S1b) and electron microscopy (Fig. S2 a and b)to verify the correct number and positioning of the nucleosomecores. Linker histone H5 was isolated from chicken erythrocytesand reconstituted as described (24) at a ratio of 1 molecule pernucleosome to obtain the regular and variable linker histone-containing arrays (LH-arrays)—see Fig. S1c. This ratio of his-tone H5 to nucleosome is equal to its ratio to DNA in nativechicken erythrocyte chromatin (26) and has been shown toinduce the maximal compactness of chromatin fibers (27).Histone H5 loading was verified by densitometry of polyacryl-amide-SDS electrophoresis in the samples that were taken forEMANIC experiments (Fig. S1 g and h) as well as afterMg2�-precipitation as described in (25) to show quantitativeassociation of the input H5 with the nucleosome arrays (Fig. S1i and j).Biochemical characterization of the nucleosome arrays. After reconsti-tution and sucrose gradient purification, the purified core arrayswere characterized by digestion with restriction endonucleaseEcoRI with sites residing in the linker (see scheme on Fig. S1 a)to show that EcoRI sites were exposed in the nucleosome arraysconfirming nucleosome positioning over the core but not thelinker regions. The 2 types of reconstitutes (uniform and vari-able) had a similar protection of EcoRI sites (Fig. S1b) showingthat the linker was equally exposed to EcoRI in the 2 constructs.
Agarose gel electrophoresis of oligonucleosomes shows thatboth uniform and variable arrays have an equal mobility in theform of core arrays as well as LH-arrays (Fig. S1d, lanes withoutcross-linking). Furthermore, formaldehyde cross-linking in thedecondensed form does not significantly alter the particle elec-trophoretic mobility (Fig. S1d, lanes with cross-linking). Thepurified core- and LH-arrays were further characterized bymicrococcal nuclease (MNase) protection to show that nucleo-some cores protect �145–150 bp DNA and histone H5 addi-tionally protects �170 bp DNA in chromatosomes (Fig. S1e).The MNase cutting site positions were determined first byend-labeling of the MNase-digestion products with 32P, digestionwith StyI and AluI restriction endonucleases (with sites residingin the core) and high resolution ‘‘sequencing’’ electrophoresis in6% polyacrylamide-urea (23). High resolution mapping showsthat in the 207 � 12 arrays, the nucleosome cores occupy thepredicted positions protecting sites 106 and 94 with close tosingle nucleotide precision (Fig. S1f, lanes 6 and 8); these sitescorrespond to sites 34 and 183 in the mononucleosome (Fig.S1a); the dyad axis between the 2 sites (at nucleotide 107 in Fig.S1a) corresponds to the one previously mapped by DNase I andhydroxyl radical cleavage (28) for the clone 601 nucleosomepositioning sequence. Histone H5 symmetrically protects 11-bpDNA fragments on both sides of the nucleosome core (sites 105and 117 on Fig. S1f, lanes 5 and 7) corresponding to sites 23 and194 in the mononucleosome (Fig. S1 a) at positions identical toour previous experiments with linker histone H1 o (23).Electron microscopy data collection and analysis. Samples forEMANIC analysis were fixed with 0.1% glutaraldehyde, diluted
Grigoryev et al. www.pnas.org/cgi/content/short/0903280106 2 of 10
10–20 times with 50 mM NaCl, and applied to carbon-coatedglow-discharged EM grids. Grids were stained with 0.1% uranylacetate. Some grids were additionally shadowed with platinum atan angle of 10 o using electron gun evaporation. TransmissionEM of noncross-linked nucleosome arrays was conducted indark-field mode as before (23). For each sample, nucleosomalarrays containing 12 distinguishable nucleosome cores wereselected to score internucleosome interactions. Internucleoso-mal interactions were scored as positive if nucleosome-size disks(diameter 110 Å) centered over the nucleosome beads on theEM image contacted each other. Standard deviations and stan-
dard error of mean were obtained from at least 2 independentlyreconstituted samples, each fixed, prepared, and counted intriplicate (�400 nucleosomes per count). P values representprobability associated with a Student’s 2-sample unequal vari-ance t test with a 2-tailed distribution.Analytical ultracentrifugation. To monitor nucleosome array folding(secondary chromatin structure), we conducted sedimentationvelocity experiments using Beckman Optima XL-A ultracentri-fuge (31). Sedimentation velocity analysis was conducted usingthe continuous c(s) distribution model (32) with SEDFIT soft-ware (http://www.analyticalultracentrifugation.com).
1. Beard DA, Schlick T (2001) Computational modeling predicts the structure and dynam-ics of chromatin fiber. Structure 9:105–114.
2. Beard DA, Schlick T (2001) Modeling salt-mediated electrostatics of macromolecules:The discrete surface charge optimization algorithm and its application to the nucleo-some. Biopolymers 58:106–115.
3. Zhang Q, Beard DA, Schlick T (2003) Constructing irregular surfaces to enclose macro-molecular complexes for mesoscale modeling using the discrete surface charge opti-mization (DISCO) algorithm. J Comput Chem 24:2063–2074.
4. Sun J, Zhang Q, Schlick T (2005) Electrostatic mechanism of nucleosomal array foldingrevealed by computer simulation. Proc Natl Acad Sci USA 102:8180–8185.
5. Arya G, Schlick T (2006) Role of histone tails in chromatin folding revealed by amesoscopic oligonucleosome model. Proc Natl Acad Sci USA 103:16236–16241.
6. Arya G, Zhang Q, Schlick T (2006) Flexible histone tails in a new mesoscopic oligonu-cleosome model. Biophys J 91:133–150.
7. Arya G, Schlick T (2007) Efficient global biopolymer sampling with end-transfer con-figurational bias Monte Carlo. J Chem Phys 126:044107.
8. Arya G, Schlick T (2009) A tale of tails: How histone tails mediate chromatin compactionin different salt and linker histone environments. J Phys Chem A 113:4045–4059.
9. Luger K, Mader AW, Richmond RK, Sargent DF, Richmond TJ (1997) Crystal structure ofthe nucleosome core particle at 2.8Å resolution. Nature 389:251–260.
10. Davey CA, Sargent DF, Luger K, Maeder AW, Richmond TJ (2002) Solvent mediatedinteractions in the structure of the nucleosome core particle at 1.9Å resolution. J MolBiol 319:1097–1113.
11. Bednar J, Horowitz RA, Dubochet J, Woodcock CL (1995) Chromatin conformation andsalt-induced compaction: Three-dimensional structural information from cryoelectronmicroscopy. J Cell Biol 131:1365–1376.
12. Carruthers LM, Hansen JC (2000) The core histone N termini function independently oflinker histonesduring chromatin condensation. J Biol Chem 275:37285–37290.
13. van Holde K, Zlatanova J (1996) What determines the folding of the chromatin fiber?Proc Natl Acad Sci USA 93:10548–10555.
14. Kepert JF, et al. (2003) Conformation of reconstituted mononucleosomes and effect oflinker histone H1 binding studied by scanning force microscopy. Biophys J 85:4012–4022.
15. Toth K, Brun N, Langowski J (2006) Chromatin compaction at the mononucleosomelevel. Biochemistry 45:1591–1598.
16. Bharath MM, Chandra NR, Rao MR (2003) Molecular modeling of the chromatosomeparticle. Nucleic Acids Res 31:4264–4274.
17. Bharath MM, Chandra NR, Rao MR (2002) Predictions of an HMG-box fold in theC-terminal domain of histone H1: Insights into its role in DNA condensation. Proteins49:71–81.
18. Sheng S, Czajkowsky DM, Shao Z (2006) Localization of linker histone in chromato-somes by cryo-atomic force microscopy. Biophys J 91:L35–L37.
19. Rouzina I, Bloomfield VA (1998) DNA bending by small, mobile multivalent cations.Biophys J 74:3152–3164.
20. Baumann CG, Smith SB, Bloomfield VA, Bustamante C (1997) Ionic effects on theelasticity of single DNA molecules. Proc Natl Acad Sci USA 94:6185–6190.
21. Richmond TJ, Davey CA (2003) The structure of DNA in the nucleosome core. Nature423:145–150.
22. Lowary PT, Widom J (1998) New DNA sequence rules for high affinity binding to histoneoctamer and sequence-directed nucleosome positioning. J Mol Biol 276:19–42.
23. Nikitina T, et al. (2007) MeCP2-Chromatin interactions include the formation ofchromatosome-like structures and are altered in mutations causing Rett syndrome.J Biol Chem 282:28237–28245.
24. Springhetti EM, et al. (2003) Role of the M-loop and reactive center loop domains in thefolding and bridging of nucleosome arrays by MENT. J Biol Chem 278:43384–43393.
25. Huynh VAT, Robinson PJJ, Rhodes D (2005) A method for the in vivo reconstitution ofa defined 30 nm chromatin fiber containing stoichiometric amounts of the linkerhistone. J Mol Biol 345:957–968.
26. Bates DL, Thomas JO (1981) Histones H1 and H5: One or two molecules per nucleo-some? Nucleic Acids Res 9:5883–5894.
27. Robinson PJ, Fairall L, Huynh VA, Rhodes D (2006) EM measurements define thedimensions of the ‘‘30-nm’’ chromatin fiber: Evidence for a compact, interdigitatedstructure. Proc Natl Acad Sci USA 103:6506–6511.
28. Wu C, Travers A (2004) A ‘one-pot’ assay for the accessibility of DNA in a nucleosomecore particle. Nucleic Acids Res 32:e122.
29. Schwarz PM, Felthauser A, Fletcher TM, Hansen JC (1996) Reversible oligonucleosomeself-association: Dependence on divalent cations and core histone tail domains. Bio-chemistry 35:4009–4015.
30. Woodcock CL, Dimitrov S (2001) Higher order structure of chromatin and chromo-somes. Curr Opin in Gen Dev 11:130–135.
31. Carruthers LM, Schirf VR, Demeler B, Hansen JC (2000) Sedimentation velocity analysisof macromolecular assemblies. Methods Enzymol 321:66–80.
32. Schuck P (2000) Size-distribution analysis of macromoleculars by sedimentation veloc-ity ultracentrifugation and lamm equation modeling. Biophys J 78:1606–1619.
Grigoryev et al. www.pnas.org/cgi/content/short/0903280106 3 of 10
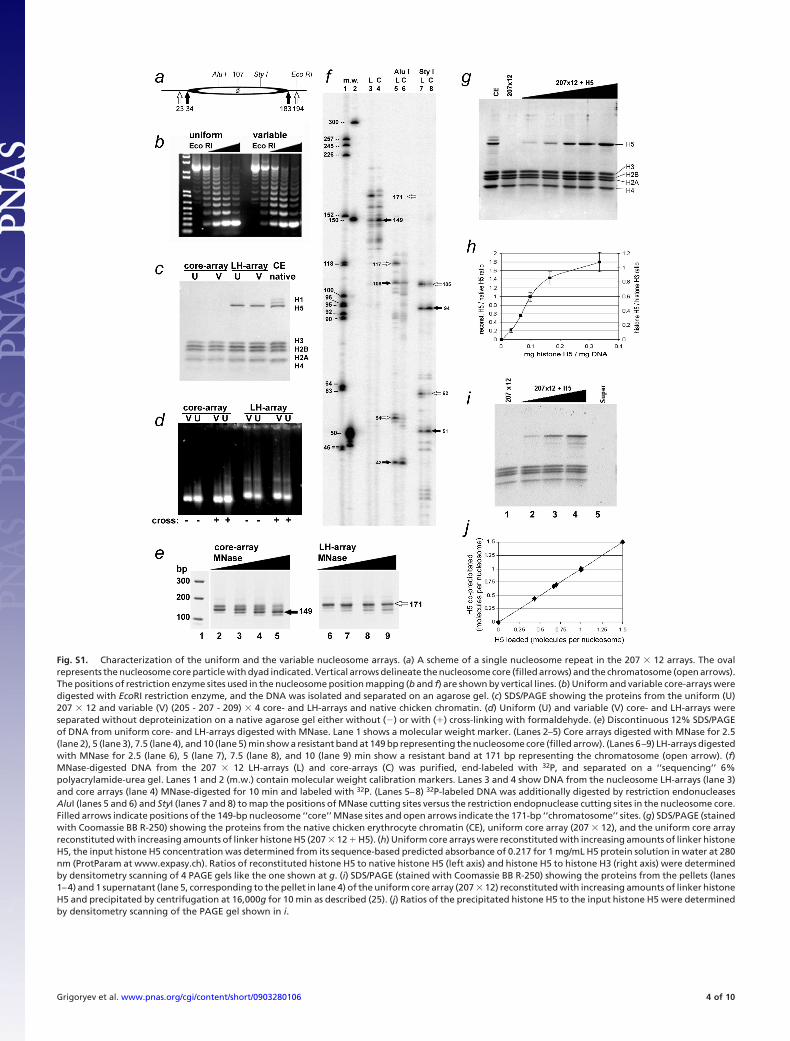
Fig. S1. Characterization of the uniform and the variable nucleosome arrays. (a) A scheme of a single nucleosome repeat in the 207 � 12 arrays. The ovalrepresents the nucleosome core particle with dyad indicated. Vertical arrows delineate the nucleosome core (filled arrows) and the chromatosome (open arrows).The positions of restriction enzyme sites used in the nucleosome position mapping (b and f) are shown by vertical lines. (b) Uniform and variable core-arrays weredigested with EcoRI restriction enzyme, and the DNA was isolated and separated on an agarose gel. (c) SDS/PAGE showing the proteins from the uniform (U)207 � 12 and variable (V) (205 - 207 - 209) � 4 core- and LH-arrays and native chicken chromatin. (d) Uniform (U) and variable (V) core- and LH-arrays wereseparated without deproteinization on a native agarose gel either without (�) or with (�) cross-linking with formaldehyde. (e) Discontinuous 12% SDS/PAGEof DNA from uniform core- and LH-arrays digested with MNase. Lane 1 shows a molecular weight marker. (Lanes 2–5) Core arrays digested with MNase for 2.5(lane 2), 5 (lane 3), 7.5 (lane 4), and 10 (lane 5) min show a resistant band at 149 bp representing the nucleosome core (filled arrow). (Lanes 6–9) LH-arrays digestedwith MNase for 2.5 (lane 6), 5 (lane 7), 7.5 (lane 8), and 10 (lane 9) min show a resistant band at 171 bp representing the chromatosome (open arrow). (f)MNase-digested DNA from the 207 � 12 LH-arrays (L) and core-arrays (C) was purified, end-labeled with 32P, and separated on a ‘‘sequencing’’ 6%polyacrylamide-urea gel. Lanes 1 and 2 (m.w.) contain molecular weight calibration markers. Lanes 3 and 4 show DNA from the nucleosome LH-arrays (lane 3)and core arrays (lane 4) MNase-digested for 10 min and labeled with 32P. (Lanes 5–8) 32P-labeled DNA was additionally digested by restriction endonucleasesAluI (lanes 5 and 6) and StyI (lanes 7 and 8) to map the positions of MNase cutting sites versus the restriction endopnuclease cutting sites in the nucleosome core.Filled arrows indicate positions of the 149-bp nucleosome ‘‘core’’ MNase sites and open arrows indicate the 171-bp ‘‘chromatosome’’ sites. (g) SDS/PAGE (stainedwith Coomassie BB R-250) showing the proteins from the native chicken erythrocyte chromatin (CE), uniform core array (207 � 12), and the uniform core arrayreconstituted with increasing amounts of linker histone H5 (207 � 12 � H5). (h) Uniform core arrays were reconstituted with increasing amounts of linker histoneH5, the input histone H5 concentration was determined from its sequence-based predicted absorbance of 0.217 for 1 mg/mL H5 protein solution in water at 280nm (ProtParam at www.expasy.ch). Ratios of reconstituted histone H5 to native histone H5 (left axis) and histone H5 to histone H3 (right axis) were determinedby densitometry scanning of 4 PAGE gels like the one shown at g. (i) SDS/PAGE (stained with Coomassie BB R-250) showing the proteins from the pellets (lanes1–4) and 1 supernatant (lane 5, corresponding to the pellet in lane 4) of the uniform core array (207 � 12) reconstituted with increasing amounts of linker histoneH5 and precipitated by centrifugation at 16,000g for 10 min as described (25). (j) Ratios of the precipitated histone H5 to the input histone H5 were determinedby densitometry scanning of the PAGE gel shown in i.
Grigoryev et al. www.pnas.org/cgi/content/short/0903280106 4 of 10
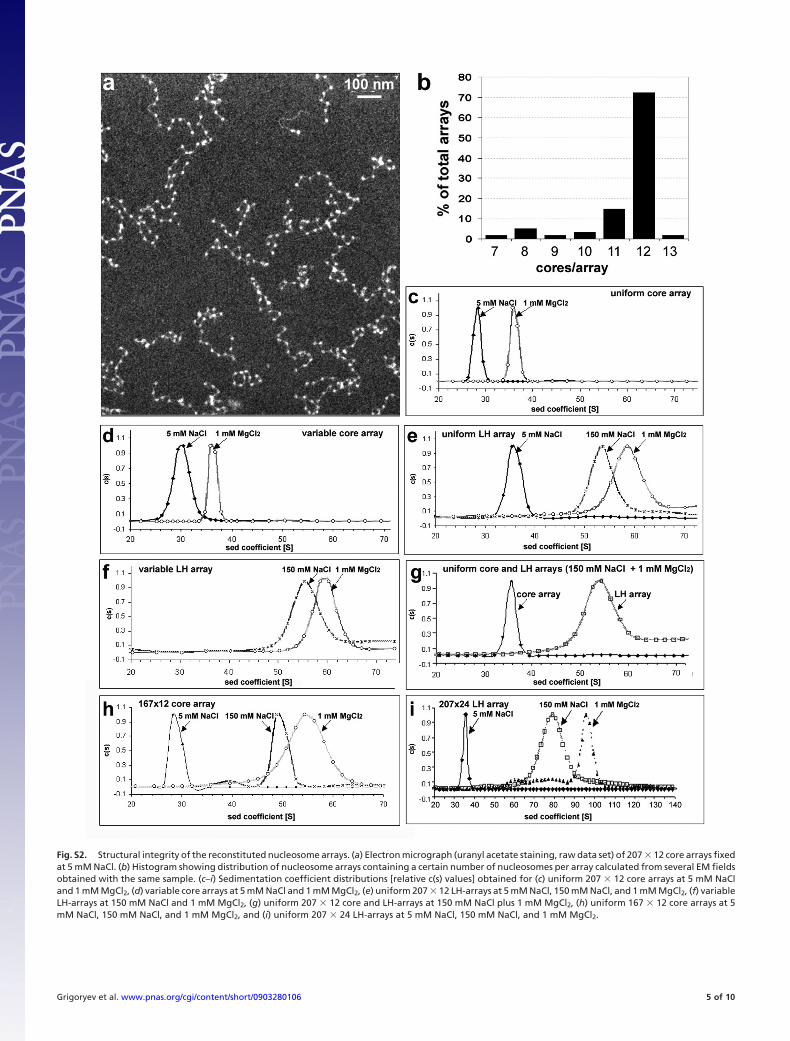
Fig. S2. Structural integrity of the reconstituted nucleosome arrays. (a) Electron micrograph (uranyl acetate staining, raw data set) of 207 � 12 core arrays fixedat 5 mM NaCl. (b) Histogram showing distribution of nucleosome arrays containing a certain number of nucleosomes per array calculated from several EM fieldsobtained with the same sample. (c–i) Sedimentation coefficient distributions [relative c(s) values] obtained for (c) uniform 207 � 12 core arrays at 5 mM NaCland 1 mM MgCl2, (d) variable core arrays at 5 mM NaCl and 1 mM MgCl2, (e) uniform 207 � 12 LH-arrays at 5 mM NaCl, 150 mM NaCl, and 1 mM MgCl2, (f) variableLH-arrays at 150 mM NaCl and 1 mM MgCl2, (g) uniform 207 � 12 core and LH-arrays at 150 mM NaCl plus 1 mM MgCl2, (h) uniform 167 � 12 core arrays at 5mM NaCl, 150 mM NaCl, and 1 mM MgCl2, and (i) uniform 207 � 24 LH-arrays at 5 mM NaCl, 150 mM NaCl, and 1 mM MgCl2.
Grigoryev et al. www.pnas.org/cgi/content/short/0903280106 5 of 10
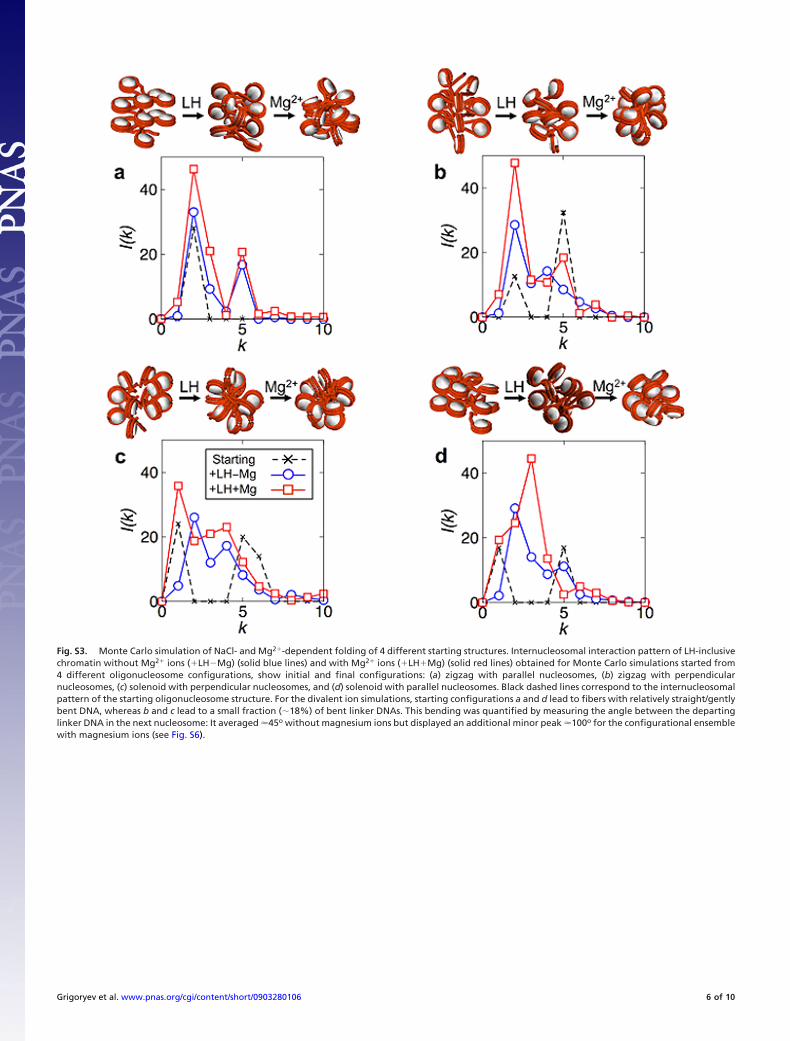
Fig. S3. Monte Carlo simulation of NaCl- and Mg2�-dependent folding of 4 different starting structures. Internucleosomal interaction pattern of LH-inclusivechromatin without Mg2� ions (�LH�Mg) (solid blue lines) and with Mg2� ions (�LH�Mg) (solid red lines) obtained for Monte Carlo simulations started from4 different oligonucleosome configurations, show initial and final configurations: (a) zigzag with parallel nucleosomes, (b) zigzag with perpendicularnucleosomes, (c) solenoid with perpendicular nucleosomes, and (d) solenoid with parallel nucleosomes. Black dashed lines correspond to the internucleosomalpattern of the starting oligonucleosome structure. For the divalent ion simulations, starting configurations a and d lead to fibers with relatively straight/gentlybent DNA, whereas b and c lead to a small fraction (�18%) of bent linker DNAs. This bending was quantified by measuring the angle between the departinglinker DNA in the next nucleosome: It averaged �45o without magnesium ions but displayed an additional minor peak �100o for the configurational ensemblewith magnesium ions (see Fig. S6).
Grigoryev et al. www.pnas.org/cgi/content/short/0903280106 6 of 10
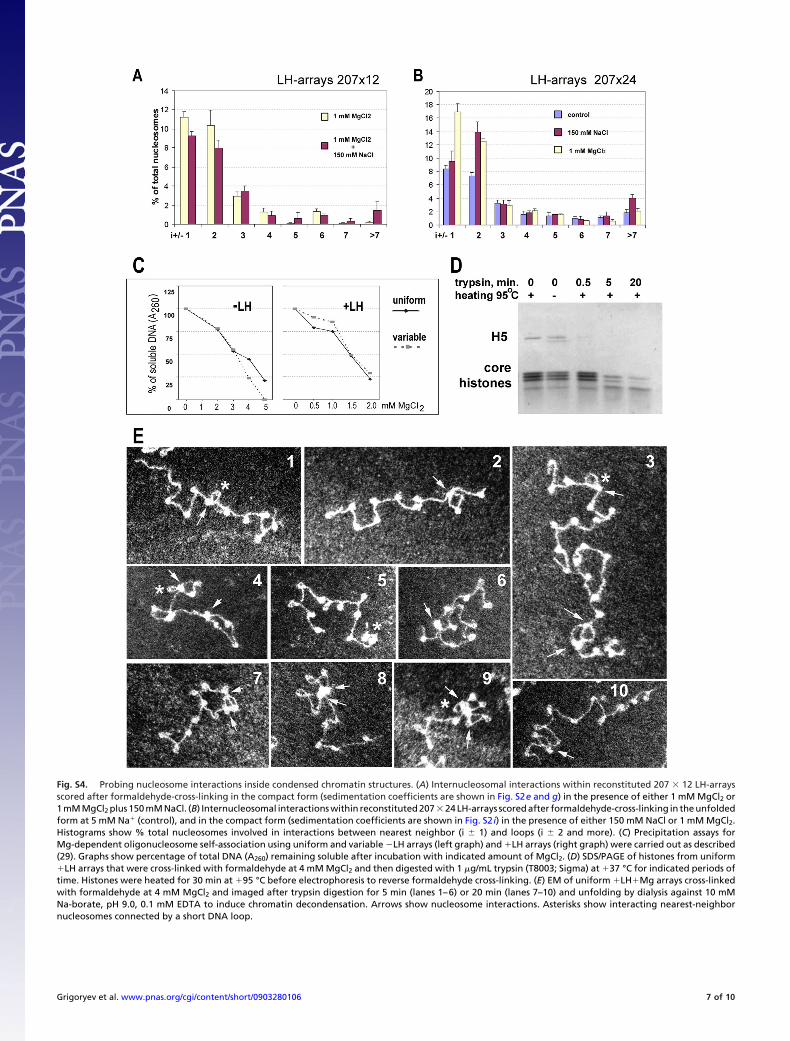
Fig. S4. Probing nucleosome interactions inside condensed chromatin structures. (A) Internucleosomal interactions within reconstituted 207 � 12 LH-arraysscored after formaldehyde-cross-linking in the compact form (sedimentation coefficients are shown in Fig. S2e and g) in the presence of either 1 mM MgCl2 or1 mM MgCl2 plus 150 mM NaCl. (B) Internucleosomal interactions within reconstituted 207 � 24 LH-arrays scored after formaldehyde-cross-linking in the unfoldedform at 5 mM Na� (control), and in the compact form (sedimentation coefficients are shown in Fig. S2 i) in the presence of either 150 mM NaCl or 1 mM MgCl2.Histograms show % total nucleosomes involved in interactions between nearest neighbor (i � 1) and loops (i � 2 and more). (C) Precipitation assays forMg-dependent oligonucleosome self-association using uniform and variable �LH arrays (left graph) and �LH arrays (right graph) were carried out as described(29). Graphs show percentage of total DNA (A260) remaining soluble after incubation with indicated amount of MgCl2. (D) SDS/PAGE of histones from uniform�LH arrays that were cross-linked with formaldehyde at 4 mM MgCl2 and then digested with 1 �g/mL trypsin (T8003; Sigma) at �37 °C for indicated periods oftime. Histones were heated for 30 min at �95 °C before electrophoresis to reverse formaldehyde cross-linking. (E) EM of uniform �LH�Mg arrays cross-linkedwith formaldehyde at 4 mM MgCl2 and imaged after trypsin digestion for 5 min (lanes 1–6) or 20 min (lanes 7–10) and unfolding by dialysis against 10 mMNa-borate, pH 9.0, 0.1 mM EDTA to induce chromatin decondensation. Arrows show nucleosome interactions. Asterisks show interacting nearest-neighbornucleosomes connected by a short DNA loop.
Grigoryev et al. www.pnas.org/cgi/content/short/0903280106 7 of 10
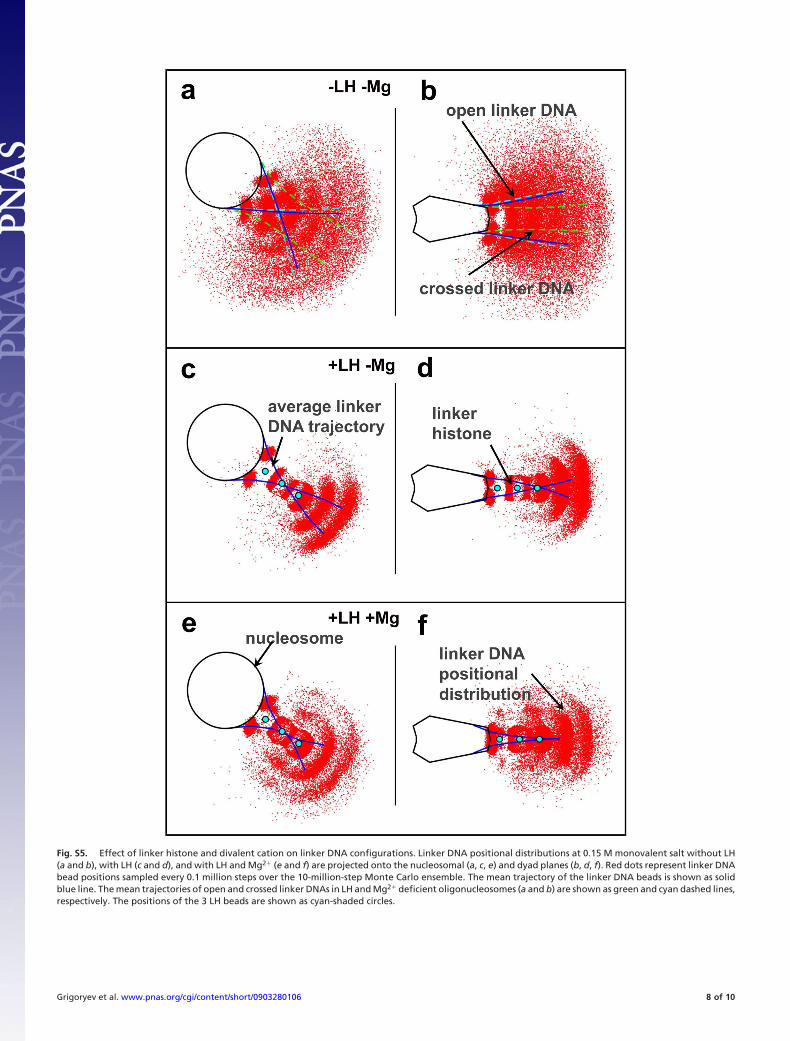
Fig. S5. Effect of linker histone and divalent cation on linker DNA configurations. Linker DNA positional distributions at 0.15 M monovalent salt without LH(a and b), with LH (c and d), and with LH and Mg2� (e and f) are projected onto the nucleosomal (a, c, e) and dyad planes (b, d, f). Red dots represent linker DNAbead positions sampled every 0.1 million steps over the 10-million-step Monte Carlo ensemble. The mean trajectory of the linker DNA beads is shown as solidblue line. The mean trajectories of open and crossed linker DNAs in LH and Mg2� deficient oligonucleosomes (a and b) are shown as green and cyan dashed lines,respectively. The positions of the 3 LH beads are shown as cyan-shaded circles.
Grigoryev et al. www.pnas.org/cgi/content/short/0903280106 8 of 10
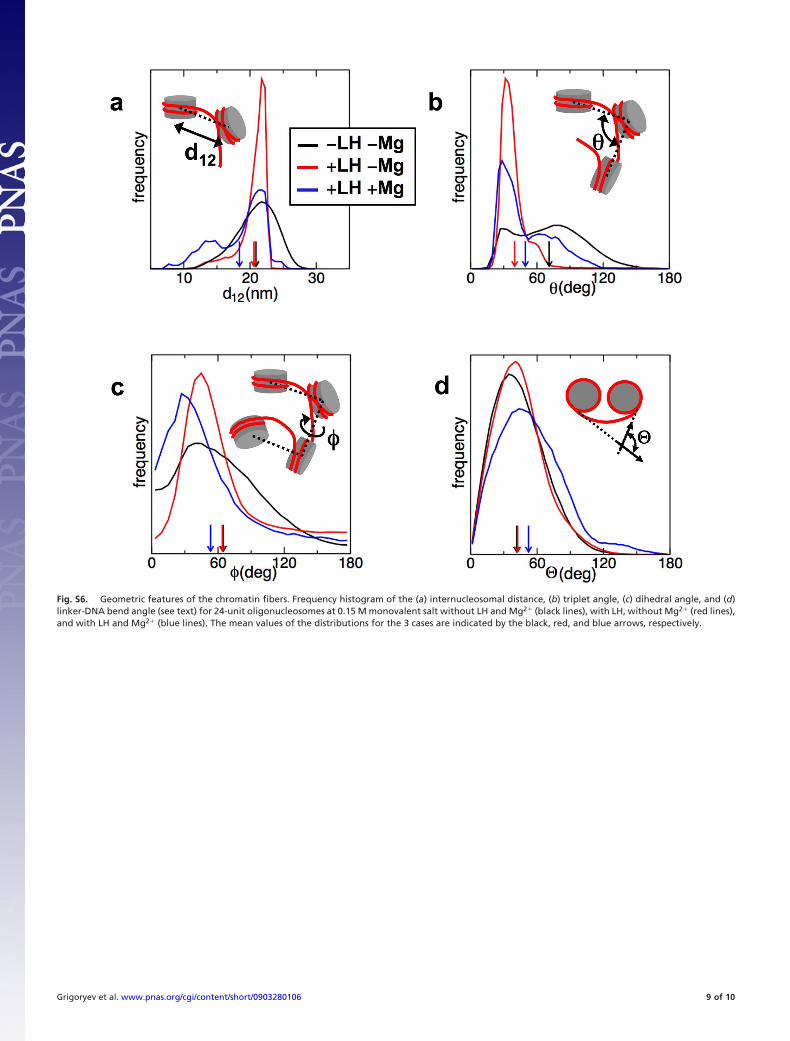
Fig. S6. Geometric features of the chromatin fibers. Frequency histogram of the (a) internucleosomal distance, (b) triplet angle, (c) dihedral angle, and (d)linker-DNA bend angle (see text) for 24-unit oligonucleosomes at 0.15 M monovalent salt without LH and Mg2� (black lines), with LH, without Mg2� (red lines),and with LH and Mg2� (blue lines). The mean values of the distributions for the 3 cases are indicated by the black, red, and blue arrows, respectively.
Grigoryev et al. www.pnas.org/cgi/content/short/0903280106 9 of 10
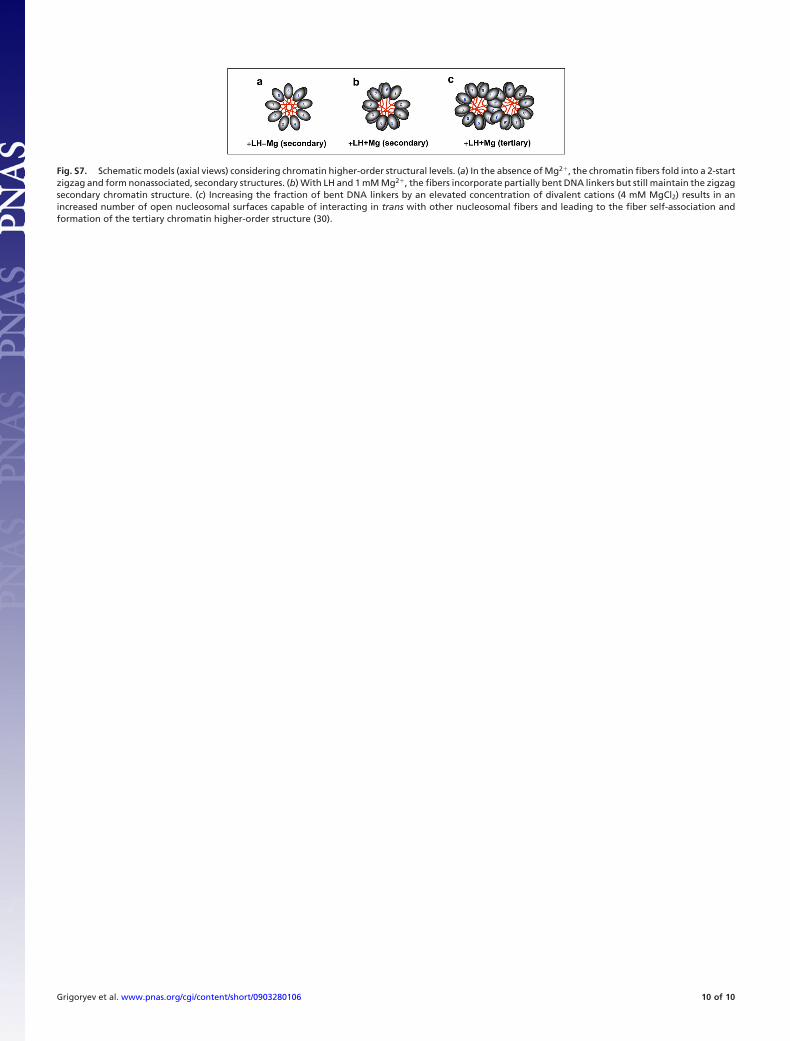
Fig. S7. Schematic models (axial views) considering chromatin higher-order structural levels. (a) In the absence of Mg2�, the chromatin fibers fold into a 2-startzigzag and form nonassociated, secondary structures. (b) With LH and 1 mM Mg2�, the fibers incorporate partially bent DNA linkers but still maintain the zigzagsecondary chromatin structure. (c) Increasing the fraction of bent DNA linkers by an elevated concentration of divalent cations (4 mM MgCl2) results in anincreased number of open nucleosomal surfaces capable of interacting in trans with other nucleosomal fibers and leading to the fiber self-association andformation of the tertiary chromatin higher-order structure (30).
Grigoryev et al. www.pnas.org/cgi/content/short/0903280106 10 of 10