Embed Size (px)
Citation preview
Supporting InformationDemir et al. 10.1073/pnas.1211667110SI Materials and MethodsPurification of Plasma Membrane Vesicles from Arabidopsis thalianaLeaves. A. thaliana columbia-0 ecotype leaves including petioleswere harvested after 7 to 8 wk under a short-day light regime (8 hlight/16 h darkness) and immediately homogenized in a Waringblender (Waring Laboratory Science) using a homogenizationbuffer containing 0.33 M sucrose, 50 mM Tris (pH 8), 3 mMEDTA, 1 mM DTT, 4% (wt/vol) polyvinylpolypyrrolidone (PVPP),and protease inhibitor mixtures (Roche). The homogenate wasfiltered through two layers of Miracloth (Merck Biosciences). Be-ginning with a low-speed centrifugation at 15,000 × g (4 °C) for 30min to remove cell debris, an ultracentrifugation of the supernatantat 100,000 × g (4 °C) for 1 h yielded the microsomal fractioncontaining almost all endomembranes. Resuspension of the mi-crosomal fraction was carried out in an appropriate volume ofa two-phase buffer containing 9.5% (vol/vol) sucrose, 6 mM KCl, 5mM K+Pi (pH 7.8), and protease inhibitors. Purification of plasmamembrane (PM) vesicles was achieved by aqueous two-phase par-titioning with a 6.5% (wt/wt) PEG-3350/Dextran T-500 setup sub-sequently followed by an ultracentrifugation of the upper PEGphases containing PM vesicles at 100,000 × g (4 °C) for 1 h. PM wasfurther purified by 0.1 M sodium carbonate treatment.
Depletion of Sterols by Methylcyclodextrin. Sterols were depletedusing 25 mM methyl-β-D-cyclodextrin at 37 °C for 30 min undercontinuous shaking. Ultracentrifugation (100,000 × g, 4 °C, 1 h)yielded sterol-depleted plasma membranes. Sterol-depleted andnontreated PM were subjected to isolation of detergent-resistantmembranes (DRMs).
Isolation of DRMs.Detergent solubilization of PM (1 mg) was donewith 1% (vol/vol) Triton X-100 or Brij-98 on ice for exactly 30min, brought to finally 48% (vol/vol) sucrose with 60% (wt/vol)sucrose and overlaid with a continuous sucrose gradient from45% to 15% (vol/vol) sucrose. After 18 h of centrifugation anopaque white-gray band in themiddle of the sucrose gradient (30–36% sucrose) was visible containing the DRMs. Fractions werecollected and sucrose + protein concentration determined. Raftfractions were pooled and diluted in Tris-DTT buffer [50 mMTris (pH 7.4), 1 mM DTT] pelleted for 1 h at 100,000 × g, 4 °Cand prepared for SDS/PAGE.
SDS/PAGE and Blotting. Sampleswere resolved inSDS sample buffer[50mMTris(pH6.8),1.6%SDS,6%glycerol,bromphenolblue]andseparated in continuous gradient polyacrylamide gels ranging from8% to 16% (Pierce). Semidry blotting allowed detection with thefollowing primary antibodies and dilutions: GFP (ab6556; 1:2,500;Abcam) and V5 (1:5,000; Invitrogen). Alternatively, SDS/PAGEwas performed using 4–12% NuPAGE Bis-Tris gels (Life Tech-nologies) according to the manufacturer’s instructions. Proteinswere blotted onto nitrocellulose membranes (0.45 μm; Bio-RadLaboratories), which were blocked overnight in 5% (wt/vol)skimmedmilk powder in TBST [10mMTris·HCl (pH 7.4), 150mMNaCl, 0.05% Tween 20]. After washing three times in TBST,membranes were incubated at room temperature with the firstantibody: rabbit polyclonal anti-GFP reactive also against YFP(Abcam; diluted 1:3,000 in TBST). Followed by a subsequentwashing step in TBST, membranes were incubated with the re-spective HRP conjugated secondary antibody (GE HealthcareEurope; diluted 1:4,500 in TBST). The immunopositive bandswere visualized by using SuperSignalWest Pico ChemiluminescentSubstrate (Thermo Scientific) as directed by the manufacturer.
MS Analysis of DRM Fractions. Preparation of samples for MS analysis.Separation ofDRMsamples for in-gel digestionwas carried out using8–16% SDS/PAGE gradient gels: gel lanes were cut into approxi-mately 40 gel pieces and washed twice alternating with washingbuffer A (50 mM ammonium bicarbonate) and washing buffer B [25mM ammonium bicarbonate in 50% (vol/vol) acetonitrile]. Carba-midomethylation was done with 10 mM DTT at 56 °C and 5 mMiodoacetamide (IAA) at room temperature in the dark, followed bytwo subsequent washes with the washing buffers A and B. Gel pieceswere dried under vacuum and tryptically digested at 37 °C overnightwith each 50 ng trypsin/P (Promega) in washing buffer A.In-solution digestion was started on vacuum dried DRMs solu-
bilized in 60% (vol/vol) DMSO, reduced with 20mMDTT for 1 h at37 °C, and alkylated by 10 mM IAA at room temperature for 1 h.Excess IAA was removed by addition of further 10 mMDTT for 20min at 37 °C. Digestion was initiated by 1 μg trypsin/P for 4 h at37 °C and further intensified by the application of 250 ng trypsin/Povernight. The digestion mix was vacuum dried and solubilized insolvent A [20 mM KH2PO4 (pH 3)], filtrated by centrifugation ina microcon device, and applied to strong cation exchange chro-matography on a 300-μm inner diameter, 15-cm custom PolymerLaboratories Strong Cation Exchange (PL-SCX) column (particlesize 5 μm, pore size 1,000 Å; Polymer Laboratories).A binary gradient from 5% to 95% solvent B [20 mM KH2PO4
(pH 5.5), 0.25 M NaCl, 25% acetonitrile] was run for 50 min witha flow rate of 1.7 mL/min. Fractions were collected every minute,vacuum dried, and subjected to reversed phase (RP) separationafter reconstitution in 20 μL of 5% formic acid.MS data acquisition and evaluation. An Ultimate 3000 nano-HPLCy(HPLC)MS(Dionex)wasusedfor identificationofproteins—0.1%TFA concentrated the samples on a 100-μm inner diameter, 2-cmC18 column (NanoSeparations) with a flow rate of 8 μL/min.Peptides were separated on a 75-μm inner diameter, 15-cm C18PepMap column (Dionex) with a flow rate of 300 nL/min usinga 2-h binary gradient from 5% to 50% solvent B (solvent A: 0.1%formic acid (FA); solvent B: 0.1% FA, 84% acetonitrile). An LCQDecaXPPlus ion trap mass spectrometer (ThermoElectron) ac-quired repeatedly one full-MS and three tandem-MS spectra fromthe nano-HPLC separated samples, or a Quad-TOF QSTAR XL(Applied Biosystems) acquired one full-MS and two tandem-MSspectra, respectively. The tandem-MS spectra were recorded fromthe most intensive ions in the respective full MS scan.MS result peak files were run on a Mascot daemon using the
Mascot algorithm (version 2.2; Matrix Science) with TAIR v9protein database, trypsin/P as protease. Allowed fixed modifi-cation was carbamidomethylation (C), and variable modificationswere oxidized methionines (N) and pyroglutamic acid (pyro-Gluat N-terminal Q). Peptide and fragment mass tolerance were setto ±1.5 Da for the ion trap and ±0.2 Da for the Quad-TOF,maximum missed cleavages to two, and only singly, doubly, andtriply charged ions were analyzed.After manual inspection, protein identifications with at least
three unique identified peptides were automatically approved.Protein identifications based on two unique identified were onlyregarded if the two unique identified peptides displayed an ionsscore above theMascot significance threshold forP< 0.05 (Mascotscore >40 for the ion trap and >32 for the QUAD-TOF). DatasetS1, raw files and search results can be accessed under the datasetidentifier: PXD000211 and DOI 10.6019/PXD000211 at theProteomeXchange database and PRIDE.Detailed information for the identified proteins was queried
from the Uniprot consortium database (www.uniprot.org) and
Demir et al. www.pnas.org/cgi/content/short/1211667110 1 of 7
The Arabidopsis Information Center (TAIR: www.arabidopsis.org). The functional classification was assigned manually ac-cording to the annotations found in these two databases.Data analysis. Two independent biological replicates were analyzed:first setup of DRM isolation was performed with the detergentsTritonX-100andBrij-98 in-solutionandin-geldigested.Thesecondsetup for DRM isolation was only performed with the detergentTriton X-100 and in-gel digested but subjected to methyl-cyclodextrin treatment to identify sterol-dependent lipid nano-domain proteins. For the proteomic analysis of DRMs data setsfrom both experimental setups were analyzed; theMCD treatmentwas only analyzed for the second setup. Protein amounts wereestimated only for the MCD treatment using the ExponentiallyModifiedProteinAbundanceIndex (emPAI),whichcorrelateswiththe number of observed and observable peptides per protein (1).
Label-Free MS-Based Peptide Quantitation. In-solution digestion. Proteinpellets were solubilized in 6 M urea, 2 M thiourea (pH 8), andby subjecting the protein solution to ultrasonic bath for 10 min.After reduction of disulfide bridges by DTT and alkylation of freecysteins by iodoacetamide, proteins were predigested with Lys C(Wako). Subsequently, the protein mixture was diluted by fourvolumes using 10 mM Tris·HCl (pH 8). Proteins were digestedfurther by adding trypsin (sequencing grade trypsin; Promega) for6 h at room temperature. Digested proteins were acidified to pH3.5 using TFA and were then desalted over C18 STAGE tips (2).LC-MS/MS and data analysis. Tryptic peptide mixtures were analyzedby LC/MS/MS using nanoflow HPLC (Proxeon Biosystems) andan orbitrap (LTQ-Orbitrap; Thermo Scientific) as mass analyzer.Peptides were eluted from a 75-μm analytical column (Reprosil C18;Dr. Maisch GmbH) on a linear gradient running from 10% to 30%acetonitrile in 120 min and sprayed directly into the LTQ-Orbitrapmass spectrometer. Proteins were identified by MS/MS by in-formation-dependent acquisition of fragmentation spectra of mul-tiple-charged peptides. Full scans were obtained at a resolution ofFWHM of 60,000; CID fragment spectra were acquired in the LTQ.Protein identification and ion intensity quantitation was carried
out byMaxQuant version 1.3.0.5 (3). Spectra werematched againstthe Arabidopsis proteome (TAIR10, 35,386 entries) using An-dromeda (4). Thereby, carbamidomethylation of cysteinewas set asa fixed modification; oxidation of methionine as well as phos-phorylation of serine, threonine, and tyrosine was set as variablemodifications. Because label-free quantitation based on ion in-tensities was used, multiplicity was set to 1. Mass tolerance for thedatabase search was set to 20 ppm on full scans and 0.5 Da forfragment ions. Retention time matching between runs was chosenwithin a time window of 2 min. Peptide false discovery rate (FDR),protein FDR was set to 0.01, and site FDR was set to 0.05. Con-taminants and reverse hits identified by MaxQuant were excludedfrom further analysis. A full list of all identified spectra is found inDatasets S2 and S3. Raw files and search results can be accessedunder the dataset identifier PXD000182 at the ProteomeXchangedatabase and PRIDE. Two to three biological replicates were an-alyzed for each fraction and treatment.Label-free quantitation. Quantitative statistical analysis of proteinabundances in the different fractions was carried out using cRacker(5). Thereby, ion intensities for each peptide were normalized to thetotal ion intensity sum of each sample. These fractions of total ionintensities were then averaged between replicates. Normalized ionintensity values were then scaled to the average across all treat-ments. Statistical analysis involved ANOVA across the treatmentsand pairwise t testing. Multiple testing corrections were applied (6).For samples from Nicotiana benthamiana plants overexpressing
combinations of SLAC1 homolog 3 (SLAH3)::V5, calcium-dependent protein kinase (CPK)21::YFP, and abscisic-acidinsensitive 1 (ABI1)::StrepII, abundance ratios between DRMand detergent-soluble fraction (DSF) were calculated for eachprotein. To avoid effects from different expression levels between
expression series, normalized ion intensities were expressed asrelative to values in the DSF.
Xenopus Oocyte Recordings. Oocyte preparation, double-electrodevoltage-clamp (DEVC) studies, and data analysis were essentiallyperformed as previously described (7). The cDNA of SLAH3,CPK21, and ABI1 were cloned into oocyte expression vectors(based on pGEM vectors). For functional analysis cRNA wasprepared using the mMessage mMachine T7 Transcription Kit(Ambion). For oocyte bimolecular fluorescence complementation(BiFC) and electrophysiological experiments 10 ng of SLAH3,CPK, or ABI1 cRNA were injected each. In DEVC experimentsoocytes were perfused with Kulori-based solutions. The standardsolution contained 10 mM Mes/Tris (pH 5.6), 1 mM CaGluco-nate2, 1 mM MgGluconate2, 2 mM KGluconate, and 10 mMNaNO3, as well as 90 mM Na-gluconate. Osmolality was adjustedto 220 mOsmol/kg using D-sorbitol. Starting from a holding po-tential (VH) of 0 mV, single voltage pulses were applied in 20-mVdecrements from +40 to −160 mV. Instantaneous currents (IT)were extracted right after the voltage jump from the holding po-tential of 0mV to 500-ms test pulses ranging from+60 to−150mV.For oocyte BiFC experiments SLAH3 cDNA was fused to the
C-terminal half of a YFP, whereas the N-terminal half was fusedto CPK21. The Arabidopsis Thaliana remorin 1.3 (AtREM 1.3)was fused to an eGFP and cloned into an oocyte expressionvector. For documentation of the oocyte BiFC results, pictureswere taken with a confocal laser scanning microscope (LSM 5Pascal; Carl Zeiss) equipped with a Zeiss Plan-Neofluar 20×/0.5objective. Images were processed (low-pass filtered and sharp-ened) identically with the image acquisition software LSM 5Pascal (Carl Zeiss).
Transient Infiltration of N. benthamiana Leaves. Six- to seven-week-old N. benthamiana leaves were infiltrated with equal amounts ofAgrobacterium tumefaciens expressing full-length fusion constructsof ABI1::StrepII, CPK21::YFP, and SLAH3::V5. After 3 d of in-oculation, leaves were harvested and used for the isolation ofDRMs with the same parameters as for the MS analysis ofA. thaliana. Apparent molecular masses on Western blots are asfollows: ABI1::StrepII = 75 kDa, CPK21::YFP = 90 kDa, andSLAH3::V5 = 100 kDa.A. thaliana plant material and isolation of protoplasts. Plants ofA. thalianaCol0 were grown on soil at 22 °C during the day and 16 °Cduring the night, with 12 h light. The light intensity was set to 234.7μmol·m−2·s−1. For generation of protoplasts, 20–30 leaves of 4- to7-wk-old plants were cut into fine slices and incubated for 3 h atroom temperature in an enzyme solution containing 1.5% cellu-lase Onozuka R10 (Yakult Honsha) and 0.4% macerozyme R10(Yakult Honsha). The protoplasts were harvested by filtrationthrough a polyamide filter mesh (50 μm; Hartenstein) and col-lected by sedimentation for 2 min at 100× g. After resuspension ina magnesium-free solution and incubation on ice for 30 min forrecovery of the protoplasts, the cells were allowed to sediment andwere then resuspended in a solution containing 15mMMgCl2 and0.4Mmannitol (Sigma). The protoplasts were transfectedwith thecorresponding expression constructs using a 40% (vol/vol) PEG-4000 (Sigma) solution, containing 0.3 M mannitol. For coex-pression with ABI1 and the ABA-receptor regulatory componentsof ABA receptor 1 (RCAR1), it was necessary to transfect cells withABI1 and RCAR1 first and to incubate the cells for 4 h at roomtemperature prior to additional transfection with the other expres-sion constructs. Two batches of protoplasts each were transfectedwith the same expression constructs (30 μg total DNA per batch),and one batch was additionally treated with 50 μM ABA (2-cis,4-trans-abscisic acid; Sigma). The cells were incubated for 48 h inthe dark at 16 °C.BiFC and FRET Measurements. For the analysis of protein interactionswe used the Leica TCS SP5 II confocal laser spectral microscope at
Demir et al. www.pnas.org/cgi/content/short/1211667110 2 of 7
room temperature. We used a 25× objective (HC PL FLUOTAR25.0 × 0.95, water) and two laser lines: 405 nm for CFP and 514nm for YFP excitation. The detection occurred via two high-efficiency photomultipliers (CFP 450–480 nm; YFP and FRET540–560 nm). The cells were scanned at 400 lines/s and with 4times averaging. Images (512 × 512 pixels) were optimized, andoverlay images (CFP/YFP) were created via Leica software LASAF (Leica Application Suite Advanced Fluorescence 2.4.1). Thesensitized emission FRET was calculated according to sensitizedemission methods (8) in which FRET, CFP, and YFP emissionchannels were recorded sequentially line by line per recordedimage. The fluorescence intensities in BiFC and FRET imageswere measured via the quantification tool of the LAS AF soft-ware. For measurement of the FRET efficiency (EFRET), bothwavelengths (CFP/YFP) were successively switched on to receivefluorescence signals of equal and comparable intensity. Thebleaching of the acceptor occurred with 30 frames (ca. 38 s) attotal 100% laser intensity at 514 nm. The FRET efficiencymeasurements were performed with the “AB-FRET wizard” ofthe Leica LAS AF software, according to the calculation:
E=�1−
ICFP;FRETICFP
�;
where I is the intensity of the CFP for FRET (CFP,FRET) underunbleached YFP conditions and CFP (CFP) under bleachedYFP conditions.For acceptor bleaching FRET (AB-FRET) the cells were
embedded in 1% Low Melt agarose (Carl Roth) between glassslides to make them immobile and to ensure optimal bleaching ofthe whole cell.
Confocal Fluorescence Microscopy. Fluorescent images of eGFP,eYFP, and DsRed were obtained by using a confocal microscope(either LSM5 Pascal, Carl Zeiss Microimaging; or TCS SP5,Leica); the wavelengths used for excitation were 488 nm foreGFP, 488 nm (or 514 nm) for eYFP, and 543 nm (or 561 nm) fordsRed. Corresponding emission wavelengths for each of thefluorophores were detected by using the filter sets supplied by themanufacturer for the LSM5 Pascal or to the spectral emission of500–560 nm for GFP, 530–590 for YFP, and 590–650 for DsRed.Images were taken by using a 40×/1.2 W C-Apochromat objec-tive or a 63×/1.25 oil Plan-Neofluar objective (Carl Zeiss Mi-croimaging) or with a 20×/0.7 immersion Plan Apochromatobjective (Leica) with the confocal pinhole set at 1 Airy unit.Deconvolution of the confocal microscopy images was performed
by using the Volocity 4 deconvolution software package (Perkin-Elmer). Fluorescence colocalizations within the membrane nano-domainswerecalculatedbyusinga self-modifiedversionof the ImageJ PSC Colocalization Plugin (9). The calculated Pearson’s andSpearman’s ranks indicate tendencies toward colocalization witha 100%, perfect colocalization with a score of 1 and complete sep-aration at a score of −1. Scores above 0 indicate a tendency towardcolocalization. To test the EFRET values for the AB-FRETs ofcomparable data sets for a difference in mean, a homoscedastic two-
sample t test was performed. P values below 0.05 were accepted assignificant (graphs are marked with two asterisks).
Transient Transformation of A. thaliana Leaves by BallisticBombardment. Plant cells were transiently transformed by usinga homemade ballistic device, using DNA-covered tungsten particles(Bio-Rad) as carriers of the plasmid DNA, following a modifiedprotocol (10). DNA-covered tungsten particles were put into a filtercartridge, directly accelerated in a helium stream, and shot ontoArabidopsis col-0 leaves under vacuum. After bombardment leaveswere incubated 10–14 h in the dark. Transformed cells were analyzedwith the help of a confocal laser scanningmicroscope (LSM5Pascal).
Stimulated Emission-Depletion Determination of Nanodomain Sizes.Stimulated emission-depletion (STED) microscopy was applied onimmunohistochemically stained leaves, using a stable A. thalianaeGFP::StRem 1.3 line. After cryo-fixation leaves were dissected intosmall cross-sections of approximately 10–15 μm in diameter andstained with a primary anti-GFP antibody (ab6556, Abcam). Afterbrief washing, a secondary antibody was applied, carrying a stablefluorophore suitable for STED (Atto 647 N by Sigma-Aldrich).STED images were acquired on a Leica SP5 STED microscope.Briefly, the STED microscope is a modified Leica TCS SP5 mi-croscope with a 635-nm picosecond pulsed excitation laser (Leica/Pico-Quant) and with a >100-ps pulse-stretched Ti:Sapphire, de-pletion laser (Leica/Spectra-Physics) set at 750 nm coupled withtemporal and mode adjusting optics into the external input port.Detection occurred with an external avalanche photodiode
(Leica) through the external detection port with a 670- to 740-nmbandpass filter (Leica). Raft-size measurements were obtained byusing the Volocity 4 and the Leica Application Suite AdvancedFluorescence software after deconvolution of the STED imageswith the respective software. The resolution of the microscopewas determined to be 75 nm from imaging 40-nm latex beads,stained with ATTO 647 (Invitrogen). Upon deconvolution, theSTED images of the ATTO647 beads had a mean size of 40 nm.
FRAP Analysis. In vivo FRAP experiments were conducted ontransiently transformed A. thaliana epidermal cells 24 h aftertransfection at room temperature. Distinct raft domains were se-lectively bleached using an iterated 543-nm laser pulse for DsRed2fluorophores. Retaining fluorescence in the bleached spots wasmonitored using a 40×/1.2 W C-Apochromat objective and a pin-hole of 1 Airy unit. Two FRAP beams were applied: a highly fo-cused, high-intensity bleach beam (with 3-mW excitation power)and a low-intensity imaging beam (with 20-μW excitation power).Images were taken every second. The images were analyzed withImage J (National Institutes of Health), and the data were ex-ported to Origin (OriginLab). Average fluorescence intensitieswithin regions of interest in the bleached regions were analyzed foreach detection channel to obtain the recovery data. Correctionswere made for photobleaching during scanning by monitoringneighboring cells and analyzing their signals. Specifically, data ofthe DsRed2::AtRem 1.3 signal was normalized against thenonbleached eGFP::AtRem 1.2. Mobile fractions, meaning re-coveries of fluorescence, were never observed.
1. Ishihama Y, et al. (2005) Exponentially modified protein abundance index (emPAI) forestimation of absolute protein amount in proteomics by the number of sequencedpeptides per protein. Mol Cell Proteomics 4(9):1265–1272.
2. Rappsilber J, Ishihama Y, MannM (2003) Stop and go extraction tips for matrix-assistedlaser desorption/ionization, nanoelectrospray, and LC/MS sample pretreatment inproteomics. Anal Chem 75(3):663–670.
3. Cox J, Mann M (2008) MaxQuant enables high peptide identification rates, individualizedp.p.b.-range mass accuracies and proteome-wide protein quantification. Nat Biotechnol26(12):1367–1372.
4. Cox J, et al. (2011) Andromeda: A peptide search engine integrated into theMaxQuant environment. J Proteome Res 10(4):1794–1805.
5. Zauber H, Schulze WX (2012) Proteomics wants cRacker: Automated standardizeddata analysis of LC-MS derived proteomic data. J Proteome Res 11(11):5548–5555.
6. Benjamini Y, Hochberg Y (1995) Controlling the false discovery rate: A practical andpowerful approach to multiple testing. JR Stat Soc 57:289–300.
7. Geiger D, et al. (2010) Guard cell anion channel SLAC1 is regulated by CDPKprotein kinases with distinct Ca2+ affinities. Proc Natl Acad Sci USA 107(17):8023–8028.
8. Xia Z, Liu Y (2001) Reliable and global measurement of fluorescence resonanceenergy transfer using fluorescence microscopes. Biophys J 81(4):2395–2402.
9. French AP, Mills S, Swarup R, Bennett MJ, Pridmore TP (2008) Colocalization offluorescent markers in confocal microscope images of plant cells. Nat Protoc 3(4):619–628.
10. Vain PKN, Murillo J, Rathus C, Nemes C, Finer JJ (1993) Development of the particleinflow gun. Plant Cell Tissue Organ Cult 33:237–246.
Demir et al. www.pnas.org/cgi/content/short/1211667110 3 of 7
A B
C D
0.7280.728+/-+/-
0.0420.0420.6290.629+/-+/-
0.0540.054
Pearson Spearman
Co
rrel
atio
nC
oef
fici
ent
0.0
1.0
0.5
-0.5
-1.0
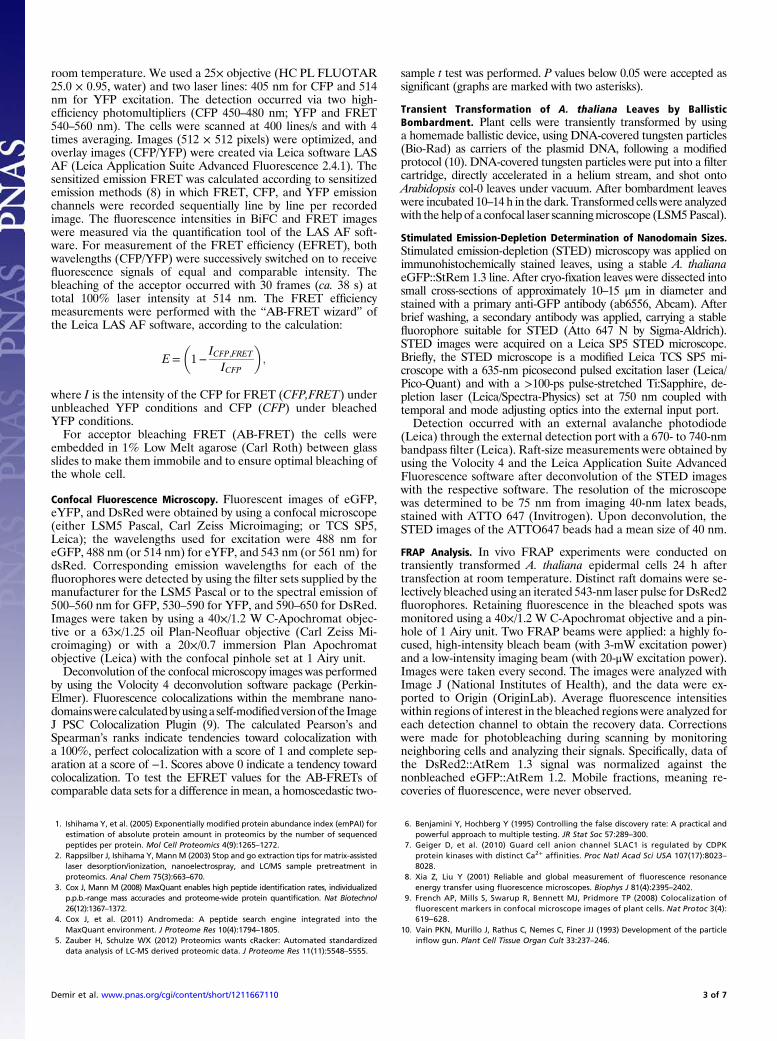
Fig. S1. A. thaliana AtRem 1.2/1.3 colocalization. DsRed2::AtRem 1.3 (A) and eGFP::AtRem 1.2 (B) colocalized very well; (C) merge picture. (D) Statisticalanalysis using the Pearson’s and Spearman’s ranks >0 indicated a clear tendency toward colocalization (n = 8, ±SE). (Scale bars, 10 μm.)
SLAH3
CPK21 α GFP
α V5
DRMs
DRMs
DSFDSF
CPK21+ SLAH3
ABI1+ CPK21+ SLAH3
DRMs
DSFDRMs
DSF
MCD
95
Fig. S2. Sterol dependency of CPK21::YFP and ABI1 dependency of CPK21::YFP and SLAH3::V5. (A) CPK21::YFP (90 kDa) was detected in DRM and DSF using anaffinity-purified GFP antibody (Abcam ab6556) after SDS/PAGE and blotting. Immunological assays confirmed the strict sterol dependency of CPK21. Treatmentwith MCD resulted in transition of CPK21::YFP from DRMs into the DSF, whereas non–MCD-treated CPK21::YFP localizedmainly in DRMs. Protein load = 15 μg. (B)Coexpression with ABI1 released CPK21 and SLAH3 from DRMs and led to their accumulation in the DSF. Fusion constructs of ABI1::V5, CPK21::YFP, and SLAH3::V5 were coexpressed in N. benthamiana and detected on separate Western blots. Equal amounts of protein (25 μg) were loaded. SLAH3::V5 was detected inDRMs in the presence of CPK21::YFP. When ABI1::V5 was additionally coexpressed, the majority of the CPK21::YFP and SLAH3::V5 signal occurred in the DSF.
Demir et al. www.pnas.org/cgi/content/short/1211667110 4 of 7
Pearson SpearmanC
orr
elat
ion
Co
effi
cien
t
0.0
1.0
0.5
-0.5
-1.0
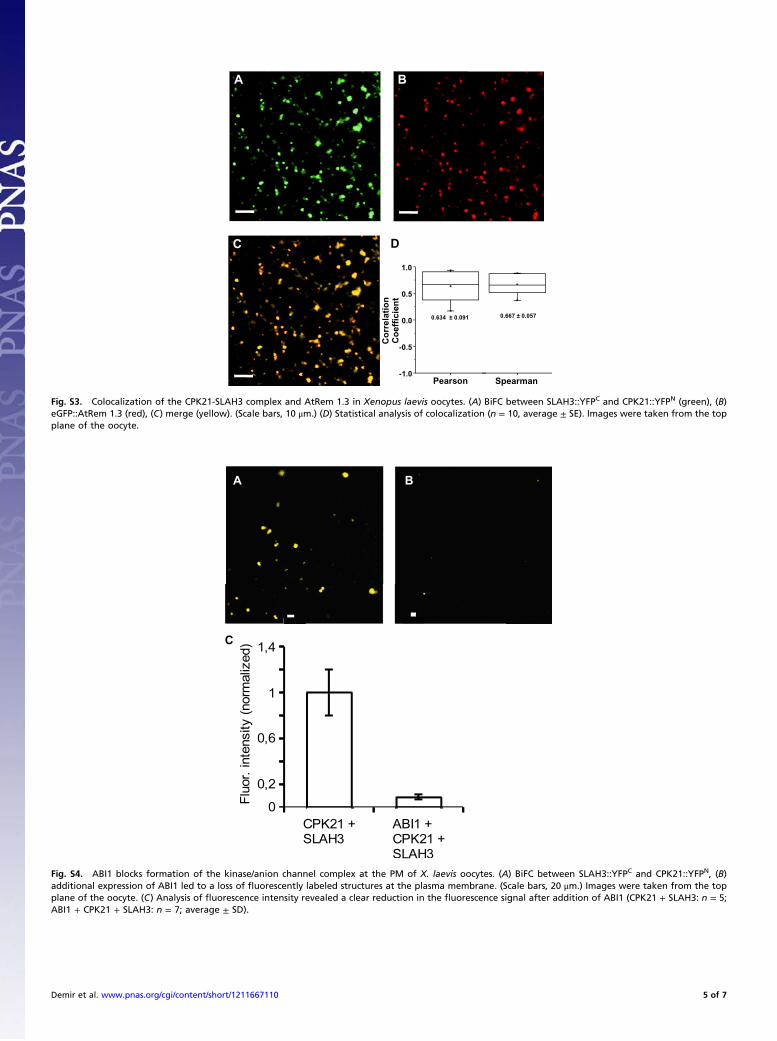
Fig. S3. Colocalization of the CPK21-SLAH3 complex and AtRem 1.3 in Xenopus laevis oocytes. (A) BiFC between SLAH3::YFPC and CPK21::YFPN (green), (B)eGFP::AtRem 1.3 (red), (C) merge (yellow). (Scale bars, 10 μm.) (D) Statistical analysis of colocalization (n = 10, average ± SE). Images were taken from the topplane of the oocyte.
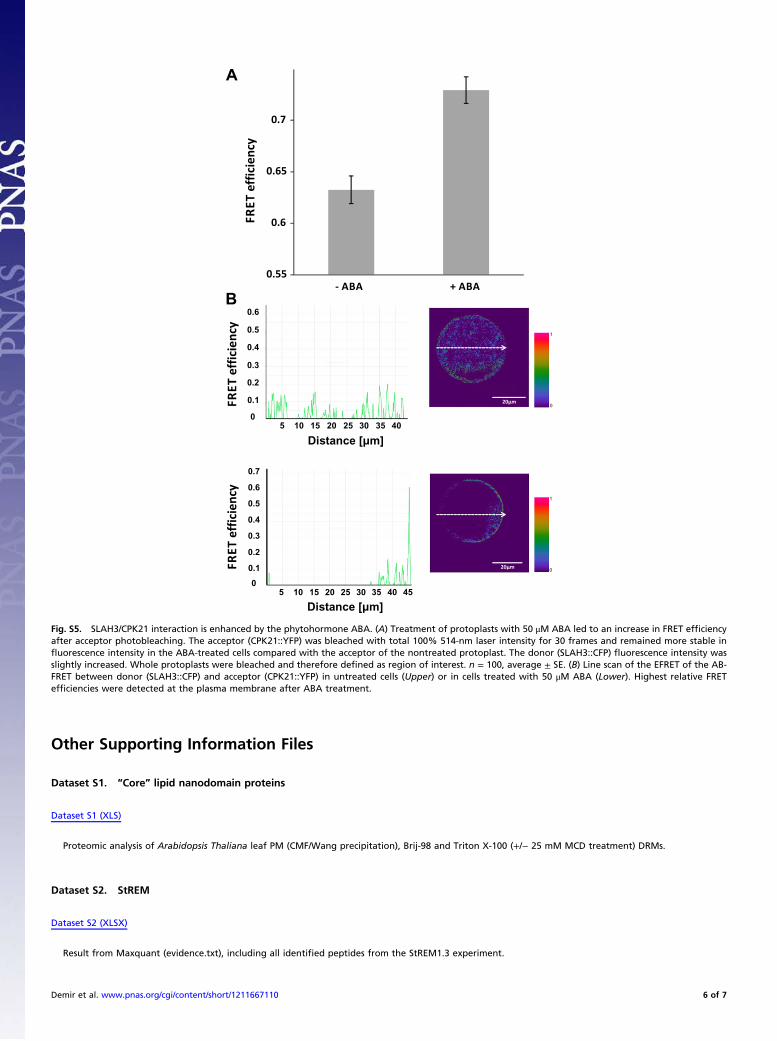
Fig. S4. ABI1 blocks formation of the kinase/anion channel complex at the PM of X. laevis oocytes. (A) BiFC between SLAH3::YFPC and CPK21::YFPN, (B)additional expression of ABI1 led to a loss of fluorescently labeled structures at the plasma membrane. (Scale bars, 20 μm.) Images were taken from the topplane of the oocyte. (C) Analysis of fluorescence intensity revealed a clear reduction in the fluorescence signal after addition of ABI1 (CPK21 + SLAH3: n = 5;ABI1 + CPK21 + SLAH3: n = 7; average ± SD).
Demir et al. www.pnas.org/cgi/content/short/1211667110 5 of 7
20µm
20µm
2015105 250
3530 40
0.1
0.6
0.5
0.4
0.3
0.2
2015105 250
3530 40 45
0.1
0.5
0.4
0.3
0.2
0.7
0.6
0.55
0.6
0.65
0.7
- ABA + ABA
ycneiciffeT ERF
ycneiciffeTERF
ycneiciffeTERF
1
0
1
0
Distance [µm]
Distance [µm]
Fig. S5. SLAH3/CPK21 interaction is enhanced by the phytohormone ABA. (A) Treatment of protoplasts with 50 μM ABA led to an increase in FRET efficiencyafter acceptor photobleaching. The acceptor (CPK21::YFP) was bleached with total 100% 514-nm laser intensity for 30 frames and remained more stable influorescence intensity in the ABA-treated cells compared with the acceptor of the nontreated protoplast. The donor (SLAH3::CFP) fluorescence intensity wasslightly increased. Whole protoplasts were bleached and therefore defined as region of interest. n = 100, average ± SE. (B) Line scan of the EFRET of the AB-FRET between donor (SLAH3::CFP) and acceptor (CPK21::YFP) in untreated cells (Upper) or in cells treated with 50 μM ABA (Lower). Highest relative FRETefficiencies were detected at the plasma membrane after ABA treatment.
Other Supporting Information Files
Dataset S1. “Core” lipid nanodomain proteins
Dataset S1 (XLS)
Proteomic analysis of Arabidopsis Thaliana leaf PM (CMF/Wang precipitation), Brij-98 and Triton X-100 (+/− 25 mM MCD treatment) DRMs.
Dataset S2. StREM
Dataset S2 (XLSX)
Result from Maxquant (evidence.txt), including all identified peptides from the StREM1.3 experiment.
Demir et al. www.pnas.org/cgi/content/short/1211667110 6 of 7

Dataset S3. SLAH3-coexpression
Dataset S3 (XLSX)
Result from Maxquant (evidence.txt) including all identified peptides from the SLAH3, CPK21, and ABI1 coexpression experiment.
Demir et al. www.pnas.org/cgi/content/short/1211667110 7 of 7


![Antibodies to PhnD Inhibit Staphylococcal Biofilmsiai.asm.org/content/82/9/3764.full.pdf · Antibodies to PhnD Inhibit Staphylococcal Biofilms ... phils]) were purified from](https://img.pdfslide.us/doc/110x75/5ac950907f8b9aa1298cfe6f/antibodies-to-phnd-inhibit-staphylococcal-to-phnd-inhibit-staphylococcal-biolms.jpg)