Embed Size (px)
Citation preview

Supporting information
pH-Triggered Nanostructural Transformations in Antimicrobial Peptide-Oleic
Acid Self-Assemblies
Mark Gontsarika,b, Mahsa Mohammadtaheria,
Anan Yaghmurb, Stefan Salentiniga*
aLaboratory for Biointerfaces, Department Materials meet Life, Empa Swiss Federal
Laboratories for Materials Science and Technology, Lerchenfeldstrasse 5, 9014, St.
Gallen, Switzerland
bDepartment of Pharmacy, Faculty of Health and Medical Sciences, University of
Copenhagen, Universitetsparken 2, DK-2100 Copenhagen Ø, Denmark.
1
Electronic Supplementary Material (ESI) for Biomaterials Science.This journal is © The Royal Society of Chemistry 2018

Dynamic light scattering (DLS) cumulant analysis
The average diffusion coefficient D was obtained by the cumulant analysis from the
correlation functions.1 The hydrodynamic radius RH was deduced from the diffusion
coefficient using the Stokes-Einstein equation:
𝑅𝐻 = 𝑘𝐵𝑇
6𝜋𝜂𝐷(eq. SI1)
kB being the Boltzmann constant, T the absolute temperature and η the viscosity of
the solvent. The polydispersity index PDI of the size distribution is determined from
the second cumulant:
𝑃𝐷𝐼 = µ2
Γ̅2 (eq. SI2)
being the second cumulant and the mean of the inverse decay time. 𝜇2 Γ̅
Phase indexing and lattice parameter calculations from SAXS data
The curves exhibiting peak spacing of 1, , , corresponding to reflections from 3 4
planes defined by Miller indices hk = 10, 11, 20, were attributed to H2 inverse
hexagonal phase and spacing of , , , 4, , corresponding to reflections from 3 8 11 19
hlk = 111, 220, 311, 400, 331 planes, were attributed to Fd3m micellar cubic phase.
Lattice parameter a for the two phases were calculated using:
𝑎𝐻2=
2𝑑3
ℎ2 + ℎ𝑘 + 𝑘2 (eq. SI3)
𝑎𝐹𝑑3𝑚 = 𝑑 ℎ2 + 𝑘2 + 𝑙2 (eq. SI4)
were d is the interplanar distance given by .𝑑 = 2𝜋/𝑞
2
Fitting of pKa from the ζ –potential measurements
The ζ –potential measurements at different pH values for samples with 0%, 10%
and 20% LL-37 in OA were fitted using following equation derived from the
Handerson-Hasselbalch relation.
𝜁 = 𝑍1 + 𝑍1 ‒ 𝑍2
10(𝑝𝐾𝑎𝑝𝑝
𝑎 ‒ 𝑝𝐻) ∗ 𝑝+ 1
(eq. SI5)
where the fitting parameters Z1 and Z2 are the bottom and top asymptotes, is 𝑝𝐾𝑎𝑝𝑝𝑎
the apparent pKa and p is the hill slope.
3
LL-37 loading in OA at pH = 7.0 [wt%]
RH [nm] PDI
LL-37 loading in OA at pH = 7.5 [wt%]
RH [nm] PDI
0 133 0.14 0 129 0.145 164 0.20 5 164 0.2010 151 0.19 10 162 0.2520 190 0.24 20 105 0.4830 105 0.35 30 94 0.50
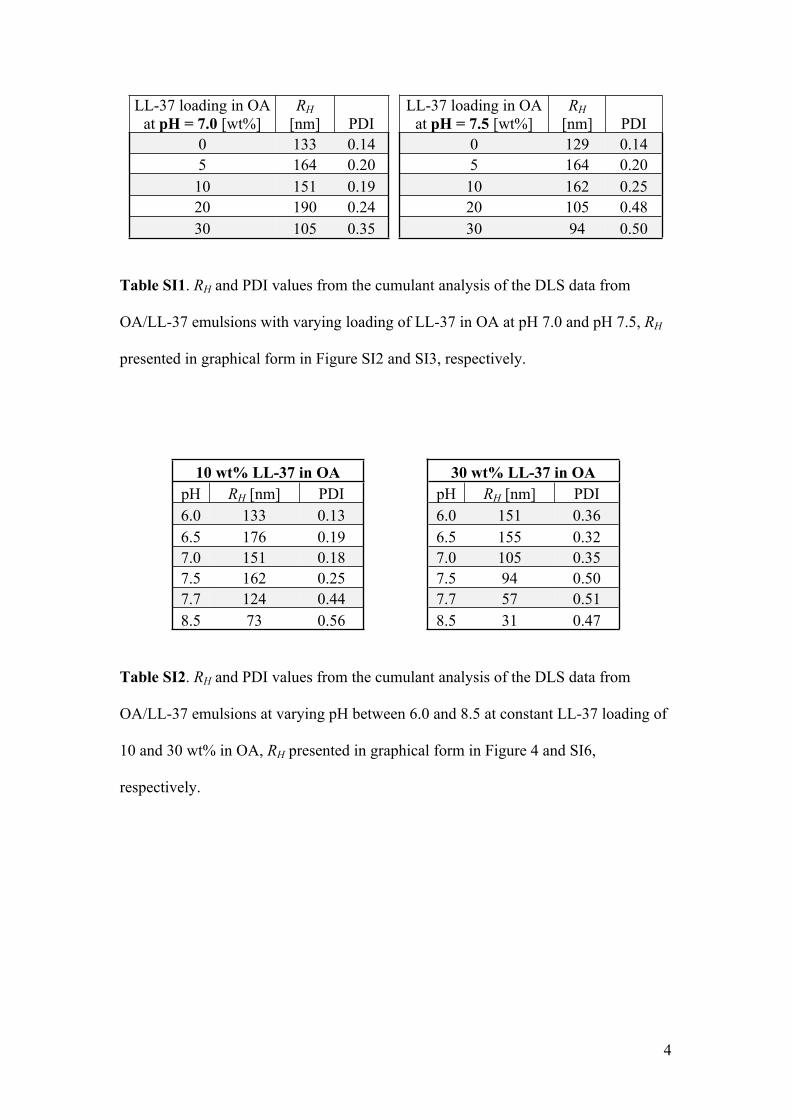
Table SI1. RH and PDI values from the cumulant analysis of the DLS data from
OA/LL-37 emulsions with varying loading of LL-37 in OA at pH 7.0 and pH 7.5, RH
presented in graphical form in Figure SI2 and SI3, respectively.
10 wt% LL-37 in OA 30 wt% LL-37 in OApH RH [nm] PDI pH RH [nm] PDI6.0 133 0.13 6.0 151 0.366.5 176 0.19 6.5 155 0.327.0 151 0.18 7.0 105 0.357.5 162 0.25 7.5 94 0.507.7 124 0.44 7.7 57 0.518.5 73 0.56 8.5 31 0.47
Table SI2. RH and PDI values from the cumulant analysis of the DLS data from
OA/LL-37 emulsions at varying pH between 6.0 and 8.5 at constant LL-37 loading of
10 and 30 wt% in OA, RH presented in graphical form in Figure 4 and SI6,
respectively.
4

Figure SI1. Calculated lattice parameters for the Fd3m and H2 phase upon increasing
the LL-37 concentration relative to OA at a) pH 7.0 and b) pH 7.5. The corresponding
SAXS curves are shown in Figure 1 in the main manuscript.
5

Figure SI2. a) Pictures of the OA/LL-37 dispersions at pH 7.0 with increasing LL-37
concentration relative to OA sowing the decrease in turbidity of the samples with
increasing peptide concentration. b) DLS correlation functions for these dispersions;
and c) the corresponding RH values from cumulant analysis of these correlation
functions.
6
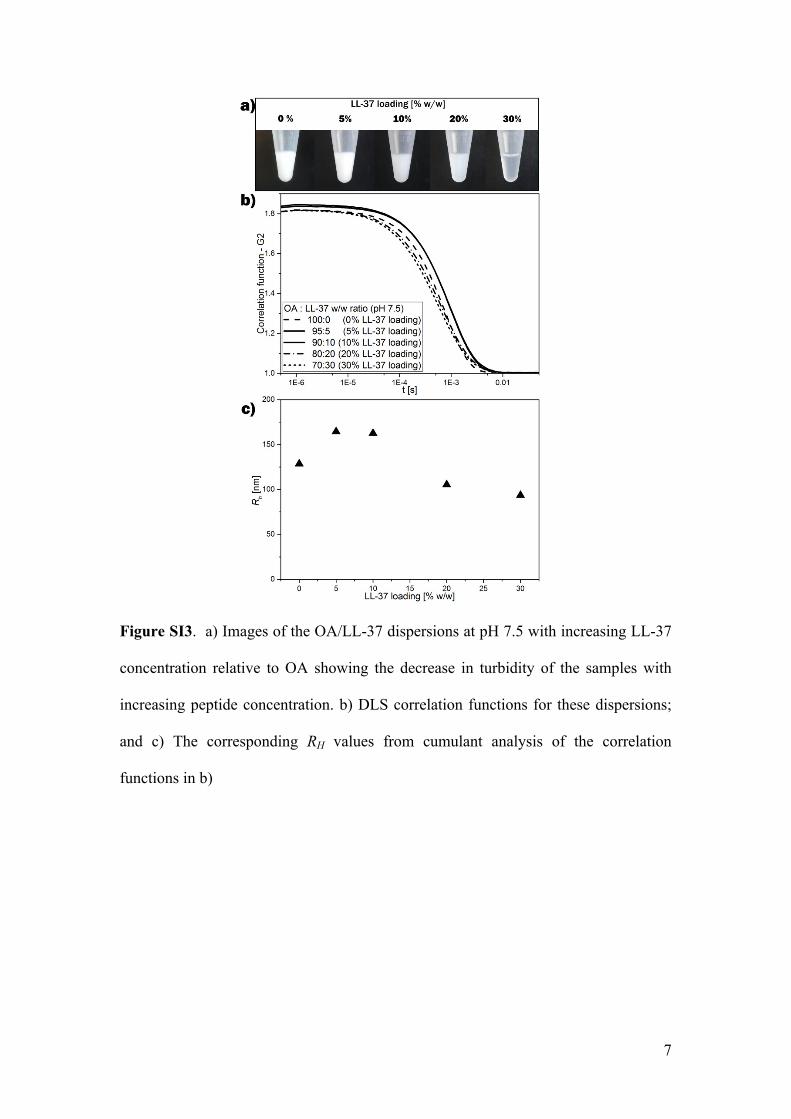
Figure SI3. a) Images of the OA/LL-37 dispersions at pH 7.5 with increasing LL-37
concentration relative to OA showing the decrease in turbidity of the samples with
increasing peptide concentration. b) DLS correlation functions for these dispersions;
and c) The corresponding RH values from cumulant analysis of the correlation
functions in b)
7

Figure SI4. Representative cryo-TEM image of 10 mg/ml LL-37 in PBS buffer in
absence of OA. No Nanoobjects in the 10 nm size range were observed in this system.
The dark region in this image is the TEM grid.
8
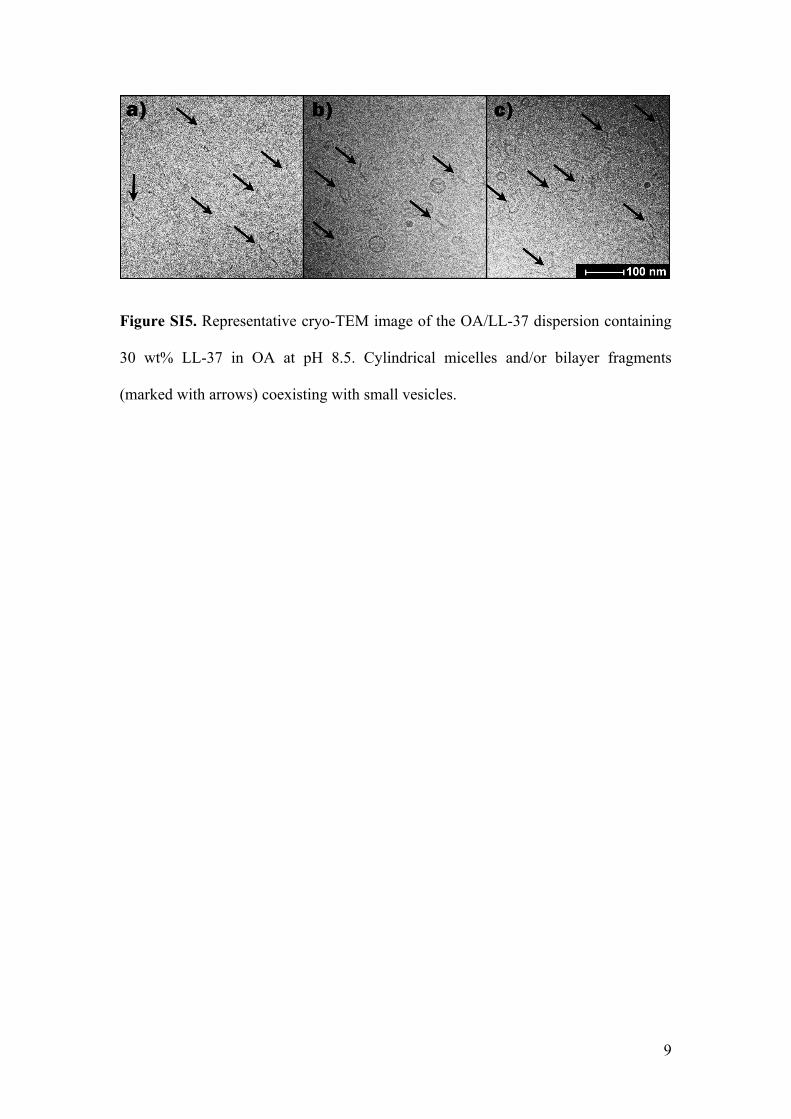
Figure SI5. Representative cryo-TEM image of the OA/LL-37 dispersion containing
30 wt% LL-37 in OA at pH 8.5. Cylindrical micelles and/or bilayer fragments
(marked with arrows) coexisting with small vesicles.
9

Figure SI6. a) Images of the OA/LL-37 dispersions at 30 wt% LL-37 in OA at
different pH values from 6 to 8.5 showing the decrease in turbidity of the samples
with increasing pH due to decrease in particle size. b) DLS correlation functions for
these dispersions; c) the corresponding RH values from cumulant analysis of the
correlation functions; and d) The corresponding light scattering intensity in this pH
range.
10
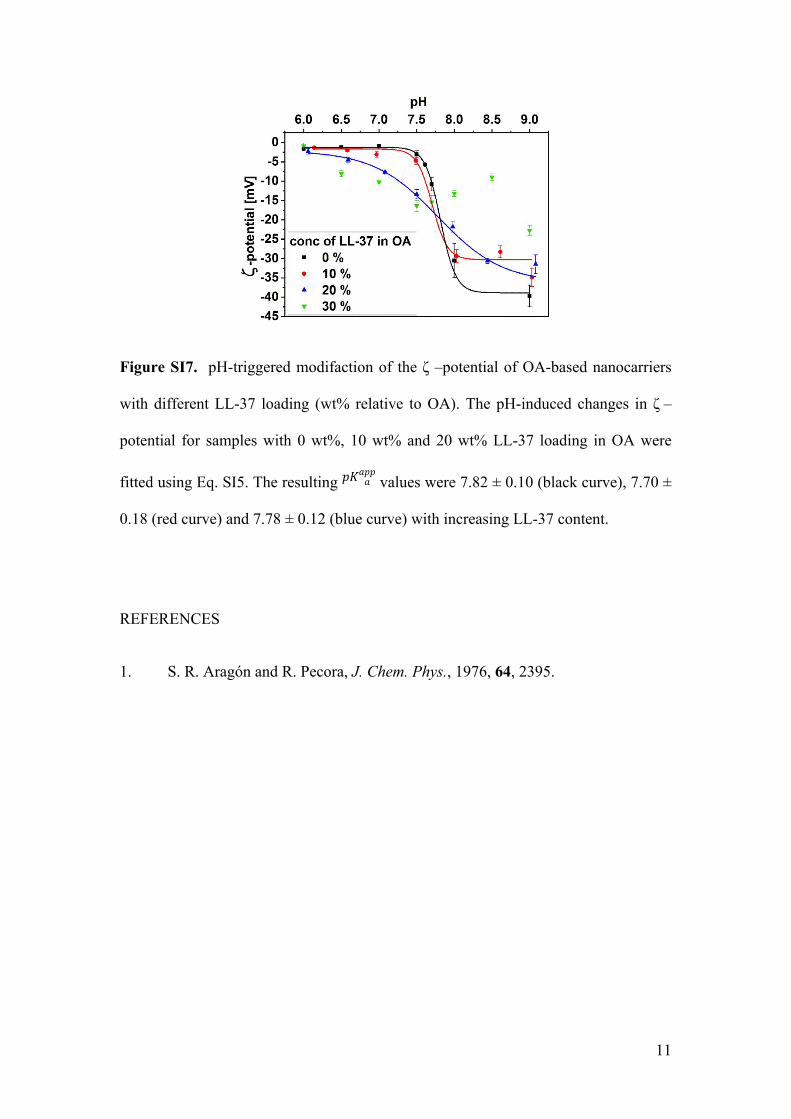
Figure SI7. pH-triggered modifaction of the ζ –potential of OA-based nanocarriers
with different LL-37 loading (wt% relative to OA). The pH-induced changes in ζ –
potential for samples with 0 wt%, 10 wt% and 20 wt% LL-37 loading in OA were
fitted using Eq. SI5. The resulting values were 7.82 ± 0.10 (black curve), 7.70 ± 𝑝𝐾𝑎𝑝𝑝𝑎
0.18 (red curve) and 7.78 ± 0.12 (blue curve) with increasing LL-37 content.
REFERENCES
1. S. R. Aragón and R. Pecora, J. Chem. Phys., 1976, 64, 2395.
11


![The origin and stability of nanostructural hierarchy in ...€¦ · The origin and stability of nanostructural hierarchy in crystalline solids ... patterns of this area in the [001]](https://img.pdfslide.us/doc/110x75/606923e8e5593d60d337983d/the-origin-and-stability-of-nanostructural-hierarchy-in-the-origin-and-stability.jpg)