Embed Size (px)
Citation preview

S1
Supporting Information for
Coercing Bisphosphonates to Kill Cancer Cells with Nanoscale Coordination Polymers
Demin Liu, Stephanie A. Kramer, Rachel C. Huxford-Phillips, Shunzhi Wang, Joseph Della Rocca, and Wenbin Lin*
Department of Chemistry, CB#3290, University of North Carolina, Chapel Hill, NC 27599,
Materials and Methods. All starting materials were purchased from Fisher Scientific or Sigma-Aldrich unless otherwise noted, and used without further purification. 1,2-dioleoyl-3-trimethylammonium-propane, chloride salt (DOTAP) was purchased from Avanti Polar Lipids. L-α-phosphatidylethanolamine, dioleoyl (DOPE) was a gift from Sigma Aldrich. Pamidronate disodium was purchased from AmplaChem, Inc. Zoledronic acid was purchased from Hanhong Chemical Company. Fetal bovine serum (FBS, Sigma), RPMI-1640 growth medium (Gibco), penicillin-streptomycin (Sigma), trypsin-EDTA (Sigma), and phosphate buffered saline (PBS, Gibco) were purchased from the Tissue Culture Facility in the Lineberger Comprehensive Cancer Center at UNC-Chapel Hill. AnnexinV FITC conjugate was purchased from Invitrogen. DRAQ5 nuclear stain was purchased from Biostatus Limited. Microwave reactions were carried out in a CEM Discovery microwave. 1H NMR spectra were recorded on a 400 MHz Bruker NMR 400 DRX Spectrometer and referenced to the proton resonance resulting from incomplete deuteration of CDCl3 or DMSO-d6. Single-crystal X-ray diffraction and powder X-ray diffraction (PXRD) patterns were collected on a Bruker SMART APEX II diffractometer using Cu radiation. The PXRD patterns were processed with the APEX II package using the PILOT plug-in. UV-Vis absorption spectra were obtained using a Shimadzu UV-2401PC UV-Vis Spectrophotometer. Thermogravimetric analyses (TGA) were performed using a Shimadzu TGA-50 equipped with a platinum pan and using a 3 ºC/min sampling rate. A Hitachi 4700 field emission scanning electron microscope (SEM) and a JEM 100CX-II transmission electron microscope (TEM) were used to determine particle size and morphology. SEM images of the nanoparticles were taken on a glass substrate, and a Cressington 108 Auto Sputter Coater equipped with a Au/Pd (80/20) target and a MTM-10 thickness monitor was used to coat the sample with approximately 5 nm of conductive layer before obtaining SEM images. Size and zeta potential data were collected with a Malvern Zetasizer Nano Zs. Synthesis of Ca-Pamidronate Bulk Crystal (Ca-Pam). Pamidronate disodium (10 mg, 0.036 mmol) and CaCl2·2H2O (20 mg, 0.14 mmol) were dissolved in a mixture of DEF/H2O (0.5 mL/3 mL) in a screw-capped vial. After the addition of 30 µL 3 M aq. HCl, the vial was capped and placed in an oven at 80 °C for two days. Bright colorless crystals (5.1 mg, 43.5 %) were obtained after filtration. Synthesis of Ca-Zoledronate Bulk Crystal (Ca-Zol). Zoledronic acid (10 mg, 0.037 mmol) and CaCl2·2H2O (20 mg, 0.14 mmol) were dissolved in a solvent mixture of DMF/H2O (6.5 mL/5 mL) in a screw-capped vial. After the addition of 0.5 mL 3 M aq. HCl, the vial was capped and placed in an oven at 80 °C for two days. Bright colorless crystals (4.2 mg, 36.6 %) were obtained after filtration. Synthesis of Ca-Pam Nanoparticle (1). Pamidronic acid (0.1 g, 0.42 mmol) and CaCl2·2H2O (0.2 g, 1.4 mmol) were dissolved in 14 mL H2O and the pH was adjusted to a value of 8.2. This solution was stirred for 24 h at 80 ºC. Particles of 1 were isolated via centrifugation at 13000 rpm for 15 min. Before
Electronic Supplementary Material (ESI) for Chemical CommunicationsThis journal is © The Royal Society of Chemistry 2012

S2
redispersing in EtOH, the particles were washed once with water and three times with EtOH. A yield of 81 mg (70 %) of 1 was isolated from this procedure.
Synthesis of Ca-Zol Nanoparticle (2). Zoledronic acid (5 mg, 0.019 mmol) and CaCl2·2H2O (10 mg, 0.07 mmol) were dissolved in a mixture of DMF/H2O (5 mL/2 mL). The resulting solution was sealed in a microwave vessel and heated at 100 ºC (400 W) for 20 min, with stirring. Crystalline particles of 2 were isolated via centrifugation at 13000 rpm for 15 min. Before redispersing in EtOH, the particles were washed once with water and three times with EtOH. A yield of 4 mg (67.5 %) of 2 was isolated from this procedure. Synthesis of DOPE-Anisamide (DOPE-AA). DOPE (50 mg, 0.067 mmol) was reacted under nitrogen with 4-methoxybenzoic acid (103.5 mg, 0.672 mmol) in CH2Cl2 (10 mL, anhydrous) in the presence of N,N’-dicyclohexylcarbodiimide (27.2 mg, 0.134 mmol) and 4-dimethylaminopyridine (16.42 mg, 0.134 mmol). The reaction was stirred at room temperature for 24 h, in the dark. After the removal of CH2Cl2 by rotary evaporation, the crude product was dissolved in CHCl3, washed with 4% Na2CO3, 0.2 M aq. HCl, and H2O, and then dried over MgSO4. The resulting product was purified by column chromatography using silica gel and 5:1 (v/v) CHCl3/MeOH as the eluent. The product was obtained after removal of the solvent (30 mg, 51% yield). 1H NMR (CDCl3): δ 7.82 (d, J =7.6 Hz, 2H); 6.78 (s, 2H); 5.31 (m, 4H); 3.76 (s, 3H); 2.15 (s, 4H); 1.97 (s, 6H); 1.62 (s, 10H); 1.46 (s, 4H); 1.21 (t, J= 14 Hz, 30H); 0.85 (t, J = 6 Hz, 6H). Synthesis of DOPE-Rhodamine. Rhodamine B isothiocyanate (37.5 mg, 0.07 mmol) was dried under high vacuum for 1 h. Anhydrous MeOH (10 mL) and triethylamine (6.2 µL) were added, followed by 0.5 mL DOPE (100 mg/mL, 0.067 mmol in anhydrous CH2Cl2). The reaction was magnetically stirred under nitrogen at room temperature for 4 h, in the dark. After the removal of the solvent by rotary evaporation, the product was dissolved in MeOH (87 mg, 25 mg/mL, 100% yield).
1:1 (by mol) DOTAP/DOPE Liposomes. CHCl3 solutions of 5 mg DOTAP and 5.295 mg DOPE were added to a 20 mL vial and the solvent was removed by rotary evaporation. The lipid film was further dried under vacuum for 3 h. The lipid film was hydrated with 2.85 mL 10 mM aq. KCl and allowed to hydrate for 1 h, forming a cloudy suspension. The suspension was extruded using polycarbonate membranes with pore diameters of 600 nm and 100 nm. At least ten extrusion cycles were performed. The resulting liposomes were stored at 4 oC.
1:1 (by mol) DOTAP/DOPE Liposomes with 10 mol% Anisamide. These liposomes were prepared similarly to the non-targeted liposomes described above, but the contents of the lipid film were CHCl3 solutions of 5 mg DOTAP, 4.3 mg DOPE, and 1.03 mg DOPE-AA.
General Procedure for Lipid Coating. Lipid-coated particles were obtained by mixing an aqueous suspension of particles and liposomes with a ratio of 4:1 particle to liposome, by weight. The mixture was allowed to sit at room temperature for 1 h, with occasional agitation. Excess liposomes were removed by centrifugation at 6000 rpm for 10 min. The supernatant was removed, and the lipid-coated particles were redispersed in 10 mM aq. KCl. X-ray Structure Determination. All crystallographic measurements were made on a Bruker SMART Apex II CCD-based X-ray diffractometer system equipped with Cu–target X-ray tube and operated at 1600 watts. The frames were integrated with the Bruker SAINT© build in APEX II software package using a narrow-frame integration algorithm, which also corrects for the Lorentz and polarization effects. Absorption corrections were applied using SADABS. All of the structures were solved by direct methods and refined to convergence by the least squares method on F2 using the SHELXTL software
Electronic Supplementary Material (ESI) for Chemical CommunicationsThis journal is © The Royal Society of Chemistry 2012
S3
suit. All non-hydrogen atoms were refined anisotropically. Datasets for Ca-Pam and Ca-Zol were collected to 2θ =138.6º and 108.1º, respectively, with >98% completeness. Drug Loading Determinations of 1 and 2. Drug loading of 1 was determined by an existing protocol which involves UV-Vis detection of the Fe-pamidronate complex.1 A fresh 5 mM FeCl3 solution was prepared by combining 17.2 mL of concentrated HClO4, 50 mL H2O, and 0.135 g FeCl3·6H2O in a 100 mL volumetric flask, which was then diluted to 100 mL with H2O. Fresh 2 M HClO4 was prepared by diluting 17.2 mL of concentrated HClO4 to 100 mL with H2O. A Fresh 5 mM pamidronate solution in 2 M HClO4 was prepared as a standard. Using these solutions, standards were prepared with the amounts depicted in Table S2. A baseline spectrum was recorded using 2.5 mM Fe3+ in 2 M HClO4. The absorbance at 280 nm was recorded. Particles were digested overnight in 2 M perchloric acid. The concentration of drug in the solution was determined by the corresponding absorbance at 280 nm. Drug loading is 75.5 wt% for 1 and 65.1 wt% for 1@lipid. For the drug loading determination of 2, a standard curve was prepared by measuring the absorbances of five different concentrations of zoledronic acid in 0.1 M HCl. Particles were digested in 0.1 M HCl overnight. The concentration of drug in the solution was determined by the absorbance at 215 nm recorded. Drug loading is 75.7 wt% for 2 and 67.0 wt% for 2@lipid. Dissolution Studies of 1 and 2. For the release profile of 1, the absorbance of pamidronic acid in five different concentrations in 1 M HClO4/2.5 mM PBS were recorded at 212 nm, and a corresponding standard curve was made. For the release profile of 2, the absorbance of zoledronic acid in five different concentrations in 0.5 M HCl/2.5 mM PBS was recorded at 215 nm, and a corresponding standard curve was constructed. Particles of either 1 or 2 were dispersed in 10 mM aq. KCl and added to a section of 3500 molcular weight cutoff dialysis tubing. The tubing was suspended in 250 mL of 5 mM PBS. Aliquots (1 mL) were removed from the solution at designated time intervals, diluted with an equal volume of either 2 M HClO4 or 1 M HCl, and the absorbance was recorded at either 212 nm (pamidronate) or 215 nm (zoledronate). Cell Lines. NCI-H460 non-small cell lung cancer cells (ATCC# HTB-177) were purchased from the Tissue Culture Facility of the Lineberger Comprehensive Cancer Center at the University of North Carolina at Chapel Hill. AsPC-1 (ATCC# CRL-1682) human pancreatic adenocarcinoma cancer cells were received from Dr. Jen Jen Yeh at the University of North Carolina at Chapel Hill School of Medicine. Both cell lines were maintained in RPMI-1640 growth medium supplemented with 10% FBS and 2% penicillin-streptomycin.
In Vitro Cytotoxicity Assay of 1 Against H460 cells. Confluent H460 cells were trypsinized and counted with a hemocytometer. Cells were plated in 6-well plates at a cell density of 5.0×10⁴ cells/well and a total of 3 mL media. The plate was incubated at 37 °C and 5% CO2 overnight. Media was removed from wells, and then the wells were washed with PBS. Afterwards, appropriate amounts of pamidronate, 1, 1@lipid, and 1@lipid-AA in RPMI-1640 medium were added. A preliminary assay was carried out with pamidronate concentrations of 0, 5, 10, 20, 40, and 80 µM, followed by another assay with pamidronate concentrations of 0, 1, 3, 6, 12.5, and 25 μM. The plates were incubated at 37 °C and 5% CO2 for 48 h, and viability was determined via the trypan blue exclusion assay.
In Vitro Cytotoxicity Assay of 2 Against H460 cells. Confluent H460 cells were trypsinized and counted with a hemocytometer. Cells were plated in 6-well plates at a cell density of 5.0x10⁴ cells/well and a total of 3 mL media per well. The plate was incubated at 37°C and 5% CO2 overnight. Media was removed from the wells, and then the wells were washed with PBS. Afterwards, appropriate amounts of zoledronate, 2, 2@lipid, 2@lipid-AA in RPMI-1640 medium were added. A preliminary assay was carried out with zoledronate concentrations of 0, 1, 3.75, 7.5, 15, and 30 µM, followed by another assay
Electronic Supplementary Material (ESI) for Chemical CommunicationsThis journal is © The Royal Society of Chemistry 2012
S4
with zoledronate concentrations of 0, 0.25, 0.5, 1, 2.5, and 5 μM. The plates were incubated at 37°C and 5% CO2 for 48 h, and viability was determined via the trypan blue exclusion assay.
Cytotoxicity assay of 1 and 2 Against AsPC-1 cells. Confluent AsPC-1 cells were trypsinized and counted with a hemocytometer. Cells were plated in 6-well plates at a cell density of 1.0x10⁶ cells/well and a total of 3 mL media. Plates were incubated at 37°C and 5% CO2 overnight. Media was removed from wells, and then the wells were washed with PBS. Afterwards, appropriate amounts of zoledronate, pamidronate, 1, 2, 1@lipid, 2@lipid, 1@lipid-AA, and 2@lipid-AA in RPMI-1640 medium were added to wells. A preliminary assay was carried out with pamidronate or zoledronate concentrations of 0, 1, 2.5, 5, 10, and 20 µM, followed by another assay, using only 2@lipid and 2@lipid-AA, with zoledronate concentrations of 0, 0.5, 1, 2.5, 5, and 10 μM. The plates were incubated at 37°C and 5% CO2 for 48 h, and viability was determined via the trypan blue exclusion assay.
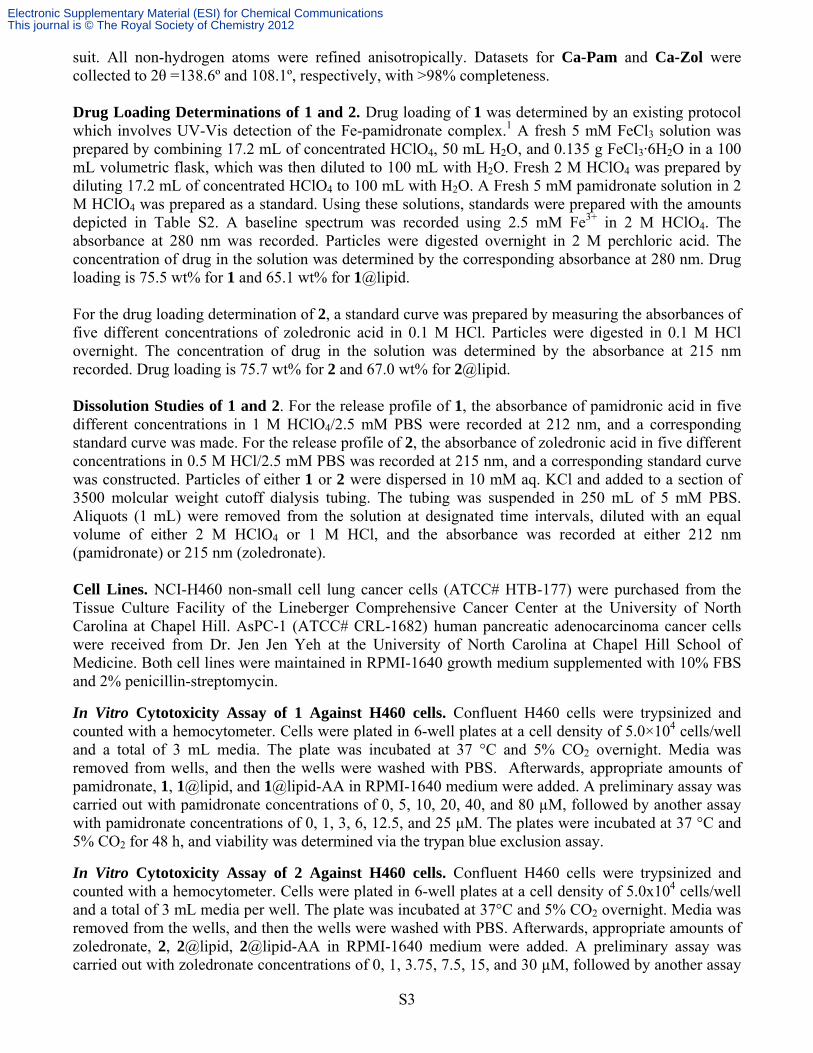
Confocal Microscopy. Confluent H460 cells were trypsinized and counted with a hemocytometer. Silanized coverslips2 in 6-well plates were seeded with 1.0x10⁵ cells and 3 mL of RPMI-1640 media. The plates were incubated for 24 h at 37 °C and 5% CO2. Media was removed from the wells, and each well was washed with 2 mL PBS. Particle dispersions were prepared in PBS, and aliquots of particle dispersions/media/PBS were added to the wells, resulting in a concentration of 0.08 mg/well for each particle. Each well contained 500 µL PBS and a total volume of 2 mL. The cells were incubated with particles for 1 h, media removed, and wells washed with 2 mL PBS. Each well received 1 mL PBS and 15 µL Annexin V FITC conjugate, and the cells were allowed to sit at room temperature for 15 min. PBS was removed, and each well was washed twice with 2 mL PBS. Coverslips were covered in 1 mL media containing 5 µL DRAQ5 nuclear stain, adhered on glass slides with antifade mounting medium, and imaged at the UNC-CH Microscope and Imaging Facility on the Olympus FlowView500 instrument. Images were analyzed using Photoshop. Table S1. X-Ray crystallographic data for Ca-Pam and Ca-Zol.
Compound Ca-Pam Ca-Zol
Empirical formula C3H7CaNO9P2 C5H6CaN2O8P2
Formula weight 303.12 324.14
Temperature (K) 100(2) 100(2)
Wavelength (Å) 1.54178 1.54178
Crystal system Orthorhombic Orthorhombic
Space group Pna21 Pna21
Unit cell dimensions
a = 13.7486(3) Å a = 13.4828(9Å
b = 10.6087(2)Å b = 12.6963(7) Å
c = 6.9230(2) Å c = 6.7635(5) Å
α = 90° α = 90°
β = 90° β = 90°
γ = 90° γ = 90°
Volume (Å3) 34097(6) 35784(21)
Z 4 4
Electronic Supplementary Material (ESI) for Chemical CommunicationsThis journal is © The Royal Society of Chemistry 2012

S5
Density (calcd. g/cm3) 1.994 1.860
Absorption coeff. (mm-1) 8.811 7.701
F(000) 616 4056
Crystal size (mm) 1.00×0.02 ×0.02 0.1×0.01 ×0.01
Crystal color & shape colorless colorless
θ range data collection 5.27 to 69.30° 4.78 to 54.06°
Limiting indices -15< h <16 -13< h <13
-12< k <12 -13< k <12
-7< l <5 -5< l <7
Reflections collected 3572 4056
Independent reflections 1472 [R(int) = 0.0249] 1107 [R(int) = 0.0841]
Refinement method Full-matrix least-square on F2 Full-matrix least-square on F2
Data/restraints/parameters 1472 / 1 / 146 1107 / 8 / 164
Goodness-of-fit on F2 1.108 1.087
Final R indices [I>2σ(I)]a,b R1 = 0.0360 R1 = 0.0586
wR2 = 0.0960 wR2 = 0.1434
R indices (all data) R1 = 0.0369 R1 = 0.0776
wR2 = 0.0966 wR2 = 0.1518
a R(F) =Σ||Fo| - |Fc||/Σ|Fo|. b RW(F2) = [Σ{w(Fo2 - Fc
2)2}/Σ{w(Fo2)2}]0.5; w-1 = σ2(Fo
2) + (aP)2 + bP, where P= [Fo2 + 2Fc
2]/3 and a and b are constants adjusted by the program.
0 100 200 300 400 500 600
0.6
0.8
1.0
Per
cent
Wei
ght L
oss
(%)
Temperature (oC)
Bulk Ca-Pam crystala)
0 100 200 300 400 500 600
0.2
0.4
0.6
0.8
1.0
Per
cent
Wei
ght L
oss
(%)
Temperature (oC)
Bulk Ca-Zol crystalb)
Figure S1. (a) TGA curve of Ca-Pam. (b) TGA curve of Ca-Zol.
Electronic Supplementary Material (ESI) for Chemical CommunicationsThis journal is © The Royal Society of Chemistry 2012
S6
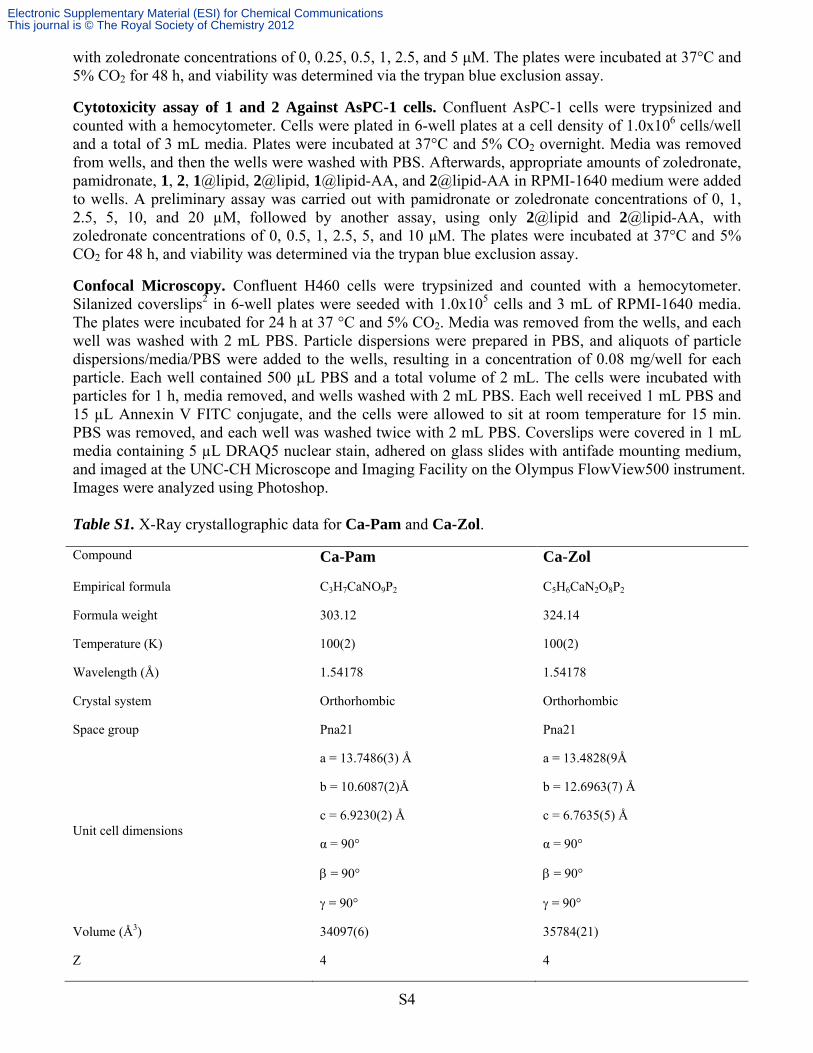
Figure S2. (a) PXRD patterns of bulk Ca-Pam and 1. (b) PXRD patterns of bulk Ca-Zol and 2. (c) TGA curves of 1, 1@lipid, and 1@lipid-AA. (d) TGA curves of 2, 2@lipid, and 2@lipid-AA.
5 10 15 20 25 300
50
100
150
200
250
300
Inte
nsity
(a.u
.)
2θ
1 Ca-Pam Simulated from CIF
5 10 15 20 25 300
20
40
60
80
100
Inte
nsity
(a.u
.)
2θ
2 Ca-Zol Simulated from CIF
0 100 200 300 400 500 6000.4
0.6
0.8
1.0 1 1@ lipid 1@ lipid-AA
Per
cent
Wei
ght L
oss
(%)
Temperature (oC)0 100 200 300 400 500 600
0.4
0.6
0.8
1.0
Per
cent
Wei
ght L
oss
(%)
Temperature (oC)
2 2@ lipid 2@ lipid-AA
a)
d)c)
b)
a) b) c)
d) e) f)
Electronic Supplementary Material (ESI) for Chemical CommunicationsThis journal is © The Royal Society of Chemistry 2012

S7
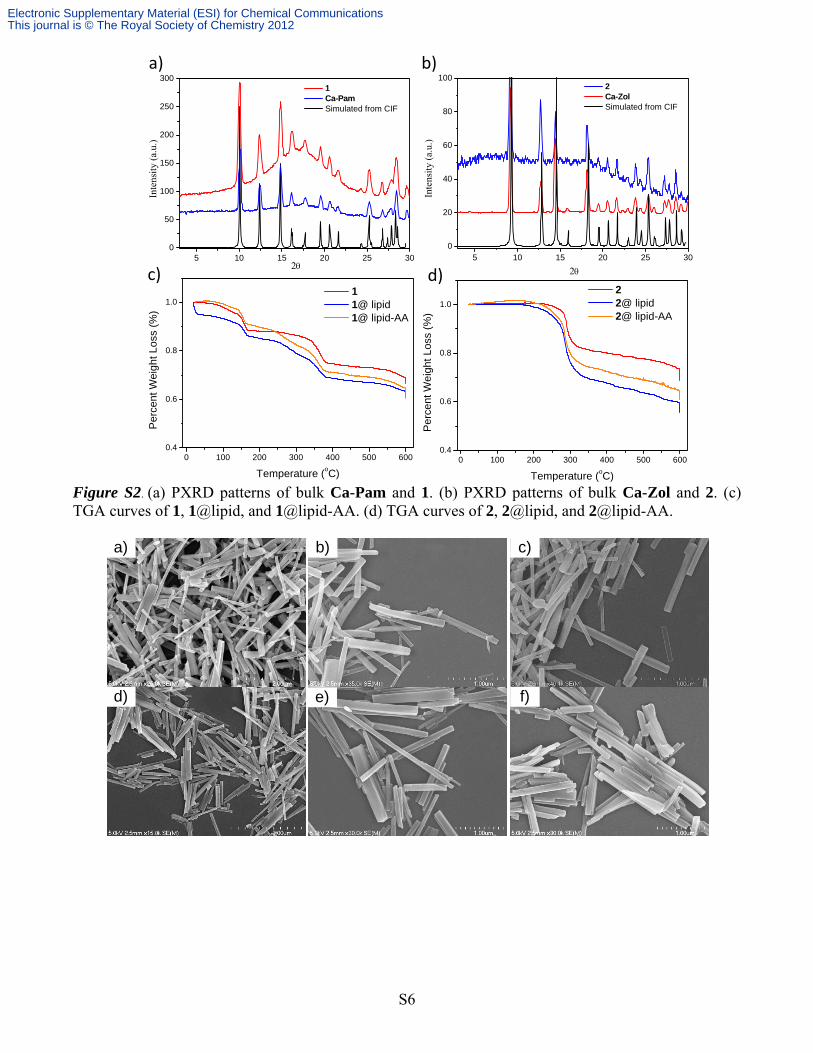
Figure S3. (a-c) SEM images of 1. (d-f) SEM images of 1@lipid. (g-i) TEM images of 1. (j-l) TEM images of 1@lipid.
Figure S4. (a-c) TEM images of 1 with uranyl acetate stain. No dark rings were observed. (d-f) TEM images of 1@lipid with uranyl acetate stain. Dark rings were observed due to the interaction between uranyl ions and the phosphate groups of DOPE.
g) h) i)
j) k) l)
d) e) f)
a) b) c)
a) b) c)
Electronic Supplementary Material (ESI) for Chemical CommunicationsThis journal is © The Royal Society of Chemistry 2012
S8
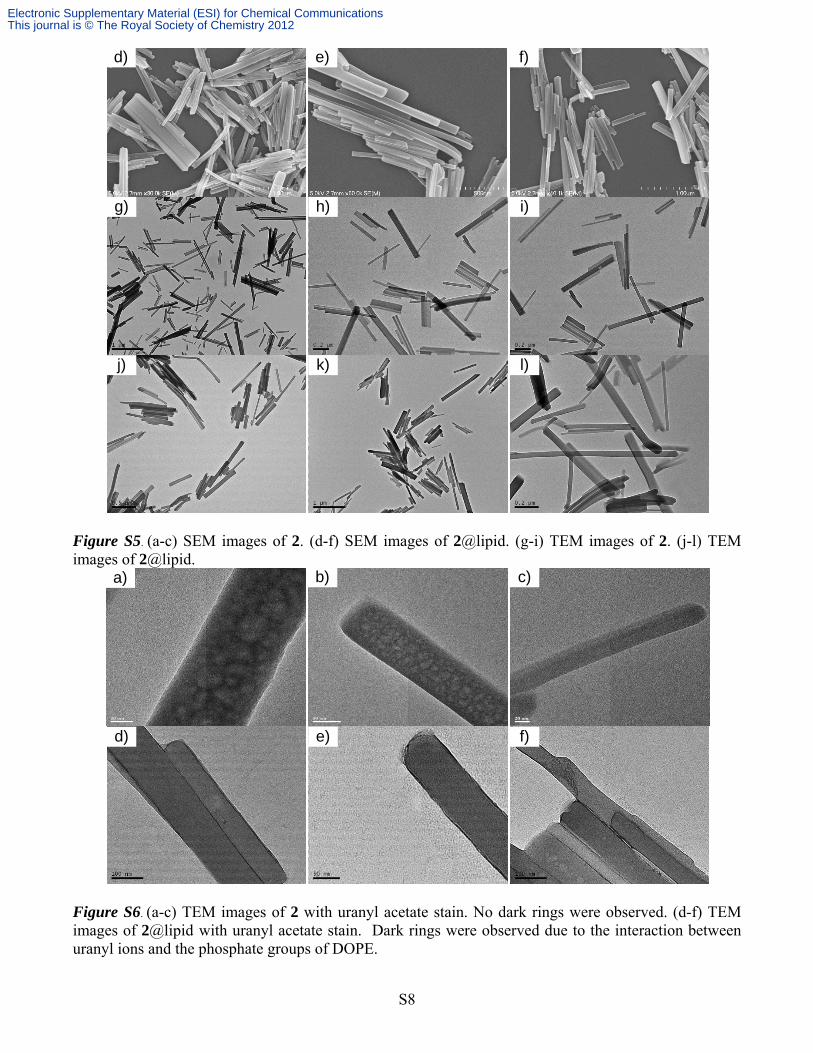
Figure S5. (a-c) SEM images of 2. (d-f) SEM images of 2@lipid. (g-i) TEM images of 2. (j-l) TEM images of 2@lipid.
Figure S6. (a-c) TEM images of 2 with uranyl acetate stain. No dark rings were observed. (d-f) TEM images of 2@lipid with uranyl acetate stain. Dark rings were observed due to the interaction between uranyl ions and the phosphate groups of DOPE.
d) e) f)
g) h) i)
j) k) l)
d) e) f)
a) b) c)
Electronic Supplementary Material (ESI) for Chemical CommunicationsThis journal is © The Royal Society of Chemistry 2012
S9
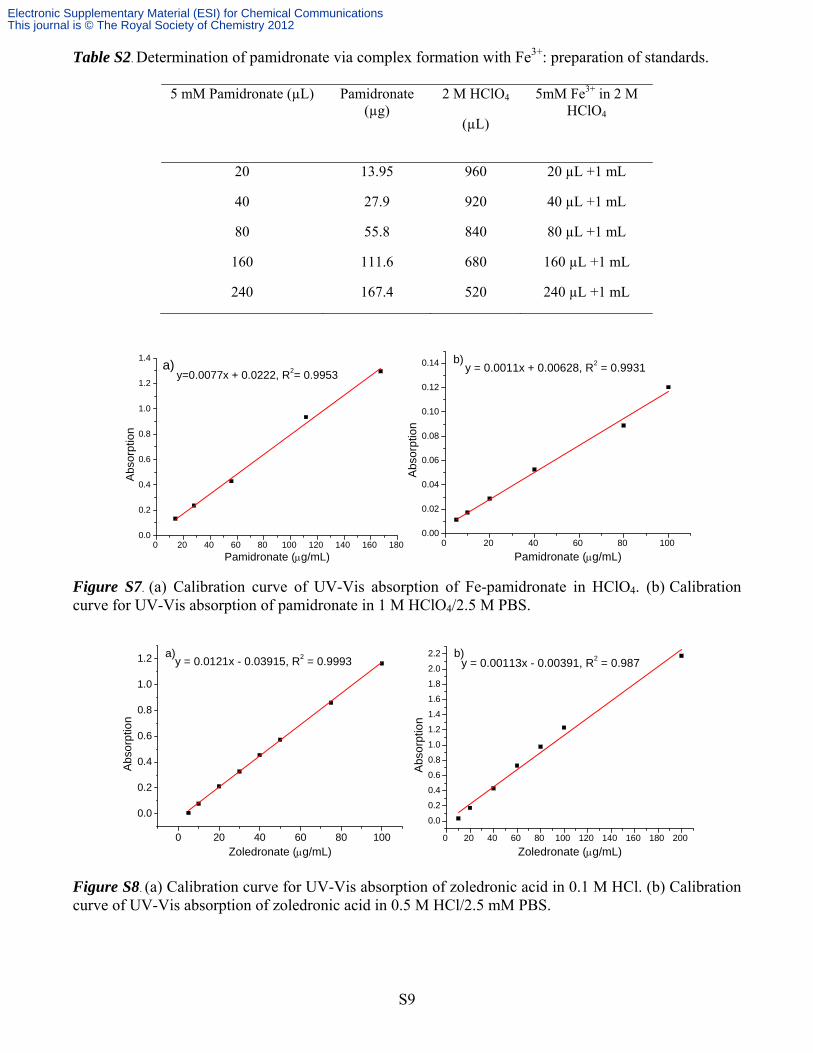
Table S2. Determination of pamidronate via complex formation with Fe3+: preparation of standards.
5 mM Pamidronate (µL) Pamidronate (µg)
2 M HClO4
(µL)
5mM Fe3+ in 2 M HClO4
20 13.95 960 20 µL +1 mL
40 27.9 920 40 µL +1 mL
80 55.8 840 80 µL +1 mL
160 111.6 680 160 µL +1 mL
240 167.4 520 240 µL +1 mL
0 20 40 60 80 100 120 140 160 1800.0
0.2
0.4
0.6
0.8
1.0
1.2
1.4
Abs
orpt
ion
Pamidronate (μg/mL)
y=0.0077x + 0.0222, R2= 0.9953a)
0 20 40 60 80 1000.00
0.02
0.04
0.06
0.08
0.10
0.12
0.14 y = 0.0011x + 0.00628, R2 = 0.9931
Abs
orpt
ion
Pamidronate (μg/mL)
b)
Figure S7. (a) Calibration curve of UV-Vis absorption of Fe-pamidronate in HClO4. (b) Calibration curve for UV-Vis absorption of pamidronate in 1 M HClO4/2.5 M PBS.
0 20 40 60 80 100
0.0
0.2
0.4
0.6
0.8
1.0
1.2
Abs
orpt
ion
Zoledronate (μg/mL)
y = 0.0121x - 0.03915, R2 = 0.9993a)
0 20 40 60 80 100 120 140 160 180 200
0.0
0.2
0.4
0.6
0.8
1.0
1.2
1.4
1.6
1.8
2.0
2.2y = 0.00113x - 0.00391, R2 = 0.987
Abs
orpt
ion
Zoledronate (μg/mL)
b)
Figure S8. (a) Calibration curve for UV-Vis absorption of zoledronic acid in 0.1 M HCl. (b) Calibration curve of UV-Vis absorption of zoledronic acid in 0.5 M HCl/2.5 mM PBS.
Electronic Supplementary Material (ESI) for Chemical CommunicationsThis journal is © The Royal Society of Chemistry 2012
S10
0 10 20 30 40 50 60 70 80
0
20
40
60
80
100
120
% V
iabi
lity
Pam (μM)
Pam 1 1@lipid 1@lipid-AA
a)
0 5 10 15 20 25 30
0
20
40
60
80
100
% V
iabi
lity
Zol (μM)
Zol 2 2@lipid 2@lipid-AA
b)
0 5 10 15 200
20
40
60
80
100
120
Pam Zol 1 1@lipid 1@lipid-AA 2 2@lipid 2@lipid-AA
Via
bilit
y (%
)
Concentration (μM)
c)
0 1 2 3 4 5 6 7 8 9 10
0
20
40
60
80
100 2@lipid 2@lipid-AA
Via
bilit
y (%
)
Zol (μM)
d)
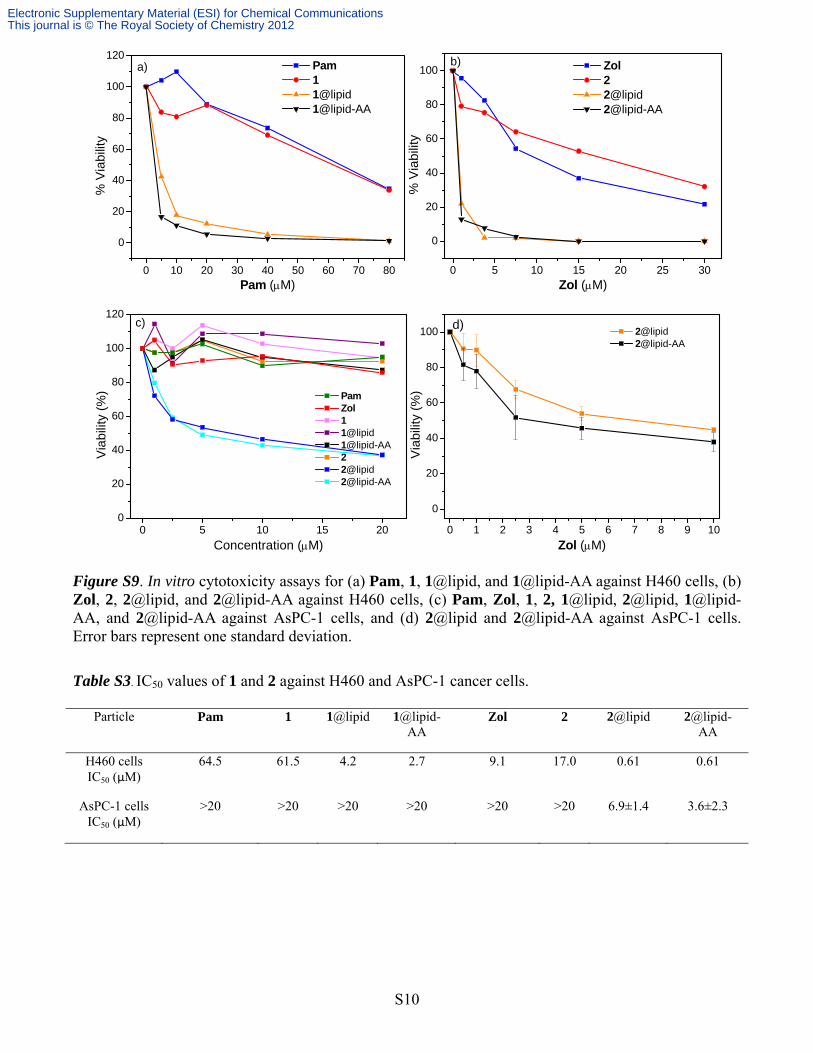
Figure S9. In vitro cytotoxicity assays for (a) Pam, 1, 1@lipid, and 1@lipid-AA against H460 cells, (b) Zol, 2, 2@lipid, and 2@lipid-AA against H460 cells, (c) Pam, Zol, 1, 2, 1@lipid, 2@lipid, 1@lipid-AA, and 2@lipid-AA against AsPC-1 cells, and (d) 2@lipid and 2@lipid-AA against AsPC-1 cells. Error bars represent one standard deviation.
Table S3. IC50 values of 1 and 2 against H460 and AsPC-1 cancer cells.
Particle Pam 1 1@lipid 1@lipid-AA
Zol 2 2@lipid 2@lipid-AA
H460 cells IC50 (μM)
64.5 61.5 4.2 2.7 9.1 17.0 0.61 0.61
AsPC-1 cells IC50 (μM)
>20 >20 >20 >20 >20 >20 6.9±1.4 3.6±2.3
Electronic Supplementary Material (ESI) for Chemical CommunicationsThis journal is © The Royal Society of Chemistry 2012
S11
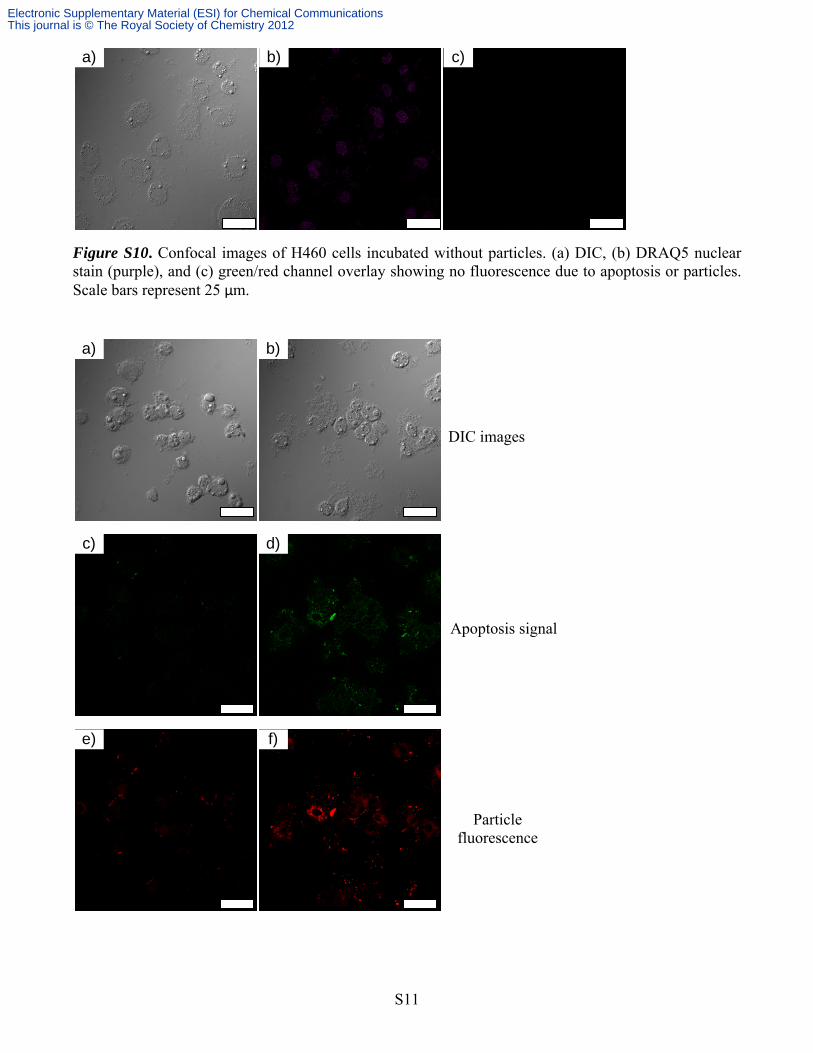
Figure S10. Confocal images of H460 cells incubated without particles. (a) DIC, (b) DRAQ5 nuclear stain (purple), and (c) green/red channel overlay showing no fluorescence due to apoptosis or particles. Scale bars represent 25 μm.
a) b) c)
a) b)
c) d)
e) f)
DIC images
Apoptosis signal
Particle fluorescence
Electronic Supplementary Material (ESI) for Chemical CommunicationsThis journal is © The Royal Society of Chemistry 2012
S12
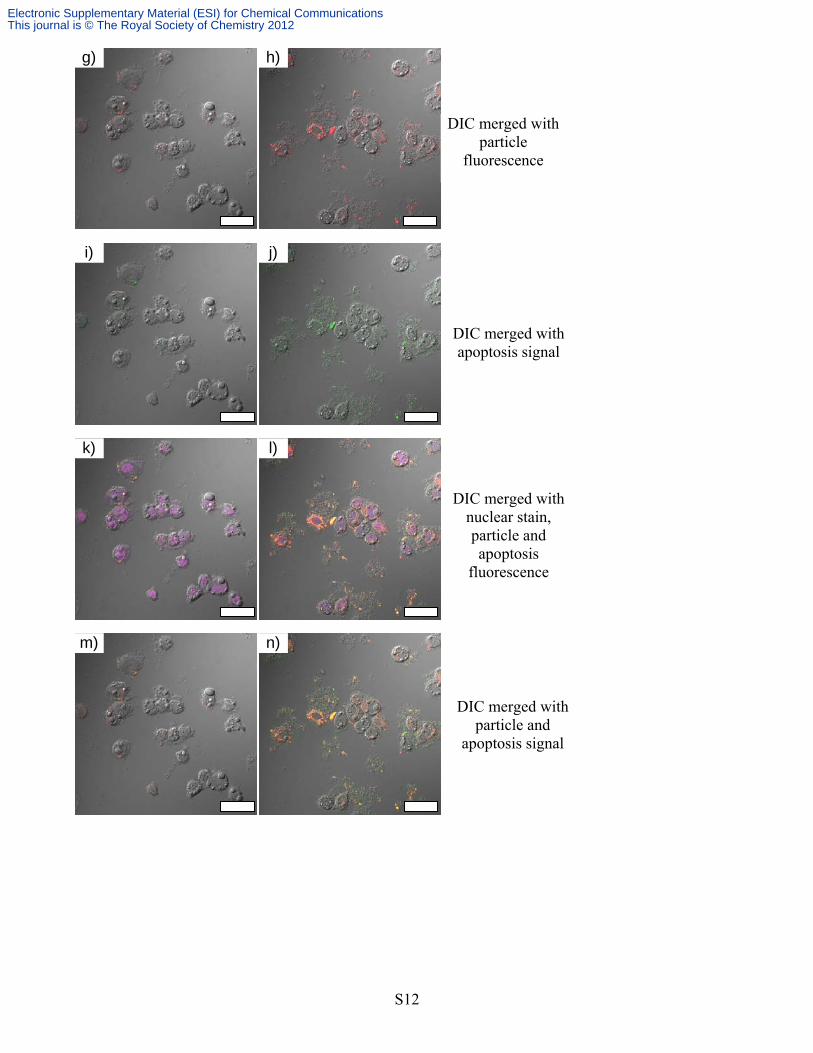
g) h)
i) j)
k) l)
m) n)
DIC merged with particle
fluorescence
DIC merged with apoptosis signal
DIC merged with nuclear stain, particle and apoptosis
fluorescence
DIC merged with particle and
apoptosis signal
Electronic Supplementary Material (ESI) for Chemical CommunicationsThis journal is © The Royal Society of Chemistry 2012
S13
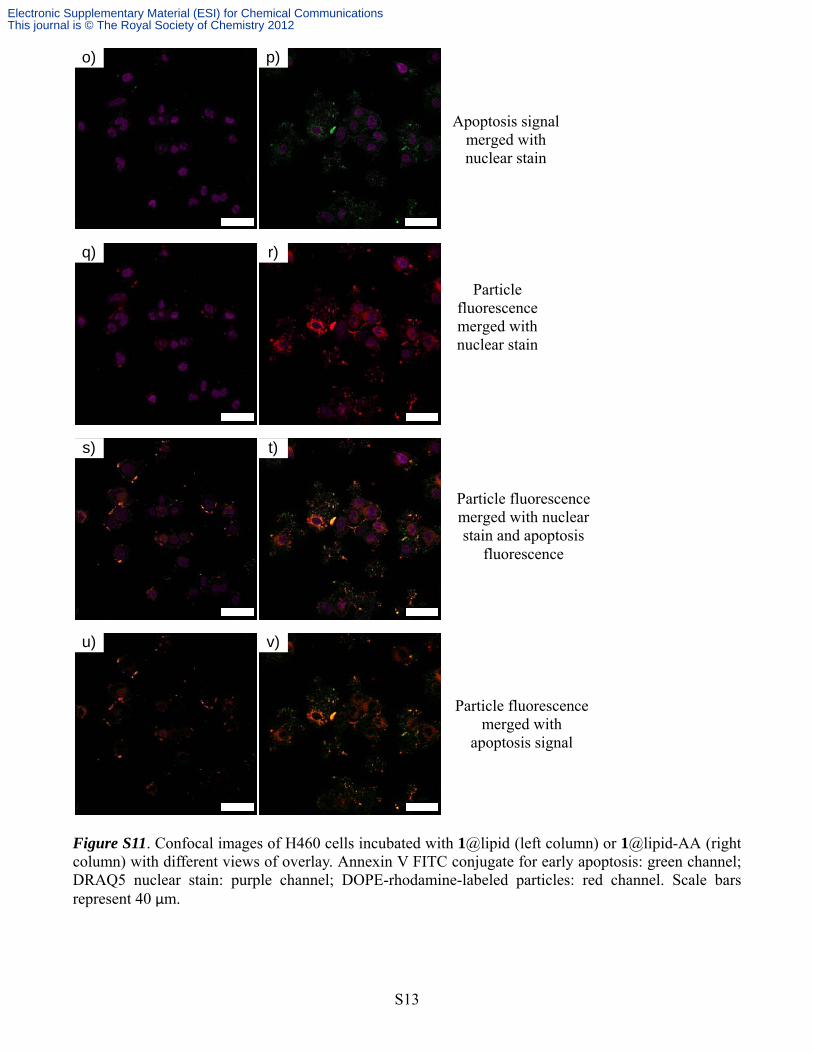
Figure S11. Confocal images of H460 cells incubated with 1@lipid (left column) or 1@lipid-AA (right column) with different views of overlay. Annexin V FITC conjugate for early apoptosis: green channel; DRAQ5 nuclear stain: purple channel; DOPE-rhodamine-labeled particles: red channel. Scale bars represent 40 μm.
o) p)
q) r)
s) t)
u) v)
Particle fluorescence merged with
apoptosis signal
Particle fluorescence merged with nuclear stain and apoptosis
fluorescence
Particle fluorescence merged with nuclear stain
Apoptosis signal merged with nuclear stain
Electronic Supplementary Material (ESI) for Chemical CommunicationsThis journal is © The Royal Society of Chemistry 2012
S14
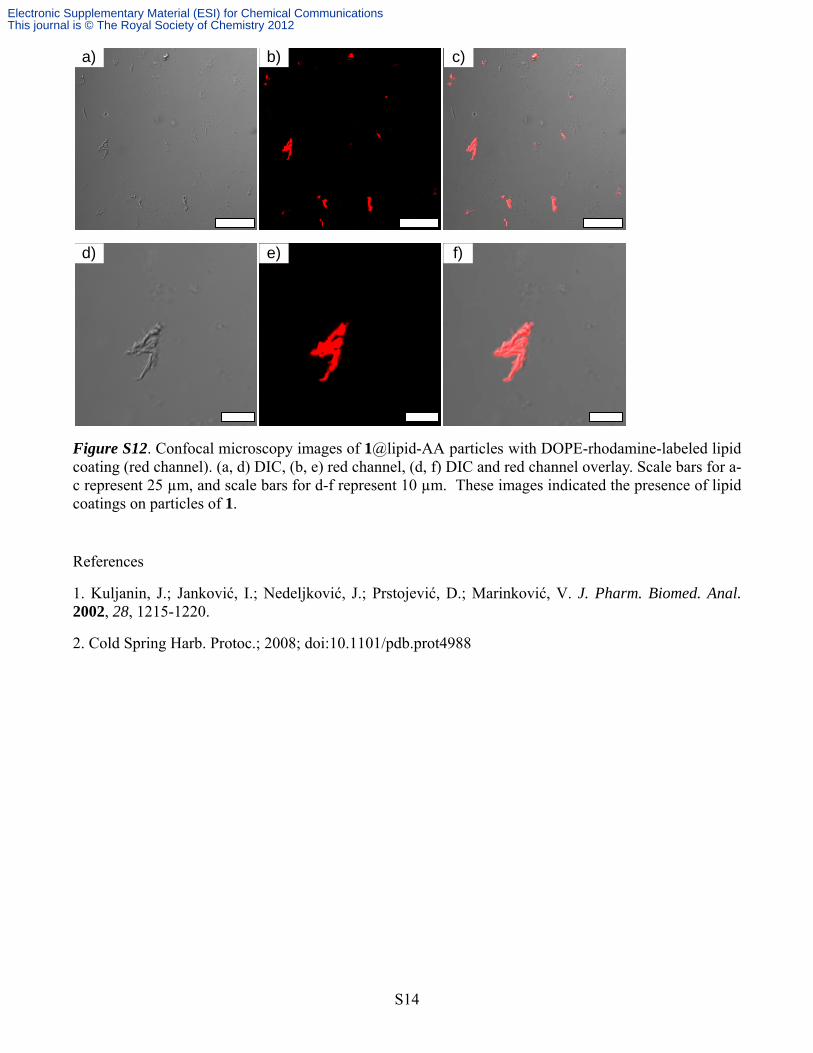
Figure S12. Confocal microscopy images of 1@lipid-AA particles with DOPE-rhodamine-labeled lipid coating (red channel). (a, d) DIC, (b, e) red channel, (d, f) DIC and red channel overlay. Scale bars for a-c represent 25 µm, and scale bars for d-f represent 10 µm. These images indicated the presence of lipid coatings on particles of 1.
References
1. Kuljanin, J.; Janković, I.; Nedeljković, J.; Prstojević, D.; Marinković, V. J. Pharm. Biomed. Anal. 2002, 28, 1215-1220.
2. Cold Spring Harb. Protoc.; 2008; doi:10.1101/pdb.prot4988
a) b) c)
d) e) f)
Electronic Supplementary Material (ESI) for Chemical CommunicationsThis journal is © The Royal Society of Chemistry 2012