Embed Size (px)
Citation preview

© 2009 South-Western, a part of Cengage Learning, all rights reserved
C H A P T E R
Supply, Demand, and
Government Policies
Economics P R I N C I P L E S O F
N. Gregory Mankiw
Premium PowerPoint Slides
by Vance Ginn & Ron Cronovich

In this chapter,
look for the answers to these questions:
What are price ceilings and price floors?
What are some examples of each?
How do price ceilings and price floors affect
market outcomes?
How do taxes affect market outcomes?
How do the effects depend on whether
the tax is imposed on buyers or sellers?
What is the incidence of a tax?
What determines the incidence? 1

SUPPLY, DEMAND, AND GOVERNMENT POLICIES 2
Government Policies That Alter the Private Market Outcome
Price controls (video)
______________: a legal maximum on the price
of a good or service Example: rent control
____________: a legal minimum on the price of
a good or service Example: minimum wage
Taxes
The govt can make buyers or sellers pay a
specific amount on each unit bought/sold.
We will use the supply/demand model to see
how each policy affects the market outcome
(the price buyers pay, the price sellers receive,
and eq’m quantity).

SUPPLY, DEMAND, AND GOVERNMENT POLICIES 3
EXAMPLE 1: The Market for Apartments Price Ceiling – Rent Control
Eq’m w/o
price
controls
P
Q D
S Rental
price of
apts
$800
300
Quantity of
apartments

SUPPLY, DEMAND, AND GOVERNMENT POLICIES 4
How Price Ceilings Affect Market Outcomes
A price ceiling
above the
eq’m price is
____________–
has no effect
on the market
outcome.
P
Q D
S
$800
300
Price
ceiling $1000

SUPPLY, DEMAND, AND GOVERNMENT POLICIES 5
How Price Ceilings Affect Market Outcomes
The eq’m price
($800) is above
the ceiling and
therefore
____________.
The ceiling
is a binding
constraint
on the price,
causes a
shortage.
P
Q D
S
$800
Price
ceiling $500
250 400
shortage

SUPPLY, DEMAND, AND GOVERNMENT POLICIES 6
How Price Ceilings Affect Market Outcomes
In the long run,
supply and
demand
are more
____________.
So, the
shortage
is larger.
P
Q D
S
$800
150
Price
ceiling $500
450
shortage

SUPPLY, DEMAND, AND GOVERNMENT POLICIES 7
Shortages and Rationing With a shortage, sellers must
__________________________________________.
Some ________________________________:
(1) Long lines
(2) Discrimination according to sellers’ biases
These mechanisms are often unfair, and inefficient.
In contrast, when prices are not controlled,
the rationing mechanism is efficient (the goods
go to the buyers that value them most highly)
and impersonal (and thus fair).

© 2009 South-Western, a part of Cengage Learning, all rights reserved
C H A P T E R
1973, OPEC raised the price of crude oil
Reduced the supply of gasoline
Long lines at gas stations
What was responsible for the long gas lines?
OPEC: created shortage of gasoline
U.S. government regulations: price ceiling on
gasoline
Before OPEC raised the price of crude oil – Equilibrium price - below price ceiling: no effect
When the price of crude oil rose – Reduced the supply of gasoline
– Equilibrium price – above price ceiling: shortage 8
Example 1.5: Lines at the gas pump

The market for gasoline with a price ceiling
2
9
Price of
Gasoline
Quantity of Gasoline 0
Demand
Q1
(a) The price ceiling on gasoline
is not binding
Panel (a) shows the gasoline market when the price ceiling is not binding because the equilibrium price,
P1, is below the ceiling. Panel (b) shows the gasoline market after an increase in the price of crude oil (an
input into making gasoline) shifts the supply curve to the left from S1 to S2. In an unregulated market, the
price would have risen from P1 to P2. The price ceiling, however, prevents this from happening. At the
binding price ceiling, consumers are willing to buy QD, but producers of gasoline are willing to sell only QS.
The difference between quantity demanded and quantity supplied, QD – QS, measures the gasoline
shortage.
(b) The price ceiling on gasoline
is binding
P1
Supply, S1
Price ceiling
1. Initially, the
price ceiling is
not binding …
Price of
Gasoline
Quantity of Gasoline 0
Demand
Q1
P1
S1
Price ceiling
2…but when
supply falls…
S2
P2
3…the price
ceiling becomes
binding…
QS QD
4. …resulting
in a shortage

© 2009 South-Western, a part of Cengage Learning, all rights reserved
C H A P T E R
Price floor: minimum wage (video)
Lowest legal price for labor that any employer
may pay
Fair Labor Standards Act of 1938
Ensure workers a minimally adequate standard of
living
Now at _________________ per hour
10
Example 2: Price Floor
The minimum wage

© 2009 South-Western, a part of Cengage Learning, all rights reserved
C H A P T E R
Market for labor
Workers - __________________
Firms – ____________________
If minimum wage – above equilibrium
Unemployment
Higher income - workers who have jobs
Lower income - workers who cannot find jobs
The minimum wage
11

© 2009 South-Western, a part of Cengage Learning, all rights reserved
C H A P T E R
Impact of the minimum wage
Workers with high skills and much experience
Not affected: Equilibrium wages - above the
minimum
Minimum wage - not binding
Teenage labor – least skilled and least
experienced
Low equilibrium wages
Willing to accept a lower wage in exchange for on-
the-job training
Minimum wage – binding
The minimum wage
12

SUPPLY, DEMAND, AND GOVERNMENT POLICIES 13
EXAMPLE 2: The Market for Unskilled Labor Price Floor - Minimum Wage
Eq’m w/o
price
controls
W
L D
S Wage
paid to
unskilled
workers $7.25
500
Quantity of
unskilled workers

SUPPLY, DEMAND, AND GOVERNMENT POLICIES 14
How Price Floors Affect Market Outcomes
W
L D
S
$7.25
500
Price
floor $6
A price floor
_________ the
eq’m price is
not binding –
has no effect
on the market
outcome.

SUPPLY, DEMAND, AND GOVERNMENT POLICIES 15
How Price Floors Affect Market Outcomes
W
L D
S
$7.25
Price
floor $9.50
The eq’m wage ($4)
is below the floor
and therefore
illegal.
The floor
is a binding
constraint
on the wage,
causes a
_______________
(i.e.,
unemployment).
400 550
labor
surplus

SUPPLY, DEMAND, AND GOVERNMENT POLICIES 16
Min wage laws
do not affect
highly skilled
workers.
They do affect
teen workers.
Studies:
A 10% increase
in the min wage
raises teen
unemployment
by 1-3%.
The Minimum Wage
W
L D
S
$4
Min.
wage $5
400 550
unemployment

How the minimum wage affects the labor market
5
17
Wage
Quantity
of Labor
0
Labor
demand
Equilibrium
employment
(a) A free labor market
Panel (a) shows a labor market in which the wage adjusts to balance labor supply and labor
demand. Panel (b) shows the impact of a binding minimum wage. Because the minimum wage is
a price floor, it causes a surplus: The quantity of labor supplied exceeds the quantity demanded.
The result is unemployment.
(b) A Labor Market with a
Binding Minimum Wage
Equilibrium
wage
Labor
supply
Wage
Quantity
of Labor
0
Minimum
wage
Quantity
demanded
Quantity
supplied
Labor surplus
(unemployment)
Labor
demand
Labor
supply

A C T I V E L E A R N I N G 1
Price controls
40
50
60
70
80
90
100
110
120
130
140
50 60 70 80 90 100 110 120 130Q
P S
0
The market for
hotel rooms
D
Determine
effects of:
A. $90 price
ceiling
B. $90 price
floor
C. $120 price
floor
18

A C T I V E L E A R N I N G 1
A. $90 price ceiling
40
50
60
70
80
90
100
110
120
130
140
50 60 70 80 90 100 110 120 130Q
P S
0
The market for
hotel rooms
D
The price
falls to $90.
Buyers
demand
120 rooms,
sellers supply
90, leaving a
shortage.
___________
Price ceiling
19

A C T I V E L E A R N I N G 1
B. $90 price floor
40
50
60
70
80
90
100
110
120
130
140
50 60 70 80 90 100 110 120 130Q
P S
0
The market for
hotel rooms
D
Eq’m price is
above the floor,
so floor is not
binding.
P = $100,
Q = 100 rooms. Price floor
20

A C T I V E L E A R N I N G 1
C. $120 price floor
40
50
60
70
80
90
100
110
120
130
140
50 60 70 80 90 100 110 120 130Q
P S
0
The market for
hotel rooms
D
The price
rises to $120.
Buyers
demand
60 rooms,
sellers supply
120, causing a
surplus.
__________
Price floor
21

SUPPLY, DEMAND, AND GOVERNMENT POLICIES 22
Evaluating Price Controls
Recall one of the Ten Principles from Chapter 1:
Markets are usually a good way
to organize economic activity.
Prices are the signals that guide the allocation of
society’s resources. This allocation is altered
when policymakers restrict prices.
Price controls often intended to help the poor,
but often hurt more than help.

SUPPLY, DEMAND, AND GOVERNMENT POLICIES 23
Taxes
The govt levies taxes on many goods & services
to raise revenue to pay for national defense,
public schools, etc.
The govt can make buyers or sellers pay the tax.
The tax can be a % of the good’s price,
or a specific amount for each unit sold.
For simplicity, we analyze ______________
only.

SUPPLY, DEMAND, AND GOVERNMENT POLICIES 24
S1
EXAMPLE 3: The Market for Pizza Why put a tax on pizza?
Eq’m
w/o tax P
Q
D1
$10.00
500

SUPPLY, DEMAND, AND GOVERNMENT POLICIES 25
S1
D1
$10.00
500
A Tax on Buyers
The price buyers pay
is now $1.50 higher than
the market price P.
P would have to fall
by $1.50 to make
buyers willing
to buy same Q
as before.
E.g., if P falls
from $10.00 to $8.50,
buyers still willing to
purchase 500 pizzas.
P
Q D2
Effects of a $1.50 per
unit tax on buyers
$8.50
Hence, a tax on buyers
shifts the D curve down
by the amount of the tax.
Tax

SUPPLY, DEMAND, AND GOVERNMENT POLICIES 26
S1
D1
$10.00
500
A Tax on Buyers
P
Q D2
$11.00 PB =
$9.50 PS =
Tax
Effects of a $1.50 per
unit tax on buyers
New eq’m:
Q = 450
Sellers
receive
______________
Buyers pay
______________
Difference
between them
= $1.50 = tax 450

SUPPLY, DEMAND, AND GOVERNMENT POLICIES 27
450
S1
The Incidence of a Tax: how the burden of a tax is shared among
market participants
P
Q
D1
$10.00
500
D2
$11.00 PB =
$9.50 PS =
Tax
In our
example,
buyers pay
__________,
sellers get
__________.
SUPPLY, DEMAND, AND GOVERNMENT POLICIES 28
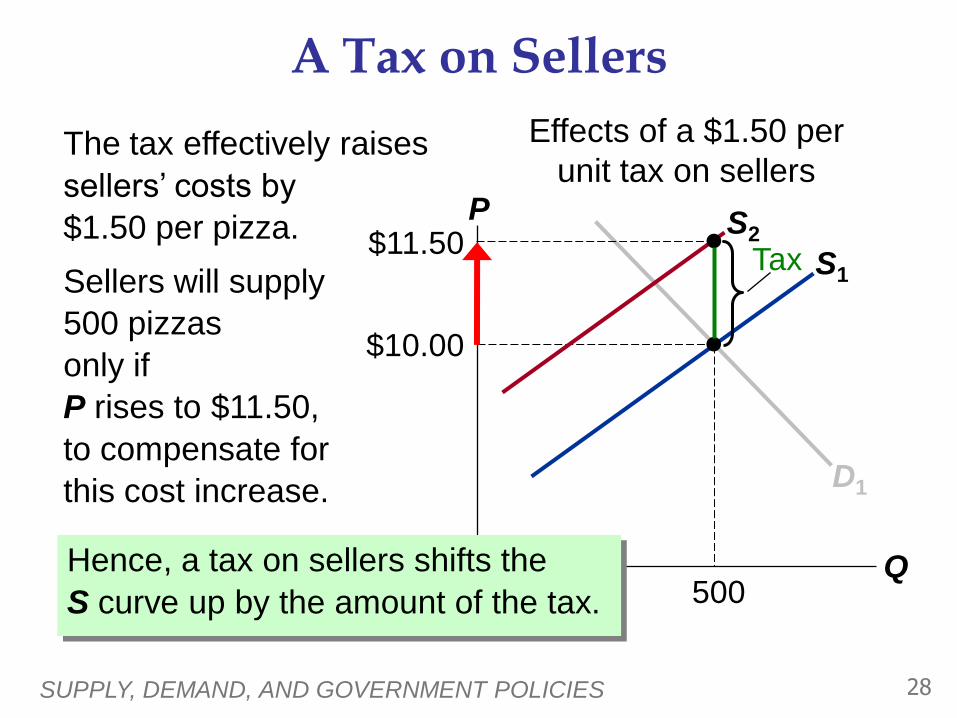
S1
A Tax on Sellers
P
Q
D1
$10.00
500
S2
Effects of a $1.50 per
unit tax on sellers The tax effectively raises
sellers’ costs by
$1.50 per pizza.
Sellers will supply
500 pizzas
only if
P rises to $11.50,
to compensate for
this cost increase.
$11.50
Hence, a tax on sellers shifts the
S curve up by the amount of the tax.
Tax

SUPPLY, DEMAND, AND GOVERNMENT POLICIES 29
S1
A Tax on Sellers
P
Q
D1
$10.00
500
S2
450
$11.00 PB =
$9.50 PS =
Tax
Effects of a $1.50 per
unit tax on sellers New eq’m:
Q = 450
Buyers pay
PB = $11.00
Sellers
receive
PS = $9.50
Difference
between them
= $1.50 = tax

SUPPLY, DEMAND, AND GOVERNMENT POLICIES 30
S1
The Outcome Is the Same in Both Cases!
What matters
is this:
___________
___________
between the
price buyers
pay and the
price sellers
receive.
P
Q
D1
$10.00
500 450
$9.50
$11.00 PB =
PS =
Tax
The effects on P and Q, and the tax incidence are the
same whether the tax is imposed on buyers or sellers!

A C T I V E L E A R N I N G 2
Effects of a tax
40
50
60
70
80
90
100
110
120
130
140
50 60 70 80 90 100 110 120 130Q
P S
0
The market for
hotel rooms
D
Suppose govt
imposes a tax
on buyers of
$30 per room.
Find new
Q, PB, PS,
and incidence
of tax.

A C T I V E L E A R N I N G 2
Answers
40
50
60
70
80
90
100
110
120
130
140
50 60 70 80 90 100 110 120 130Q
P S
0
The market for
hotel rooms
D
Q = 80
PB = $110
PS = $80
Incidence
__________
__________
Tax
PB =
PS =

SUPPLY, DEMAND, AND GOVERNMENT POLICIES 33
Elasticity and Tax Incidence
CASE 1: Supply is more elastic than demand
P
Q
D
S
Tax
____________
of tax burden
____________
of tax burden
Price if no tax
PB
PS
It’s easier
for sellers
than buyers
to leave the
market.
So buyers
bear most of
the burden
of the tax.

SUPPLY, DEMAND, AND GOVERNMENT POLICIES 34
Elasticity and Tax Incidence
CASE 2: Demand is more elastic than supply
P
Q
D
S
Tax
Buyers’ share
of tax burden
Sellers’ share
of tax burden
Price if no tax
PB
PS
It’s easier
for buyers
than sellers
to leave the
market.
Sellers bear
most of the
burden of
the tax.

© 2009 South-Western, a part of Cengage Learning, all rights reserved
C H A P T E R
Payroll taxes
Deducted from the amount you earned
By law, the tax burden:
Half of the tax - ________________
Out of firm’s revenue
Half of the tax - ________________
Deducted from workers’ paychecks
Tax incidence analysis
Payroll tax = tax on a good
Good = labor
Price = wage
Can congress distribute the burden of a
payroll tax?
35

© 2009 South-Western, a part of Cengage Learning, all rights reserved
C H A P T E R
Introduce payroll tax
Wage received by workers falls
Wage paid by firms rises
Workers and firms share the burden of the tax
Not necessarily fifty-fifty as the legislation requires
Lawmakers
Can decide whether a tax comes from the buyer’s
pocket or from the seller’s
Cannot legislate the true burden of a tax
Tax incidence: ____________________________
Can congress distribute the burden of a
payroll tax?
36

A payroll tax
8
37
Wage
Quantity of
Labor
0
Labor
demand
Labor
supply
Wage firms pay
Wage without tax
Wage workers
receive
Tax
wedge
A payroll tax places a wedge between the wage that workers receive and the wage that firms pay.
Comparing wages with and without the tax, you can see that workers and firms share the tax
burden. This division of the tax burden between workers and firms does not depend on whether
the government levies the tax on workers, levies the tax on firms, or divides the tax equally
between the two groups.

Taxes
Elasticity and tax incidence
Dividing the tax burden
Very elastic supply and relatively inelastic
demand
Sellers – ________________________
Buyers – ________________________
Relatively inelastic supply and very elastic
demand
Sellers – ________________________
Buyers – ________________________
38

Taxes
Tax burden - falls more heavily on the side of the
market that is _________________
Small elasticity (inelastic) of demand
Buyers do not have good alternatives to
consuming this good
Small elasticity (inelastic) of supply
Sellers do not have good alternatives to
producing this good
39

SUPPLY, DEMAND, AND GOVERNMENT POLICIES 40
CONCLUSION: Government Policies and the Allocation of Resources
Each of the policies in this chapter affects the
allocation of society’s resources.
Example 1: A tax on pizza reduces eq’m Q.
With less production of pizza, resources
(workers, ovens, cheese) will become available
to other industries.
Example 2: A binding minimum wage causes
a surplus of workers, a waste of resources.
So, it’s important for policymakers to apply such
policies very carefully.

CHAPTER SUMMARY
A price ceiling is a legal maximum on the price of a
good. An example is rent control. If the price
ceiling is below the eq’m price, it is binding and
causes a shortage.
A price floor is a legal minimum on the price of a
good. An example is the minimum wage. If the
price floor is above the eq’m price, it is binding
and causes a surplus. The labor surplus caused
by the minimum wage is unemployment.
41
CHAPTER SUMMARY
A tax on a good places a wedge between the price
buyers pay and the price sellers receive, and
causes the eq’m quantity to fall, whether the tax is
imposed on buyers or sellers.
The incidence of a tax is the division of the burden
of the tax between buyers and sellers, and does
not depend on whether the tax is imposed on
buyers or sellers.
The incidence of the tax depends on the price
elasticities of supply and demand. 42