Embed Size (px)
Citation preview
1
Demand Response experience in Europe: policies, programmes and
implementation
Jacopo Torriti*, Mohamed G. Hassan, Mathew Leach
Centre for Environmental Strategy, University of Surrey, Guildford, GU2 7XH,
United Kingdom
ABSTRACT
Over the last few years, load growth, increases in intermittent generation, declining
technology costs and increasing recognition of the importance of customer behaviour
in energy markets have brought about a change in the focus of Demand Response in
Europe. The long standing programmes involving large industries, through
interruptible tariffs and time of day pricing, have been increasingly complemented by
programmes aimed at commercial and residential customer groups. Developments in
Demand Response vary substantially across Europe reflecting national conditions and
triggered by different sets of policies, programmes and implementation schemes. This
paper examines experiences within European countries as well as at European Union
(EU) level, with the aim of understanding which factors have facilitated or impeded
advances in Demand Response. It describes the initiatives, what is known about the
technical and economic potentials, and the policies of various European countries,
with in-depth case studies of the United Kingdom, Italy and Spain. It is concluded that
while business programmes, technical and economic potentials vary across Europe,
there are common reasons as to why coordinated Demand Response policies have
been slow to emerge. This is because of the limited knowledge that has been
developed about DR energy saving capacities; the high cost estimates for DR
technologies and infrastructures; and the policy-makers focus on creating the
conditions for liberalising the EU energy markets.
KEYWORDS
Demand Response; European Union; market liberalisation; smart meter.
2
1 INTRODUCTION
Demand Response (DR) refers to a wide range of actions which can be taken at the
customer side of the electricity meter in response to particular conditions within the
electricity system (such as peak period network congestion or high prices). Leach et al
explore the diversity of timescales, types of signal and involvement of customers in
different types of demand side action [1]. That paper demonstrates a spectrum of
actions, sharing common influences, but also draws some clear differences between
actions taken to effect long term improvement in the efficiency with which energy
services are delivered and actions taken to meet shorter term needs, such as peak load
shifting. Within several European countries there are long standing arrangements or
programmes to harness the largest and most energy intensive industrial customers in
DR, through interruptible tariffs or time of day pricing, and some system operators
make use of large avoided loads as part of their system balancing activities. Reflecting
rising challenges from load growth, ambitions for deeper uptake of “intermittent”
generation, technological developments in low cost power electronics and IT and
generally growing recognition of the importance of customer “behaviour”, there is
increasing interest in Europe in DR opportunities more widely, across smaller
commercial and residential customer groups.
In principle DR initiatives can bring about significant reductions in electricity prices,
as shifts of demand during peaks could reduce the need for higher marginal cost
generation, offer lower cost system balancing and decrease grid reinforcement
investment [2]. DR initiatives can also play a valuable role in achieving ambitious
environmental policy objectives, through facilitating greater connection of
intermittent renewable generation. In practice, however, markets do not always
respond as they should and there are obstacles that prevent full implementation of DR
in the market. The main obstacles to DR are recognised to be the inelasticity of
demand and low level of participation due to asymmetries in information. The
literature dedicates significant attention to these two broad problems, underlying, on
the one hand, the difficulties of flattening the demand curve for electricity due to lack
of policies aimed at designing Time of Use tariffs that will produce the greatest shifts
in usage [3, 4] and slow deployment of the technical infrastructures, e.g. smart
metering, necessary to facilitate demand-side participation [5].
3
In addition to these two broad obstacles, there are other factors, specific to the
European context, which have played a crucial role in preventing market penetration
of DR. Examining these factors is vital not only in order to appreciate what has
prevented significant implementation of DR to date, but also to explore possible
future developments in Demand-Side Management and demand-side participation in
Europe.
An accurate picture of DR in Europe needs to take into account various aspects: (i)
the DR initiatives and programs which have been undertaken in the last five years; (ii)
the estimates that have been derived on the technical and economic potential of DR in
Europe, as well as the factors which are preventing the full exploitation of such
potential; and (iii) the policies which have been put forward in order to foster DR
initiatives.
This paper examines DR experiences within European countries as well as at EU level
with the aim of understanding what has favoured or hampered the development of DR
in Europe. It introduces the factors instrumental in facilitating or hindering market
penetration of DR in European electricity markets (section 2). It defines the economic
and technical potential for DR in the European Union, and describes the evolution of
EU policies on DR (section 3). It presents an overview of DR initiatives in various
European countries; reviews the studies carried out at national level on DR; examines
in depth the DR initiatives, DR potential and DR policies of three European countries:
UK, Italy and Spain (section 4). It discusses the factors presented in section 2 against
findings from EU and national levels (section 5).
2 FACTORS SHAPING DR IN EUROPEAN ELECTRICITY MARKETS
2.1 European Electricity Markets
European Parliament and Council Directives led to liberalisation in EU energy
markets [6]. The directives lay down the general conditions required for the creation
of a single Internal Electricity Market (IEM) in Europe, but avoided specifying a
single market model. Instead the EU gave its Member States the freedom to design
their markets and regulatory frameworks to suit national conditions, so long as
4
broader objectives - such as open and fair third party access to national markets and
introduction of competition - were adopted. One of the aims was to offer end-users
choice between suppliers so that they can benefit from lower prices for energy and a
better quality of service.
The EU Treaties of Rome (1957) and Maastricht (1993) laid the foundation for the
creation of an internal market in the European Union with free movement of people,
goods, and capital. In the past, supply of electricity was considered a service of
general economic interest and consequently not subject to the normal rules of
competition as established by the EU treaties. The European Court of Justice ruled on
several occasions that electricity is a good, putting an end to the consideration of
electricity as a public service. The liberalization process established by directives
96/92/EC and 98/30/EG led to the unbundling of activities. Because of the separate
legal treatment of the commodity electricity (that is, the good) and the supply of
electricity - that is the services which include the utility aspects as well as reliability
of supply- electricity in Europe must be treated as having both characteristics of a
commodity and of a service [7].
Today the European power market is a corporation of regional markets, most of which
are physically inter-connected. Technical standards and market rules vary, but in most
cases the barriers to trade in electricity across the borders have been lifted. The EU-
271 consumed 2.7 million GWh of electricity in 2007
and traded 6.3 million GWh in
the same year.
The rapid move to restructuring and privatization of energy markets in many parts of
Europe since the late 1980s has probably had a mixed effect on the fortunes of
demand side activity, including DR. The architects of most market systems have
explicitly designed in mechanisms by which demand side bidding for decreases in
consumption can compete with generation, thus at least in principle placing DR on an
even, competitive basis. However, the move away from integrated planning via state-
run institutions towards private sector decision making and investment seems to have
1 The European Union consist of the following Member States: Austria, Belgium,
Bulgaria, Cyprus, the Czech Republic, Denmark, Estonia, Finland, France, Germany,
Greece, Hungary, Ireland, Italy, Latvia, Lithuania, Luxembourg, Malta, the Netherlands,
Poland, Portugal, Romania, Slovakia, Slovenia, Spain, Sweden, and the United Kingdom.
5
favoured more traditional supply side investments as the route to keep pace with
economic growth and rising electricity service demands. The energy efficiency
literature is rich with evidence and analysis of why this is often the case, with higher
transaction costs in accessing numerous smaller opportunities compared to single
large investments one key aspect.
3 DEMAND RESPONSE ACTIVITY AT THE EUROPEAN UNION LEVEL
3.1 DR programmes
It would be inappropriate to speak of harmonised EU-wide DR programmes. Some
related initiatives are in place with regards to renewable energy technologies,
labelling programmes and energy-efficient systems. In addition, there are numerous
DR programmes and initiatives at Member States level, as described in section 4, but
not a single DR initiative for the internal market as a whole.
A simple explanation for the absence of EU initiatives on DR is the actual inexistence
of a single European energy market. The difficulties in finding arrangements for
setting up the very basic structure of the internal market emerged with the discussions
around the “third legislative package” for liberalising EU energy markets. The
package entails a set of measures aimed at ensuring "the effective separation between
the operation of electricity and gas transmission networks from supply and generation
activities" [8]. To achieve effective separation, the Commission proposed two main
policy alternatives (i) “ownership unbundling”, i.e. the separation of powers in
companies that control both energy generation and transmission, and (ii) the
introduction of Independent System Operators (ISO), under which companies
involved in energy production and supply would be allowed to retain their network
assets, but they would not manage commercial and investment decisions, which
would be left to an independent company – the ISO - to be designated by national
governments. Divergences between the European Commission and a number of
Member States, including France and Germany, which opposed the Commission’s
initiative towards “ownership unbundling” meant that this legislative package has not
been approved yet [9]. Notwithstanding the absence of any harmonised DR
programmes, there are studies investigating the technical and economic potential of
6
demand response participation, as well as a number of EU policies linked with DR,
which are worth looking at.
3.2 DR potential in the EU
With final annual electricity consumption across the main EU-152 Member States
increasing by 2.1% in recent years [10], and with an increase of 1.5% forecasted for
EU-27 by 2020 [11], additional measures aiming at the rationalisation of the use of
electricity seem necessary, besides the ones already in place (e.g. renewable energy
technologies, labelling programmes and energy-efficient systems). Preoccupations
around the expected increase in demand have fed much recent debate on security of
supply in Europe. However, from a strict market perspective, the effects of the
increase of electricity demand have been so far mitigated by the still positive import-
export ratio in most European countries [12].
Awareness of these aggregate figures might justify the belayed EU intervention on
DR initiatives. At the same time, studies and forecasting projects have been launched
to understand the full technical and economic potential of DR.
One attempt has been made by the IEA programme, Task XII. This study observes
that although the implementation of smart meters is taking a long time, some
European utilities along with telecommunication companies have been developing
smart energy boxes that allow customers to (i) plan the use of electric appliances; (ii)
manage directly several domestic appliances at the same time; (iii) manage
decentralised generation facilities. Smart energy boxes can replace meters because
they are provided with data loggers capable of reading on the old meters and reporting
on the boxes. However, an integrated plan for smart energy boxes has not been
developed yet due to the perceived excessive costs.
Other technologies developed in recent years –and still being developed- might
exploit the full potential of DR in Europe. Intelligent electric consumption control
strategies, for instance, can lead to significant energy and cost savings in various
energy-consuming segments across Europe (e.g. public lighting, tertiary sector
2 EU-15 Member States include: Austria, Belgium, Denmark, Finland, France, Germany, Greece,
Ireland, Italy, Luxembourg, the Netherlands, Portugal, Spain, Sweden and the United Kingdom.
7
buildings, residential buildings and industry). These intelligent devices can be
associated with either Demand Side Management (DSM) or DR programmes,
depending on the duration of their effects. The duration of their impacts is also strictly
related to market penetration. To a high market penetration would correspond a higher
probability of long-term economic impacts of intelligent devices on the market. A
recent study estimated that, under the hypothesis of high market penetration, the EU-
15 area would experience a reduction of between 1% and 4% in primary energy,
between 1.5% and 5% in CO2 emissions and between 2% and 8% saving in
investment costs for power generation expansion [13]. In summary, technological
progress in some European countries is providing the tools necessary to allow DR, by
allowing customers to react to and participate in the electric market. As technology
and innovation further develop, greater opportunities for demand responsiveness grow
in the marketplace, as is explained in depth for individual countries in Section 4.
The broad economic and environmental potentials of DR for the EU have also been
assessed under scenario analysis in a recent study carried out by Capgemini [14].
Under the most moderate scenario, which takes into account that the implementation
of devices such as smart meters in Europe is rather slow, EU-wide benefits of DR by
2020 would comprise 100 TWh of annual energy saving; an annual reduction of 30
million tons of CO2; and tens of billions of Euros both in terms of savings in avoided
investment relating to peak generation capacity and Transmission & Distribution, and
savings for customers in electricity bills.
Other studies investigating the economic potential of DR in Europe have focused
mainly on individual countries, looking at pilot studies in order to understand the
broader economic potential associated with DR activities. While these studies
estimate different levels of peak reductions in different European countries thanks to
DR, a recent study by UCTE, the European association of Transmission System
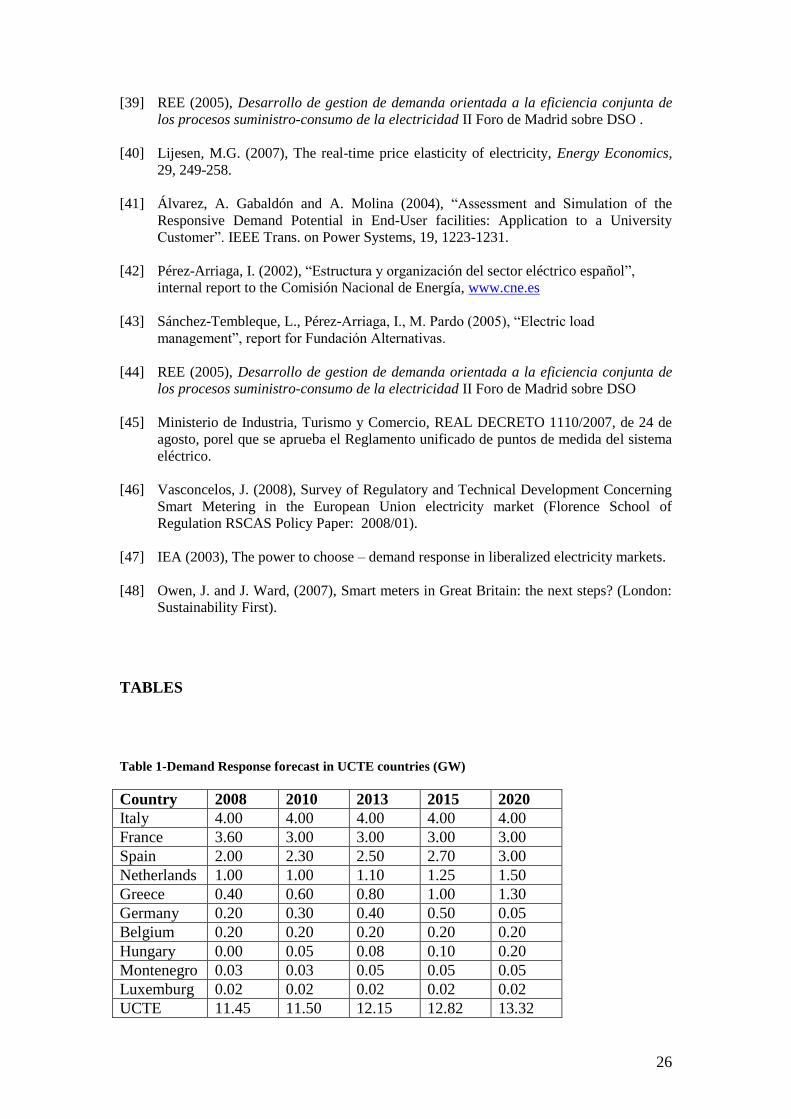
Operators (TSOs) provides forecasts for DR in European countries [22]. The UCTE
study defines the level of DR in European countries in 2008 at on average 2.9% of
peak load. Table 1 shows that DR is foreseen to grow in most UCTE countries with
the only exceptions of Germany and Hungary. These projections for the future are not
likely to revolutionise the 2008 baseline.
8
Table 1-Demand Response forecast in UCTE countries (GW)
Studies on the economic and technical potential of DR vary significantly in methods,
sample sizes and results. However, at least four significant observations can be
derived from this brief review. First, the total amount of DR, as analysed in system
adequacy studies, is rather low and flat in recent years. Second, in continental Europe,
load management forecasts increased during recent years. Third, studies confirm that
most existing DR initiatives consist of interruptible programmes. Fourth, a significant
number of European countries do not even consider DR in system and network
planning.
3.3 EU policies on DR
Although the EU does not envisage any harmonised DR policy, there are two EU
directives which address DR issues.
The Energy Services Directive requires Member States to develop plans for achieving
targets for saving energy from end users but the wording of the Directive is being left
broad, such that it can encompass DR options and technologies as well as demand
saving measures: “In defining energy efficiency improvement measures, account
should be taken of efficiency gains obtained through the widespread use of cost-
effective technological innovations” [15]. Ultimately, this Directive does not require
DR programmes. While Member States could interpret DR programmes, such as
time-of-use tariffs, as a contribution to meeting the requirements of the Directive, the
main focus of the directive is on energy efficiency.
Another Directive, on Energy End-Use Efficiency and Energy Services suggests that
Member States should promote “the adoption of real-time demand management
technologies such as advanced metering systems” [16]. This Directive is intended to
provide incentives for investment in transmission and distribution networks while the
European market gradually opens up to competition. In order to address the risk of
interruptions caused by increases both in power demand and strains on the network,
the Directive proposed four main requirements: (i) Member States should have a
clearly defined policy to ensure a good equilibrium between power supply and
9
demand; (ii) Member States should define and meet standards concerning the security
of transmission and distribution networks (with financial penalties being foreseen in
case of failure to comply with the targets); (iii) TSOs should submit regular
investment plans for cross-border interconnectors to their national regulators; and (iv)
national regulators should submit a summary of these investment plans to the
European Commission for consultation with the European Regulators Group on
Electricity and Gas.
A recent Communication from the European Commission recognises the importance
of DR, although still with a primary focus on efficiency: “Member States can
encourage energy savings in all sectors by raising awareness of the need of taking
action and the practical possibilities available. The Directive1 requires Member
States to ensure that information on energy efficiency mechanisms and financial legal
frameworks is transparent and widely disseminated to relevant market actors. They
should ensure that information on best energy savings practices is widely available.
Such information coupled with clear price signals, tariffs encouraging energy
efficiency and better feed-back on annual consumption, through improved billing and
smart meters, should put end-users in a position to take better-informed decisions on
their energy use and on taking up efficiency incentives” [17].
Clearly EU energy policies are more focused on energy efficiency and DSM issues,
rather than DR. One reason stems from the historical driving forces for EU energy
and environment policy action. Energy efficiency and renewables programmes were
developed historically and pursued vigorously since the oil shocks of the 1970s and
1980s. They have been actively pursued in recent years as part of climate change
actions within the EU. Interest in DR has grown only more recently for the reasons
discussed earlier. One further explanation for why the EU is not really getting
involved in DR policies is that it does not have an adequate system in place to monitor
the market. In Europe the thinking seems to prevail that DR is a market instrument
that might be (and indeed has proved to be in certain sectors) effective in reducing the
costs of load peaks for the system, but yet is not seen as a key solution for addressing
the environmental objectives and climate change targets agreed across Member
States. However, there is growing recognition that DR may be an effective facilitator
10
of deeper penetration of renewable generation, and thus with an integral part to play
in climate action [18].
4 DEMAND RESPONSE EXPERIENCES IN EUROPEAN COUNTRIES
The market designs and policies in place in several European countries have not
promoted innovations or opportunities for DR in electricity markets. Some of the DR
programmes in place in EU Member States have thus far focused on large industrial
users - as will be demonstrated for Spain and Italy - and represent poor substitutes for
the benefits possible from a more comprehensive approach to DR, inclusive of
informed shedding operated by commercial and household consumers. This section is
arranged in two parts. The first part consists of a brief overview of the range of DR
programmes in place in various European countries. The second part examines in
depth the programmes, technical and economic studies and policies of three countries:
UK, Italy and Spain.
4.1 DR programmes in European countries: an overview
Over the past 20 years, European utilities have used various forms of load shedding
mechanisms with large industrial customers to reduce demand during peak periods.
These programmes are typically not based on accurate price signals that serve as the
basis for dynamic pricing options. They are less costly to adopt and are based on
discrete timing and pricing of interruption. For example, in Sweden a temporary law
for peak power reserves was in place between 2003 and 2008. It was based on studies
on DR which showed that most Swedish industries would be able to face reductions
between 30 minutes and 3 hours per day. The law was established by the Swedish
Government in order to secure enough reserve -and peaking- capacity [19]. Auctions
were arranged for reserve capacity up to 2000MW. After the temporary law period,
an evaluation was carried out on how the market participants used their intervals to
pave the way for a market-based solution.
Similarly to what occurred in Sweden, in Finland Interruptible Programmes have been
used as disturbance reserve for several years. Companies have yearly contracts with
the national electricity transmission grid operator (Fingrid). In 2005, total DR
11
potential in Finnish large-scale industry was estimated at about 1280 MW, which
represents 9% of the Finnish power demand peak [20]. In 2008 the Finnish main
electricity utility invested in an Advance Metering Reading system to automatically
read, control and manage all 60,000 of its customer metering points.
In the Netherlands the Ministry of Economic Affairs has estimated the potential for
Load Management directly related to market prices with a capacity of about 1000-
1500 MW. This figure is supposed to increase gradually over the period until 2020
and is based on the bid system for reserve and regulation power of the Dutch TSO
[21].
These are examples of long standing arrangements to employ the largest and most
energy intensive industrial customers in DR. Recent developments have re-shaped DR
in various countries, with increasing focus on programmes requiring deliberate and
informed demand decisions by commercial and residential customers.
A typical example of a programme making use of different prices according to the
weather is Electricité de France’s Tempo tariff [22]. Around 350,000 residential
customers and more than 100,000 small business customers use the Tempo tariff.
Days are distinguished according to price using a colour system, together with an
indication of whether the hour is currently one of eight off-peak hours or not.
Customers can adjust their consumption either manually or by selecting a programme
for automatic connection and disconnection of separate water and space-heating
circuits. It has been estimated that for the average 1 kW French house, the Tempo
tariff brought about a reduction in consumption of 15% on “white” days and 45% on
“red” days [23]. This means that customers have saved 10% on average on their
electricity bill. In addition, RTE estimates that the effect of Direct Load Management
might save about 35 TWh per year by 2020.
A Danish study estimated the benefits that DR contracts could bring about to
residential users. Some 260 MW would be saved on a typical winter day, equivalent
to 6% of the Danish peak load (6,400 MW) if 50% of the 125,000 households with
electric heating in Denmark were to accept DR contracts. The pilot study was carried
out on 25 houses and showed that it is possible to obtain DR impacts of up to 5 kW
12
per household [24]. Following this case study, the Danish TSO supported a research
project concerning frequency-controlled equipment in households and businesses. The
main electricity company (NESA) has started installing 110,000 metering system
annually to serve all 550,000 customers within 5 to 6 years.
In Norway specific programmes have been undertaken with the objectives of
postponing expansion of grid capacity: 10% reduction in peak demand in the Oslo
area; increasing knowledge of customer behaviour; and developing a motivation
model for DSM. Pilot studies show that thanks to this DR programme the peak load
for commercial end-users was reduced by 4.5 MW and the energy saving was around
15%.
4.2 United Kingdom (UK)
4.2.1 DR programmes in the UK
Levels of consumption and liberalisation of the energy markets are vital elements for
understanding the state of DR in the UK. Household energy consumption in the UK
increased by 19% between 1990 and 2000 and energy use by appliances went up 9%.
Since 1990 the number of households increased by 10%; population increased by 4%;
and disposable income increased by 30% [25]. In 2002 the energy regulator, Ofgem,
decided to remove price control as these were believed to be harming the competitive
market [26].
Specific DR programmes have been in place for some years. In the industrial and
large commercial sectors, energy intensive users are able to agree Time of Use and/or
interruptible contracts with suppliers. Similarly, the System Operator can contract
such large users directly as part of their network balancing activities. At the other end
of the scale, it is estimated that about 4.5 million UK customer make use of multi-rate
energy tariffs. This involves programmes providing customers with the option to
obtain discounted electricity rates at night. “Economy 7” is one example of these
Time of Use programmes: typically from 01:00 to 08:00 in the morning cheaper
tariffs are applied so that customers using electrically charged thermal storage heaters
can meet their space heating needs from off-peak electricity. In order to participate in
these programmes, customers need two-register meters, which most of the time
consist of radio and tele-switched meters installed by their distribution network
13
operator or supplier. Such electrical storage heating was particularly successful in the
UK as a complement to the nuclear power programme from the 1960’s. The
requirement for nuclear generators to operate continuously caused the then state-
owned system operator to incentivise load shifting to provide a higher and stable night
time baseload, and since liberalization in the 1990s has contributed to low baseload
and off peak prices. Some of the UK’s large electricity suppliers have recently re-
started advertising such tariff arrangements, seeking new residential customers,
perhaps in preparation for anticipated expansion of intermittent renewables and new
investment in nuclear power.
4.2.2 Estimating DR potential in the UK
In the UK, more than in most other European countries, the diffusion of DR
technologies is noticeable thanks to the range of devices on the market. Penetration in
the future is likely to be high with various forms of smart meters, “dumb” meters with
smart boxes, and clip-on display units.
In order to understand the long term effects on customer response of enhanced
feedback on energy use, in 2007 the British Government initiated the so-called
“Energy Demand Research Project”. More than 10,000 households have taken part in
some form of billing trial. Ofgem coordinates this trial project which is operated by
consortia led by four different energy companies: EDF, E.ON, SSE and Scottish
Power [27].
Much of the debate around the economic potential of DR has been focusing on the
actual benefits of DR for consumers. The Department of Business, Enterprise and
Regulatory Reform commissioned a Cost-Benefit Analysis on the economic impacts
of smart meters. The study was undertaken by consultants and was concluded at the
end of 2008. At the time of writing of this paper Government is still considering the
results of the consultant’s Cost-Benefit Analysis. In particular, there is disagreement
around the assumed costs of smart meters. Some business corporations have already
commented that the Cost-Benefit Analysis exaggerates the costs of smart meters,
hence ruling out some potentially profitable roll-out options. Consumer benefits and
potential carbon savings from DR assumed in the Cost-Benefit Analysis study are also
sources of controversy. The consultant’s report estimates the cost of roll-out at a total
14
of £14bn against industry projections of £8bn, reflecting a cautious approach to such
economic studies which is required by the UK Treasury.
The study itself compromised five technology specifications (a minimum meter
specification; ‘smart enabled’ meters that substitute old meters; dumb meters
combined with smart boxes; retrofit devices, which are either clamped, fastened or
glued on to meters; and clip-on customer display units) combined with five roll-out
options (giving regional franchisees the responsibility for the roll-out; leaving the roll-
out to the market; leaving the roll-out to the market after eight - market tipping point-
or seven years – fast market tipping point; leaving it to the market with a mandate to
renew and replace installations). Some of the most advanced smart metering options
present irrecoverable Net Present Values. For instance, the Net Present Values
associated with ‘smart enabled’ meters have negative values when combined with the
market roll-out option, estimated at –804 million British Pounds (equivalent to - $ 1.1
billion in 2007 dollar value). The minimum meter specification is also characterised
by negative Net Present Values. When combined with the regional franchise roll-out
option its Net Present Value is estimated at –4497 million British Pounds (equivalent
to - $6.16 billion in 2007 dollar value). Dumb smart meters, on the contrary, present
positive Net Present Values regardless of which roll out options they are combined
with.
One problem with Cost-Benefit Analyses of smart meters is that they fall short of
estimating the potentially wider impacts of innovation [28]. Most Cost-Benefit
Analyses rely upon the evidence provided by pilot roll-out cases showing that - when
fully informed - consumers tend to respond to higher energy prices [29]. However, the
complete long-term economic benefits and societal impacts of new information
systems remain uncharted.
4.2.3 Attempts to foster DR at UK policy level
DR has recently gained significant momentum at policy level. During the Report
Stage of a new legislative package - the Energy Bill - on 29th
October 2008 Lord Hunt
of Kings Heath, said [30]:
15
"I am pleased to announce that the Government has taken the decision to mandate smart meters for all
households. This is a major step forward; no other country in the world has moved to an electricity and
gas smart meter roll-out on this scale. The existing powers in the Energy Bill will enable the
Government to proceed with a domestic roll-out."
Although the roll-out of smart meters is likely to revolutionise DR in the UK, its
policy success is not surprising in a panorama where both the Prime Minister and the
leader of the opposition seek increased consumer participation in both electricity and
gas markets. For instance, in a speech on climate change in November 2007 The
Prime Minister said:
"For every household - over the next decade, there will be the offer of a smart meter that will allow two
way communication between the supplier and customer – giving more accurate bills and making it
easier for people to generate their own energy through microgeneration and sell it onto the grid."
The path which led to current policy thinking has been rather long. Already in a 2007
Energy Policy White Paper the British Government stated that electricity display
monitors should be provided with all new and replacement meters and should be sent
to all customers who requested one. The evidence on which decisions on smart-meter
roll-out and, hence, the future of DR in the UK will be taken is to be based on
historical consumption data to be provided on all domestic customers’ electricity and
gas bills and statements; provision of real-time display devices to particular customer
segments by electricity suppliers; provision of smart meters to all business customers
above a certain usage threshold by electricity and gas suppliers by 2013; and
completion of economic assessment work and consultation to finalise the policy
position in respect of smart metering for small businesses and domestic consumers.
4.3 Italy
When looking at DR in Italy, most of the literature has been devoted to smart
metering. With about 90% of overall meters already installed, Italy is the European
country with the highest penetration of advanced electricity meters. Besides this
particular DR infrastructure, there are other aspects which are worth focusing on. This
section (i) examines some DR programmes in place in Italy; (ii) describes the
16
estimated potential of DR in Italy and (iii) policy-makers’ attempts to foster DR in the
market.
4.3.1 DR programmes in Italy
Interruptible Programmes represent 6.5% of peak power and Load Shedding
Programmes initiate automatic load shedding in emergency situations [31]. With
Interruptible Programmes participants are required to reduce their load to predefined
values. With Load Shedding Programmes utilities have the possibility to remotely
shut down participants’ equipment at short notice. One significant difference between
these two programmes is that for Interruptible Programmes participants who do not
respond can face penalties.
Interruptible Programmes are applied to very large industries only. Until 2007 their
official remuneration was determined by a decision of the energy authority [32].
However, one could infer that these compensations were forms of state subsidies to
sectors facing economic difficulties. For instance, the price of remuneration for 2007
consisted of a fixed lump sum of 150,000 €/MW/year (equivalent to $ 189,247 in
2007 dollar value) for a number of 10 interruptions plus 3,000 €/MW (equivalent to $
3643 in 2007 dollar value) for each additional interruption actually incurred
throughout the year. This price was defined without the analytical support of any
Cost-Benefit Analysis or Impact Assessment. However the price of remuneration is
about three times higher than the yearly benefit for interruptions, even taking into
account a 20% generator capacity margin over peak times to ensure supply security.
Since 2008 the Italian TSO (Terna) selects the resources for interruptions.
Load Shedding Programmes are divided into real time programmes (without notice)
and 15 minute notice programmes. The size ranges from 1200 MW for real time
programmes to 1750 MW for notice programmes. Participants in these programmes
have to install and maintain Load Shedding Peripheral Units and will be compensated
according to a non-market price defined in regulation. The size of curtailable power is
of 10 MW for programmes without notice and 3 MW for programmes with notice.
Italy has also used Time of Use rates for several years. In the past Italy has
experienced significant time variations of cost for electricity supply. Part of the
17
potential associated with shifting loads to hours of low price has been put into action
by many industries to obtain the most convenient hourly profiles. Emergency
situations with little price spikes emerging from the market have been dealt in the past
with regulated measures, e.g. with about 3000 MW of interruptible loads. More
recently, Italy has been moving towards peak/off peak prices to eligible customers as
described in section 4.3.3.
4.3.2 Estimating DR potential in Italy
With 48570 GWh imported in 2007 against 2640 GWh exported in the same year
[33], and with retail prices amongst the highest in the Euro area, in Italy the need for
reducing marginal cost of generation and rendering demand flexible to peak prices is
evident.
At research level, an analytical effort to measure DR potential has been produced by
CESI [34]. They carried out a study based on the Market Potential Calculator
developed by IEA-DSM, taking into account estimates of customer participation in
DR programmes. The technical and economic potential estimates also consider other
countries’ experiences. The CESI study concludes that the Italian DR technical and
economic potential ranges between 1.6% and 4.2% in relation to peak power. This
estimate highlights that there are two classes of consumption that could be subject to
DR plans for reducing demand. On the one side, air conditioners and water heaters for
residential and commercial users could be applied to Direct Load Control actions
associated with critical peak tariffs. On the other side, large industrial customers in
addition to existing Interruptible Services could be associated with critical peak tariffs
and Demand Side Bidding.
An additional potential consists of back-up generators on which to date no official
survey has been carried out. Notwithstanding some (e.g. environmental) constraints,
such generators could be used for a higher number of hours per year than at present,
allowing industrial sites to reduce their intake from the grid at times of higher loads.
For the system, the use of back-up generators would represent a resource
corresponding to a net load reduction.
18
4.3.3 Attempts to foster DR at policy level in Italy
At policy level, the energy regulator (Autorità per l’energia elettrica e il gas) has
recently introduced a new mechanism for calculating the price of energy with the aim
of shifting consumption to periods of lower and cheaper loads [35]. The new pricing
system will apply to all those end-users in possession of electronic meters; this
represents almost 90% of Italian customers and will become the totality in the next
three years. After one year of gradual implementation, the new mechanism will be
fully in place in 2010. There will be two tariffs: a more expensive one from 08:00 in
the morning to 19:00 in the evening Monday to Friday and a cheaper one for any
other time.
4.4 Spain
It has been observed that growth in wind power might be the main driver for DR
programmes in Spain [36]. Whether this is the correct explanation or not, there are
two wide categories of DR programmes in place in Spain: system-led and price-led
programmes.
4.4.1 DR programmes in Spain
System-led programmes are shifting from classical to market-grounded programmes.
For instance, Direct Load Control has been in place for about 20 years and is about to
give way to ancillary services. Since 1988 a number of large industrial consumers
(about 200 industries with a demand over 5 MW) have been able to choose special
tariffs voluntarily. The Spanish TSO, Red Eléctrica de España, can request these
industries to limit the demand during periods of time varying from 45 minutes to 12
hours, upon the condition that the TSO informs industrial consumers in advance. The
yearly maximum number of hours and requests of demand reductions by the TSO is
defined in advance for each end-user. Each year industrial consumers receive a
discount both in fixed and variable charges according to number of requests to reduce
their demand.
Red Eléctrica de España is supposed to use these Direct Load Control mechanisms
when there are physical imbalances between supply and demand. The Industry
19
Ministry must explain and justify the reasons for demand reductions every time these
are requested to end-users. The European Transmission System Operator (ETSO) reports
that the yearly number of days when the Spanish TSO has requested demand
reductions has been varying between 0 to 4 days [37]. Exceptionally, in 2001 demand
reductions were requested during 10 days. The ad hoc tariffs for large industrial
consumers will soon cease to exist. Red Eléctrica de España is discussing with the
industry how to use these resources within a wider market for ancillary service
provision [38] in which market participants will be able to bid on load curtailment in
the spot market as operating reserve. This means that if their bids are accepted,
participants are paid the spot market energy price whenever load curtailment is
required [39]. Since 2002 an Interruption Flexible Management Programme has been
developed by Red Eléctrica de España, which manages most of the transmission
network in Spain. It estimates total interruption capacity of the system at around
2600MW. The instant interruption capacity is considered greater than 1000MW.
Price-led programmes have been in place for some time, with time-of-use tariffs
providing economic signals for demand response [40]. With the aim of dissuading
industrial customers from using electricity during peak hours, hence increasing the
demand and energy cost components of their electricity bills, the TSO has the right to
determine the hours of operation for the period corresponding to the most expensive
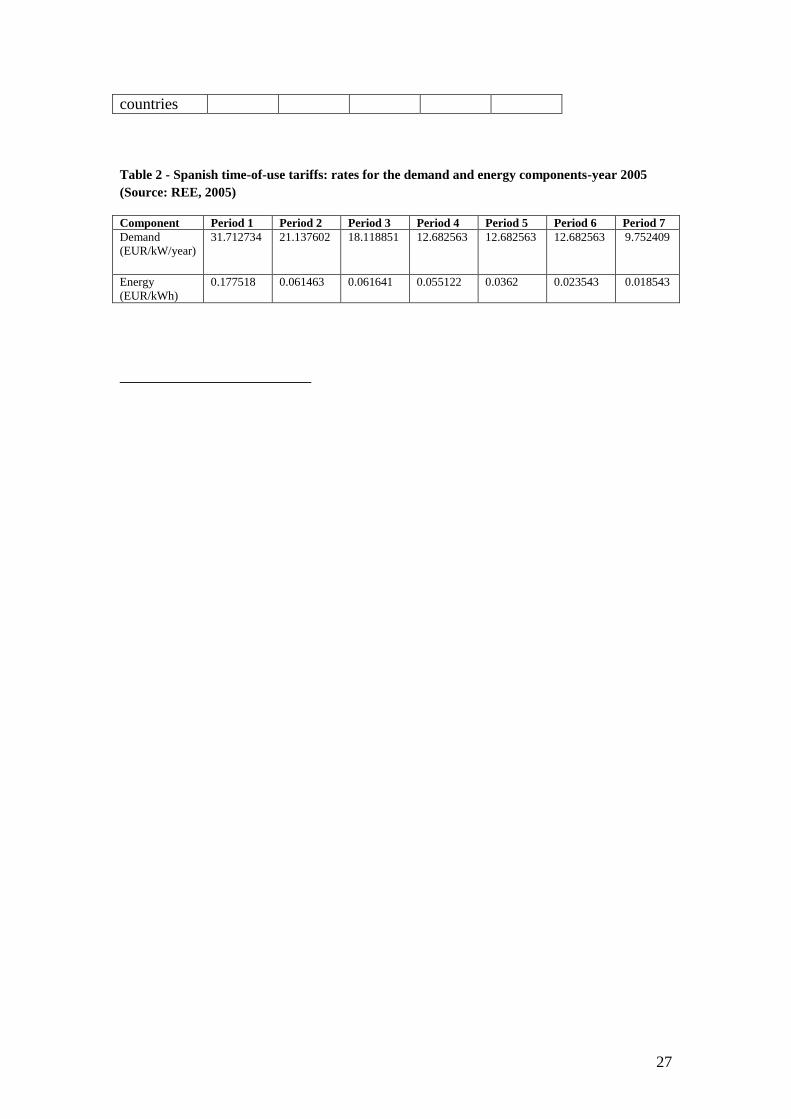
period of the year. The time-of-use rates are based on dividing the 8760 hours in a
year into seven time-of-use periods. For each period, there is a contracted demand
level and a different rate for each of the demand and energy components of the tariff.
Every year the TSO reviews rates for each time-of-use period. Table 2 shows the time
of use rates applied in 2005.
Table 2- Spanish time-of-use tariffs: rates for the demand and energy components-year 2005 [41]
Interestingly, a study which was commissioned on the basis of a Spanish Royal
Decree (2392/2004) and looking at 87 large customers making use of time-of-use
tariffs in 1994, revealed that for industrial customers reducing production to make
savings on their electricity bill was ultimately not profitable. Financial losses through
reduced production were considered to be greater than the decrease in their electricity
20
bills during peak time (Period 1 in Table 3). Also, it should be highlighted that the
choice of time-of-use tariffs is in practice limited to those consumers who decide to
move away from the incumbent utility. This is often an economically unfavourable
decision in Spain as there are times when the regulated supply tariff is lower than the
market price.
4.4.2 Estimating DR potential in Spain
Perhaps one of the biggest projects carried out in Spain to create the basis for DR
initiatives is called INDEL. It was initiated in 1988 with Government funding with the
overall aim of expanding the knowledge on the behaviour of the demand side. As one
of its main outputs, the INDEL project estimated the system demand at any hour by
consumption of 8 large segments of consumers representing 51% of maximum
demanded electricity [42]. As part of spin-off projects it has become possible to
identify some of the salient features of the Spanish demand, notably that it has
relatively high peaks but also considerable variability in consumer behaviour. As a
result, considerable risks have been identified for implementation of DR programmes
in Spain. These include (i) high degree of variability of consumers’ response; (ii) high
dispersion of consumers’ response in the grid; and (iii) difficulties in guaranteeing
permanence with reduction offers in the medium and long term [43].
Attempts to overcome these risks have been based on a number of DR studies,
programmes and technologies. For instance, a recent study carried out by the Instituto
de Ingenieria Energética has tried to develop methodologies to determine the potential
of demand management for large consumers of electricity [44]. The study is based on
a survey of large industrial consumers, i.e. car industries, fish farms, airports and train
builders. One of the main findings was that the weight of manageable power in
relation to the contracted power is frequently high (22% for car industries, 96% for
fish farms and airports and 81% for train builders). Consequently, load forecasts have
been developed on the bases of medium and long term projections of economic
growth rate, population growth and the impact of energy efficiency policies and Load
Management, in order to predict reductions of peak load growth and changes in the
load duration curve.
21
DR technologies in Spain involve consumer management tools to organise and store
information about Spanish interruptible tariff consumers. These comprise (i) planning
and valuation applications which allow tracking of the evolution of consumers for the
last ten years; (ii) consumer directory, negotiation and planning tools for monitoring
and analysing consumers using static data (e.g. contract type, supply type) and
dynamic data (e.g. consumption and load profiles); and (iii) prototypes for assisting
the interruption system operation, in the form of forecast models of consumer
response during the operation period.
4.4.3 Attempts to foster DR at policy level in Spain
In 2007 the Spanish Government established a rollout timetable that foresees the
replacement of old meters with electronic smart meters with remote metering
capabilities by 2018 [45].
5 CONCLUSIONS
Besides the engagement of major energy users in system balancing, the presence of
DR in European electricity markets has been traditionally low. It has been observed
that customers lack means and a limited number of incentives are in place to respond
to changes in prices [46]. A few factors undermine effective DR in Europe: the lack of
real-time price information reaching consumers; regulated retail prices in some
countries; out-dated metering technologies; system operators focused on supply side
resources; and an approach traditionally averse to DR [47]. However, things seem to
be rapidly evolving especially under the European Commission’s objectives of
strengthening energy efficiency, mitigating green house gas emissions and promoting
renewable sources of energy. Current developments within Europe point to a wide
rollout of smart metering technology, which ideally will create the platform for an
informed consumer capable of responding to prompts from the supply side. Although
DR in Europe has not realised its full potential yet, prospects for the future are
brighter.
The paper has considered programmes already in place in some Member States of the
European Union. Currently, DR programmes focus mainly on industry, as most
European utilities include Direct Load Control programmes as part of their DSM
22
strategies, with fixed compensations attributed to small numbers of large industrial
end-users. Interruptible Programmes for large industries are very frequent, although
the mechanisms for compensating industries vary significantly. The extent to which
such system-led programmes can be labelled as authentic DR initiatives is debatable.
In the future however, large numbers of end-users, including commercial customers
and households could be involved in DR programmes with compensations consisting
of prices and deliberate shifts in electricity demand in correspondence with peak
loads.
From the review of some of the studies exploring the economic and technological
potential of demand side response it is clear that the potential of DR in Europe varies
from country to country. The estimated penetration level of DR technologies; the
amount of industrial manageable power; the household load curves all differ
substantially across Europe. The commonalities highlighted by research studies regard
(i) the low level of DR in European countries in recent years; (ii) the increase in load
management forecasts (at least in continental Europe); (iii) the prevalence of
interruptible programmes; and (iv) the absence of DR in system and network
planning.
Until a couple of years ago, DR initiatives were largely neglected at policy level.
There are at least five reasons why it took time for DR to make an impact among
policy-makers. Firstly, while it is clear what DR initiatives – e.g. time of use tariffs -
can achieve in terms of demand shifting from peak periods, limited knowledge has
been developed about its overall energy saving capacities. Secondly, the cost
estimates for DR technologies and infrastructure have decreased in recent years, but
remain significantly high: some European countries hesitated to invest because they
were expecting increases in volumes and reduced marginal costs. Thirdly, DR does
not represent a panacea solution for all energy-related problems, including climate
change and security of supply: EU policy-makers are still searching for the right mix
of solutions that will facilitate reaching their ambitious environmental goals. Fourthly,
to date there has not been a strong policy push for DR because the focus has been on
liberalising markets. Finally, some of the most recent EU policy proposals seem to
indicate that there might be a policy change if DR demonstrates its full potential,
highlighting that uncertainty about DR performance and prospects has held back more
23
aggressive policy, and underlining the significance of current demonstration
programmes.
A clear indication of a change in gear for policy support of DR is represented at
national level by smart meters and at the EU level by the attempt to ensure
equilibrium between power supply and demand through encouraging Member States
to provide information on energy efficiency mechanisms as well as price signals,
feed-back on annual consumption and better billing. The recent and ongoing roll-out
of smart meters in several European countries means that soon there will be the
technological sine qua non conditions for DR. Some 12 EU Member States are
currently either implementing or discussing policy plans for smart meter roll-out.
Much of the discussion in these countries has moved from whether investments
should be made to how investments should occur [48].
ACKNOWLEDGMENTS
The research leading to this paper was conducted as part of both the EPSRC/E.On
supported Transitions project and the EPSRC supported Supergen FlexNet project.
REFERENCES
[1] Leach M, Bilton M, Ramsay C, Devine Wright H, Johnstone C, Kirschen D (2007),
“Demand Side Management” in Delivering a Low Carbon Electricity System:
Technologies, Economics and Policy, Grubb, Jamasb and Pollitt (eds.), Cambridge
University Press.
[2] Faruqui A. and S. George (2005), Quantifying Customer Response to Dynamic Pricing,
Electricity Journal, 18(4), 53-63.
[3] Gallant, R. and R. Koenker (1984), Costs and benefits of peak-load pricing of
electricity: a continuous-time econometric approach, Journal of Econometrics, 26 (1-2),
83-113.
[4] Spees, K. and L. Lave (2007),.Demand Response and Electricity Market Efficiency,
Electricity Journal, vol. 20 (3), 69-85.
[5] Owen, J. and J. Ward, (2007), Smart meters in Great Britain: the next steps?
Sustainability First. Energy Policy, 36 (12), 484-489.
[6] Directive 96/92/EC, 1996, of the European Parliament and of the Council of Dec. 19,
1996, concerning common rules for the internal market in electricity, OFFICIAL J. OF
EUROPEAN UNION, 1997, L27, at 20–29, and Directive 2003/54/EC, 2003, of the
European Parliament and of the Council of June 26, 2003, concerning common rules
24
for the internal market in electricity and repealing Directive 96/92/EC, OFFICIAL J.
OF EUROPEAN UNION, L176, 2004, 37–55.
[7] M.M. Roggenkamp and F. Boisseleau (2005). The Liberalization of the EU Electricity
Market and the Role of Power Exchanges, THE REGULATION OF POWER
EXCHANGES IN EUROPE, Energy & Law series.
[8] European Commission (2007), Explanatory Memorandum – legislative package on the
internal market for electricity and gas, COM (2007).
[9] Torriti, J. (2008), Does the Impact Assessment on the ‘Third Package’ provide the
correct economic forecast for the liberalisation of the EU energy markets? EUI
Working Paper (Florence: European University Institute).
[10] EEA (European Environment Agency), 2006, Energy and environment in the European
Union. Tracking progress towards integration, EEA Report No. 8/2006, Copenhagen.
[11] Enerdata (2008), World Energy Demand in 2007. www.enerdata.fr.
[12] IEA (2008), Energy Policy Reviews: The European Union.
[13] Papagiannins, G. et al (2008), ‘Economic and environmental impacts from the
implementation of an intelligent demand side management system at the European
level’ Energy Policy, 36, 163–180.
[14] Capgemini (2008), Demand Response: a decisive breakthrough for Europe.
[15] Directive concerning measures to safeguard security of electricity supply and
infrastructure investment, OJ L 33 of 4 February 2006.
[16] “Communication on a first assessment of National Energy Efficiency Action Plans”,
COM (2006) 545.
[17] Directive 2006/32/EC on Energy End-Use Efficiency and Energy Services.
[18] UKERC (2006), An Assessment of the Evidence on the costs and impacts of intermittent
generation on the British electricity network, UK Energy Research Centre, London,
http://www.ukerc.ac.uk/Downloads/PDF/06/0604Intermittency/0604IntermittencyRepo
rt.pdf
[19] Turvey, R., (2003), "Ensuring adequate generation capacity," Utilities Policy, Elsevier,
11 (2), 95-102.
[20] VTT (2006), Demand response activities in Finland, DR Workshop Copenhagen, 13
November 2006.
[21] Siderius, P.J.S., E. Leussink, P. Nonhebel (2004), Scan vraagrespons kleinverbruikers
elektriciteit, (Utrecht: SenterNovem).
[22] Vasconcelos, J. (2008), Survey of Regulatory and Technical Development Concerning
Smart Metering in the European Union electricity market (Florence School of
Regulation RSCAS Policy Paper: 2008/01).
25
[23] Vasconcelos, J. (2008), Survey of Regulatory and Technical Development Concerning
Smart Metering in the European Union electricity market (Florence School of
Regulation RSCAS Policy Paper: 2008/01).
[24] Anderssen et al (2006), Analyses of Demand Response in Denmark, Risø, RAM-løse
edb, (Copenhagen: Ea Energy Analyses).
[25] DTI (2002), The Energy Review: a Performance and Innovation Unit Report (London:
Department of Trade and Industry).
[26] Ofgem (2003) “Vigorous Competition for domestic customers, but Ofgem remains
vigilant”, Press Release, 16 June 2003.
[27] Ofgem (2008), Energy Demand Research Project - Review of Progress.
[28] Brophy, A., Tooraj J. and M. Pollitt (2009), Smart Metering and Electricity Demand:
Technology, Economics and International Experience, EPRG Working Paper
EPRG0903 (Cambridge: Working Paper in Economics).
[29] Imperial College (2008), Response to Ofgem’s consultation on Domestic Metering
Innovation
http://www.ofgem.gov.uk/MARKETS/RETMKTS/METRNG/SMART/Documents1/1
3357-Imperial_Centre_response.pdf.
[30] Energy Retail Association (2008), Report Stage of the Energy Bill by Lord Hunt of
Kings Heath, Press Release http://www.energy-
retail.org.uk/media/press/2008/ERASmartMetermandateOct08.html
[31] Grattieri, W. (2006) Demand Side Management priorities in Italy Proceedings of Load
Management & Demand Response Programmes 2006 London, 2nd & 3rd February
2006.
[32] Decision n. 289/06: “Disposizioni per l'approvvigionamento e la remunerazione delle
risorse in grado di garantire l'interrompibilità istantanea o con preavviso dei prelievi di
energia elettrica a decorrere dall'1 gennaio 2007”
http://www.autorita.energia.it/docs/06/289-06.htm.
[33] Energy Information Administration (2007), International Energy Annual.
[34] CESI (2005), Metodi e strumenti per la modulazione della domanda Rapporto
A5021621.
[35] Decision ARG/elt 56/08: “Disposizioni in materia di applicazione delle condizioni
economiche del servizio di maggior tutela (corrispettivi PED), di obblighi di
registrazione e di messa a disposizione dei dati di prelievo e conseguente adeguamento
di TIV e TILP”.
[36] Capgemini (2008), Demand Response: a decisive breakthrough for Europe.
[37] European Transmission System Operator (2007), Demand Response as a resource for
the adequacy and operational reliability of the power systems Explanatory Note.
[38] REE (2005), Desarrollo de gestion de demanda orientada a la eficiencia conjunta de los
procesos suministro-consumo de la electricidad II Foro de Madrid sobre DSO.
26
[39] REE (2005), Desarrollo de gestion de demanda orientada a la eficiencia conjunta de
los procesos suministro-consumo de la electricidad II Foro de Madrid sobre DSO .
[40] Lijesen, M.G. (2007), The real-time price elasticity of electricity, Energy Economics,
29, 249-258.
[41] Álvarez, A. Gabaldón and A. Molina (2004), “Assessment and Simulation of the
Responsive Demand Potential in End-User facilities: Application to a University
Customer”. IEEE Trans. on Power Systems, 19, 1223-1231.
[42] Pérez-Arriaga, I. (2002), “Estructura y organización del sector eléctrico español”,
internal report to the Comisión Nacional de Energía, www.cne.es
[43] Sánchez-Tembleque, L., Pérez-Arriaga, I., M. Pardo (2005), “Electric load
management”, report for Fundación Alternativas.
[44] REE (2005), Desarrollo de gestion de demanda orientada a la eficiencia conjunta de
los procesos suministro-consumo de la electricidad II Foro de Madrid sobre DSO
[45] Ministerio de Industria, Turismo y Comercio, REAL DECRETO 1110/2007, de 24 de
agosto, porel que se aprueba el Reglamento unificado de puntos de medida del sistema
eléctrico.
[46] Vasconcelos, J. (2008), Survey of Regulatory and Technical Development Concerning
Smart Metering in the European Union electricity market (Florence School of
Regulation RSCAS Policy Paper: 2008/01).
[47] IEA (2003), The power to choose – demand response in liberalized electricity markets.
[48] Owen, J. and J. Ward, (2007), Smart meters in Great Britain: the next steps? (London:
Sustainability First).
TABLES
Table 1-Demand Response forecast in UCTE countries (GW)
Country 2008 2010 2013 2015 2020
Italy 4.00 4.00 4.00 4.00 4.00
France 3.60 3.00 3.00 3.00 3.00
Spain 2.00 2.30 2.50 2.70 3.00
Netherlands 1.00 1.00 1.10 1.25 1.50
Greece 0.40 0.60 0.80 1.00 1.30
Germany 0.20 0.30 0.40 0.50 0.05
Belgium 0.20 0.20 0.20 0.20 0.20
Hungary 0.00 0.05 0.08 0.10 0.20
Montenegro 0.03 0.03 0.05 0.05 0.05
Luxemburg 0.02 0.02 0.02 0.02 0.02
UCTE 11.45 11.50 12.15 12.82 13.32
27
countries
Table 2 - Spanish time-of-use tariffs: rates for the demand and energy components-year 2005
(Source: REE, 2005)
Component Period 1 Period 2 Period 3 Period 4 Period 5 Period 6 Period 7
Demand
(EUR/kW/year)
31.712734 21.137602 18.118851 12.682563 12.682563 12.682563 9.752409
Energy
(EUR/kWh)
0.177518 0.061463 0.061641 0.055122 0.0362 0.023543 0.018543