Embed Size (px)
Citation preview

Supply Chain Videocast
End-to-End Optimization Uncovers True Drivers of Inventory
Quantify Inventory Opportunities for Better Results + PepsiCo Case Study
Broadcast Made Possible by:
End-to-End Optimization Uncovers True Drivers of Inventory
Dr. David Simchi-Levi
30 April 2013
Today’s Topics
Introduction to OPS Rules Management Consultants
Inventory Concepts and Optimization
PWF Supply Chain
End-to-End Model of PWF Supply Chain
Model Validation
Drivers of PWF Inventory
The Opportunity
Key Takeaways
4
© OPS Rules Partners, LLC 2013
© OPS Rules Partners, LLC 2013
4 Things to Know About OPS Rules
Ops Rules is a specialized consulting firm that:
Focuses on operations strategies that transform complex Supply Chains for competitive advantage and significant performance gains of 20-30%
Brings fresh Intellectual Property to clients based on the work of world-renowned Supply Chain thought leader Professor David Simchi-Levi from MIT
Applies cutting edge analytics to achieve a quantum leap in operational and business performance
Implements a three step methodology, analyze.innovate.transform, to ensure sustainable business outcomes
5

© OPS Rules Partners, LLC 2013
OPS Rules Connects the Customer Value Proposition to the Operations and Supply Chain
Strategy
6
Customer Value Proposition
Operations and Supply Chain Strategy
© OPS Rules Partners, LLC 2013
Sell Distribute Supply
Plan/ Design
Development Supply Chain
Fulfillment Supply Chain
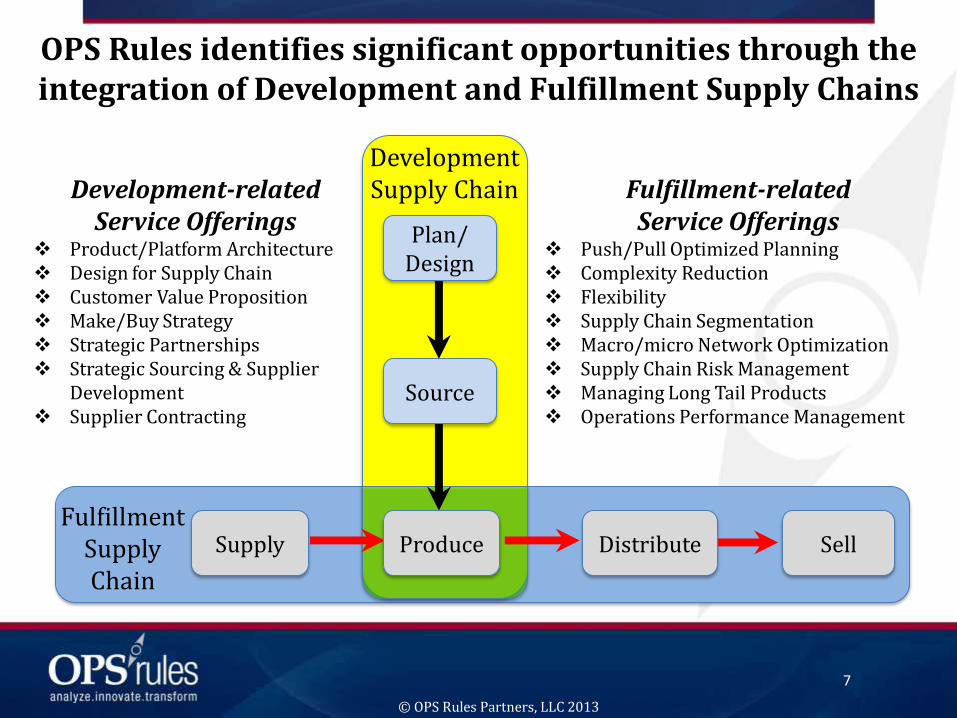
OPS Rules identifies significant opportunities through the integration of Development and Fulfillment Supply Chains
Produce
Development-related Service Offerings
Product/Platform Architecture Design for Supply Chain Customer Value Proposition Make/Buy Strategy Strategic Partnerships Strategic Sourcing & Supplier
Development Supplier Contracting
Fulfillment-related Service Offerings
Push/Pull Optimized Planning Complexity Reduction Flexibility Supply Chain Segmentation Macro/micro Network Optimization Supply Chain Risk Management Managing Long Tail Products Operations Performance Management
7
Source

© OPS Rules Partners, LLC 2013
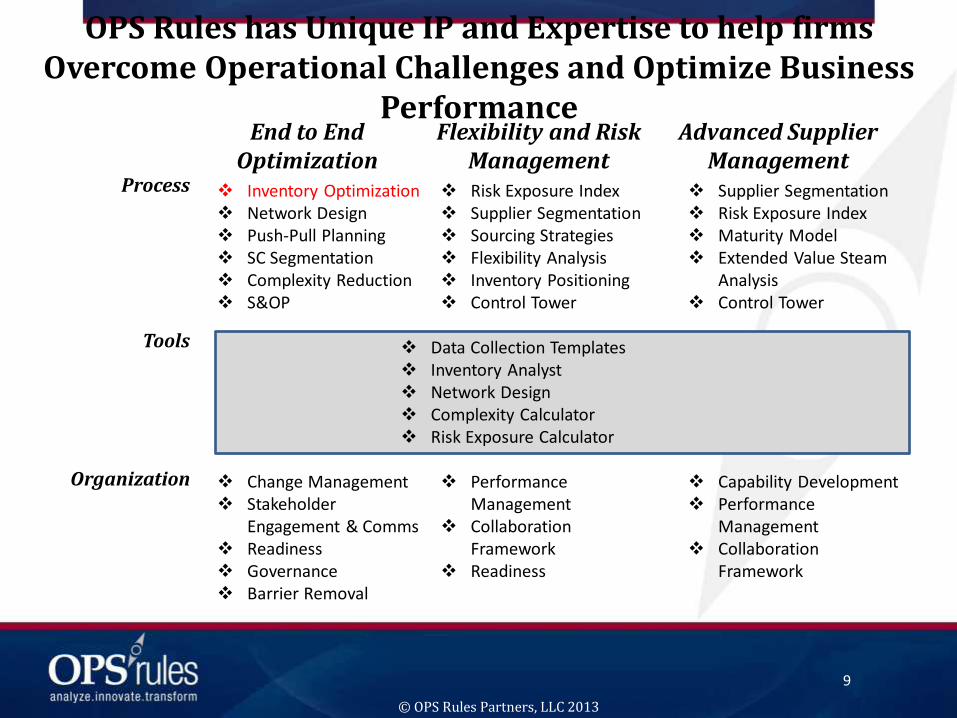
OPS Rules has Unique IP and Expertise to help firms Overcome Operational Challenges and Optimize Business
Performance End to End
Optimization Flexibility and Risk
Management Advanced Supplier
Management Process
Tools
Organization
Inventory Optimization Network Design Push-Pull Planning SC Segmentation Complexity Reduction S&OP
Data Collection Templates Inventory Analyst Network Design Complexity Calculator Risk Exposure Calculator
Risk Exposure Index Supplier Segmentation Sourcing Strategies Flexibility Analysis Inventory Positioning Control Tower
Supplier Segmentation Risk Exposure Index Maturity Model Extended Value Steam
Analysis Control Tower
Change Management Stakeholder
Engagement & Comms Readiness Governance Barrier Removal
Performance Management
Collaboration Framework
Readiness
Capability Development Performance
Management Collaboration
Framework
8
© OPS Rules Partners, LLC 2013
OPS Rules has Unique IP and Expertise to help firms Overcome Operational Challenges and Optimize Business
Performance End to End
Optimization Flexibility and Risk
Management Advanced Supplier
Management Process
Tools
Organization
Inventory Optimization Network Design Push-Pull Planning SC Segmentation Complexity Reduction S&OP
Data Collection Templates Inventory Analyst Network Design Complexity Calculator Risk Exposure Calculator
Risk Exposure Index Supplier Segmentation Sourcing Strategies Flexibility Analysis Inventory Positioning Control Tower
Supplier Segmentation Risk Exposure Index Maturity Model Extended Value Steam
Analysis Control Tower
Change Management Stakeholder
Engagement & Comms Readiness Governance Barrier Removal
Performance Management
Collaboration Framework
Readiness
Capability Development Performance
Management Collaboration
Framework
9
Today’s Topics
Introduction to OPS Rules Management Consultants
Inventory Concepts and Optimization
PWF Supply Chain
End-to-End Model of PWF Supply Chain
Model Validation
Drivers of PWF Inventory
The Opportunity
Key Takeaways
10
© OPS Rules Partners, LLC 2013
11
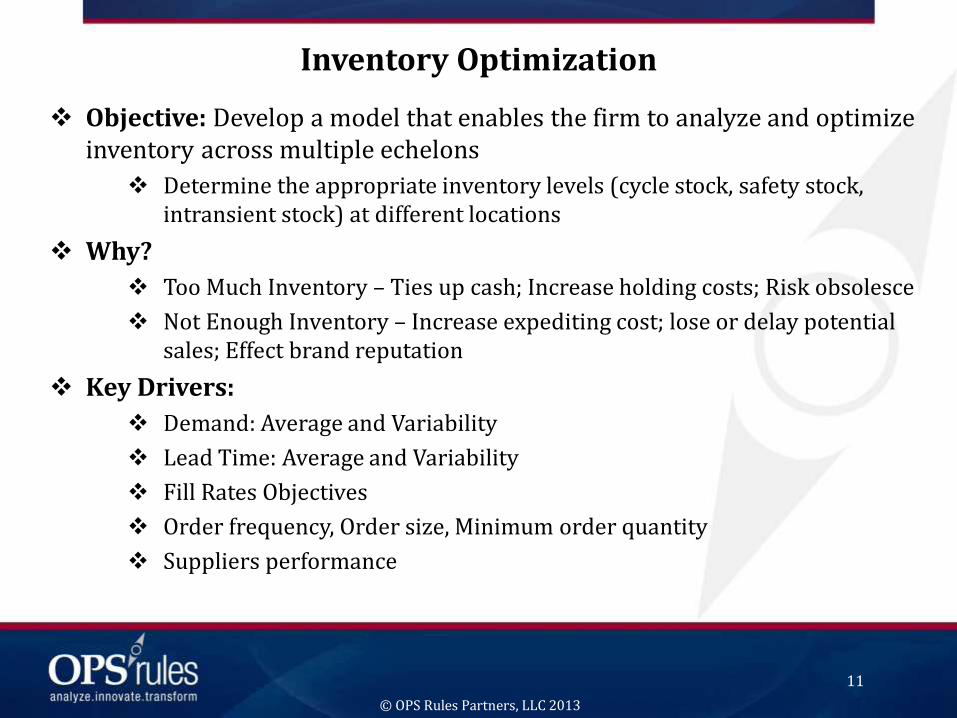
Inventory Optimization
Objective: Develop a model that enables the firm to analyze and optimize inventory across multiple echelons
Determine the appropriate inventory levels (cycle stock, safety stock, intransient stock) at different locations
Why?
Too Much Inventory – Ties up cash; Increase holding costs; Risk obsolesce
Not Enough Inventory – Increase expediting cost; lose or delay potential sales; Effect brand reputation
Key Drivers:
Demand: Average and Variability
Lead Time: Average and Variability
Fill Rates Objectives
Order frequency, Order size, Minimum order quantity
Suppliers performance
© OPS Rules Partners, LLC 2013
©Copyright 2012 D. Simchi-Levi
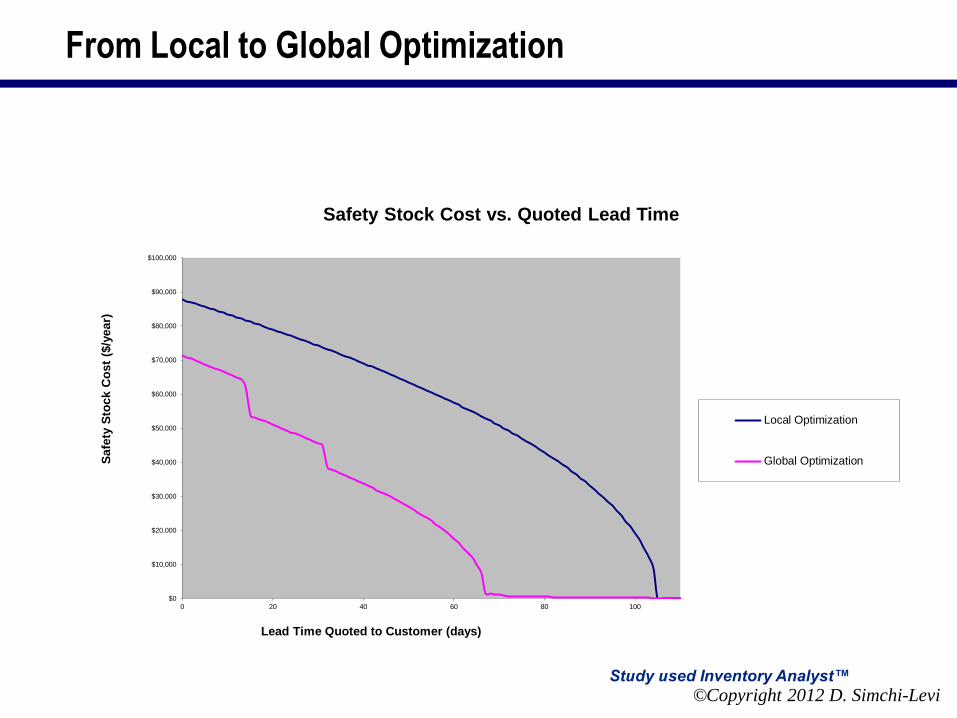
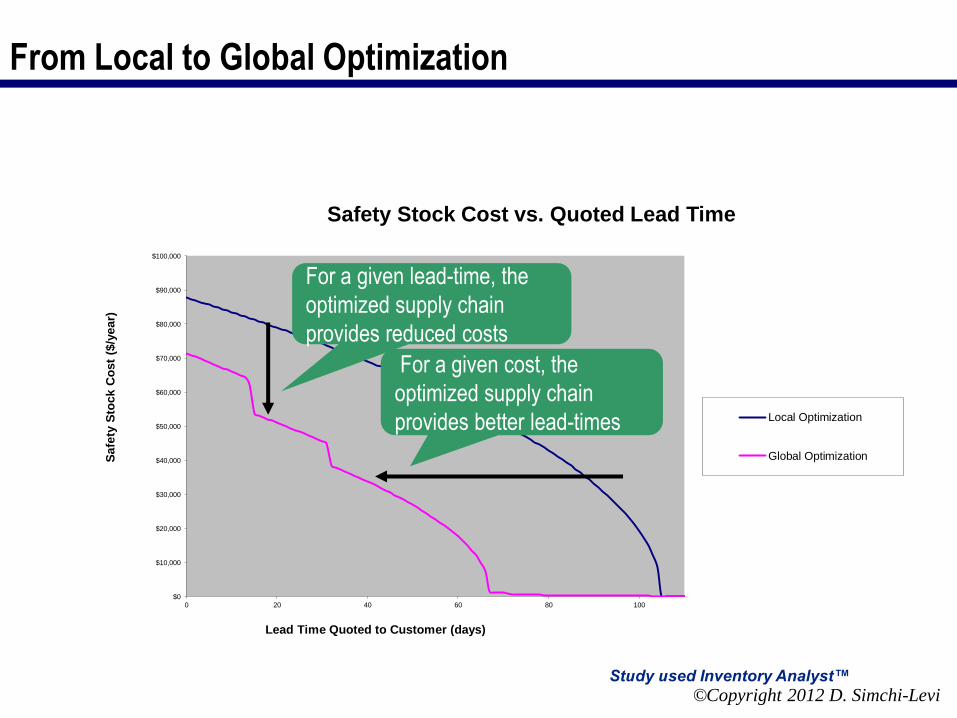
From Local to Global Optimization
Study used Inventory Analyst™
$0
$10,000
$20,000
$30,000
$40,000
$50,000
$60,000
$70,000
$80,000
$90,000
$100,000
0 20 40 60 80 100
Safe
ty S
tock C
ost
($/y
ear)
Lead Time Quoted to Customer (days)
Safety Stock Cost vs. Quoted Lead Time
Local Optimization
Global Optimization
©Copyright 2012 D. Simchi-Levi
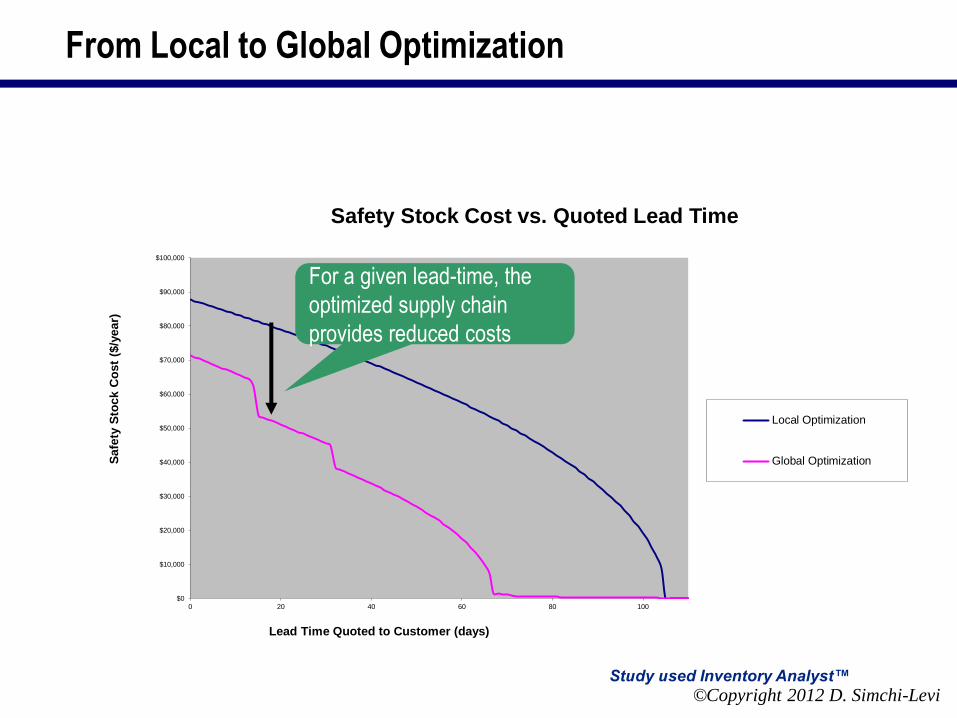
From Local to Global Optimization
Study used Inventory Analyst™
$0
$10,000
$20,000
$30,000
$40,000
$50,000
$60,000
$70,000
$80,000
$90,000
$100,000
0 20 40 60 80 100
Safe
ty S
tock C
ost
($/y
ear)
Lead Time Quoted to Customer (days)
Safety Stock Cost vs. Quoted Lead Time
Local Optimization
Global Optimization
For a given lead-time, the
optimized supply chain
provides reduced costs
©Copyright 2012 D. Simchi-Levi
From Local to Global Optimization
Study used Inventory Analyst™
$0
$10,000
$20,000
$30,000
$40,000
$50,000
$60,000
$70,000
$80,000
$90,000
$100,000
0 20 40 60 80 100
Safe
ty S
tock C
ost
($/y
ear)
Lead Time Quoted to Customer (days)
Safety Stock Cost vs. Quoted Lead Time
Local Optimization
Global Optimization
For a given lead-time, the
optimized supply chain
provides reduced costs
For a given cost, the
optimized supply chain
provides better lead-times

Today’s Topics
Introduction to OPS Rules Management Consultants
Inventory Concepts and Optimization
PWF Supply Chain
End-to-End Model of PWF Supply Chain
Model Validation
Drivers of PWF Inventory
The Opportunity
Key Takeaways
15
© OPS Rules Partners, LLC 2013
16
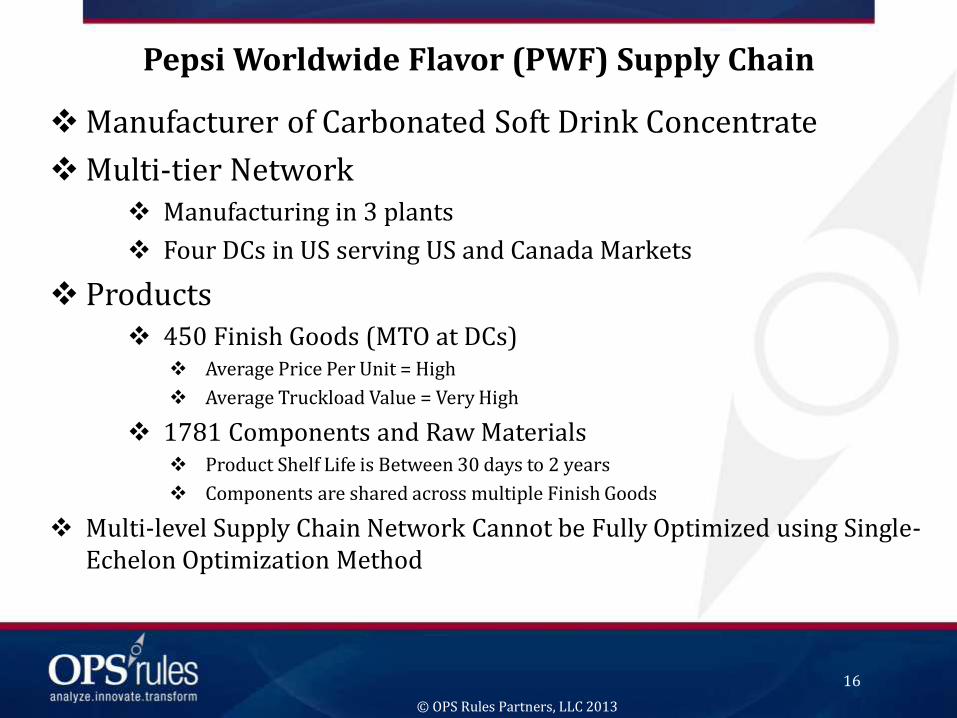
Pepsi Worldwide Flavor (PWF) Supply Chain
Manufacturer of Carbonated Soft Drink Concentrate
Multi-tier Network Manufacturing in 3 plants
Four DCs in US serving US and Canada Markets
Products 450 Finish Goods (MTO at DCs)
Average Price Per Unit = High
Average Truckload Value = Very High
1781 Components and Raw Materials Product Shelf Life is Between 30 days to 2 years
Components are shared across multiple Finish Goods
Multi-level Supply Chain Network Cannot be Fully Optimized using Single-Echelon Optimization Method
© OPS Rules Partners, LLC 2013
17
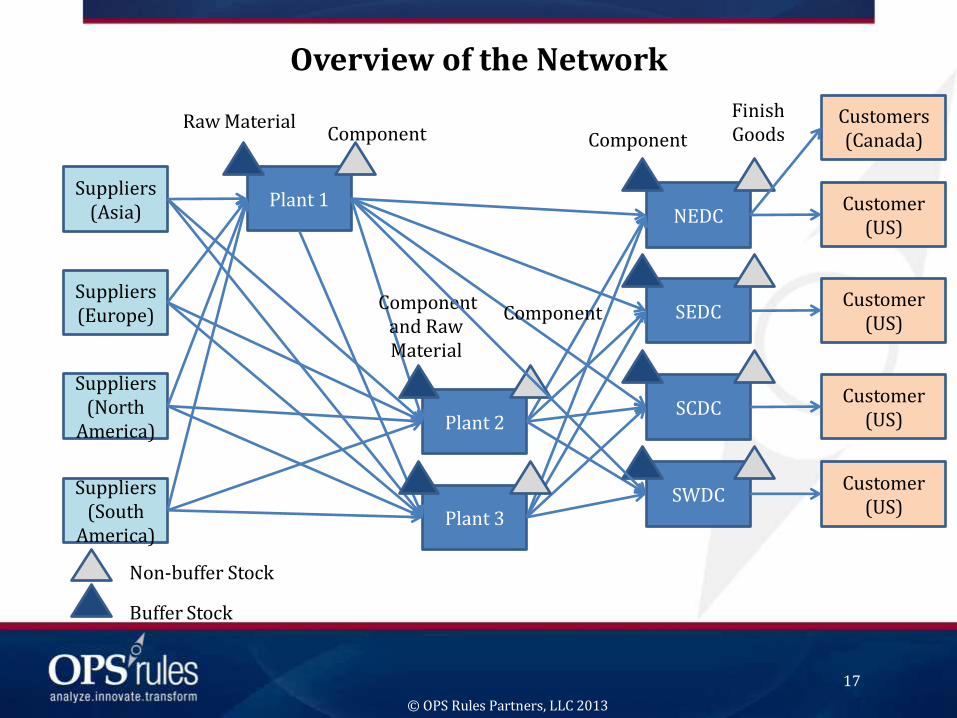
Overview of the Network
Plant 2
Plant 1
Plant 3
NEDC
SEDC
SCDC
SWDC
Suppliers (Asia)
Suppliers (Europe)
Suppliers (North
America)
Suppliers (South
America)
Non-buffer Stock
Buffer Stock
Customers (Canada)
Customer (US)
Customer (US)
Customer (US)
Customer (US)
Raw Material Component
Component and Raw Material
Component
Component
Finish Goods
© OPS Rules Partners, LLC 2013
Today’s Topics
Introduction to OPS Rules Management Consultants
Inventory Concepts and Optimization
PWF Supply Chain
End-to-End Model of PWF Supply Chain
Model Validation
Drivers of PWF Inventory
The Opportunity
Key Takeaways
18
© OPS Rules Partners, LLC 2013

Project Scope
Distribution
Manufacturing
Suppliers
PWF’s Supply Chain is Complex with Inventory at Multiple Locations
Flavors
Commodities
Packaging
Salts
Plant 3
Plant 2
Plant 1
Customers
Bottlers
NEDC
Food Service
SEDC
SCDC
SWDC
PBC Location A
Other Bottler Location A
PBC Location B to Z
Other Bottler Location B to Z
Other Customers
Retail Customer
Inventory is held in several locations in the supply chain, creating opportunities for risk pooling and complexity reduction
Plant Raw
Materials
Components DC Finished
Goods
Bottler
Demand
*Bottler Inventory is not in scope
D
19
© OPS Rules Partners, LLC 2013

PWF Supply Chain Details
Demand
138 Bottlers, 11 in Canada and 127 in US
PWF does not own any inventory at customer site
Number of Finished Products: 450
For each product-location pair, information includes Average Weekly
Demand, and Demand Standard Deviation
20 © OPS Rules Partners, LLC 2013
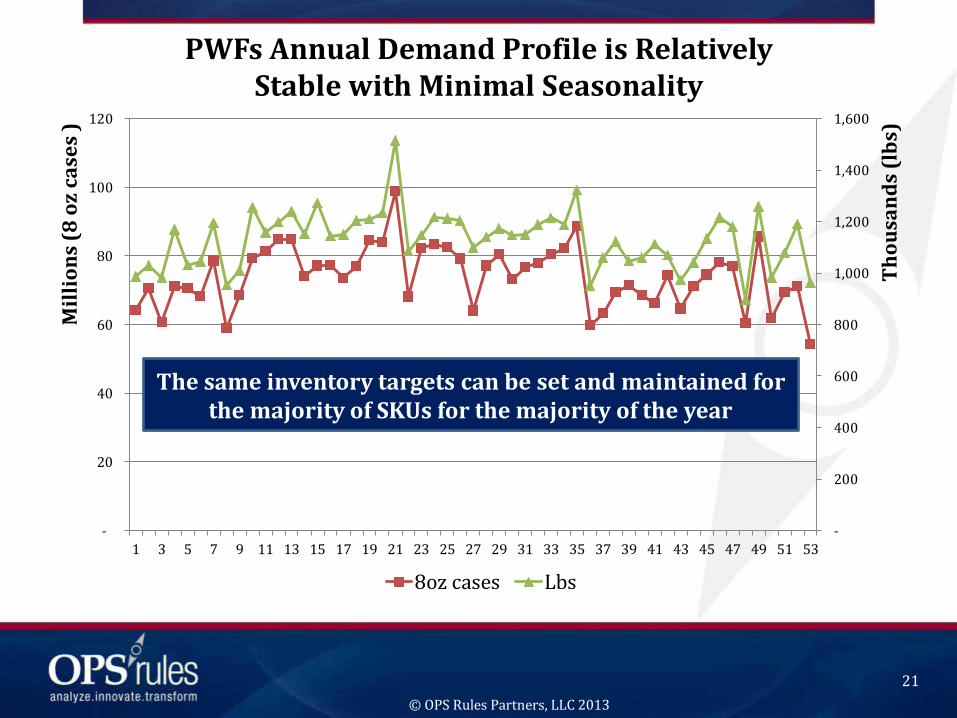
PWFs Annual Demand Profile is Relatively Stable with Minimal Seasonality
21
-
200
400
600
800
1,000
1,200
1,400
1,600
-
20
40
60
80
100
120
1 3 5 7 9 11 13 15 17 19 21 23 25 27 29 31 33 35 37 39 41 43 45 47 49 51 53
Th
ou
san
ds
(lb
s)
Mil
lio
ns
(8 o
z ca
ses
)
8oz cases Lbs
The same inventory targets can be set and maintained for the majority of SKUs for the majority of the year
© OPS Rules Partners, LLC 2013
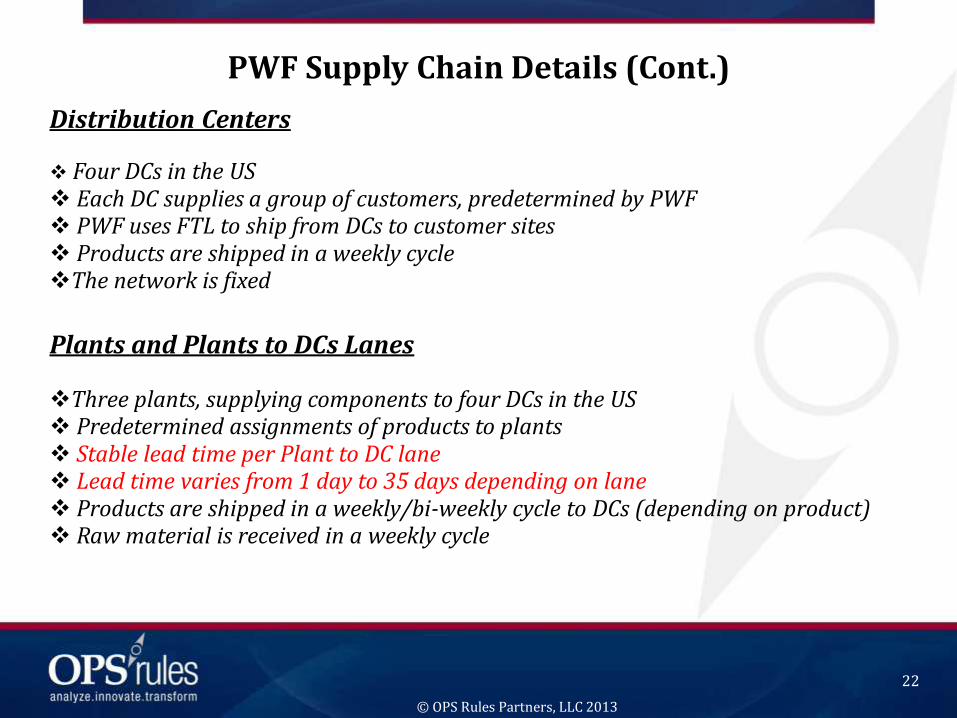
PWF Supply Chain Details (Cont.)
Distribution Centers
Four DCs in the US Each DC supplies a group of customers, predetermined by PWF PWF uses FTL to ship from DCs to customer sites Products are shipped in a weekly cycle The network is fixed
Plants and Plants to DCs Lanes Three plants, supplying components to four DCs in the US Predetermined assignments of products to plants Stable lead time per Plant to DC lane Lead time varies from 1 day to 35 days depending on lane Products are shipped in a weekly/bi-weekly cycle to DCs (depending on product) Raw material is received in a weekly cycle
22
© OPS Rules Partners, LLC 2013
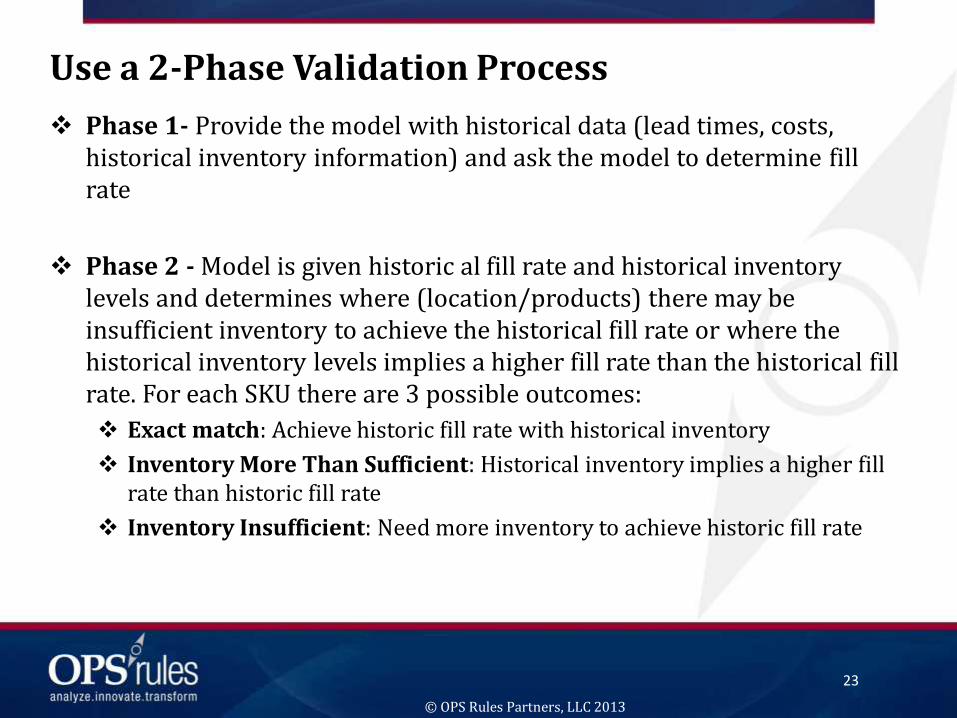
Use a 2-Phase Validation Process
Phase 1- Provide the model with historical data (lead times, costs, historical inventory information) and ask the model to determine fill rate
Phase 2 - Model is given historic al fill rate and historical inventory levels and determines where (location/products) there may be insufficient inventory to achieve the historical fill rate or where the historical inventory levels implies a higher fill rate than the historical fill rate. For each SKU there are 3 possible outcomes:
Exact match: Achieve historic fill rate with historical inventory
Inventory More Than Sufficient: Historical inventory implies a higher fill rate than historic fill rate
Inventory Insufficient: Need more inventory to achieve historic fill rate
23
© OPS Rules Partners, LLC 2013
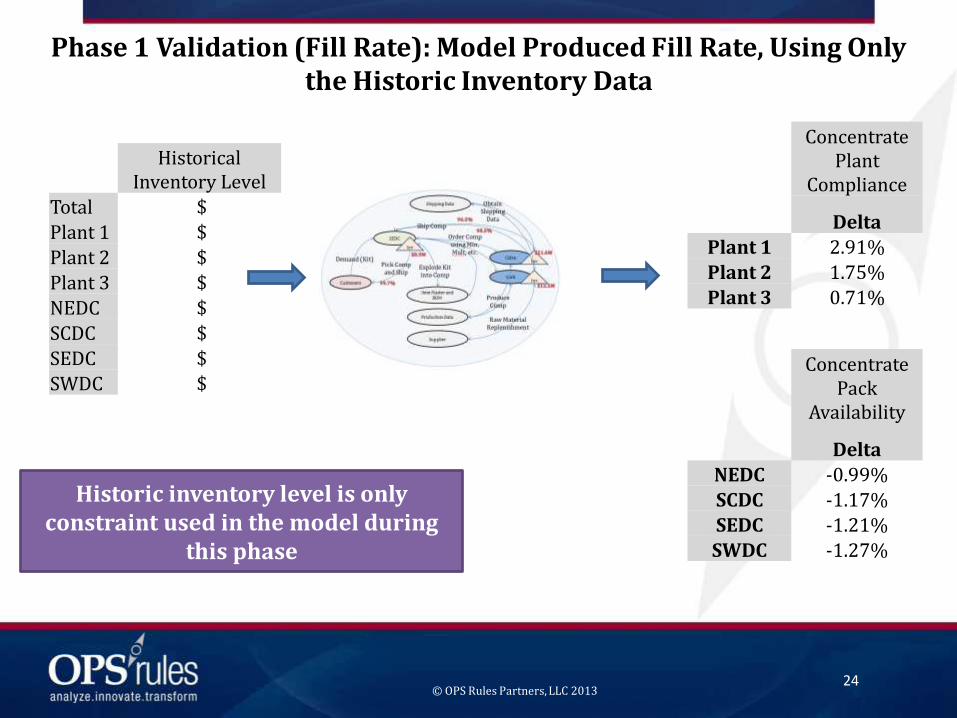
Historical Inventory Level
Total $
Plant 1 $
Plant 2 $
Plant 3 $
NEDC $
SCDC $
SEDC $
SWDC $
Phase 1 Validation (Fill Rate): Model Produced Fill Rate, Using Only the Historic Inventory Data
Historic inventory level is only constraint used in the model during
this phase
Concentrate Plant
Compliance
Delta
Plant 1 2.91%
Plant 2 1.75%
Plant 3 0.71%
Concentrate Pack
Availability
Delta
NEDC -0.99%
SCDC -1.17% SEDC -1.21%
SWDC -1.27%
24 © OPS Rules Partners, LLC 2013
Today’s Topics
Introduction to OPS Rules Management Consultants
Inventory Concepts and Optimization
PWF Supply Chain
End-to-End Model of PWF Supply Chain
Model Validation
Drivers of PWF Inventory
The Opportunity
Key Takeaways
25
© OPS Rules Partners, LLC 2013
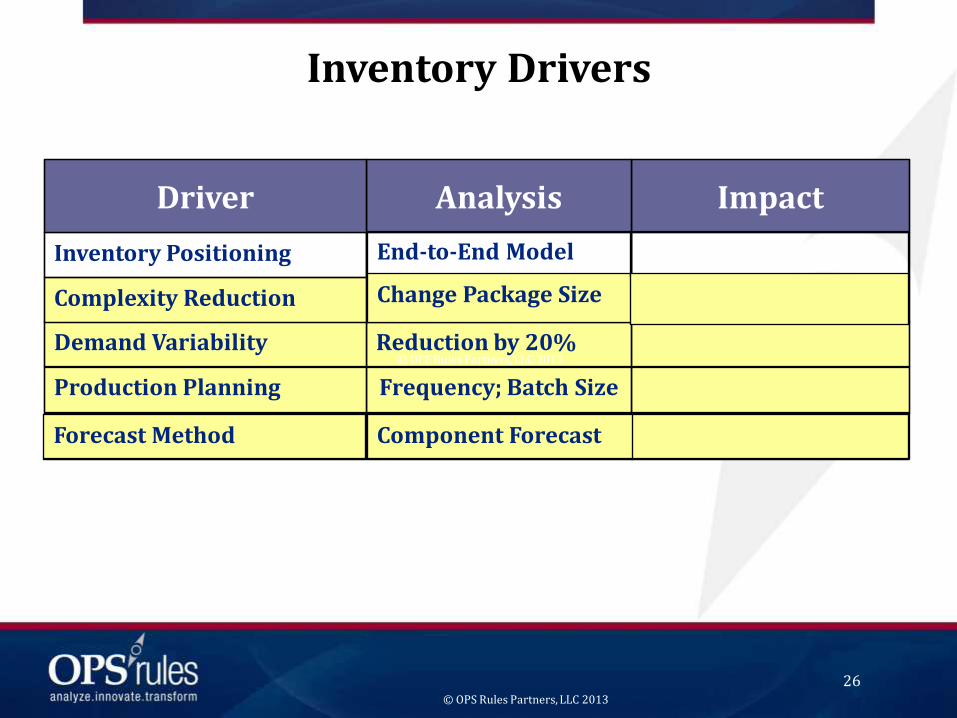
Inventory Drivers
Frequency; Batch Size Production Planning
Reduction by 20% Demand Variability
Complexity Reduction
Inventory Positioning
Impact Analysis Driver
Component Forecast Forecast Method
End-to-End Model
Change Package Size
26
© OPS Rules Partners, LLC 2013
© OPS Rules Partners, LLC 2013
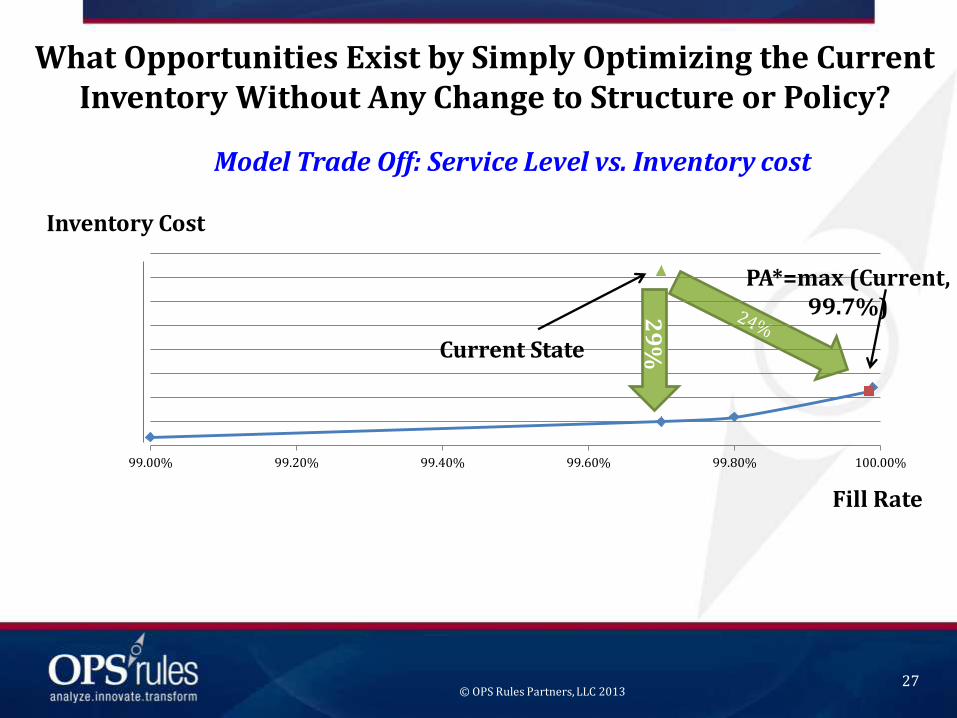
What Opportunities Exist by Simply Optimizing the Current Inventory Without Any Change to Structure or Policy?
99.00% 99.20% 99.40% 99.60% 99.80% 100.00%
Current State
PA*=max (Current, 99.7%) 2
9%
27
Model Trade Off: Service Level vs. Inventory cost
Inventory Cost
Fill Rate
© OPS Rules Partners, LLC 2013
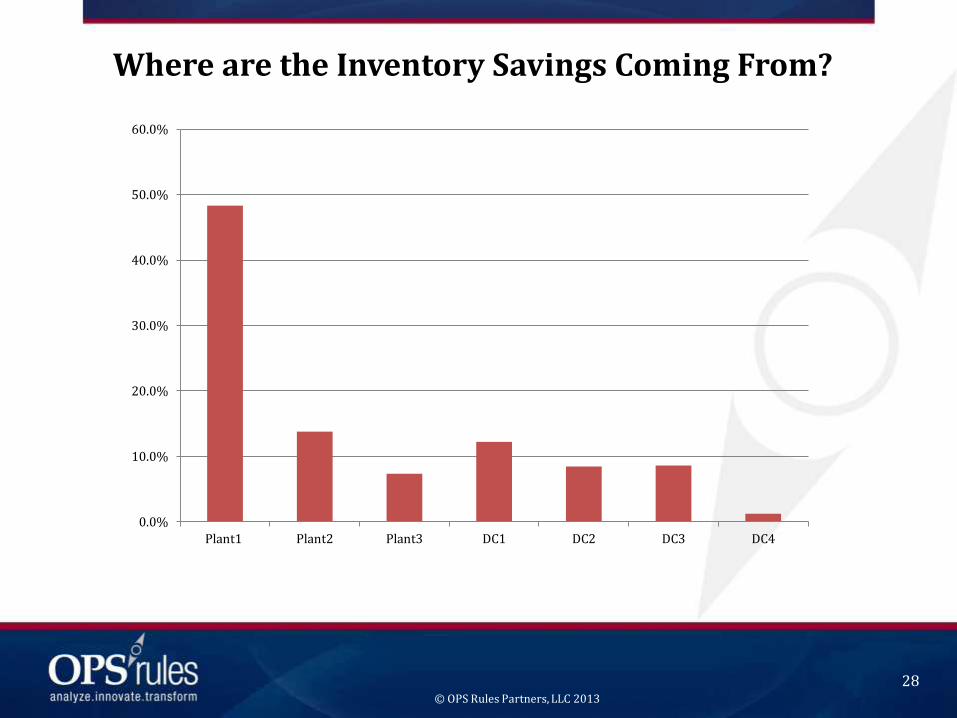
Where are the Inventory Savings Coming From?
28
0.0%
10.0%
20.0%
30.0%
40.0%
50.0%
60.0%
Plant1 Plant2 Plant3 DC1 DC2 DC3 DC4
© OPS Rules Partners, LLC 2013

Where are the Inventory Savings Coming From?
29
Why are there significant inventory savings in raw material at the plants?
70% of the savings are in plant raw material
© OPS Rules Partners, LLC 2013
0.0%
10.0%
20.0%
30.0%
40.0%
50.0%
60.0%
Plant1 Plant2 Plant3 DC1 DC2 DC3 DC4
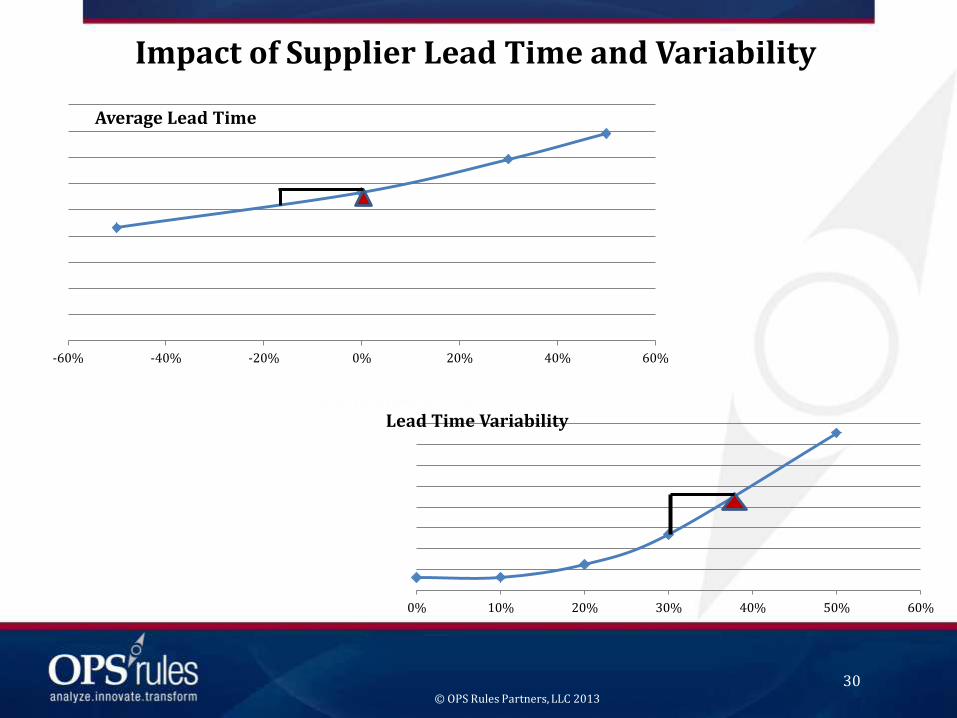
Impact of Supplier Lead Time and Variability
30
-60% -40% -20% 0% 20% 40% 60%
Average Lead Time
0% 10% 20% 30% 40% 50% 60%
Lead Time Variability
© OPS Rules Partners, LLC 2013

Bullwhip Effect: Significant Evidence of Bullwhip Effect is Apparent in PWF's Supply Chain
31
-10000
0
10000
20000
30000
40000
50000
60000
70000
7 12 17 22 27 32
RM xxxxx "Bottler's Demand"
"Plants Requirement"
"DCOrderExp"
Divergences from Established Make-Weeks further exacerbates the variability (Red vs. Green)
Classic Bullwhip Effect (Red vs. Blue)
A single component drove all the variability in this raw material—this component has a production cycle of every other week
© OPS Rules Partners, LLC 2013

Inventory Drivers
Frequency; Batch Size Production Planning
Reduction by 20% Demand Variability
Complexity Reduction
Inventory Positioning
Impact Analysis Driver
Component Forecast Forecast Method
End-to-End Model
Change Package Size
24%-29%
32 © OPS Rules Partners, LLC 2013
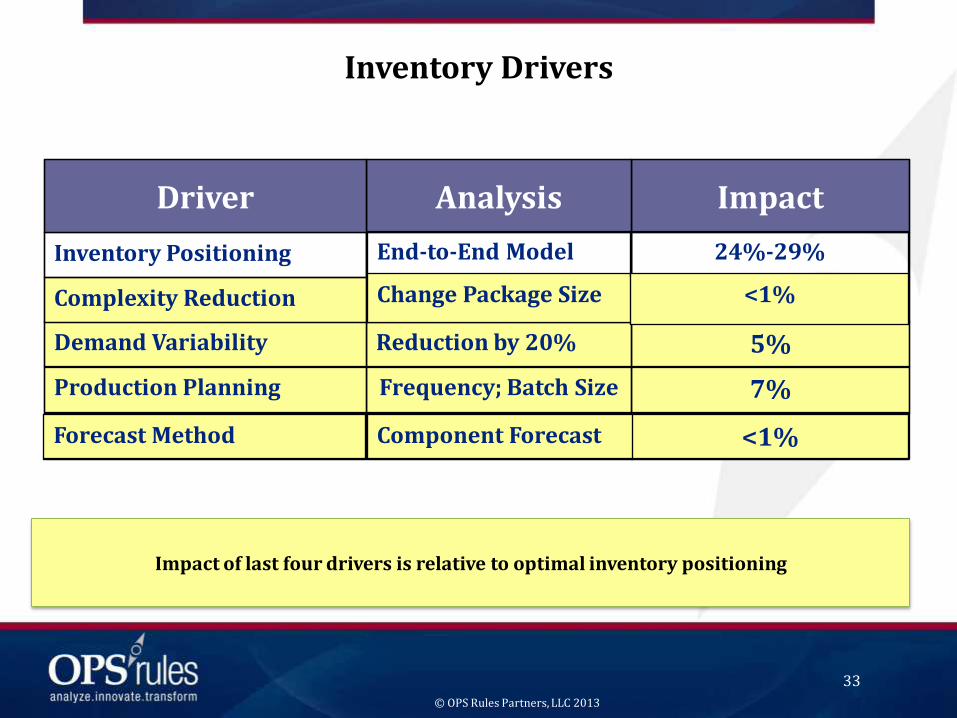
Inventory Drivers
7% Frequency; Batch Size Production Planning
5% Reduction by 20% Demand Variability
Complexity Reduction
Inventory Positioning
Impact Analysis Driver
<1% Component Forecast Forecast Method
End-to-End Model
Change Package Size
24%-29%
<1%
Impact of last four drivers is relative to optimal inventory positioning
33
© OPS Rules Partners, LLC 2013
Today’s Topics
Introduction to OPS Rules Management Consultants
Inventory Concepts and Optimization
PWF Supply Chain
The Challenge
End-to-End Model of PWF Supply Chain
Model Validation
Drivers of PWF Inventory
The Opportunity
Key Takeaways
34
© OPS Rules Partners, LLC 2013
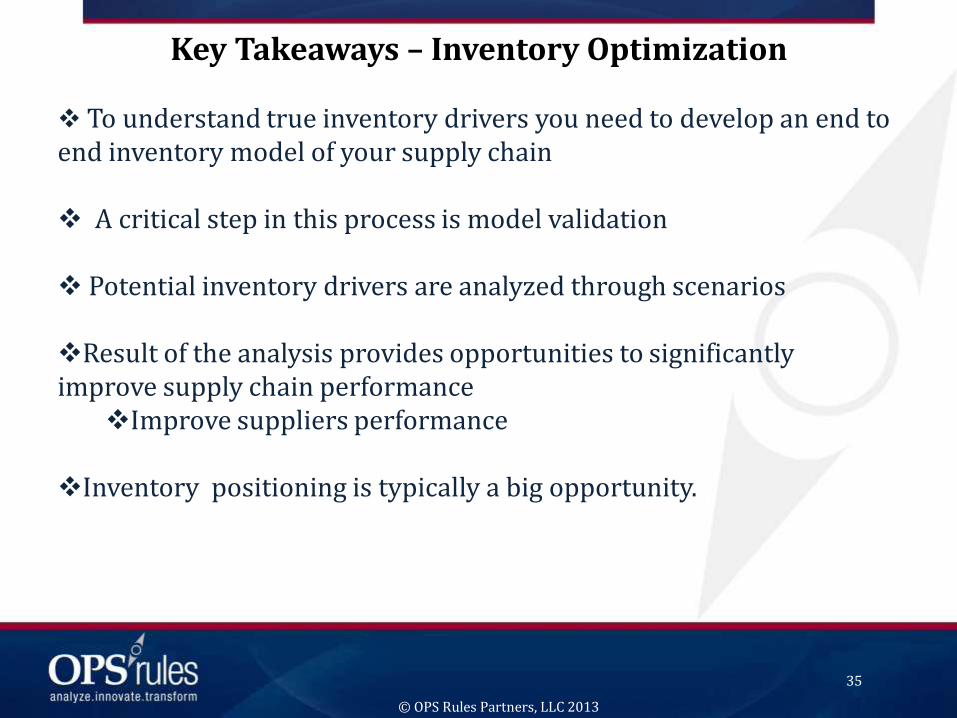
Key Takeaways – Inventory Optimization To understand true inventory drivers you need to develop an end to
end inventory model of your supply chain
A critical step in this process is model validation
Potential inventory drivers are analyzed through scenarios
Result of the analysis provides opportunities to significantly improve supply chain performance
Improve suppliers performance
Inventory positioning is typically a big opportunity.
35
© OPS Rules Partners, LLC 2013
Resources David Simchi-Levi
OPS Rules Chairman [email protected] www.opsrules.com
Laszlo Molnar
Sr. Director, Supply Chain PepsiCo Worldwide Flavors [email protected] www.pepsico.com
36
© OPS Rules Partners, LLC 2013