Embed Size (px)
Citation preview
Supplementary Materials for
Type III interferon is a critical regulator of innate antifungal immunity
Vanessa Espinosa, Orchi Dutta, Constance McElrath, Peicheng Du, Yun-Juan Chang,
Bryan Cicciarelli, Amy Pitler, Ian Whitehead, Joshua J. Obar, Joan E. Durbin,
Sergei V. Kotenko, Amariliz Rivera*
*Corresponding author. Email: [email protected]
Published 6 October 2017, Sci. Immunol. 2, eaan5357 (2017)
DOI: 10.1126/sciimmunol.aan5357
The PDF file includes:
Materials and Methods
Fig. S1. Lymphoid-deficient and IFN-γ–deficient mice control fungal infection
normally.
Fig. S2. Global transcriptional response of antifungal neutrophils.
Fig. S3. Inflammatory responses in IFNR−/− mice 48 hours after infection.
Fig. S4. Analysis of p47Phox−/− mice susceptibility to Af infection.
Fig. S5. Validation of hIFNLR1 antibody.
Fig. S6. Neutrophil-specific gene excision is efficiently targeted in MRP8Cre mice.
Fig. S7. Type III IFN transcription in CCR2-depleted mice is rescued by adoptive
transfer of CCR2+ monocytes.
Table S1. Exact P values of asterisks shown in the figures.
Other Supplementary Material for this manuscript includes the following:
(available at immunology.sciencemag.org/cgi/content/full/2/16/eaan5357/DC1)
Excel sheet with differentially expressed gene lists
Excel sheet with source data for figures shown
immunology.sciencemag.org/cgi/content/full/2/16/eaan5357/DC1
Materials and Methods
Measurement of Myeloperoxidase (MPO) and NET-associated Elastase
Neutrophils were isolated from the BAL of different IFNR-/- mice 48 hours post-
infection. Neutrophils were treated ex vivo with 20 nM PMA in order to stimulate MPO release
and NET formation. MPO was measured using a neutrophil myeloperoxidase activity assay kit
(Cayman Chemical) per the manufacturer’s instructions. As a control for the specificity of the
assay, we used the MPO inhibitor, 4-aminobenzhydrozide (4-ABH), and treated neutrophils
using a 1:100 dilution of the 25 mM stock. NET-associated elastase was measured using a
NETosis assay kit (Cayman Chemical) per the manufacturer’s instructions.
Western blots and Genotyping
Neutrophils from the lung, spleen, and bone marrow as well as bone marrow-derived T
and B cells were isolated from naïve wild-type, IFNAR-/-, IFNLR1-/-, IFNAR-/-IFNLR1-/-(DKO),
MRP8cre Ifnlr1fl/fl, MRP8cre Stat1fl/fl, MRP8cre, Ifnlr1fl/fl, and Stat1fl/fl mice. Neutrophils and B cells
were stimulated with 100 ng of IFN-α2 (Novoprotein) or IFN-λ2 (PBL). B cells were sorted as
Live CD45+B220+, T cells were sorted as Live CD45+Thy1.2+, and neutrophils were sorted as
Live CD45+CD11b+Ly6CintLy6G+. These populations were sorted to >99% purity. Cell lysates
were collected in lysis buffer containing protease and phosphatase inhibitors. Equal amounts of
total protein was separated on 7.5% SDS-PAGE gels, transferred to Nitrocellulose 0.45 μm
membrane (BIO-RAD), and subsequently probed with antibody against phosphorylated STAT1
(BD #612133) and β-actin (Sigma #A5441). For PCR genotyping, DNA from sorted cells was
isolated using Qiagen DNeasy kit, and run on a 4% agarose gel. Control DNA was extracted
from tail snips.
Human Blood and Bone Marrow Analysis
Bone marrow (BM) and peripheral blood samples were obtained from the Whitehead
laboratory. Samples were obtained under Rutgers Institutional Review Board approved
protocols. The samples were lysed 2-3 times to remove RBCs and resuspended in RPMI
containing FCS. For BM samples, 1x10⁶ cells were plated on flat bottom tissue culture treated
96-well plates and allowed to rest for 30-60 min before culturing with pre-germinated CEA10
conidia at an MOI of 1 for 6 hours. For peripheral blood samples, 3x10⁶ cells were plated on 24-
well plates and rested for 30-60 min. Pre-germinated CEA10 conidia were added at an MOI of 1
for 12 hours.
For analysis by flow cytometry, cells were stained with the following anti-human
antibodies: anti-IFNLR1 (PBL); goat anti-mouse (Jackson ImmunoResearch); biotinylated CD15
(HI98, eBioscience), CD16 (eBioCB16, eBioscience); streptavidin AlexaFluor 633 (Invitrogen);
CD49d (gF10, BDPharmingen), CD14 (M5E2, DPharmingen), and CD19 (HIB19,
BDPharmingen). RNA from human samples was isolated using the QIAshredder cell
homogenizer and RNeasy mini kits from Qiagen. QRT-PCR was performed as described above.
Human TaqMan probes were purchased from Applied Biosystems.
Cell Sorting for RNA Sequencing and Analysis
Live CCR2GFP+CD45+CD11b+NK1.1-Ly6C+Ly6G- (CCR2+mo) and Live CCR2GFP-
CD45+CD11b+NK1.1-Ly6G+ (neutrophils) populations were isolated to >98.9% purity using a
BD FACS ARIA II cell sorter dedicated to the processing of BSL-2 samples (Flow Cytometry
Core facility). Cells were sorted from lung single cell suspensions obtained from A. fumigatus
infected CCR2-GFP mice that were challenged 2 days prior. RNA was immediately extracted
from sorted cells using Qiagen RNeasy kit. The transcriptional profile of neutrophils was
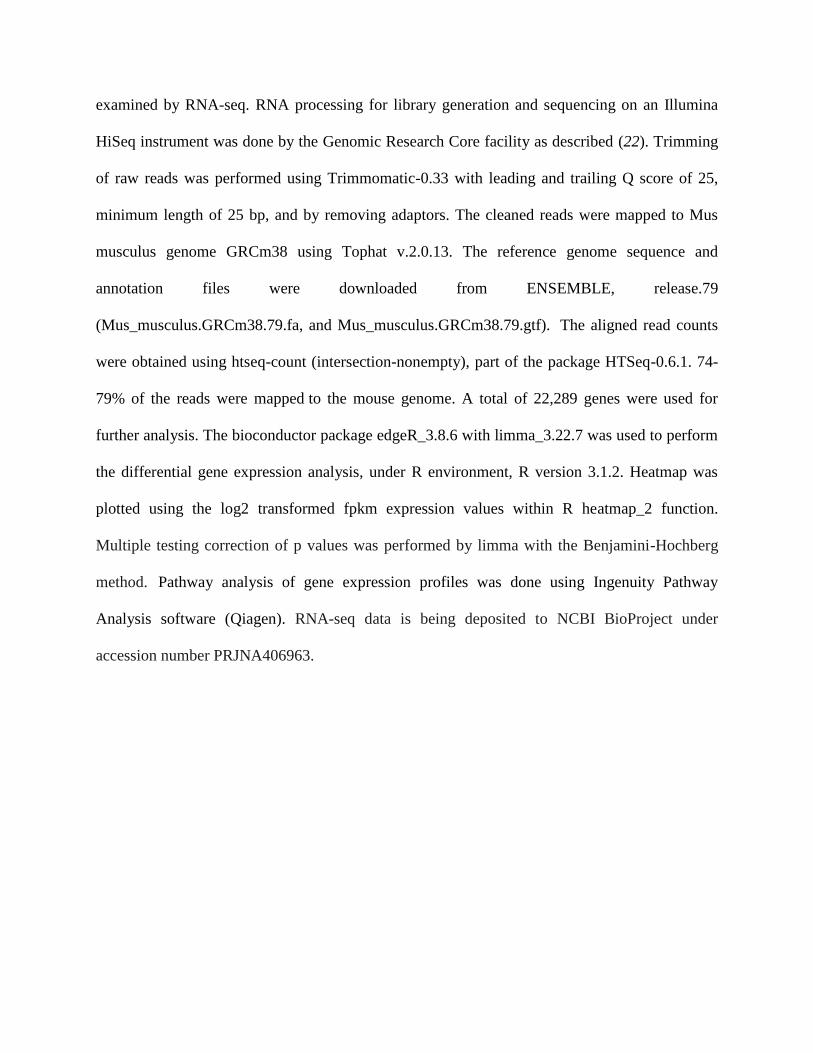
examined by RNA-seq. RNA processing for library generation and sequencing on an Illumina
HiSeq instrument was done by the Genomic Research Core facility as described (22). Trimming
of raw reads was performed using Trimmomatic-0.33 with leading and trailing Q score of 25,
minimum length of 25 bp, and by removing adaptors. The cleaned reads were mapped to Mus
musculus genome GRCm38 using Tophat v.2.0.13. The reference genome sequence and
annotation files were downloaded from ENSEMBLE, release.79
(Mus_musculus.GRCm38.79.fa, and Mus_musculus.GRCm38.79.gtf). The aligned read counts
were obtained using htseq-count (intersection-nonempty), part of the package HTSeq-0.6.1. 74-
79% of the reads were mapped to the mouse genome. A total of 22,289 genes were used for
further analysis. The bioconductor package edgeR_3.8.6 with limma_3.22.7 was used to perform
the differential gene expression analysis, under R environment, R version 3.1.2. Heatmap was
plotted using the log2 transformed fpkm expression values within R heatmap_2 function.
Multiple testing correction of p values was performed by limma with the Benjamini-Hochberg
method. Pathway analysis of gene expression profiles was done using Ingenuity Pathway
Analysis software (Qiagen). RNA-seq data is being deposited to NCBI BioProject under
accession number PRJNA406963.
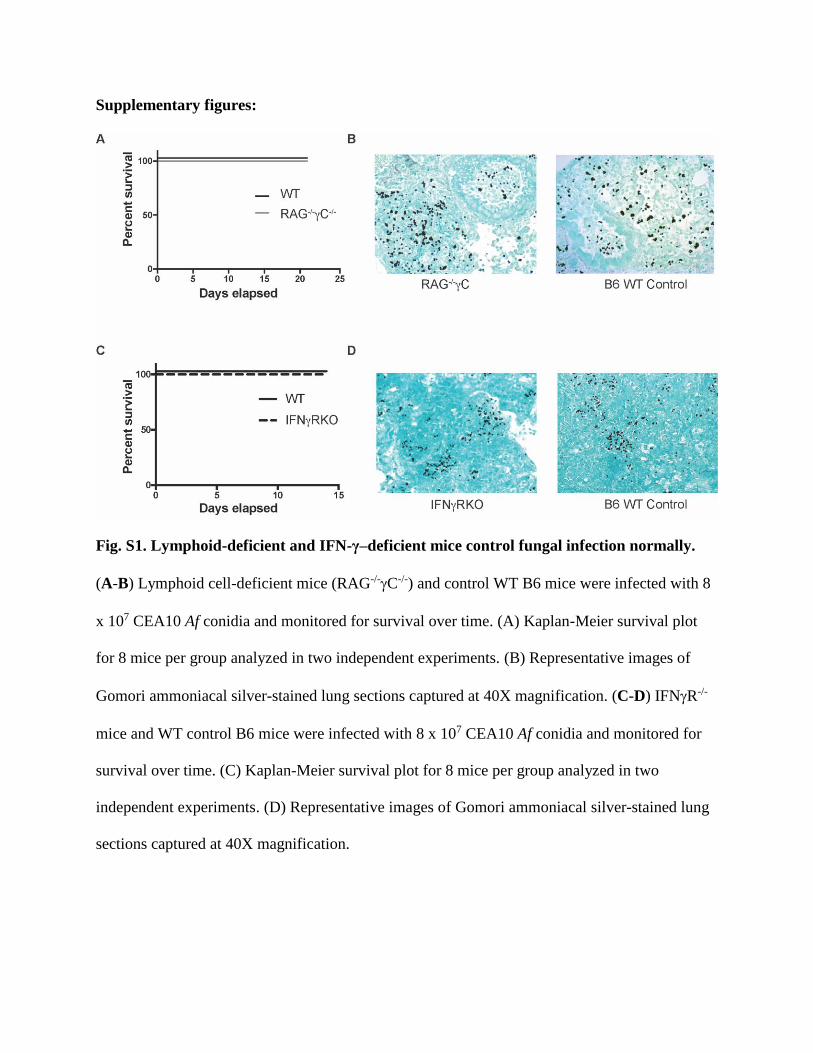
Supplementary figures:
Fig. S1. Lymphoid-deficient and IFN-γ–deficient mice control fungal infection normally.
(A-B) Lymphoid cell-deficient mice (RAG-/-C-/-) and control WT B6 mice were infected with 8
x 107 CEA10 Af conidia and monitored for survival over time. (A) Kaplan-Meier survival plot
for 8 mice per group analyzed in two independent experiments. (B) Representative images of
Gomori ammoniacal silver-stained lung sections captured at 40X magnification. (C-D) IFNR-/-
mice and WT control B6 mice were infected with 8 x 10⁷ CEA10 Af conidia and monitored for
survival over time. (C) Kaplan-Meier survival plot for 8 mice per group analyzed in two
independent experiments. (D) Representative images of Gomori ammoniacal silver-stained lung
sections captured at 40X magnification.
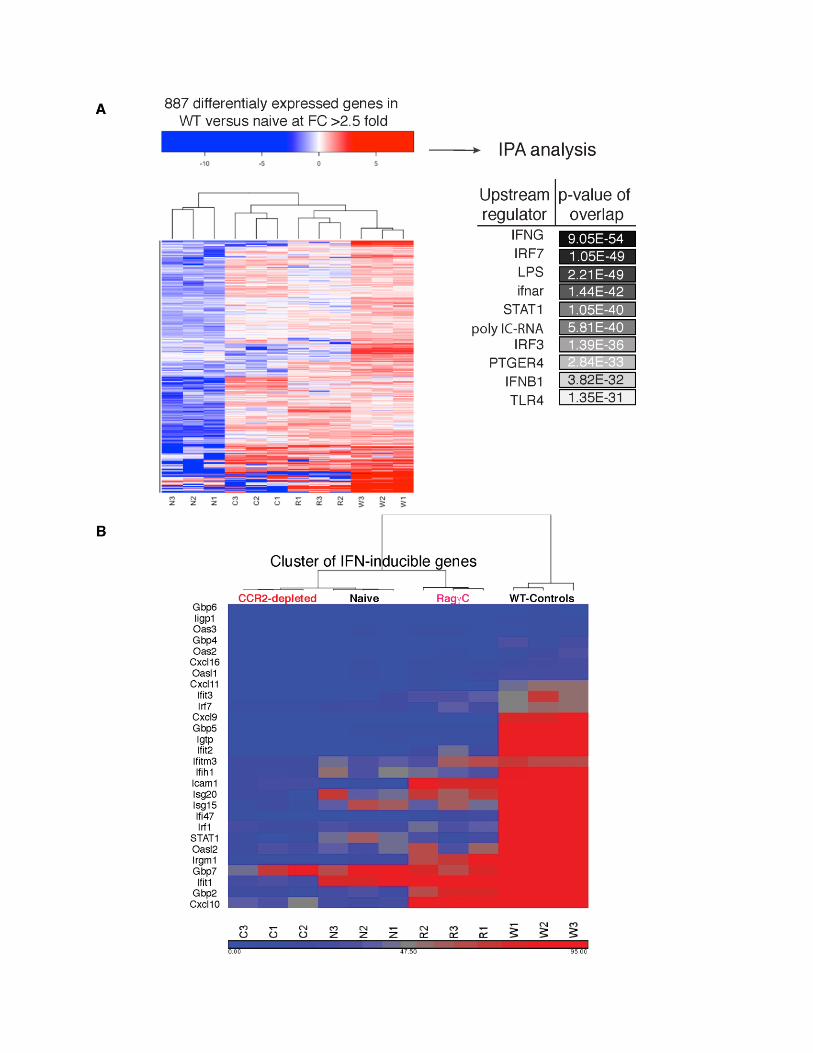
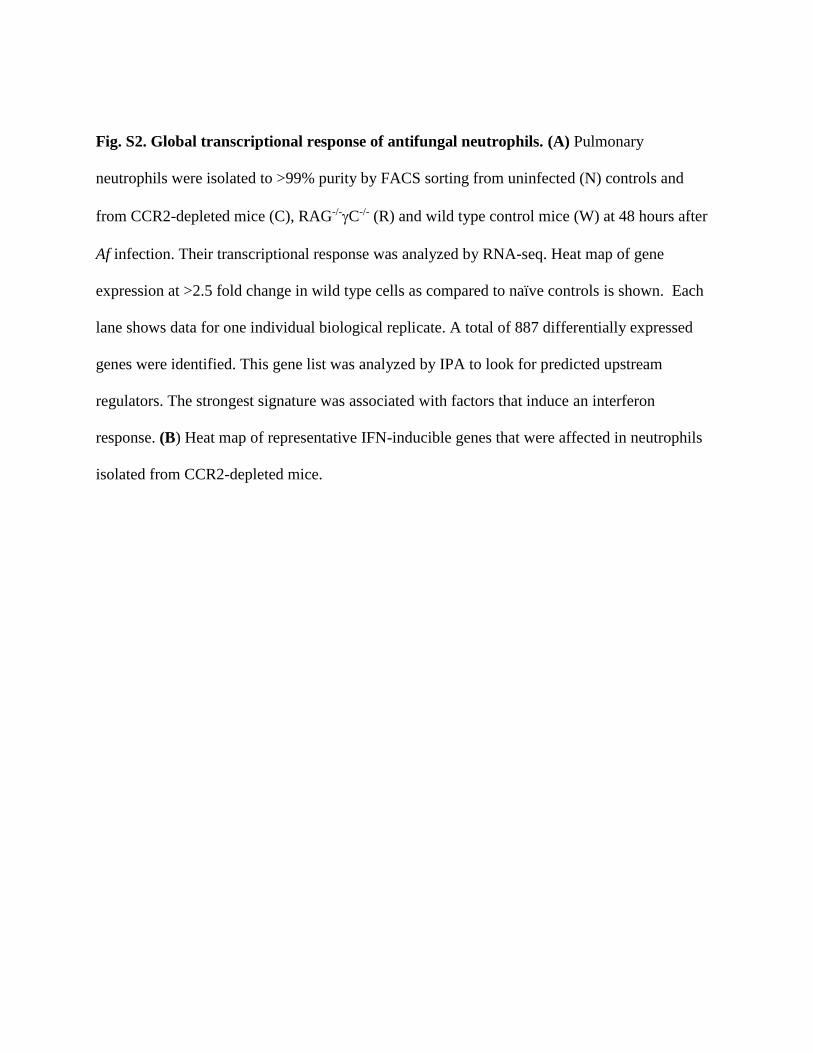
Fig. S2. Global transcriptional response of antifungal neutrophils. (A) Pulmonary
neutrophils were isolated to >99% purity by FACS sorting from uninfected (N) controls and
from CCR2-depleted mice (C), RAG-/-C-/- (R) and wild type control mice (W) at 48 hours after
Af infection. Their transcriptional response was analyzed by RNA-seq. Heat map of gene
expression at >2.5 fold change in wild type cells as compared to naïve controls is shown. Each
lane shows data for one individual biological replicate. A total of 887 differentially expressed
genes were identified. This gene list was analyzed by IPA to look for predicted upstream
regulators. The strongest signature was associated with factors that induce an interferon
response. (B) Heat map of representative IFN-inducible genes that were affected in neutrophils
isolated from CCR2-depleted mice.
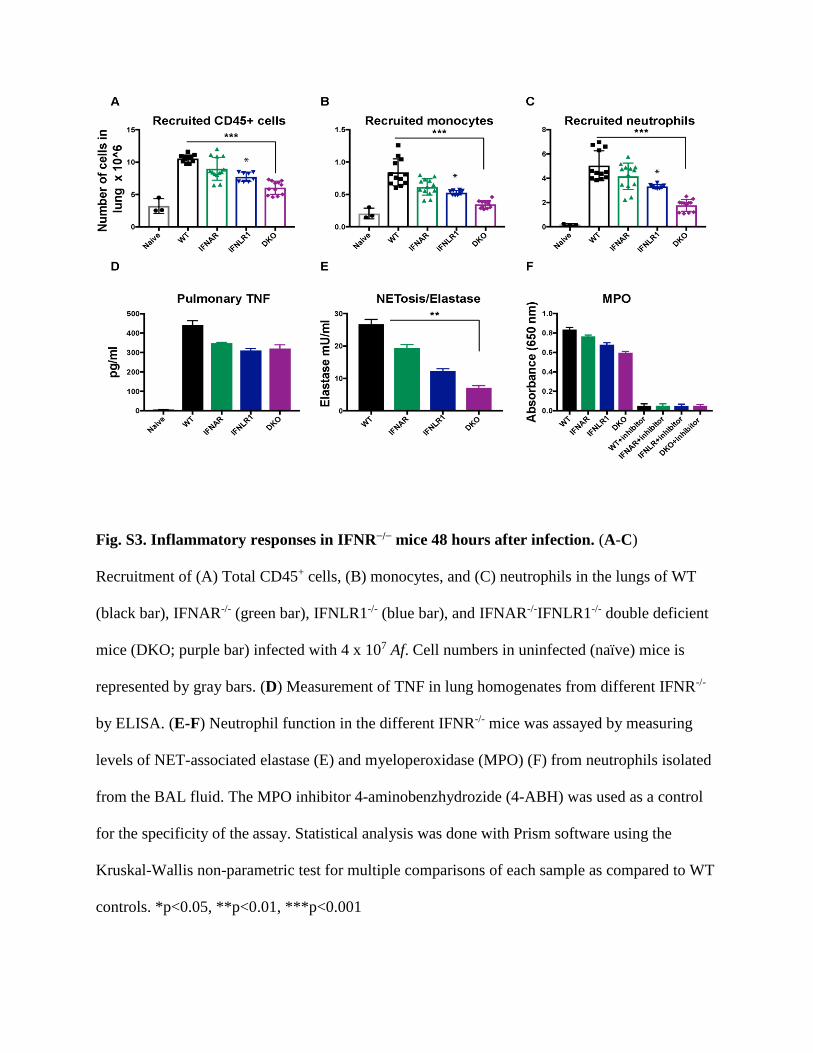
Fig. S3. Inflammatory responses in IFNR−/− mice 48 hours after infection. (A-C)
Recruitment of (A) Total CD45+ cells, (B) monocytes, and (C) neutrophils in the lungs of WT
(black bar), IFNAR-/- (green bar), IFNLR1-/- (blue bar), and IFNAR-/-IFNLR1-/- double deficient
mice (DKO; purple bar) infected with 4 x 10⁷ Af. Cell numbers in uninfected (naïve) mice is
represented by gray bars. (D) Measurement of TNF in lung homogenates from different IFNR-/-
by ELISA. (E-F) Neutrophil function in the different IFNR-/- mice was assayed by measuring
levels of NET-associated elastase (E) and myeloperoxidase (MPO) (F) from neutrophils isolated
from the BAL fluid. The MPO inhibitor 4-aminobenzhydrozide (4-ABH) was used as a control
for the specificity of the assay. Statistical analysis was done with Prism software using the
Kruskal-Wallis non-parametric test for multiple comparisons of each sample as compared to WT
controls. *p<0.05, **p<0.01, ***p<0.001
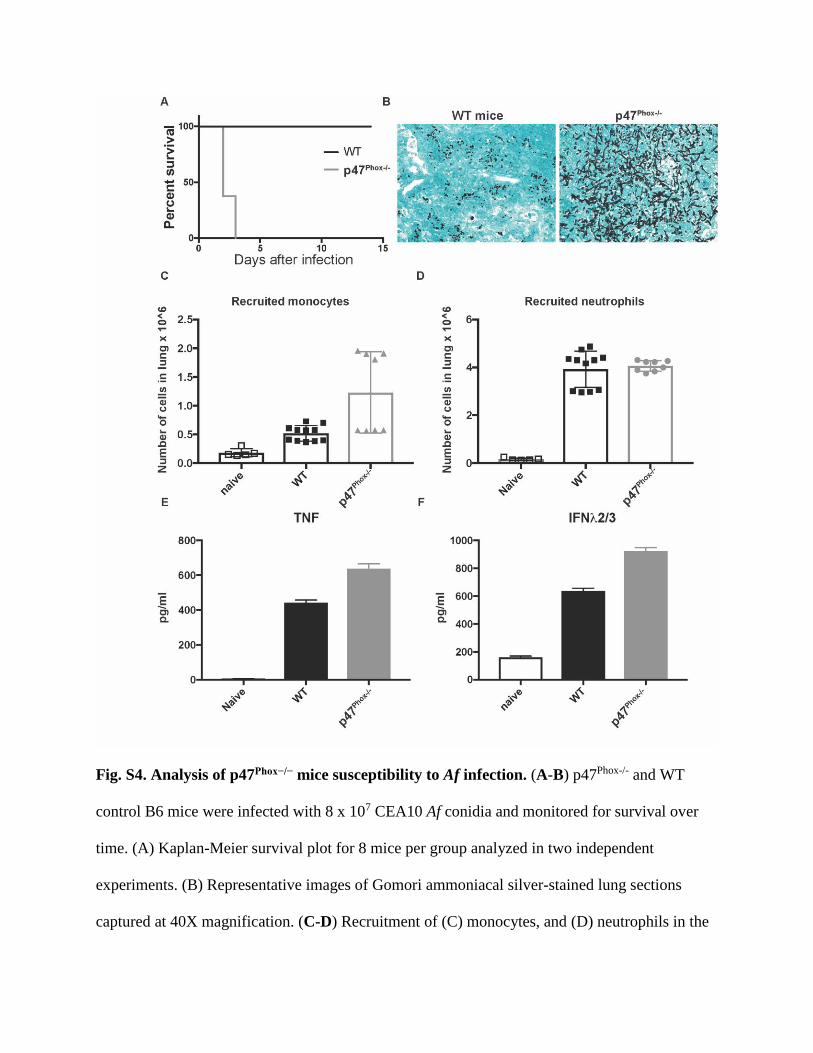
Fig. S4. Analysis of p47Phox−/− mice susceptibility to Af infection. (A-B) p47Phox-/- and WT
control B6 mice were infected with 8 x 10⁷ CEA10 Af conidia and monitored for survival over
time. (A) Kaplan-Meier survival plot for 8 mice per group analyzed in two independent
experiments. (B) Representative images of Gomori ammoniacal silver-stained lung sections
captured at 40X magnification. (C-D) Recruitment of (C) monocytes, and (D) neutrophils in the
lungs of WT (black symbols), and p47Phox-/- (gray symbols) infected with 4 x 10⁷ Af 48 hours
post-infection. Cell numbers in naïve mice are represented by white squares. (D) Measurement
of TNF and IFN-λ2/3 in lung homogenates by ELISA.
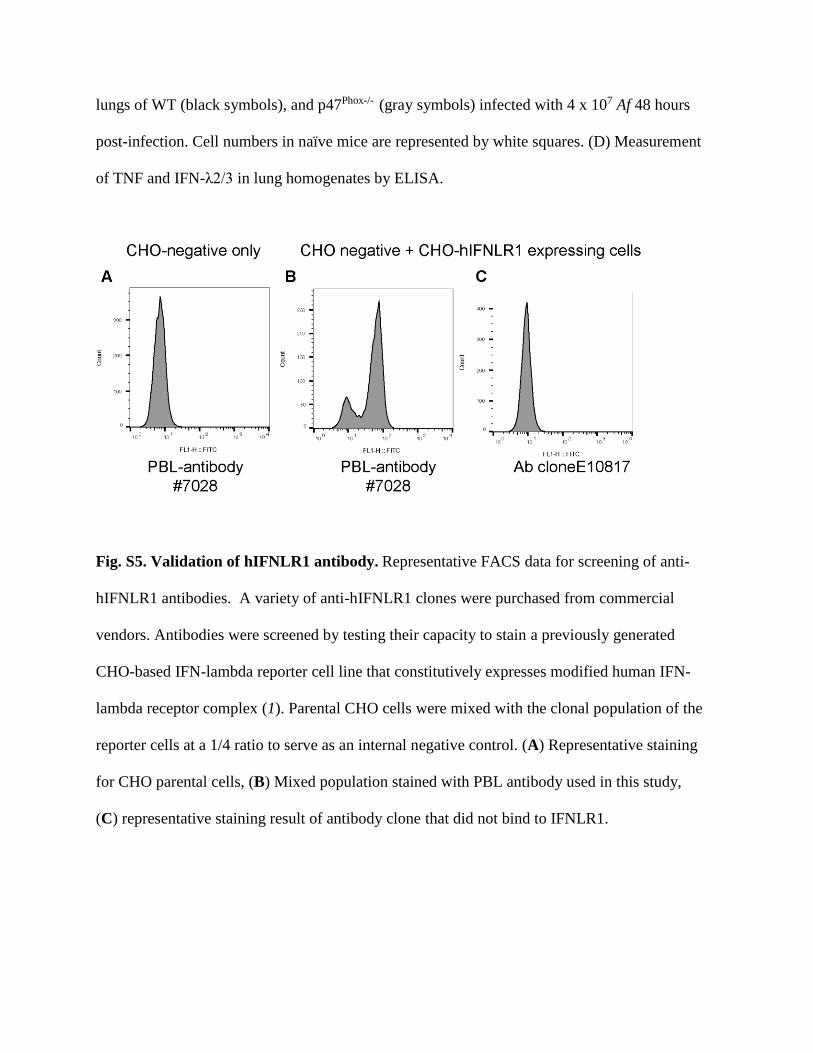
Fig. S5. Validation of hIFNLR1 antibody. Representative FACS data for screening of anti-
hIFNLR1 antibodies. A variety of anti-hIFNLR1 clones were purchased from commercial
vendors. Antibodies were screened by testing their capacity to stain a previously generated
CHO-based IFN-lambda reporter cell line that constitutively expresses modified human IFN-
lambda receptor complex (1). Parental CHO cells were mixed with the clonal population of the
reporter cells at a 1/4 ratio to serve as an internal negative control. (A) Representative staining
for CHO parental cells, (B) Mixed population stained with PBL antibody used in this study,
(C) representative staining result of antibody clone that did not bind to IFNLR1.
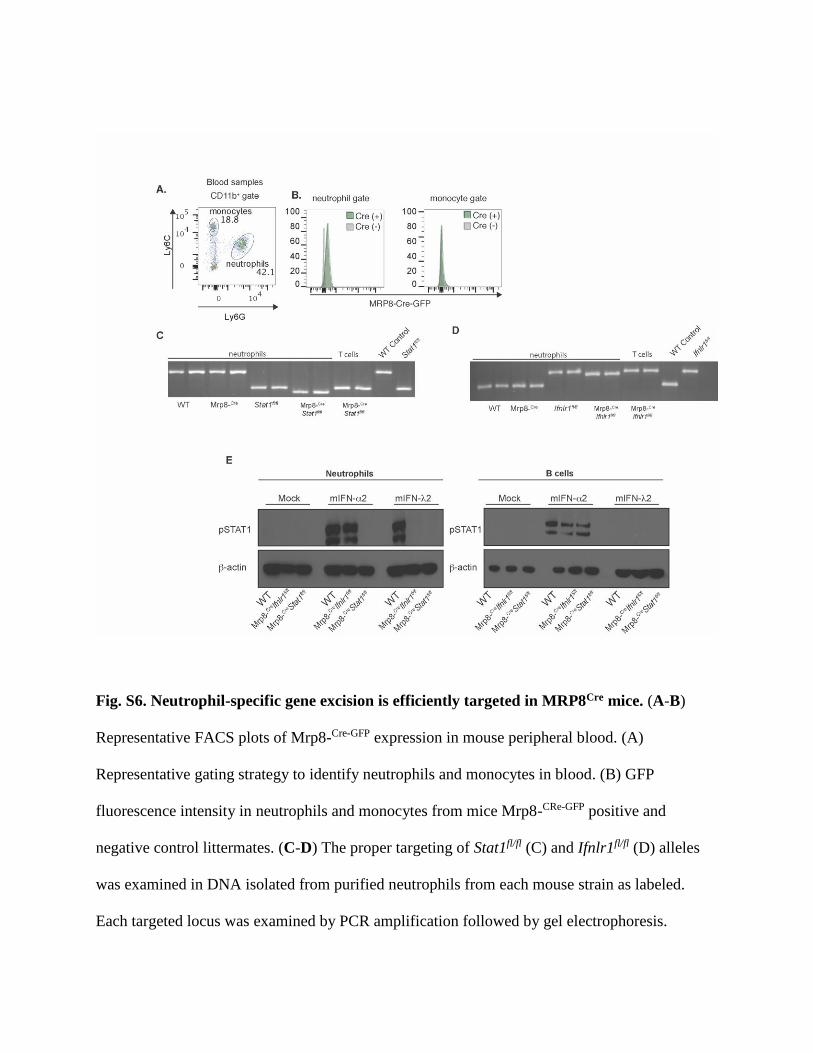
Fig. S6. Neutrophil-specific gene excision is efficiently targeted in MRP8Cre mice. (A-B)
Representative FACS plots of Mrp8-Cre-GFP expression in mouse peripheral blood. (A)
Representative gating strategy to identify neutrophils and monocytes in blood. (B) GFP
fluorescence intensity in neutrophils and monocytes from mice Mrp8-CRe-GFP positive and
negative control littermates. (C-D) The proper targeting of Stat1fl/fl (C) and Ifnlr1fl/fl (D) alleles
was examined in DNA isolated from purified neutrophils from each mouse strain as labeled.
Each targeted locus was examined by PCR amplification followed by gel electrophoresis.
Expected gene excision is evident in purified neutrophils, but not in T cells isolated from the
same mice. (E) Efficient targeting of each gene on neutrophils at the functional level was
confirmed by purifying bone marrow neutrophils from control or gene targeted mice and testing
STAT1 phosphorylation after in vitro treatment with recombinant IFNs. Neutrophils isolated
from MRP8-Cre Ifnlr1fl/fl -show preserved responsiveness to IFN- treatment, but impaired
response to IFN- Neutrophils from Mrp8Cre Stat1fl/fl mice showed impaired response to both
type I and type III IFN treatment as expected. Control responses in isolated B cells showed no
changes in each mouse strain.
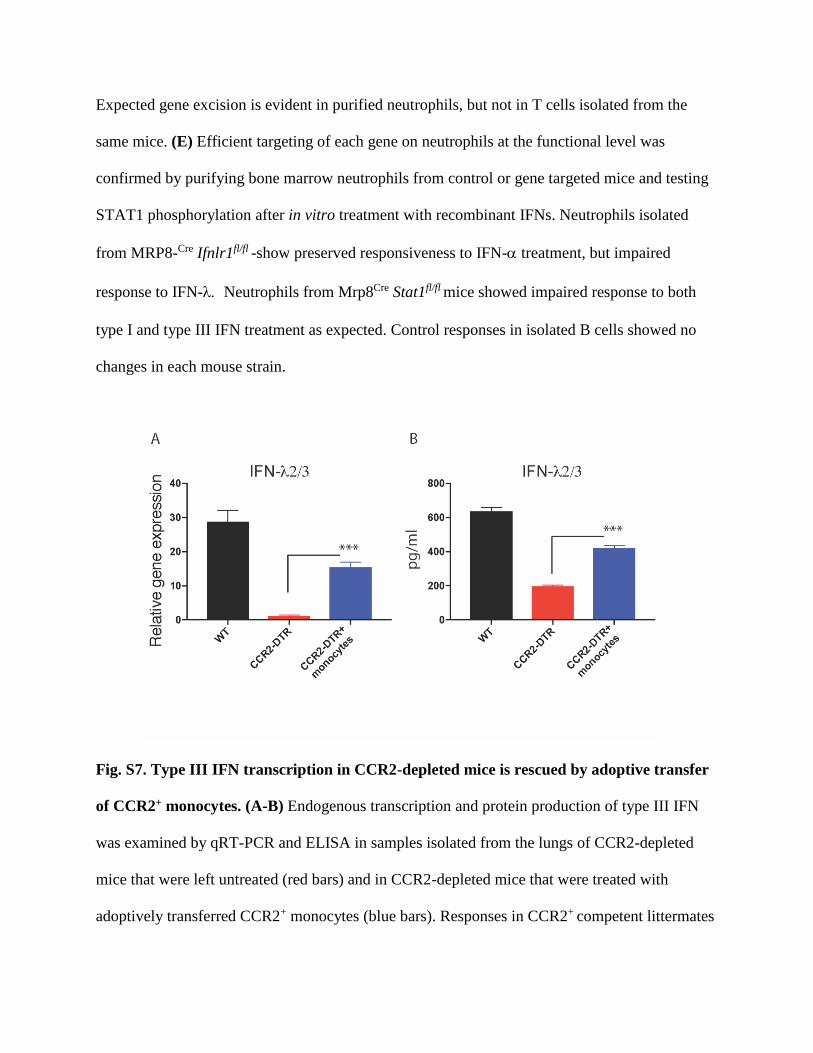
Fig. S7. Type III IFN transcription in CCR2-depleted mice is rescued by adoptive transfer
of CCR2+ monocytes. (A-B) Endogenous transcription and protein production of type III IFN
was examined by qRT-PCR and ELISA in samples isolated from the lungs of CCR2-depleted
mice that were left untreated (red bars) and in CCR2-depleted mice that were treated with
adoptively transferred CCR2+ monocytes (blue bars). Responses in CCR2+ competent littermates
(black bars) were used as positive controls. Data shown is mean ± SEM for four mice per group
and is for one experiment representative of two. ***p<0.001 as calculated by Kruskal-Wallis
non-parametric test of experimental group relative to CCR2-depleted, untreated mice using
Prism software.
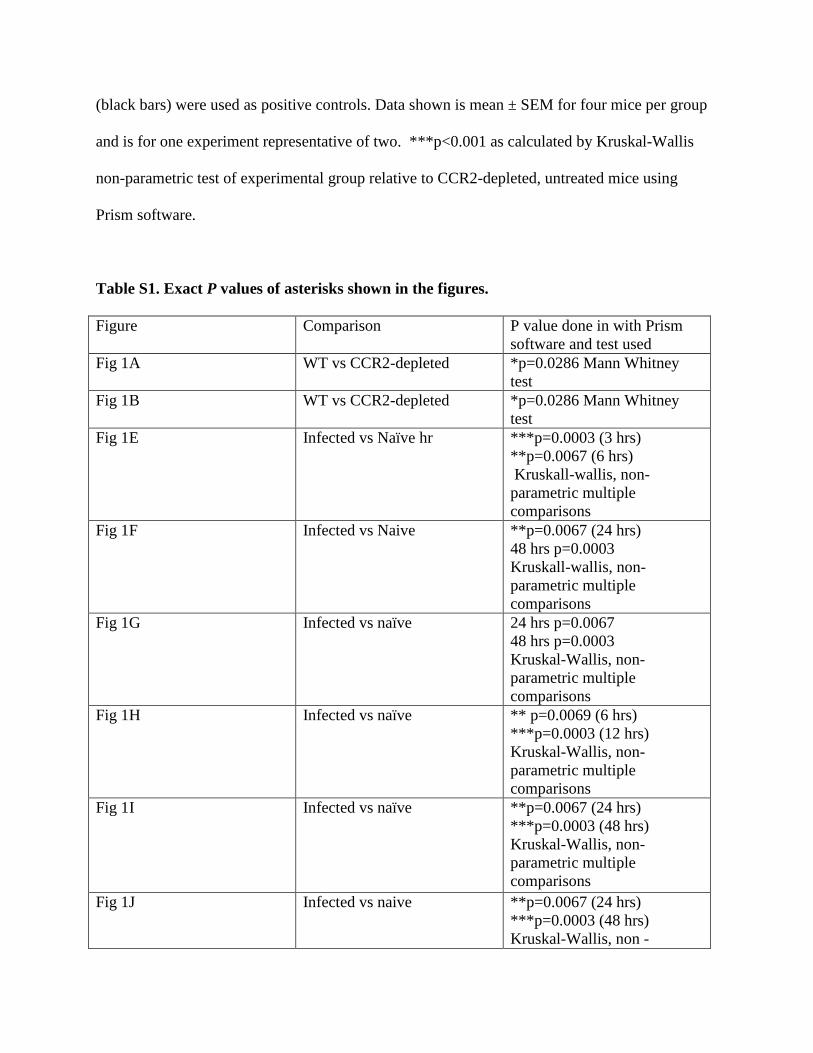
Table S1. Exact P values of asterisks shown in the figures.
Figure Comparison P value done in with Prism
software and test used
Fig 1A WT vs CCR2-depleted *p=0.0286 Mann Whitney
test
Fig 1B WT vs CCR2-depleted *p=0.0286 Mann Whitney
test
Fig 1E Infected vs Naïve hr ***p=0.0003 (3 hrs)
**p=0.0067 (6 hrs)
Kruskall-wallis, non-
parametric multiple
comparisons
Fig 1F Infected vs Naive **p=0.0067 (24 hrs)
48 hrs p=0.0003
Kruskall-wallis, non-
parametric multiple
comparisons
Fig 1G Infected vs naïve 24 hrs p=0.0067
48 hrs p=0.0003
Kruskal-Wallis, non-
parametric multiple
comparisons
Fig 1H Infected vs naïve ** p=0.0069 (6 hrs)
***p=0.0003 (12 hrs)
Kruskal-Wallis, non-
parametric multiple
comparisons
Fig 1I Infected vs naïve **p=0.0067 (24 hrs)
***p=0.0003 (48 hrs)
Kruskal-Wallis, non-
parametric multiple
comparisons
Fig 1J Infected vs naive **p=0.0067 (24 hrs)
***p=0.0003 (48 hrs)
Kruskal-Wallis, non -
parametric multiple
comparisons
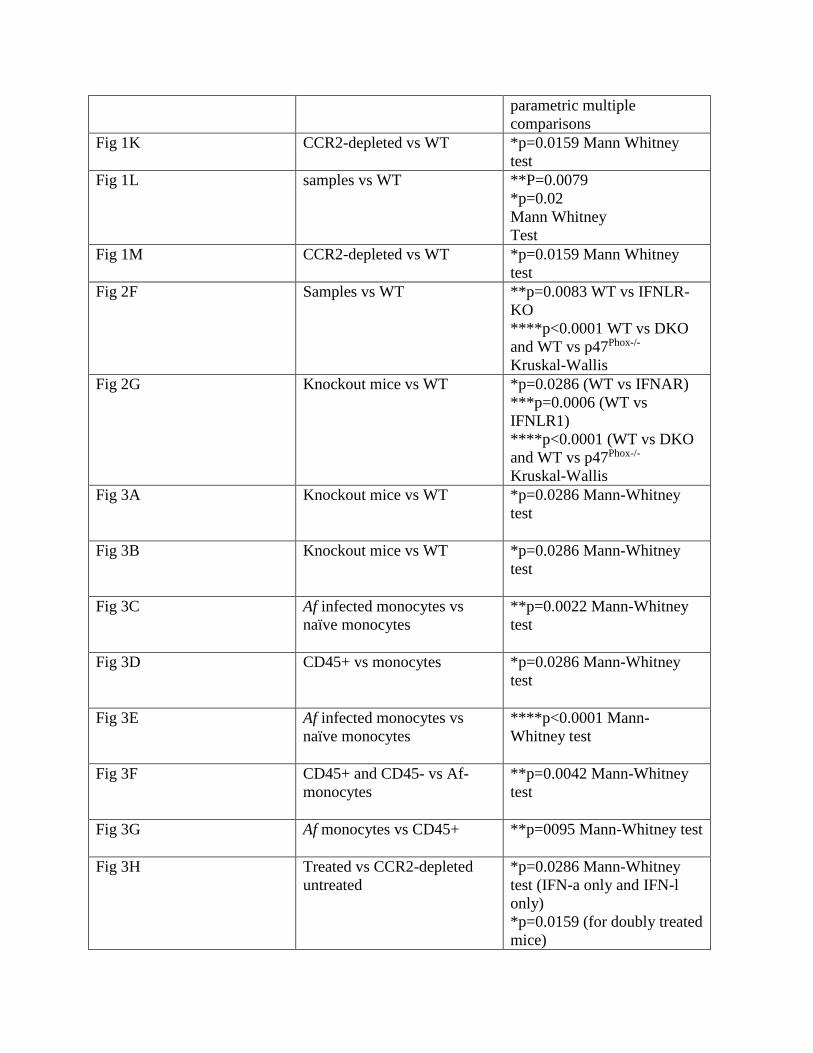
Fig 1K CCR2-depleted vs WT *p=0.0159 Mann Whitney
test
Fig 1L samples vs WT **P=0.0079
*p=0.02
Mann Whitney
Test
Fig 1M CCR2-depleted vs WT *p=0.0159 Mann Whitney
test
Fig 2F Samples vs WT **p=0.0083 WT vs IFNLR-
KO
****p<0.0001 WT vs DKO
and WT vs p47Phox-/-
Kruskal-Wallis
Fig 2G Knockout mice vs WT *p=0.0286 (WT vs IFNAR)
***p=0.0006 (WT vs
IFNLR1)
****p<0.0001 (WT vs DKO
and WT vs p47Phox-/-
Kruskal-Wallis
Fig 3A Knockout mice vs WT *p=0.0286 Mann-Whitney
test
Fig 3B Knockout mice vs WT *p=0.0286 Mann-Whitney
test
Fig 3C Af infected monocytes vs
naïve monocytes
**p=0.0022 Mann-Whitney
test
Fig 3D CD45+ vs monocytes *p=0.0286 Mann-Whitney
test
Fig 3E Af infected monocytes vs
naïve monocytes
****p<0.0001 Mann-
Whitney test
Fig 3F CD45+ and CD45- vs Af-
monocytes
**p=0.0042 Mann-Whitney
test
Fig 3G Af monocytes vs CD45+ **p=0095 Mann-Whitney test
Fig 3H Treated vs CCR2-depleted
untreated
*p=0.0286 Mann-Whitney
test (IFN-a only and IFN-l
only)
*p=0.0159 (for doubly treated
mice)
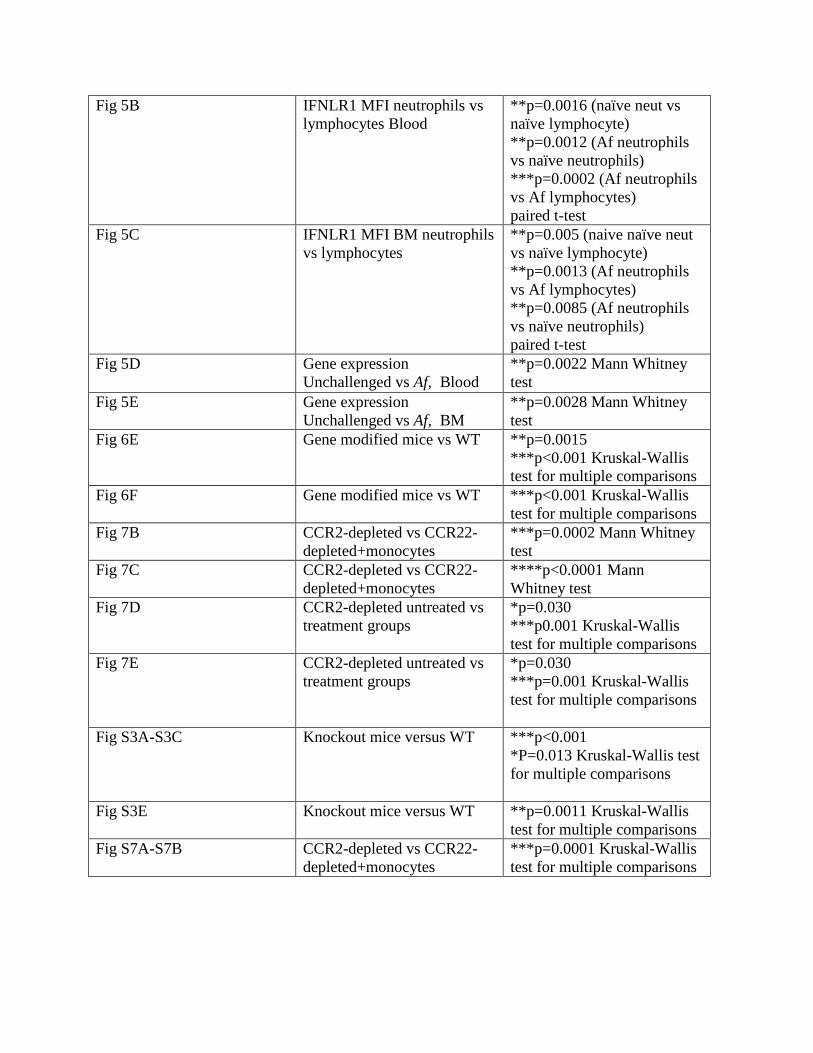
Fig 5B IFNLR1 MFI neutrophils vs
lymphocytes Blood
**p=0.0016 (naïve neut vs
naïve lymphocyte)
**p=0.0012 (Af neutrophils
vs naïve neutrophils)
***p=0.0002 (Af neutrophils
vs Af lymphocytes)
paired t-test
Fig 5C IFNLR1 MFI BM neutrophils
vs lymphocytes
**p=0.005 (naive naïve neut
vs naïve lymphocyte)
**p=0.0013 (Af neutrophils
vs Af lymphocytes)
**p=0.0085 (Af neutrophils
vs naïve neutrophils)
paired t-test
Fig 5D Gene expression
Unchallenged vs Af, Blood
**p=0.0022 Mann Whitney
test
Fig 5E Gene expression
Unchallenged vs Af, BM
**p=0.0028 Mann Whitney
test
Fig 6E Gene modified mice vs WT **p=0.0015
***p<0.001 Kruskal-Wallis
test for multiple comparisons
Fig 6F Gene modified mice vs WT ***p<0.001 Kruskal-Wallis
test for multiple comparisons
Fig 7B CCR2-depleted vs CCR22-
depleted+monocytes
***p=0.0002 Mann Whitney
test
Fig 7C CCR2-depleted vs CCR22-
depleted+monocytes
****p<0.0001 Mann
Whitney test
Fig 7D CCR2-depleted untreated vs
treatment groups
*p=0.030
***p0.001 Kruskal-Wallis
test for multiple comparisons
Fig 7E CCR2-depleted untreated vs
treatment groups
*p=0.030
***p=0.001 Kruskal-Wallis
test for multiple comparisons
Fig S3A-S3C Knockout mice versus WT ***p<0.001
*P=0.013 Kruskal-Wallis test
for multiple comparisons
Fig S3E Knockout mice versus WT **p=0.0011 Kruskal-Wallis
test for multiple comparisons
Fig S7A-S7B CCR2-depleted vs CCR22-
depleted+monocytes
***p=0.0001 Kruskal-Wallis
test for multiple comparisons