Embed Size (px)
Citation preview

1
Supplementary Information
Table of Contents
Materials
General Characterization and Instrumentation
Experimental Methods
Supplementary Figures and Tables
References
Electronic Supplementary Material (ESI) for Nanoscale.This journal is © The Royal Society of Chemistry 2015

2
Materials:
Materials: (3-Aminopropyl)triethoxysilane, Pluronic P123 and Tetraethylorthosilicate were purchased
from Sigma-Aldrich and used without further purification. HCl (37 %) was purchased from Merck. 1-
Bromodecane and 4-Hydroxybenzaldehyde were procured from Alfa Aesar. All the solvents were
purchased from Spectrochem and distilled under argon and subsequently stored over molecular sieves
for 24 h before use.
Characterization and Instrumentation:
Characterization: N2 sorption analyses were performed at 77 K on Autosorb-iQ2 (Quantachrome corp.).
Prior to analysis the synthesized samples were degassed at 363 K under vacuum for 12 h. Ultrahigh pure
nitrogen (99.9995%) was used for above measurements. Powder XRD patterns were recorded with
Bruker - D8 diffractometer having copper anode generating X-ray having wavelength of 1.54 Å (30 mA,
40 kV). Thermogravimetric analysis (TGA) were performed using Mettler Toledo 850 in the temperature
range of 30 0C - 900 0C under nitrogen atmosphere with a ramp rate of 10 oC /min. FE-SEM (Field
emission scanning electron microscopy) images were obtained using Nova-Nano SEM-600 (FEI,
Netherlands). TEM (Transmission electron microscopy) images of the samples were acquired on JEOL
JEM-3010 electron microscope. Bruker IFS 66v/S spectrometer was used for recording Fourier transform
infrared spectroscopy (FTIR) spectra. UV-Vis spectra were recorded using a Perkin Elmer Lambda 900
UV-Vis-NIR spectrometer. Water sorption analysis was performed on Belsorp Aqua 3 at 298 K.
Percentage of gold loading was determined through inductively coupled plasma optical emission
spectroscopy (ICP-OES) using Perkin-Elmer Optima 7000 DV instrument.
3
Experimental Methods:
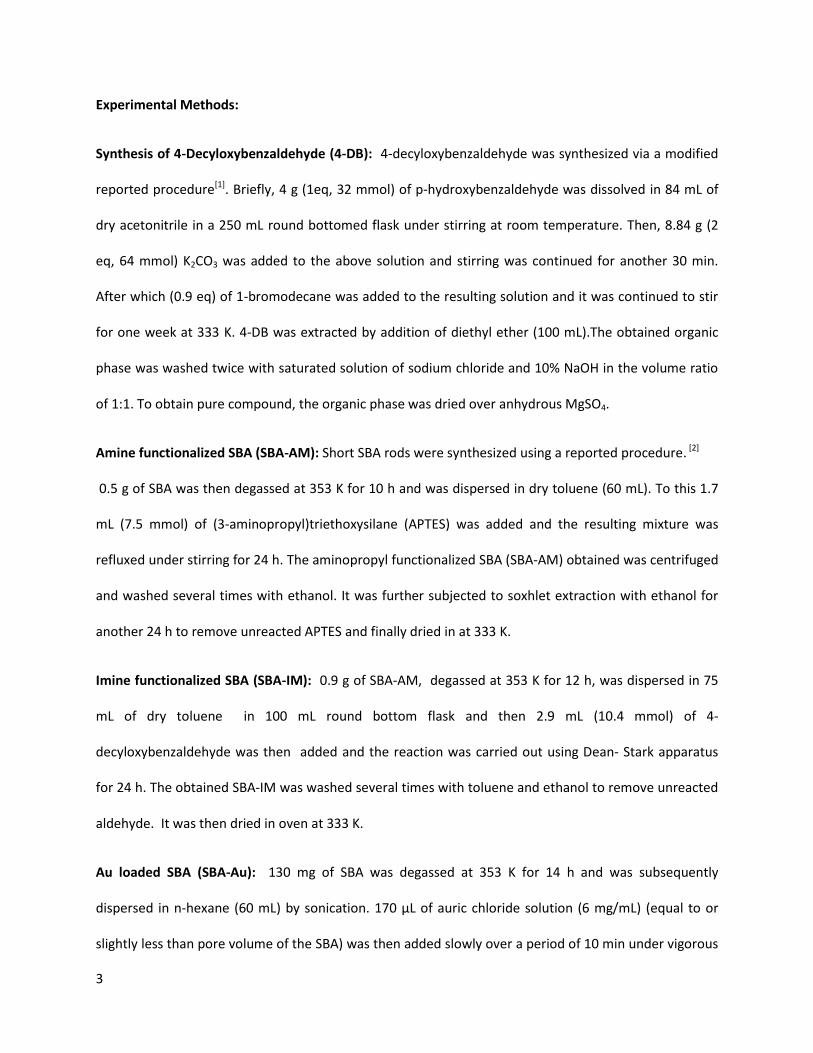
Synthesis of 4-Decyloxybenzaldehyde (4-DB): 4-decyloxybenzaldehyde was synthesized via a modified
reported procedure[1]. Briefly, 4 g (1eq, 32 mmol) of p-hydroxybenzaldehyde was dissolved in 84 mL of
dry acetonitrile in a 250 mL round bottomed flask under stirring at room temperature. Then, 8.84 g (2
eq, 64 mmol) K2CO3 was added to the above solution and stirring was continued for another 30 min.
After which (0.9 eq) of 1-bromodecane was added to the resulting solution and it was continued to stir
for one week at 333 K. 4-DB was extracted by addition of diethyl ether (100 mL).The obtained organic
phase was washed twice with saturated solution of sodium chloride and 10% NaOH in the volume ratio
of 1:1. To obtain pure compound, the organic phase was dried over anhydrous MgSO4.
Amine functionalized SBA (SBA-AM): Short SBA rods were synthesized using a reported procedure. [2]
0.5 g of SBA was then degassed at 353 K for 10 h and was dispersed in dry toluene (60 mL). To this 1.7
mL (7.5 mmol) of (3-aminopropyl)triethoxysilane (APTES) was added and the resulting mixture was
refluxed under stirring for 24 h. The aminopropyl functionalized SBA (SBA-AM) obtained was centrifuged
and washed several times with ethanol. It was further subjected to soxhlet extraction with ethanol for
another 24 h to remove unreacted APTES and finally dried in at 333 K.
Imine functionalized SBA (SBA-IM): 0.9 g of SBA-AM, degassed at 353 K for 12 h, was dispersed in 75
mL of dry toluene in 100 mL round bottom flask and then 2.9 mL (10.4 mmol) of 4-
decyloxybenzaldehyde was then added and the reaction was carried out using Dean- Stark apparatus
for 24 h. The obtained SBA-IM was washed several times with toluene and ethanol to remove unreacted
aldehyde. It was then dried in oven at 333 K.
Au loaded SBA (SBA-Au): 130 mg of SBA was degassed at 353 K for 14 h and was subsequently
dispersed in n-hexane (60 mL) by sonication. 170 µL of auric chloride solution (6 mg/mL) (equal to or
slightly less than pore volume of the SBA) was then added slowly over a period of 10 min under vigorous

4
stirring which was continued for another 30 h. The metal salt impregnated SBA was collected by
centrifugation and water was removed by drying in oven for 12 h at 333 K and in vacuum for 30 h at
room temperature. To 75 mg of above metal salt impregnated SBA, 2 mL of 0.1 M NaBH4 solution was
added, briefly sonicated for 20 sec and centrifuged. The gold nanoparticle loaded SBA (SBA-Au) was
washed several times with copious amount of water and dried in oven overnight at 333 K.
Amine and Imine functionalized SBA-Au: Synthetic strategy was similar to the synthesis of SBA-AM and
SBA-IM except for the fact that starting material was SBA-Au instead of SBA.
Reversibility experiments: 60 mg of SBA-IM (synthesized via Dean-Stark strategy) was dispersed in 5 mL
water-ethanol mixture (6:5 v/v) at pH 8 and stirred at room temperature for 16 h. After which, the
resulting material, SBA-IM-R1, was separated by centrifuging and supernatant was also collected. The
pH of the collected supernatant was adjusted back to 3 using 0.1 M HCl solution (Care was taken to
maintain the water-ethanol ratio) and SBA-IM-R1 was redispersed in it. This dispersion was stirred for 16
h to obtain SBA-AM-R1 which was isolated by centrifugation. The pH of the collected supernatant was
sequentially changed to 8 and 3 maintaining the water-ethanol ratio to obtain SBA-IM-R2 and SBA-AM-
R2, respectively.
5
Supplementary figures:
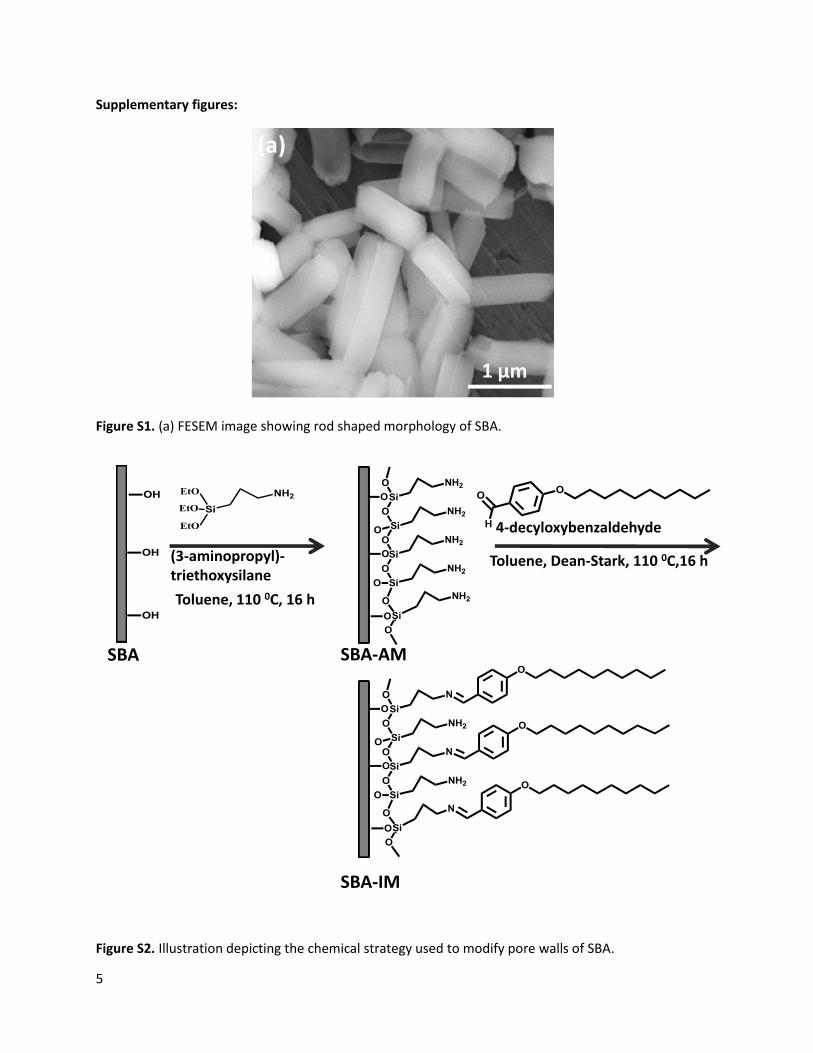
Figure S1. (a) FESEM image showing rod shaped morphology of SBA.
Figure S2. Illustration depicting the chemical strategy used to modify pore walls of SBA.
Toluene, 110 0C, 16 h
Toluene, Dean-Stark, 110 0C,16 h(3-aminopropyl)-triethoxysilane
4-decyloxybenzaldehyde
SBA-IM
SBA-AMSBA
6
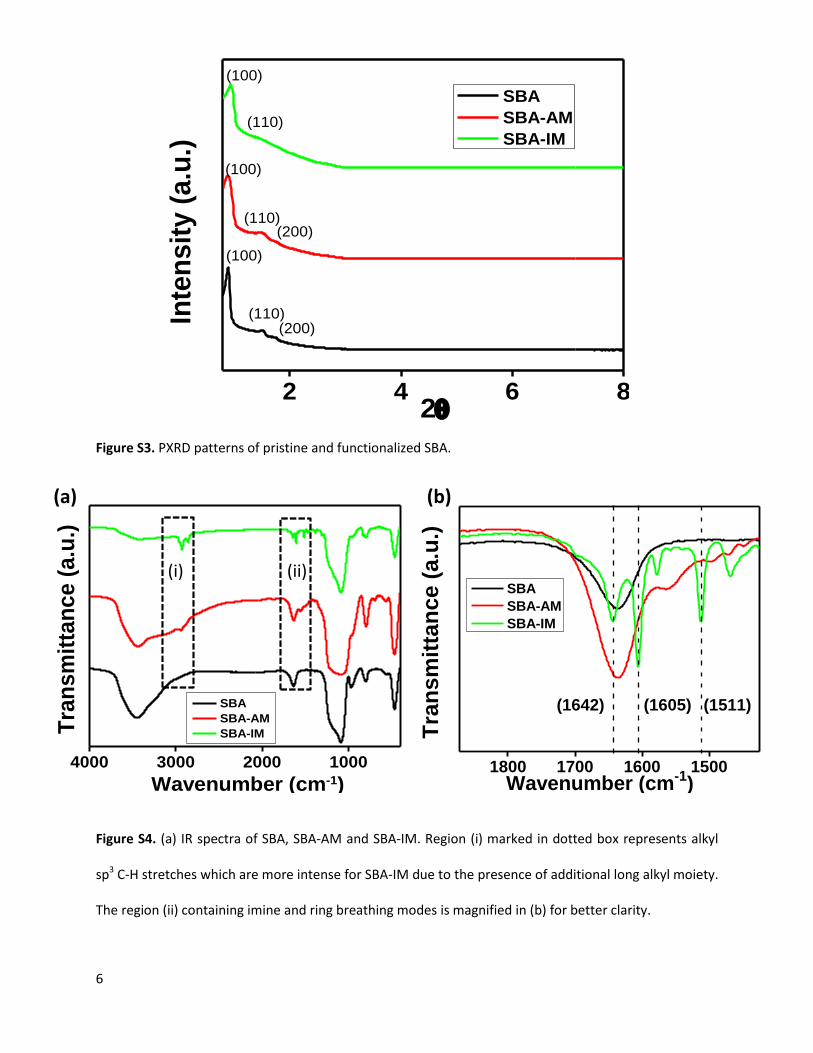
Figure S3. PXRD patterns of pristine and functionalized SBA.
Figure S4. (a) IR spectra of SBA, SBA-AM and SBA-IM. Region (i) marked in dotted box represents alkyl
sp3 C-H stretches which are more intense for SBA-IM due to the presence of additional long alkyl moiety.
The region (ii) containing imine and ring breathing modes is magnified in (b) for better clarity.
2 4 6 8
(110)
(100)
(200)
(110)
(100)
(200)
(110)
Inte
ns
ity
(a
.u.)
2
SBA
SBA-AM
SBA-IM
(100)
1800 1700 1600 1500
(1511)(1605)
Tra
ns
mit
tan
ce
(a
.u.)
Wavenumber (cm-1)
SBA
SBA-AM
SBA-IM
(1642)
4000 3000 2000 1000
SBA
SBA-AM
SBA-IM
Wavenumber (cm-1)
Tra
nsm
itta
nce (
a.u
.)
(i) (ii)
(a) (b)

7
Figure S5. TGA curves for the pristine and functionalized SBA.
Figure S6. (a) FESEM image of SBA-IM indicating retention of morphological ordering on attachment of
4-decyloxybenzaldehyde to the pore walls through imine linkages.
200 400 600 80060
70
80
90
100
% W
eig
ht
Temperature ( oC)
SBA
SBA-AM
SBA-IM

8
Figure S7. Schematic illustrating reversible formation and cleavage of imine bonds in response to
changes in pH.
pH 8
pH 3
4-DB
4-DB
9
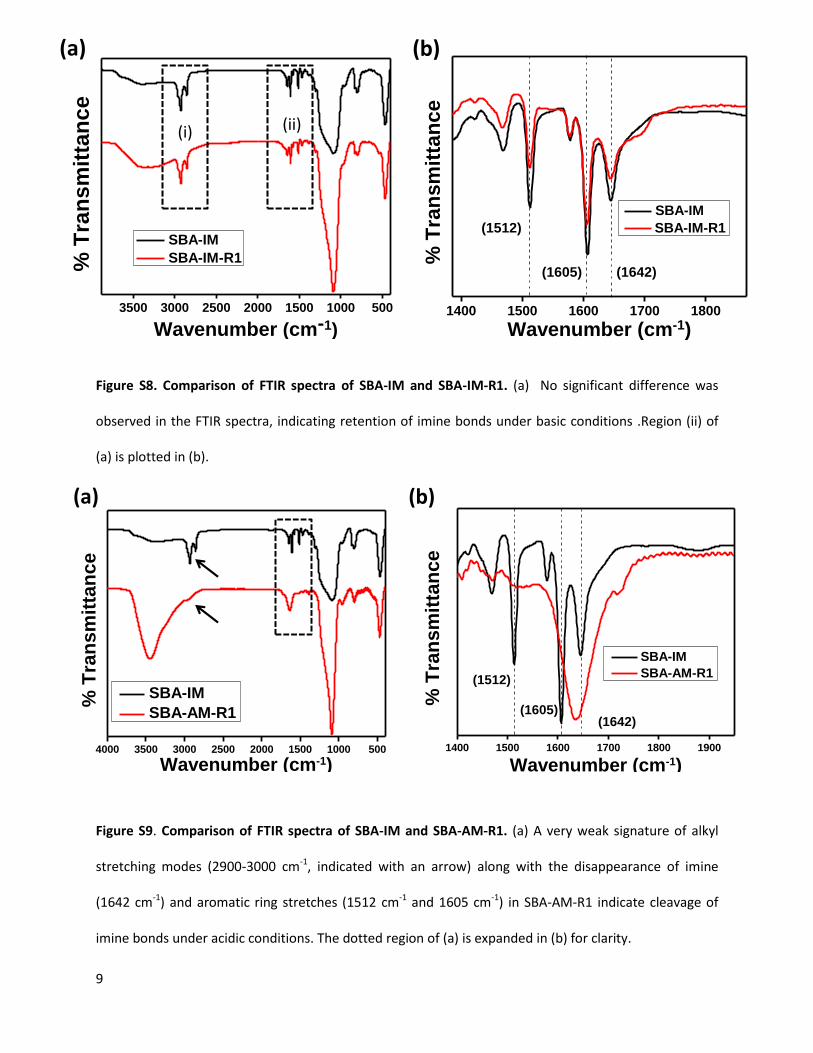
Figure S8. Comparison of FTIR spectra of SBA-IM and SBA-IM-R1. (a) No significant difference was
observed in the FTIR spectra, indicating retention of imine bonds under basic conditions .Region (ii) of
(a) is plotted in (b).
Figure S9. Comparison of FTIR spectra of SBA-IM and SBA-AM-R1. (a) A very weak signature of alkyl
stretching modes (2900-3000 cm-1, indicated with an arrow) along with the disappearance of imine
(1642 cm-1) and aromatic ring stretches (1512 cm-1 and 1605 cm-1) in SBA-AM-R1 indicate cleavage of
imine bonds under acidic conditions. The dotted region of (a) is expanded in (b) for clarity.
3500 3000 2500 2000 1500 1000 500
% T
ran
sm
itta
nc
e
Wavenumber (cm-1)
SBA-IM
SBA-IM-R1
(i) (ii)
1400 1500 1600 1700 1800
(1642)(1605)
% T
ran
sm
itta
nce
Wavenumber (cm-1)
SBA-IM
SBA-IM-R1(1512)
(a) (b)
4000 3500 3000 2500 2000 1500 1000 500
% T
ran
sm
itta
nc
e
Wavenumber (cm-1)
SBA-IM
SBA-AM-R1
1400 1500 1600 1700 1800 1900
(1512)
(1605)(1642)
% T
ran
sm
itta
nce
Wavenumber (cm-1)
SBA-IM
SBA-AM-R1
(a) (b)

10
Figure S10. Comparison of FTIR spectra of SBA-IM and SBA-IM-R2. (a) The reappearance of alkyl (2900-
3000 cm-1, indicated with an arrow) and imine (1642 cm-1) stretching bands for SBA-IM-R2 indicate
formation of imine bonds under basic conditions. The dotted region of (a) is expanded in (b) for clarity.
(Note: The broadening at 1642 cm-1 is due to the presence of some unreacted amines.)
Figure S11. Comparison of IR spectra of SBA-IM and SBA-AM-R2. (a) Absence of alkyl stretching modes
(2900-3000 cm-1, indicated with an arrow) along with absence of imine stretches (1642 cm-1) in SBA-AM-
R2 indicates cleavage of imine bonds under acidic conditions. The imine active region indicated by
dotted box in (a) is plotted in (b) for clarity.
4000 3500 3000 2500 2000 1500 1000 500
% T
ran
sm
itta
nc
e
Wavenumber (cm-1)
SBA-IM
SBA-IM-R2
1400 1500 1600 1700 1800 1900 2000
(1605)
(1642)(1512)% T
ran
sm
itta
nce
Wavenumber (cm-1)
SBA-IM
SBA-IM-R2
(a) (b)
4000 3500 3000 2500 2000 1500 1000 500
Wavenumber (cm-1)
% T
ran
sm
itta
nce
SBA-IM
SBA-AM-R2
1400 1500 1600 1700 1800 1900
(1512)
(1605)
(1642)
Wavenumber (cm-1)
%
Tra
nsm
itta
nce
SBA-IM
SBA-AM-R2
(a) (b)
11
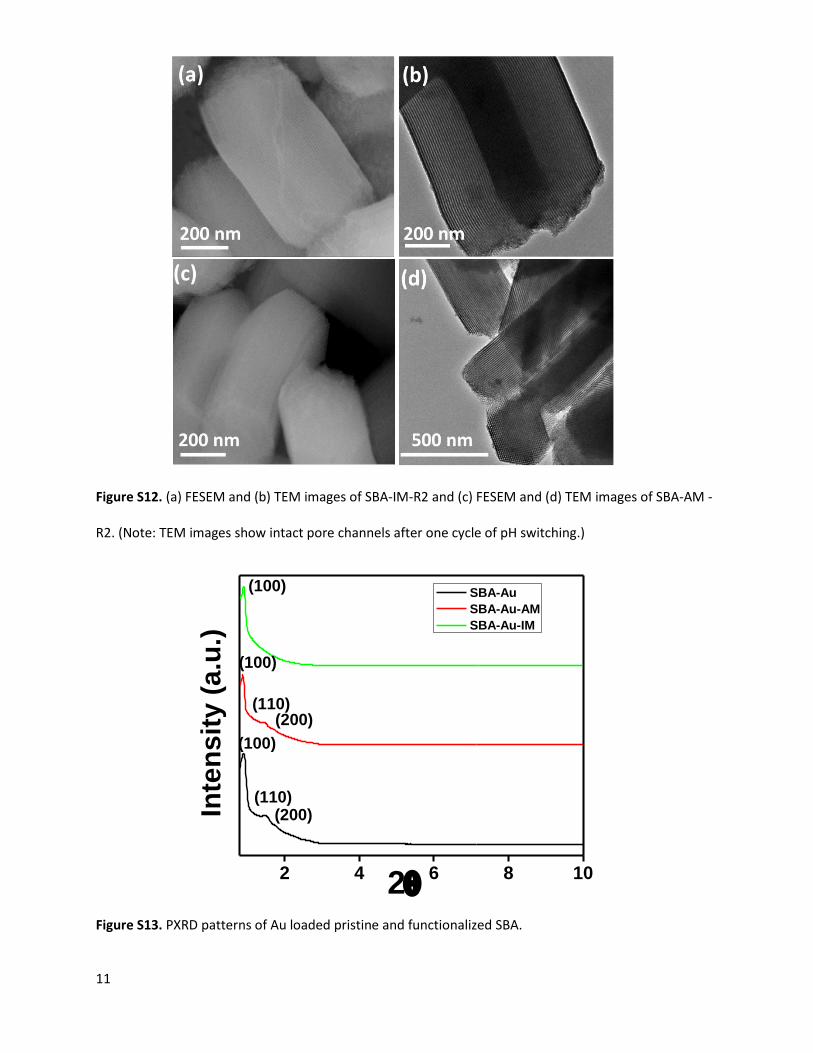
Figure S12. (a) FESEM and (b) TEM images of SBA-IM-R2 and (c) FESEM and (d) TEM images of SBA-AM -
R2. (Note: TEM images show intact pore channels after one cycle of pH switching.)
Figure S13. PXRD patterns of Au loaded pristine and functionalized SBA.
2 4 6 8 10
(100)
(200)(110)
(100)
(200)(110)
Inte
ns
ity
(a
.u.)
2
SBA-Au
SBA-Au-AM
SBA-Au-IM
(100)
12
.
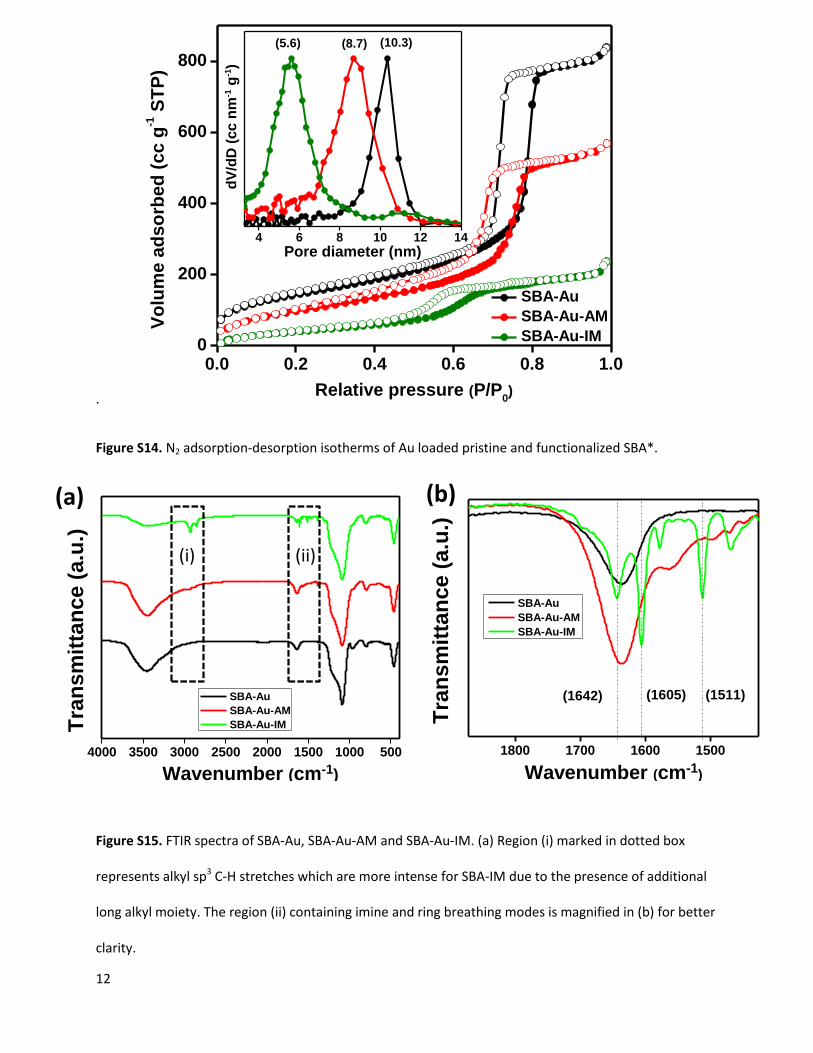
Figure S14. N2 adsorption-desorption isotherms of Au loaded pristine and functionalized SBA*.
Figure S15. FTIR spectra of SBA-Au, SBA-Au-AM and SBA-Au-IM. (a) Region (i) marked in dotted box
represents alkyl sp3 C-H stretches which are more intense for SBA-IM due to the presence of additional
long alkyl moiety. The region (ii) containing imine and ring breathing modes is magnified in (b) for better
clarity.
4000 3500 3000 2500 2000 1500 1000 500
Tra
nsm
itta
nc
e (
a.u
.)
Wavenumber (cm-1)
SBA-Au
SBA-Au-AM
SBA-Au-IM
1800 1700 1600 1500
(1511)(1605)
Tra
ns
mit
tan
ce
(a
.u.)
Wavenumber (cm-1)
SBA-Au
SBA-Au-AM
SBA-Au-IM
(1642)
(i) (ii)
(b)(a)
0.0 0.2 0.4 0.6 0.8 1.00
200
400
600
800
4 6 8 10 12 14
Vo
lum
e a
ds
orb
ed
(c
c g
-1 S
TP
)
Relative pressure (P/P0)
SBA-Au
SBA-Au-AM
SBA-Au-IM
(8.7) (10.3)(5.6)
dV
/dD
(cc n
m-1 g
-1)
Pore diameter (nm)
13
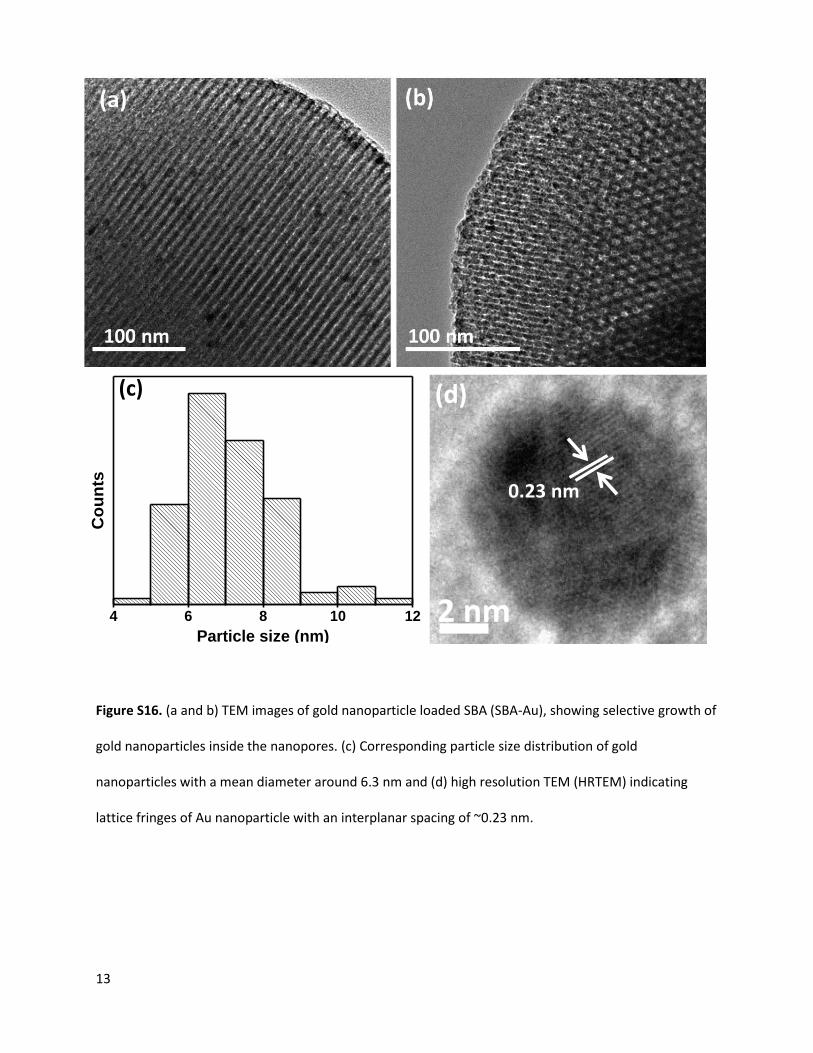
Figure S16. (a and b) TEM images of gold nanoparticle loaded SBA (SBA-Au), showing selective growth of
gold nanoparticles inside the nanopores. (c) Corresponding particle size distribution of gold
nanoparticles with a mean diameter around 6.3 nm and (d) high resolution TEM (HRTEM) indicating
lattice fringes of Au nanoparticle with an interplanar spacing of ~0.23 nm.
2 nm
0.23 nm
4 6 8 10 12
Co
un
ts
Particle size (nm)
(c) (d)

14
Figure S17. Catalysis in water-ethanol mixture. Schematic showing the preferential wetting of the pores
of (a) SBA-Au-AM and (c) SBA-Au-IM with ethanol, inhibiting the catalytic reduction. UV-Vis spectra
indicating the absence of catalytic activity in the case of (b) SBA-Au-AM and (d) SBA-Au-IM.
200 300 400 500
0.4
0.8
1.2
1.6
Ab
so
rba
nc
e
Wavelength (nm)
0 min
30 min
SBA-Au-AM
Water-Ethanol
200 300 400 5000.0
0.4
0.8
1.2
Ab
so
rba
nc
e
Wavelength (nm)
0 min
30 min
SBA-Au-IM
Water-Ethanol
p-NP and NaBH4
water p-NP inethanol
(a)
(b) (d)
(c)
p-NP and NaBH4
water p-NP inethanol

15
Figure S18. SBA-Au assisted reduction of p-Nitrophenol in (a) water, (b) water-ethanol mixture and (c)
ethanol.
200 300 400 5000.0
0.5
1.0
1.5
2.0
(Ethanol)
Ab
so
rba
nc
e
Wavelength (nm)
0 min
24 min
(c)
300 400 5000.2
0.4
0.6
0.8
1.0
1.2
1.4
1.6
Ab
so
rba
nc
e
Wavelength (nm)
0 min
28 min
( 1:1 water-ethanol)
200 300 400 5000.2
0.4
0.6
0.8
1.0
1.2
1.4
1.6
Ab
so
rba
nc
e
Wavelength (nm)
0 min
12 min
( Water)(a) (b)

16
Figure S19. Au nanoparticle assisted reduction of p-Nitrophenol in (a) water, (b) water-ethanol mixture
and (c) ethanol.
300 400 5000.0
0.2
0.4
0.6
0.8
1.0
1.2
1.4A
bs
orb
an
ce
Wavelength (nm)
0 min
14 min
(Water)
300 400 5000.0
0.2
0.4
0.6
0.8
1.0
1.2
1.4
Ab
so
rba
nc
e
Wavelength (nm)
0 min
10 min
(Ethanol)
200 300 400 5000.0
0.2
0.4
0.6
0.8
1.0
1.2
1.4
1.6
Ab
so
rba
nc
e
Wavelength (nm)
0 min
32 min
(1:1 water-ethanol)(a)
(c)
(b)

17
Table S1. Elemental analysis data of pristine and functionalized SBA.
Table S2. Textural parameters of the various materials synthesized.
SAMPLE Carbon Nitrogen Hydrogen
SBA 2.41 0.00 1.16
SBA-AM 7.16 2.25 1.71
SBA-IM 24.84 2.07 3.58

18
Table S3. Textural parameters of the various Au loaded SBA materials synthesized.
(* Different batch of SBA was used for Au loading)
References:
[1] A. Gamliel, M. Afri, A. A. Frimer, Free Radical Biol. Med. 2008, 44, 1394-1405.
[2] A. Sayari, B.H. Han, Y. Yang, J. Am. Chem. Soc. 2004, 126, 14348-14349.
*