Embed Size (px)
Citation preview

1
Matrix-free synthesis of spin crossover micro-rods showing large hysteresis loop
centered at room temperature
Haonan Peng, Gábor Molnár, Lionel Salmon,* Azzedine Bousseksou*
Laboratoire de Chimie de Coordination, CNRS UPR-8241 and Université de Toulouse ; UPS,
INP ; F-31077 Toulouse, France
I- Experimental section
II- Electron microscopy
III- Powder X-ray diffraction
IV- Infrared spectroscopy
V- TGA analysis
VI- Magnetism measurements
VII- Reflectivity measurements
VIII- DSC measurements
IX- 57Fe Mössbauer Measurements
X- UV Spectroscopy
Electronic Supplementary Material (ESI) for ChemComm.This journal is © The Royal Society of Chemistry 2015

2
I- Experimental section
Materials:
All solvents and reagents were purchased from Sigma Aldrich and used without further
purification.
Synthetic procedure: Samples 1 was prepared by rapidly mixing in a small glass tube (5 mL)
two acidic aqueous solutions (3 wt% CF3SO3H) containing Fe(CF3SO3)2 (236 mg; 0.33 mol/l)
and the 1,2,4-triazole ligand (130 mg; 0.94 mol/l), respectively. The resulting 2 ml limpid
solution was let for very slow evaporation at room temperature; the flask being half covered.
Following ca. 2 months, the precipitate were centrifuged, and washed by 10 ml of distilled
water and 30 ml of absolute ethanol and finally dried under vacuum. Yield: 300 mg (ca.
80%). Sample 2 was prepared as sample 1 but in absence of CF3SO3H. Yield: 54 mg (ca.
20%). Elemental analysis: calculated for sample 1 [Fe(Htrz)3](CF3SO3)2·1.2H2O: C 16.47 %,
H 1.95 %, N 21.61 %; measured: C 16.41 %, H 1.60 %, N 22.30 %. Elemental analysis:
calculated for sample 2 [Fe(Htrz)2(trz)](CF3SO3): C 20.43 %, H 1.95 %, N 30.65 %;
measured: C 19.03 %, H 1.41 %, N 28.07 %.
Size and physical measurements
Particle sizes were determined by transmission electron microscopy (TEM) using a JEOL
JEM-1011 (100 kV) and by scanning electron microscopy using a JEOL FEG JSM 6700F.
High-resolution imaging was performed on a JEOL JSM 2100F (200 kV) equipped also with
a SDD Bruker EDX detector (resolution: 127 eV) for elemental analysis. TEM samples were
prepared by placing on a carbon coated copper grid a drop (10 µl) of the particles suspended
in ethanol.

3
FTIR spectra were recorded at room temperature with a Perkin Elmer Spectrum 100
spectrometer in ATR mode (resolution ca. 1 cm-1) between 650 cm-1 and 4000 cm-1. Variable
temperature Raman spectra were acquired using a LabramHR (Horiba) Raman
microspectrometer (resolution ca. 3 cm-1) in conjunction with a Linkam THMS600 cryostage.
The 632.8 nm line of a HeNe laser (0.1 mW) was focused on the sample by a ×50 objective
(numerical aperture = 0.5), which was also used to collect the scattered photons. Magnetic
susceptibility data were collected with a Quantum Design MPMS-XL SQUID magnetometer
at heating and cooling rates of 2 K∙min-1 at a magnetic field of 1 kOe. Optical reflectivity
(λ=550 nm) measurements were performed at 4 K∙min-1. Zero-field 57Fe Mössbauer spectra
were recorded using a flow-type liquid nitrogen cryostat and a conventional constant
acceleration type Mössbauer spectrometer. γ-rays were provided by a 57Co(Rh) source (ca. 20
mCi). The samples (~30 mg) were enclosed in a plexiglass sample holder with an optimized
diameter. The spectrum evaluations were done with the assumption of Lorentzian line shapes
using the Recoil software. The PXRD patterns of the samples have been recorded at room
temperature using a Panalytical MPD XPertPro powder diffractometer [CuKα1, Ge (111)
monochromator, X’Celerator detector] within the range 5 - 80° (2θ) by using a scan speed of
30° per hour. UV spectroscopy was recorded using UV/Vis spectrophotometer equipped with
a Labsphere RSA-PE-20 integrating sphere.

4
II- Electron Microscopy
Transmission Electronic Microscopy (TEM), Scanning Electronic Microscopy (SEM), High
Resolution Transmission Electronic Microscopy (HRTEM), High Resolution Scanning
Transmission Electronic Microscopy (HRSTEM) and Energy Dispersive X-ray spectroscopy
(EDX) analyses of micro-rods
Figure S1: TEM images for sample 1

5
Figure S2: SEM images of sample 1
The following two SEM pictures were realized without any additional conductive film

6
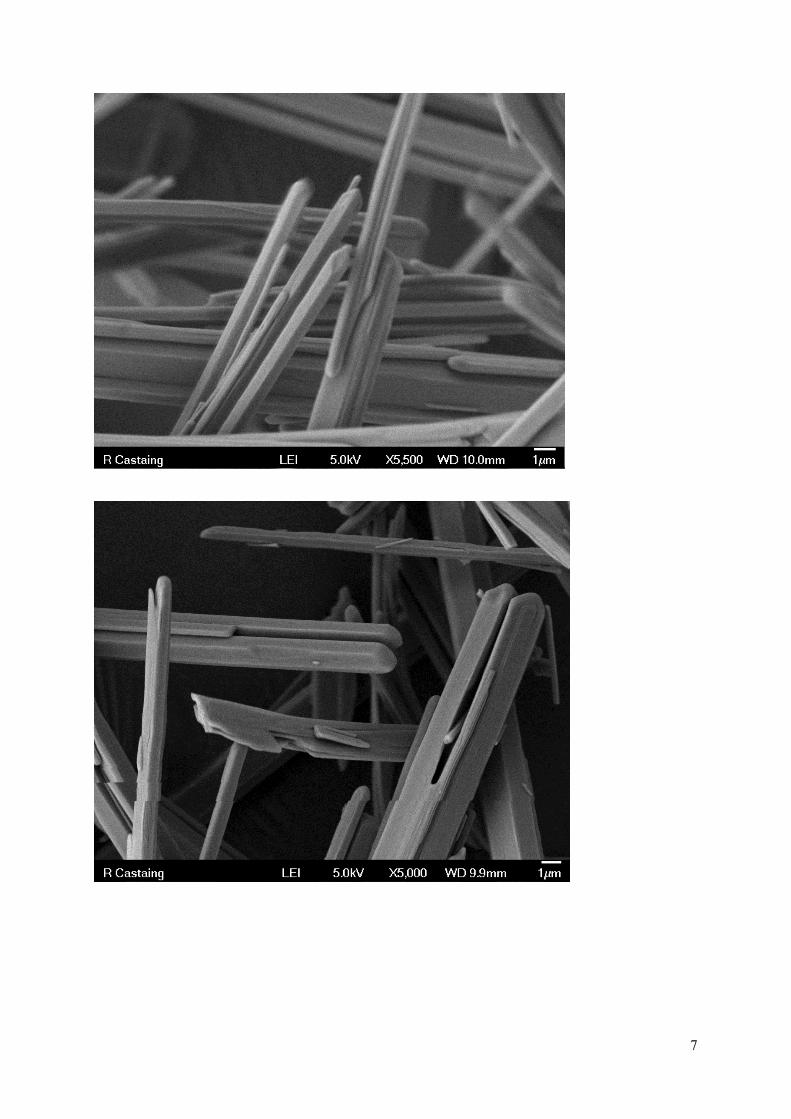
The following four SEM pictures were realized with an additional conductive Platinum film
7

8
Figure S3: HRTEM and EDX analyses of sample 1
0 2 4 6 8 10 12keV
0
1
2
3
4
5
6
7
8
9
cps/eV
C O
F S Fe
Fe
Fe Cu
Cu
Cu N
HP139A 1 PHOTO7

9
III- Powder X-ray diffraction
Figure S4: X-ray powder diffraction patterns of sample 1 and 2 at room temperature (HS
state)
X-ray diffraction allows also for the estimation of the crystallite size using the Scherrer equation. The crystallite size (D) can be calculated using the equation D = k/ cos, where k is the shape factor, the wavelength of the incident irradiation, is the full-width at half maximum (FWHM) of the peak and is the Bragg angle. In the Scherrer equation, the parameter needs to be corrected to eliminate the instrumental effects; in our case this correction was achieved measuring a LaB6 reference sample. The average crystallite size for both samples was measured at about 80 nm
Reference: Scherrer, P. Göttinger Nachrichten Math. Phys. 2, 98–100 (1918).
10
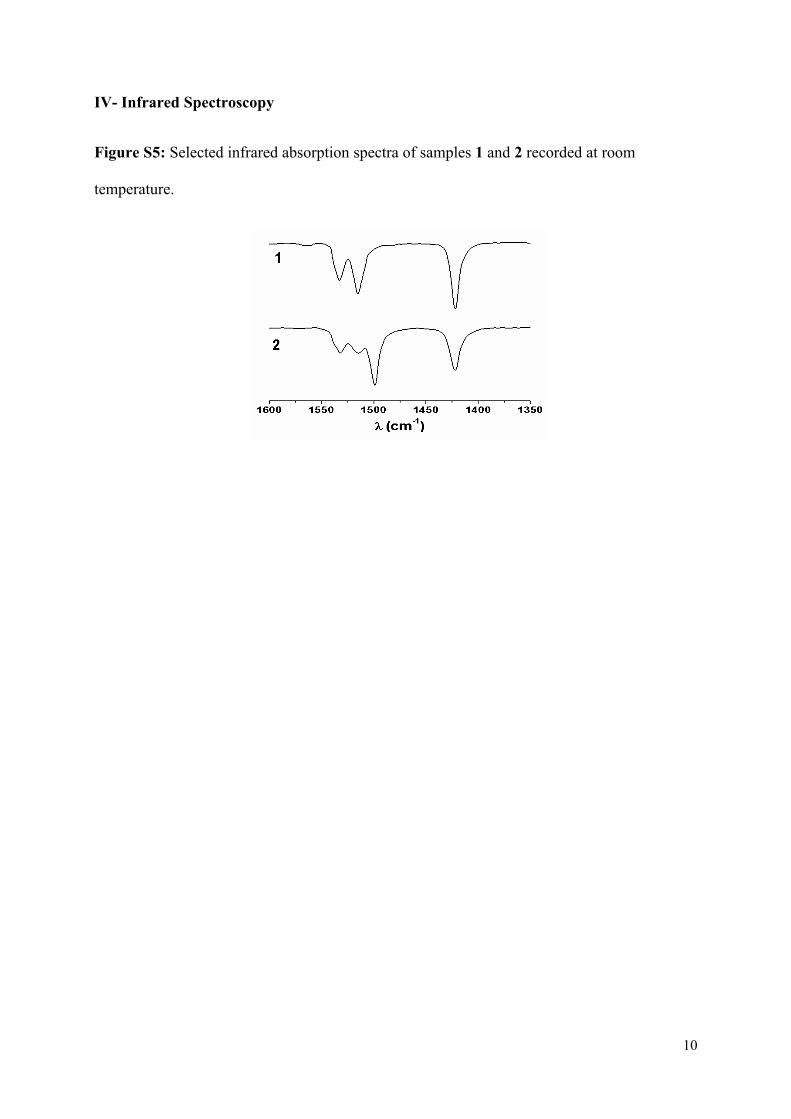
IV- Infrared Spectroscopy
Figure S5: Selected infrared absorption spectra of samples 1 and 2 recorded at room
temperature.

11
V- TGA analyses
Figure S6: TGA analysis of sample 1 and 2
The weight loss is 4.1% (1.2.H2O) for the first step and 13, 28 and 37% for the following steps (decomposition of the compound).
1
2

12
VI- Magnetic measurements
Figure S7: Magnetic measurements for sample 1 (hydrated sample in black and dehydrated
sample in red).
-H2O

13
Figure S8: Magnetic measurements for sample 2 (λ=550 nm, two consecutive thermal
cycles).

14
VII- Reflectivity measurements
Figure S9: Optical reflectivity measurements of sample 1 (λ=550 nm). Hydrated sample
(left), dehydrated sample (right) and the corresponding normalized measurements (the two
consecutive cycles were not measured at the same position).

15
Figure S10: Optical reflectivity measurements for testing the hysteresis reproducibility of
sample 1 (λ=550 nm, in black cycle 1 and in red cycle 10).
Figure S11: Optical reflectivity measurements of sample 2 (λ=550 nm).

16
VIII- DSC measurements
Figure S12: DSC measurements of the hydrated sample 1 on heating/cooling modes
Figure S13: DSC measurements of the dehydrated sample 1 on the heating/cooling modes
Calculation for the dehydrated sample
Area = 17.05 J/g
ΔH = 9.5 KJ/mol (with M = 563 g/mol)
ΔS = ΔH/T1/2 = 32 J/mol·K (with T1/2 = 290 K)
The residual HS fraction at low temperature is ca. 30%, so the estimated ΔH and ΔS
associated with the complete SCO are 12 KJ/mol and 43 J/mol·K, respectively.

17
IX- 57Fe Mössbauer measurements
Figure S14: Variable temperature Mössbauer measurements of the dehydrated sample 1

18
Table of the Mössbauer hyperfine parameters (δ = isomeric shift, EQ = quadrupole splitting,
/2 = half width at half maximum)
HS state LS state HS fraction
Sample 1
δ EQ /2 δ EQ /2
300 K 1.05(80) 2.68(16) 0.11(12) 100%
240 K 1.09(13) 2.83(25) 0.20(21) 0.46(35) 0.23(63) 0.14(58) 29%
80 K 1.17(16) 3.23(32) 0.20(27) 0.50(59) 0.22(13) 0.17(11) 30%

19
X- UV Spectroscopy
Figure S15: Reflectance UV spectroscopy of the dehydrated sample 1 at 300 K following
cooling (red curve) and heating (black curve) process.
Both measurements in the LS and HS states were performed at room temperature (within the
hysteresis loop). The sample was heated or cooled out of the UV-Visible setup using an oven
or liquid nitrogen.