Embed Size (px)
Citation preview
S1
Supplemental Materials
Regional variations of bovine and porcine fecal pollution as a function of landscape, nutrient, and hydrological factors
Authors: Jean Pierre Nshimyimana1, 3, *, Sherry L. Martin2, Matthew Flood1, Marc P. Verhougstraete4, David W. Hyndman2, and Joan B. Rose1
1Department of Fisheries and Wildlife, College of Agriculture and Natural Resources, Michigan State University, 220 Trowbridge Rd, East Lansing, MI 48824 2Department of Earth and Environmental Sciences, College of Natural Science, Michigan State University, 220 Trowbridge Rd, East Lansing, MI 48824 3Alfred P. Sloan Foundation, 630 Fifth Avenue Suite 2200 New York, NY, 10111 4 Department of Community, Environment and Policy, Mel and Enid Zuckerman College of Public Health, University of Arizona, Drachman Hall A231, Tucson, AZ 85724
*Corresponding author: [email protected]
S2
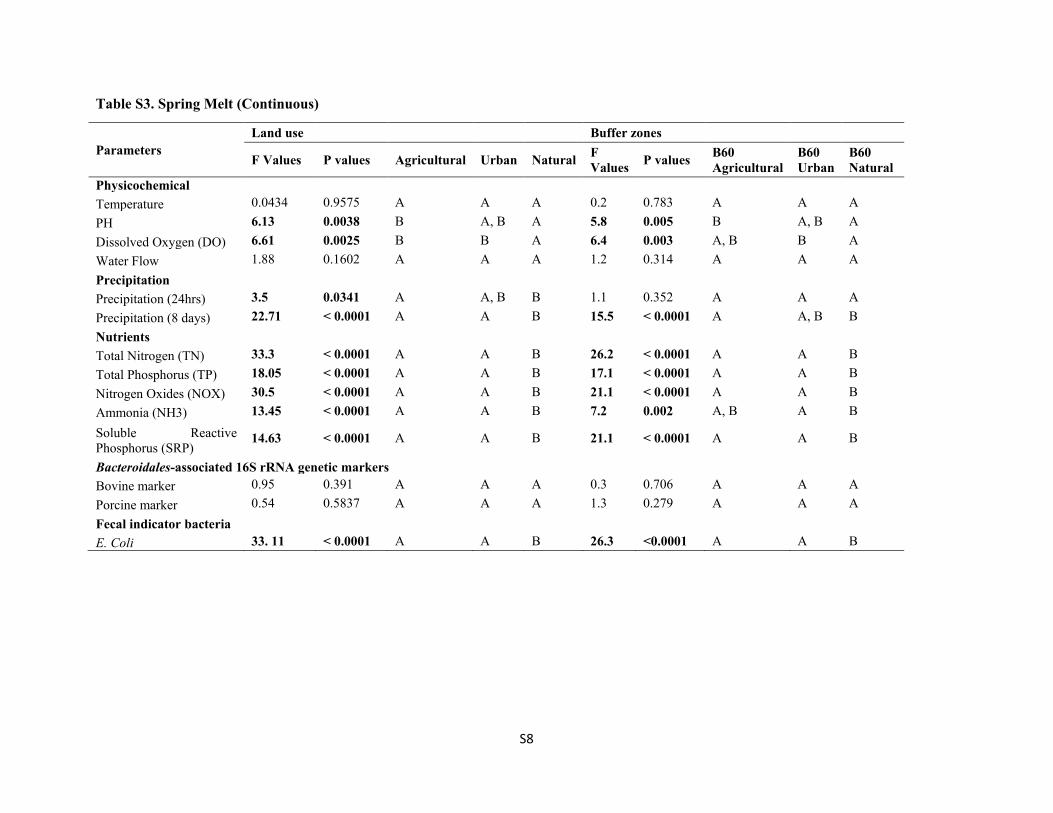
List of supplemental materials SS1. Section 1: Methodology SS2. Section 2: Results Table S1. Primers and probes of Bacteroidales-associated markers used in this study Table S2: Correlations between of log-transformed bovine marker and porcine marker abundance in Copies 100mL-1. Bold characters in the table indicate significant correlations between markers Table S3: Variation of physicochemical, parameters, precipitation, nutrients, genetic markers and fecal indicator bacteria with land use and buffer zones during base flow, spring melt & summer rain. Land-use groups were differentiated by ANOVA and the post hoc Tukey’s honestly significant difference (HSD) test (α < 005) are designated by distinct letters. Bold character shows strong relationships. Table S4. Correlation between bovine and porcine markers with nutrients and environmental Factors under agricultural, forested and all land use categories during baseflow, spring melt and summer rain. Figure S1. Map showing detection of bovine marker (A, B and C) and porcine marker (D, E and F) across sampled watersheds and seasons: base flow (A and D), spring melt (B and E), and summer rain (C and F). Color indicates result: not sampled (grey), detected (red) and non-detect (blue). Figure S2. Hierarchical clustering of bovine and porcine markers, nutrients (total nitrogen, total phosphorus, nitrate-nitrite, soluble reactive phosphorus, and ammonium), dissolved oxygen (DO), temperature, precipitation, pH, and streamflow during baseflow (A), spring melt (B) and summer rain (C). Colors in left-hand column denote dominant land use/cover: agricultural (brown), urban (pink) and combined forest and wetland land use/cover as natural (green). Branch lengths correspond to distances calculated by Ward’s method. Dendrogram calculated in JMP Pro v.13. Temp: Temperature, Sflo: Streamflow, NH3: Ammonia ((mg L-1), P1d: Precipitation 1 day before sampling (mm), P8d: Precipitation 8 days before sampling (mm), DO: Dissolved Oxygen, Bov: Bovine marker (Copies 100mL-1), Porc: Porcine marker (Copies 100mL-1), TN: Total nitrogen (mg L-1), TP: Total phosphorus (mg L-1), EC: E. coli (MPN 100mL-1), SRP: Soluble reactive phosphorus (mg L-1), NOx: Nitrogen oxides (mg L-1).

S3
1. Methodology section (SS1)
1.1 Digital Droplet PCR Each reaction mixture contained 11 μL of 2x ddPCR Supermix, 10 μM of each primer
(900nM), 10 μM of probe (250nM), 1 μL of PCR-grade H2O, and 5 μl of sample DNA. Table S1 summarizes the cow and pig primers and probe sequences. The reaction mixture was then combined using microfluidics with droplet generation oil, where 20 µL reaction mix per sample was loaded in parallel wells with 70 µL generation oil in a DG8 cartridge and run using the Droplet Generator with droplets transferred to a 96-well PCR plate, heat-sealed using a foil plate seal (Bio-Rad, Hercules, California, USA), and then placed in a Bio-Rad iCycler® (Bio-Rad, Hercules, California, USA) Thermocycler for PCR amplification. After PCR amplification, the plate was transferred to the Bio-Rad Droplet Reader for concentration reading and QuantaSoft software was used for data extraction.
2. Results section (SS2)
2.1 Physicochemical parameters
Physicochemical parameters (T, pH, DO) varied with seasons with lowest water temperature in the spring and the highest in summer. Water temperature ranged from 17.5 to 6.8 ºC in fall, 9.3 to 0 ºC in the spring, and 22.7 to 12.8 ºC in summer. As expected, water temperature varied strongly with seasons (F = 846, p < 0.0001). Water temperature also varied with land use and a subset of land covers during fall season (Land use: F = 4.5, p = 0.006; cropland: F = 6.5, p = 0.0006) but not during spring and summer. Measured pH ranged from: 8.3 to 7.2 in fall, 8.2 to 7.5 in spring, and 8.5 to 7.8 in summer. pH also varied with land uses / covers of drained watersheds in Spring (land use: F = 4.6, p = 0.005; land cover: F = 3.0, p = 0.039) and Summer (land use: F = 3.2, p = 0.028; cropland: F = 3.3, p = 0.025). pH also varied with riparian 60 m buffer zones in the spring (F = 4.0, p = 0.013) but not during BF or SR. Dissolved oxygen (DO) was measured for general assessment of biotic life status in rivers during the study period. Dissolved oxygen concentrations ranged from 1.5 to 0.8 log10 mg/L in fall, from 1.0 to 0.6 log10 mg/L in spring and from 1.2 to 0.2 log10 mg/L in summer. Dissolved Oxygen varied with seasons (F = 7.0, p = 0.0014), land use in the SM and SR (spring: F = 5.0, p = 0.0036 and SR: F = 4.0, p = 0.0132), and during the spring with cropland and riparian 60 m buffer zones (F = 4.5, p = 0.006 and F = 3.3, p = 0.0241 respectively).
2.2 Nutrients
Nutrient concentrations (log10 mgL-1) in the fall season ranged from: 3.7 to 1.9 of TN, 2.5 to 0.9 of TP, 3.7 to 0.0 of NOx, 2.4 to 0.0 of NH3, and 2.4 to 0.2 of SRP. Nutrient concentrations (log10 mgL-1) during Spring Melt ranged from: 3.8 to 2.4 of TN, 2.7 to 0.9 of TP, 3.8 to 0.4 of NOX, 2.5 to 0.2 of NH3, and 2.5 to 0.6 of SRP. During summer, nutrient concentrations (log10 mgL-1) ranged from: 3. to 2.1 of TN, 2.0 (Raisin River) to 1.0 (Big Sable River) of TP, 3.7 to 0.0 of NOX, from 2.8 to 0.0 of NH3, and from 1.5 to 0.41 of SRP.
Seasonal variations were associated with change in concentrations of nutrients associated with spring melt and rainfall effects (TN: F = 9.0, p = 0.002; TP: F = 40.0, p < 0.0001; NOX : F = 7.0, p = 0.0013; NH3: F = 26.5, p < 0.0001; and SRP: F = 6.4, p = 0.002). Land uses were associated with nutrient
S4
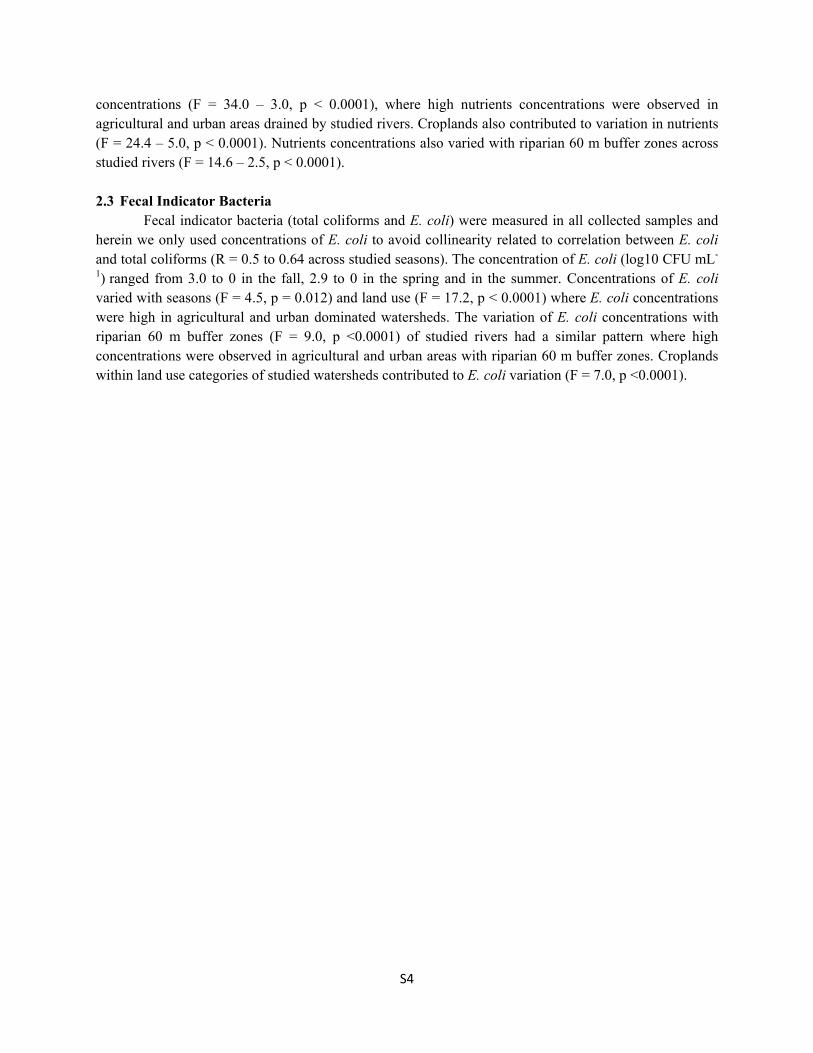
concentrations (F = 34.0 – 3.0, p < 0.0001), where high nutrients concentrations were observed in agricultural and urban areas drained by studied rivers. Croplands also contributed to variation in nutrients (F = 24.4 – 5.0, p < 0.0001). Nutrients concentrations also varied with riparian 60 m buffer zones across studied rivers (F = 14.6 – 2.5, p < 0.0001). 2.3 Fecal Indicator Bacteria
Fecal indicator bacteria (total coliforms and E. coli) were measured in all collected samples and herein we only used concentrations of E. coli to avoid collinearity related to correlation between E. coli and total coliforms (R = 0.5 to 0.64 across studied seasons). The concentration of E. coli (log10 CFU mL-
1) ranged from 3.0 to 0 in the fall, 2.9 to 0 in the spring and in the summer. Concentrations of E. coli varied with seasons (F = 4.5, p = 0.012) and land use (F = 17.2, p < 0.0001) where E. coli concentrations were high in agricultural and urban dominated watersheds. The variation of E. coli concentrations with riparian 60 m buffer zones (F = 9.0, p <0.0001) of studied rivers had a similar pattern where high concentrations were observed in agricultural and urban areas with riparian 60 m buffer zones. Croplands within land use categories of studied watersheds contributed to E. coli variation (F = 7.0, p <0.0001).
S5
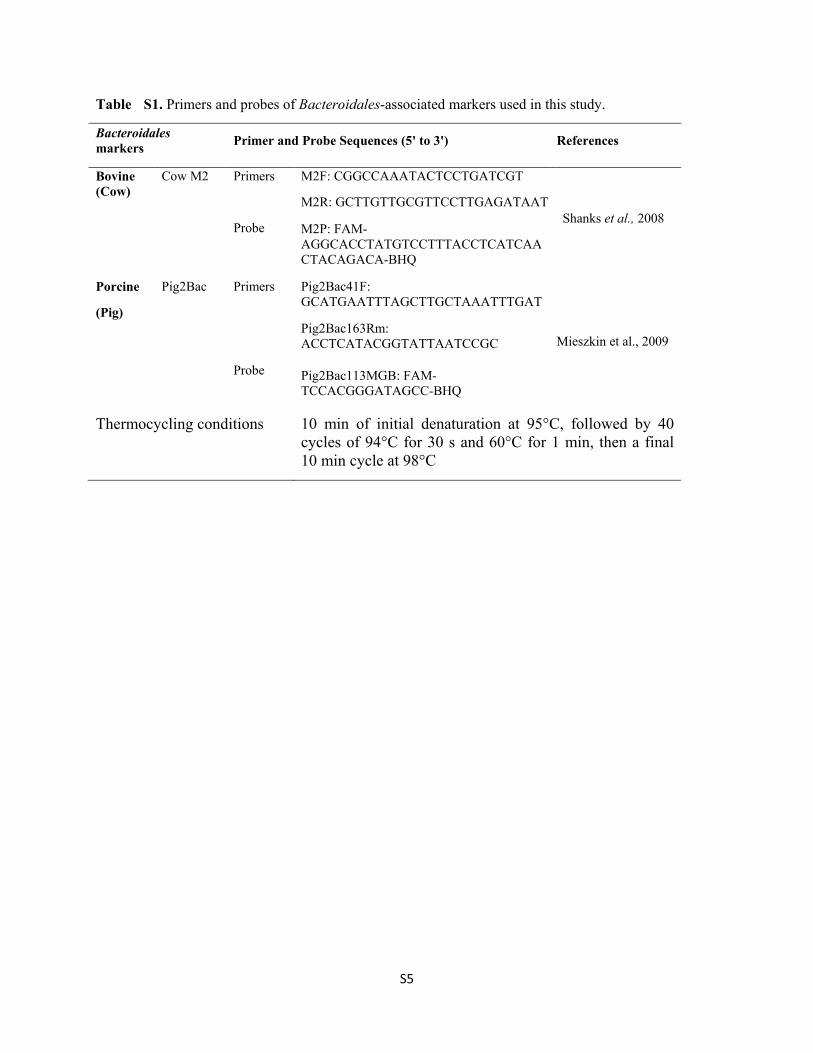
Table S1. Primers and probes of Bacteroidales-associated markers used in this study.
Bacteroidales markers Primer and Probe Sequences (5' to 3') References
Bovine (Cow)
Cow M2 Primers M2F: CGGCCAAATACTCCTGATCGT
Shanks et al., 2008 M2R: GCTTGTTGCGTTCCTTGAGATAAT
Probe M2P: FAM-AGGCACCTATGTCCTTTACCTCATCAACTACAGACA-BHQ
Porcine
(Pig)
Pig2Bac Primers Pig2Bac41F: GCATGAATTTAGCTTGCTAAATTTGAT
Mieszkin et al., 2009 Pig2Bac163Rm:
ACCTCATACGGTATTAATCCGC
Probe Pig2Bac113MGB: FAM-TCCACGGGATAGCC-BHQ
Thermocycling conditions 10 min of initial denaturation at 95°C, followed by 40 cycles of 94°C for 30 s and 60°C for 1 min, then a final 10 min cycle at 98°C
S6
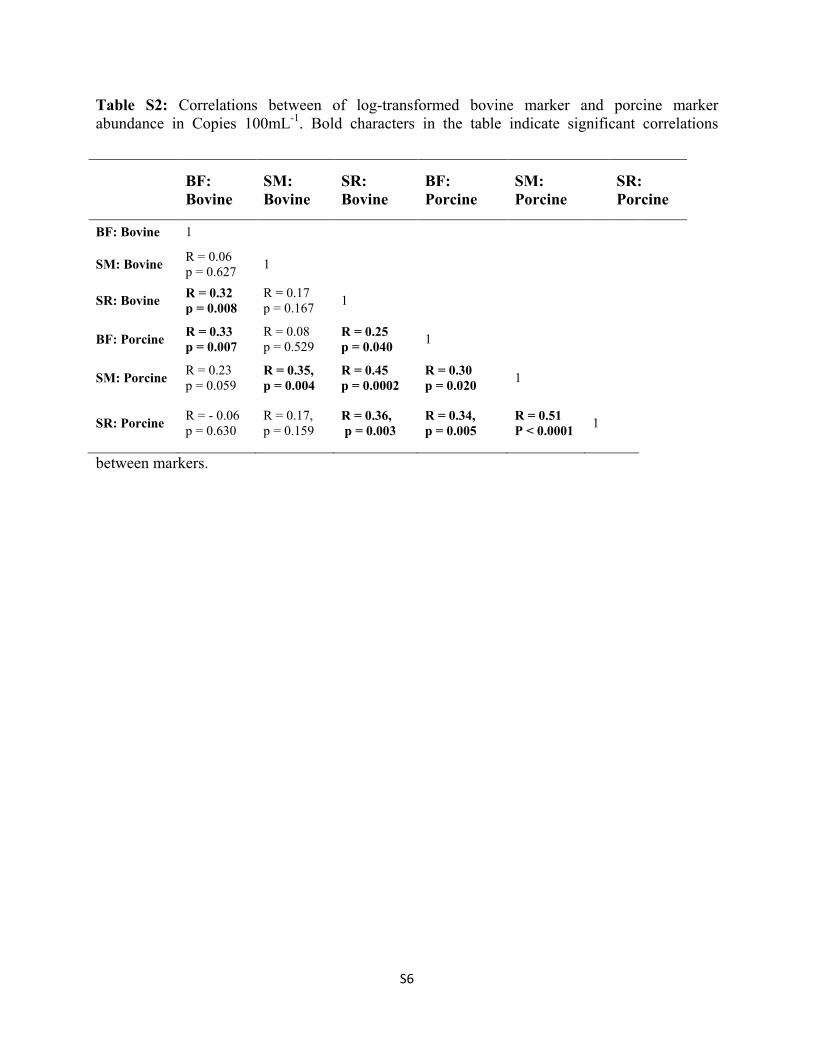
Table S2: Correlations between of log-transformed bovine marker and porcine marker abundance in Copies 100mL-1. Bold characters in the table indicate significant correlations
between markers.
BF: Bovine
SM: Bovine
SR: Bovine
BF: Porcine
SM: Porcine
SR: Porcine
BF: Bovine 1
SM: Bovine R = 0.06 p = 0.627 1
SR: Bovine R = 0.32 p = 0.008
R = 0.17 p = 0.167 1
BF: Porcine R = 0.33 p = 0.007
R = 0.08 p = 0.529
R = 0.25 p = 0.040 1
SM: Porcine R = 0.23 p = 0.059
R = 0.35, p = 0.004
R = 0.45 p = 0.0002
R = 0.30 p = 0.020 1
SR: Porcine R = - 0.06 p = 0.630
R = 0.17, p = 0.159
R = 0.36, p = 0.003
R = 0.34, p = 0.005
R = 0.51 P < 0.0001 1
S7
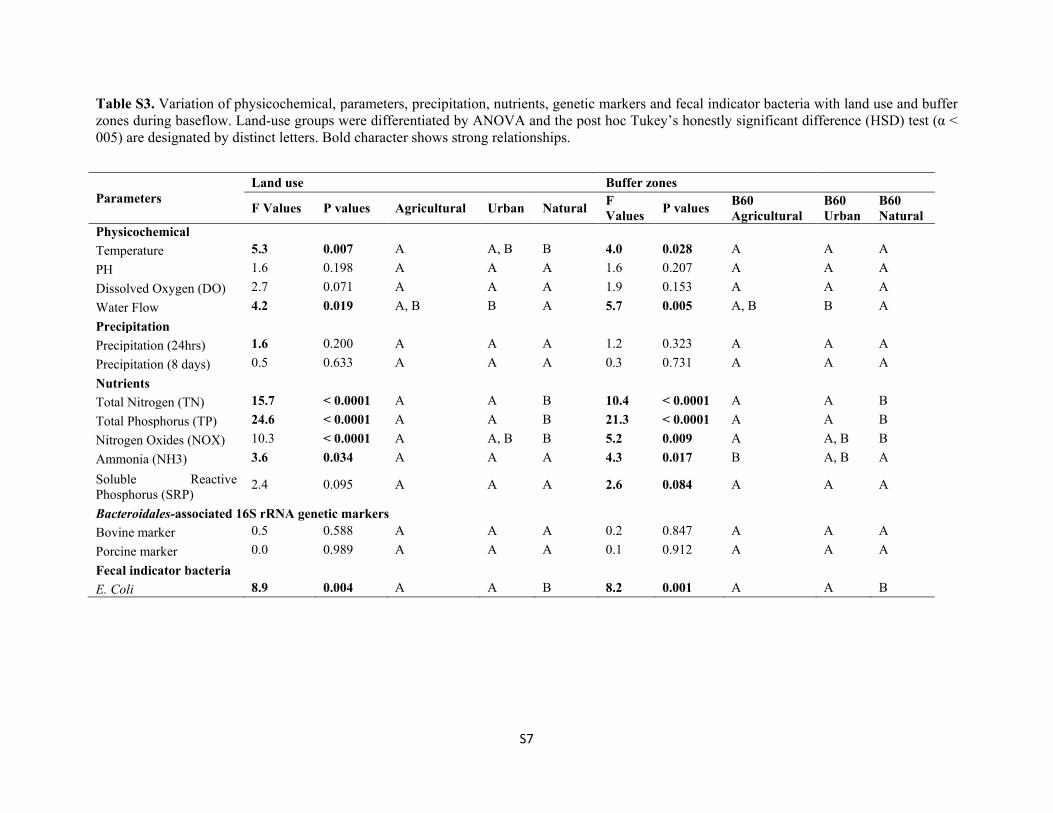
Table S3. Variation of physicochemical, parameters, precipitation, nutrients, genetic markers and fecal indicator bacteria with land use and buffer zones during baseflow. Land-use groups were differentiated by ANOVA and the post hoc Tukey’s honestly significant difference (HSD) test (α < 005) are designated by distinct letters. Bold character shows strong relationships.
Parameters Land use Buffer zones
F Values P values Agricultural Urban Natural F Values P values B60
Agricultural B60 Urban
B60 Natural
Physicochemical Temperature 5.3 0.007 A A, B B 4.0 0.028 A A A PH 1.6 0.198 A A A 1.6 0.207 A A A Dissolved Oxygen (DO) 2.7 0.071 A A A 1.9 0.153 A A A Water Flow 4.2 0.019 A, B B A 5.7 0.005 A, B B A Precipitation Precipitation (24hrs) 1.6 0.200 A A A 1.2 0.323 A A A Precipitation (8 days) 0.5 0.633 A A A 0.3 0.731 A A A Nutrients Total Nitrogen (TN) 15.7 < 0.0001 A A B 10.4 < 0.0001 A A B Total Phosphorus (TP) 24.6 < 0.0001 A A B 21.3 < 0.0001 A A B Nitrogen Oxides (NOX) 10.3 < 0.0001 A A, B B 5.2 0.009 A A, B B Ammonia (NH3) 3.6 0.034 A A A 4.3 0.017 B A, B A Soluble Reactive Phosphorus (SRP)
2.4 0.095 A A A 2.6 0.084 A A A
Bacteroidales-associated 16S rRNA genetic markers Bovine marker 0.5 0.588 A A A 0.2 0.847 A A A Porcine marker 0.0 0.989 A A A 0.1 0.912 A A A Fecal indicator bacteria E. Coli 8.9 0.004 A A B 8.2 0.001 A A B
S8
Table S3. Spring Melt (Continuous)
Parameters Land use Buffer zones
F Values P values Agricultural Urban Natural F Values P values B60
Agricultural B60 Urban
B60 Natural
Physicochemical Temperature 0.0434 0.9575 A A A 0.2 0.783 A A A PH 6.13 0.0038 B A, B A 5.8 0.005 B A, B A Dissolved Oxygen (DO) 6.61 0.0025 B B A 6.4 0.003 A, B B A Water Flow 1.88 0.1602 A A A 1.2 0.314 A A A Precipitation Precipitation (24hrs) 3.5 0.0341 A A, B B 1.1 0.352 A A A Precipitation (8 days) 22.71 < 0.0001 A A B 15.5 < 0.0001 A A, B B Nutrients Total Nitrogen (TN) 33.3 < 0.0001 A A B 26.2 < 0.0001 A A B Total Phosphorus (TP) 18.05 < 0.0001 A A B 17.1 < 0.0001 A A B Nitrogen Oxides (NOX) 30.5 < 0.0001 A A B 21.1 < 0.0001 A A B Ammonia (NH3) 13.45 < 0.0001 A A B 7.2 0.002 A, B A B Soluble Reactive Phosphorus (SRP)
14.63 < 0.0001 A A B 21.1 < 0.0001 A A B
Bacteroidales-associated 16S rRNA genetic markers Bovine marker 0.95 0.391 A A A 0.3 0.706 A A A Porcine marker 0.54 0.5837 A A A 1.3 0.279 A A A Fecal indicator bacteria E. Coli 33. 11 < 0.0001 A A B 26.3 <0.0001 A A B
S9
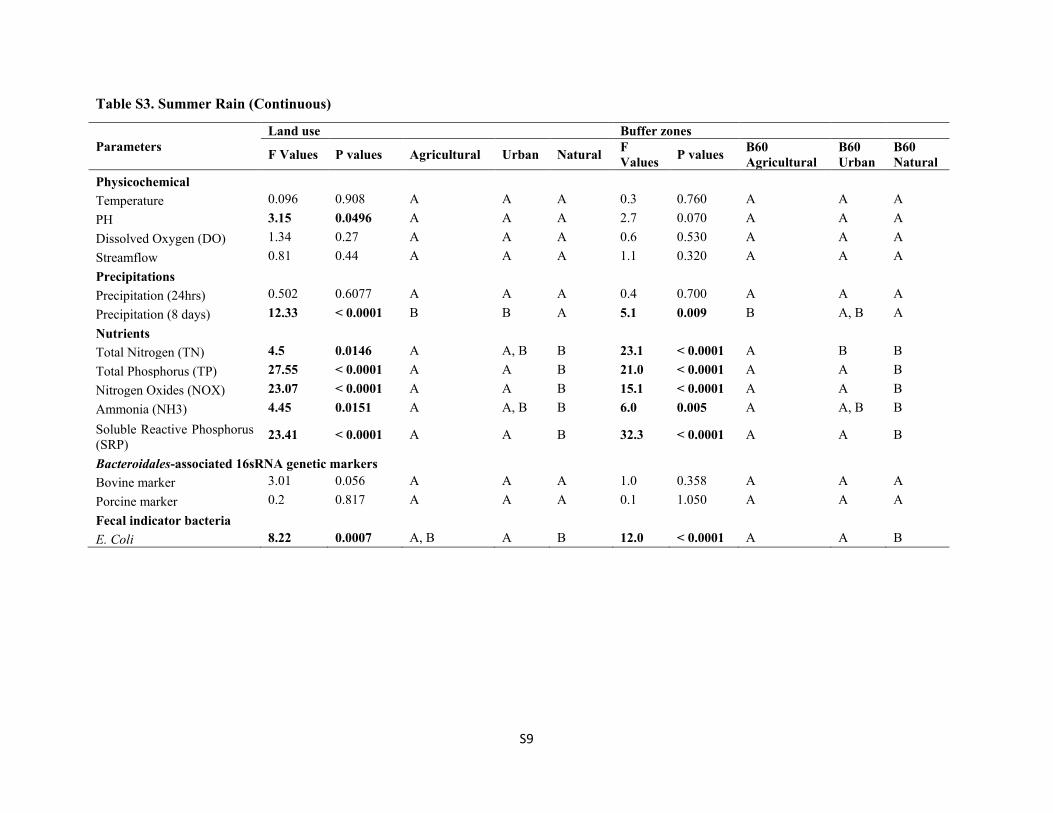
Table S3. Summer Rain (Continuous)
Parameters Land use Buffer zones
F Values P values Agricultural Urban Natural F Values P values B60
Agricultural B60 Urban
B60 Natural
Physicochemical Temperature 0.096 0.908 A A A 0.3 0.760 A A A PH 3.15 0.0496 A A A 2.7 0.070 A A A Dissolved Oxygen (DO) 1.34 0.27 A A A 0.6 0.530 A A A Streamflow 0.81 0.44 A A A 1.1 0.320 A A A Precipitations Precipitation (24hrs) 0.502 0.6077 A A A 0.4 0.700 A A A Precipitation (8 days) 12.33 < 0.0001 B B A 5.1 0.009 B A, B A Nutrients Total Nitrogen (TN) 4.5 0.0146 A A, B B 23.1 < 0.0001 A B B Total Phosphorus (TP) 27.55 < 0.0001 A A B 21.0 < 0.0001 A A B Nitrogen Oxides (NOX) 23.07 < 0.0001 A A B 15.1 < 0.0001 A A B Ammonia (NH3) 4.45 0.0151 A A, B B 6.0 0.005 A A, B B Soluble Reactive Phosphorus (SRP)
23.41 < 0.0001 A A B 32.3 < 0.0001 A A B
Bacteroidales-associated 16sRNA genetic markers Bovine marker 3.01 0.056 A A A 1.0 0.358 A A A Porcine marker 0.2 0.817 A A A 0.1 1.050 A A A Fecal indicator bacteria E. Coli 8.22 0.0007 A, B A B 12.0 < 0.0001 A A B
S10
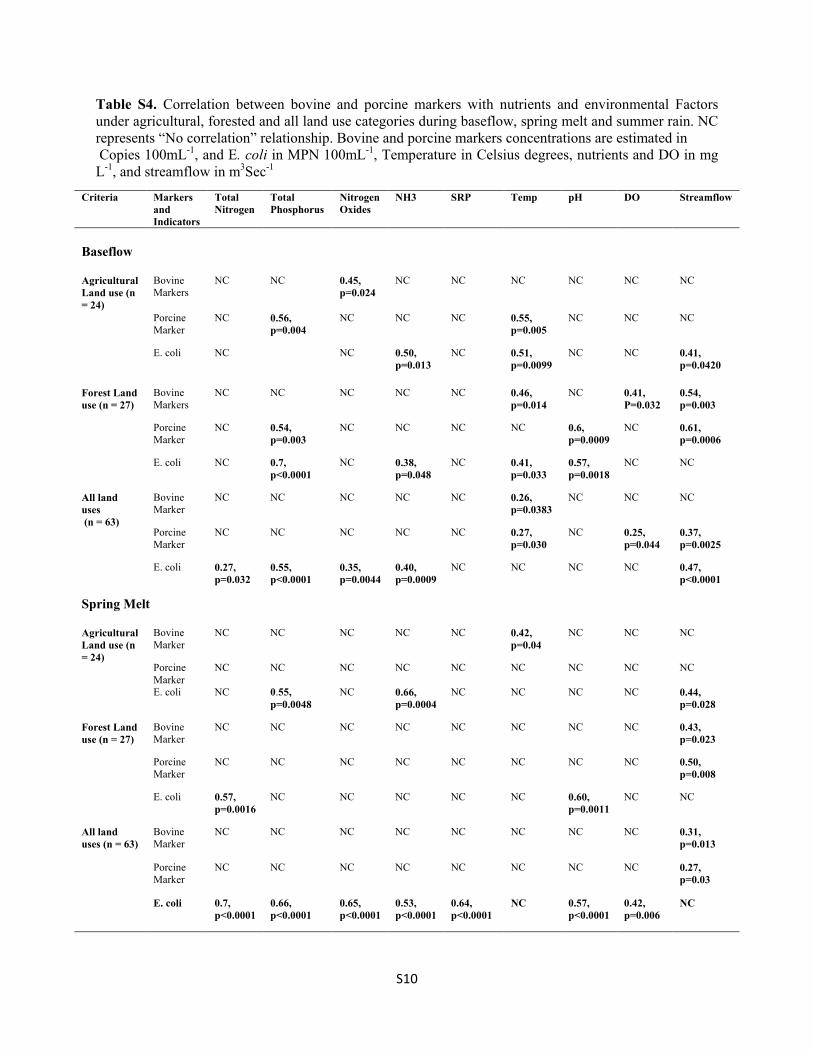
Table S4. Correlation between bovine and porcine markers with nutrients and environmental Factors under agricultural, forested and all land use categories during baseflow, spring melt and summer rain. NC represents “No correlation” relationship. Bovine and porcine markers concentrations are estimated in Copies 100mL-1, and E. coli in MPN 100mL-1, Temperature in Celsius degrees, nutrients and DO in mg L-1, and streamflow in m3Sec-1
Criteria Markers and Indicators
Total Nitrogen
Total Phosphorus
Nitrogen Oxides
NH3 SRP Temp pH DO Streamflow
Baseflow
Agricultural Land use (n = 24)
Bovine Markers
NC NC 0.45, p=0.024
NC NC NC NC NC NC
Porcine Marker
NC 0.56, p=0.004
NC NC NC 0.55, p=0.005
NC NC NC
E. coli NC NC 0.50, p=0.013
NC 0.51, p=0.0099
NC NC 0.41, p=0.0420
Forest Land use (n = 27)
Bovine Markers
NC NC NC NC NC 0.46, p=0.014
NC 0.41, P=0.032
0.54, p=0.003
Porcine Marker
NC 0.54, p=0.003
NC NC NC NC 0.6, p=0.0009
NC 0.61, p=0.0006
E. coli NC 0.7, p<0.0001
NC 0.38, p=0.048
NC 0.41, p=0.033
0.57, p=0.0018
NC NC
All land uses (n = 63)
Bovine Marker
NC NC NC NC NC 0.26, p=0.0383
NC NC NC
Porcine Marker
NC NC NC NC NC 0.27, p=0.030
NC 0.25, p=0.044
0.37, p=0.0025
E. coli 0.27, p=0.032
0.55, p<0.0001
0.35, p=0.0044
0.40, p=0.0009
NC NC NC NC 0.47, p<0.0001
Spring Melt Agricultural Land use (n = 24)
Bovine Marker
NC NC NC NC NC 0.42, p=0.04
NC NC NC
Porcine Marker
NC NC NC NC NC NC NC NC NC
E. coli NC 0.55, p=0.0048
NC 0.66, p=0.0004
NC NC NC NC 0.44, p=0.028
Forest Land use (n = 27)
Bovine Marker
NC NC NC NC NC NC NC NC 0.43, p=0.023
Porcine Marker
NC NC NC NC NC NC NC NC 0.50, p=0.008
E. coli 0.57, p=0.0016
NC NC NC NC NC 0.60, p=0.0011
NC NC
All land uses (n = 63)
Bovine Marker
NC NC NC NC NC NC NC NC 0.31, p=0.013
Porcine Marker
NC NC NC NC NC NC NC NC 0.27, p=0.03
E. coli 0.7, p<0.0001
0.66, p<0.0001
0.65, p<0.0001
0.53, p<0.0001
0.64, p<0.0001
NC 0.57, p<0.0001
0.42, p=0.006
NC
S11
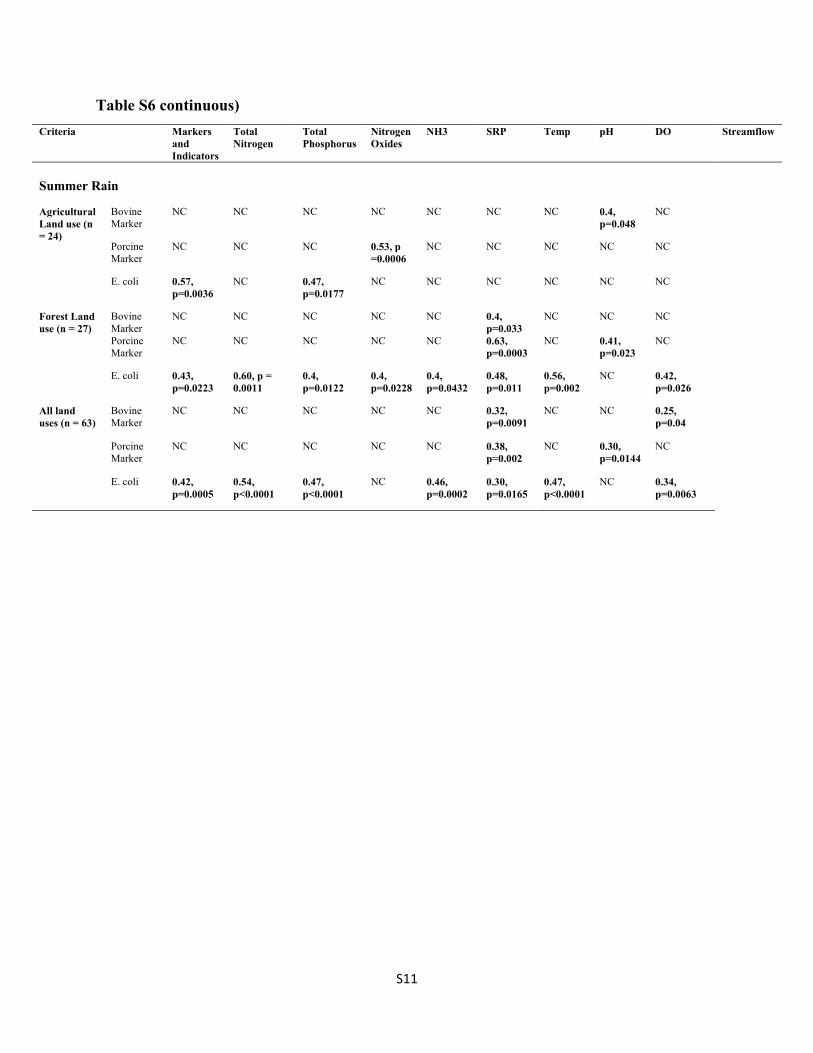
Table S6 continuous) Criteria Markers
and Indicators
Total Nitrogen
Total Phosphorus
Nitrogen Oxides
NH3 SRP Temp pH DO Streamflow
Summer Rain
Agricultural Land use (n = 24)
Bovine Marker
NC NC NC NC NC NC NC 0.4, p=0.048
NC
Porcine Marker
NC NC NC 0.53, p =0.0006
NC NC NC NC NC
E. coli 0.57, p=0.0036
NC 0.47, p=0.0177
NC NC NC NC NC NC
Forest Land use (n = 27)
Bovine Marker
NC NC NC NC NC 0.4, p=0.033
NC NC NC
Porcine Marker
NC NC NC NC NC 0.63, p=0.0003
NC 0.41, p=0.023
NC
E. coli 0.43, p=0.0223
0.60, p = 0.0011
0.4, p=0.0122
0.4, p=0.0228
0.4, p=0.0432
0.48, p=0.011
0.56, p=0.002
NC 0.42, p=0.026
All land uses (n = 63)
Bovine Marker
NC NC NC NC NC 0.32, p=0.0091
NC NC 0.25, p=0.04
Porcine Marker
NC NC NC NC NC 0.38, p=0.002
NC 0.30, p=0.0144
NC
E. coli 0.42, p=0.0005
0.54, p<0.0001
0.47, p<0.0001
NC 0.46, p=0.0002
0.30, p=0.0165
0.47, p<0.0001
NC 0.34, p=0.0063
S12
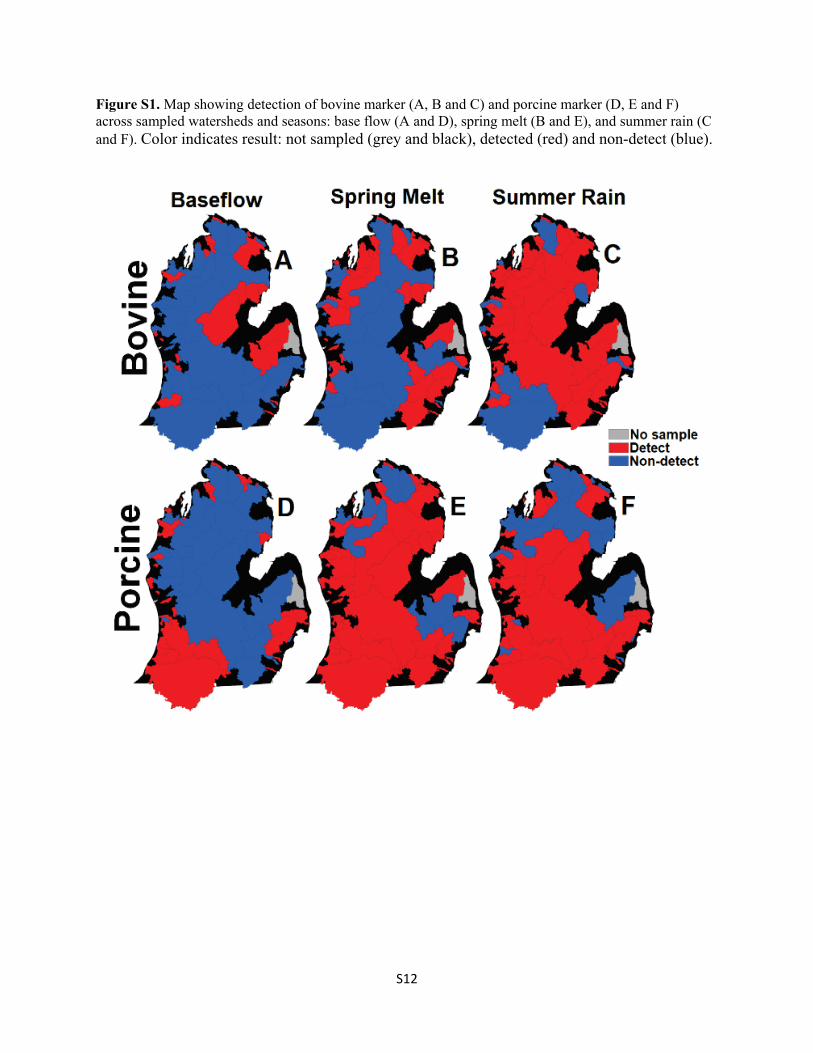
Figure S1. Map showing detection of bovine marker (A, B and C) and porcine marker (D, E and F) across sampled watersheds and seasons: base flow (A and D), spring melt (B and E), and summer rain (C and F). Color indicates result: not sampled (grey and black), detected (red) and non-detect (blue).
S13
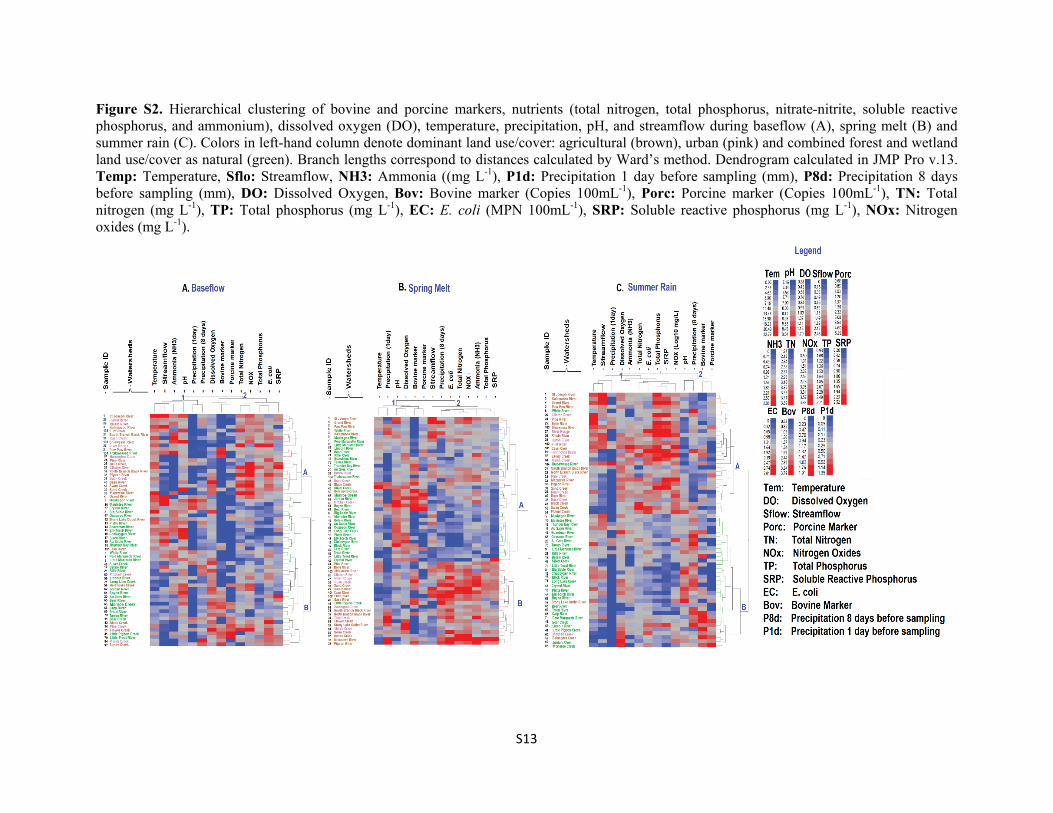
Figure S2. Hierarchical clustering of bovine and porcine markers, nutrients (total nitrogen, total phosphorus, nitrate-nitrite, soluble reactive phosphorus, and ammonium), dissolved oxygen (DO), temperature, precipitation, pH, and streamflow during baseflow (A), spring melt (B) and summer rain (C). Colors in left-hand column denote dominant land use/cover: agricultural (brown), urban (pink) and combined forest and wetland land use/cover as natural (green). Branch lengths correspond to distances calculated by Ward’s method. Dendrogram calculated in JMP Pro v.13. Temp: Temperature, Sflo: Streamflow, NH3: Ammonia ((mg L-1), P1d: Precipitation 1 day before sampling (mm), P8d: Precipitation 8 days before sampling (mm), DO: Dissolved Oxygen, Bov: Bovine marker (Copies 100mL-1), Porc: Porcine marker (Copies 100mL-1), TN: Total nitrogen (mg L-1), TP: Total phosphorus (mg L-1), EC: E. coli (MPN 100mL-1), SRP: Soluble reactive phosphorus (mg L-1), NOx: Nitrogen oxides (mg L-1).