Embed Size (px)
Citation preview
JOURNAL OF GEOPHYSICAL RESEARCH, VOL. 104, NO. B8, PAGES 17,675-17,688, AUGUST 10, 1999
Regional heat flow variations across the sedimented Juan de Fuca Ridge eastern flank: Constraints on lithospheric cooling and lateral hydrothermal heat transport
E. E. Davis, • D. S. Chapman, 2 K. Wang, • H. Viilinger, 3 A. T. Fisher, 4 S. W. Robinson, 2 J. Grigel, 3 D. Pribnow, 5 J. Stein, 4 and K. Becker 6
Abstract. Seafloor heat flow has been estimated continuously along a transect on the sedimented eastern flank of the Juan de Fuca Ridge to provide constraints on the scale and rate of lateral heat and fluid transport in the upper igneous crust, and on the total flux from the young lithosphere beneath. The profile extends from 20 km east of the ridge axis, where turbidite sediments lap onto the oceanic crust at an age of less than 1 Ma, and ends 110 km east of the axis over 3.6 Ma crust. Estimated heat flow is derived from the combination of the depth to igneous basement determined from seismic reflection profiles, and basement temperatures measured in nine Ocean Drilling Program boreholes along the transect. The strategy is based on the knowledge that in this young area upper basement temperatures are locally homogenized by vigorous hydrothermal circulation, and hence vary smoothly between drilling sites. At the young end of the transect near the region of extensive outcrop, heat flow is only 15% of that predicted for lithosphere of this age. Heat flow increases systematically to the east, reaching the full predicted level about 20 km from the point of sediment/basement onlap. The anomaly can be accounted for by mixing and/or eastward flow of cool water in the upper igneous crust beneath the sediment at a Darcian rate of the order of 1 m yr -•. A geochemical signature of "fresh" seawater in basement is observed many tens of kilometers farther to the east, although the thermal signature is no longer present; along the remainder of the transect the heat flow conforms very well to that predicted by simple boundary layer cooling theory once the thermal effects of rapid sedimentation on this ridge flank are accounted for.
1. Introduction
1.1. Background
The eastern flank of the northern Juan de Fuca Ridge provides an ideal setting for studying heat flow from young oceanic lithosphere and hydrothermal circulation in young oceanic crust. The ridge is close to the North American continental margin, which has provided an abundant supply of glacially eroded sediments during the Pleistocene; this, combined with the relatively low local relief of the eastern flank, has caused the igneous crust in the area (known as Cascadia Basin) to be nearly completely buried by low- permeability sediments. North of 47øN, igneous crust is exposed at only five small seamounts (Figure 1); these range from only 200
tPacific Geoscience Centre, Geological Survey of Canada, Sidney, British Columbia, Canada.
2Department of Geology and Geophysics, University of Utah, Salt Lake City.
3Fachbereich Geowissenschaften, Universit•it Bremen, Bremen, Germany.
4Earth Sciences Department, University of California, Santa Cruz. 5Geowissenschaftliche Gemeinschaftsaufgaben, Hannover, Germany. 6Rosenstiel School of Marine and Atmospheric Science, University of
Miami, Miami, Florida.
Copyright 1999 by the American Geophysical Union.
Paper number 1999JB900124. 0148-0227/99/1999JB900124509.00
m up to roughly 4 km in outcrop diameter. This extensive burial has allowed detailed, systematic suites of heat flow measurements to be completed along seismic reflection profiles to constrain local thermal structure and coordinated coring to be carried out to constrain rates of fluid seepage and compositions of basement (extrusive igneous crust) water over crust of unusually young age. Much work has been focused along a corridor that extends from about 18 km east of the axis of the Endeavour segment of the ridge at approximately 48øN, 128øW, where igneous crust is buried at an age of less than 1 Ma, to crust nearly 5 Ma in age approximately 140 km east of the axis (Figures 1 and 2). Results of these studies and associated modeling are included in the works of Davis et al. [1989, 1992, 1996, 1997a,b; Elderfield et al., 1999; Fisher and Becker, 1995; Mottl et al., 1998; Robinson, 1997; Rohr, 1994; Rosenberger et al., 1999; Snelgrove and Forster, 1996; Wang et al., 1997; Wheat and Mottl, 1994; Yang et al., 1996]. Most recently, the corridor has been the focus of Ocean Drilling Program (ODP) Leg 168 [Davis et al., 1997c].
Among specific objectives of these studies were (1) to determine the efficiency with which sediments blanketing the igneous crust provide a hydrologic barrier to flow; (2) to document the distance over which fluid and heat are transported in the upper igneous oceanic crust laterally beneath a relatively impermeable sediment cover; (3) to provide constraints on the scale and nature of hydrothermal convection cells created by buoyancy instabilities in the upper igneous crust; (4) to examine the degree to which flow is stimulated or influenced by buried basement topography and variations in sediment thickness; (5) to determine the role of basement outcrops as hydrothermal "ventilators" in controlling
17,675
17,676 DAVIS ET AL.: JUAN DE FUCA FLANK HEAT FLOW TRANSECT
50 ø
48 ø
46 ø __ 130 ø 128 ø 126 ø 124 ø
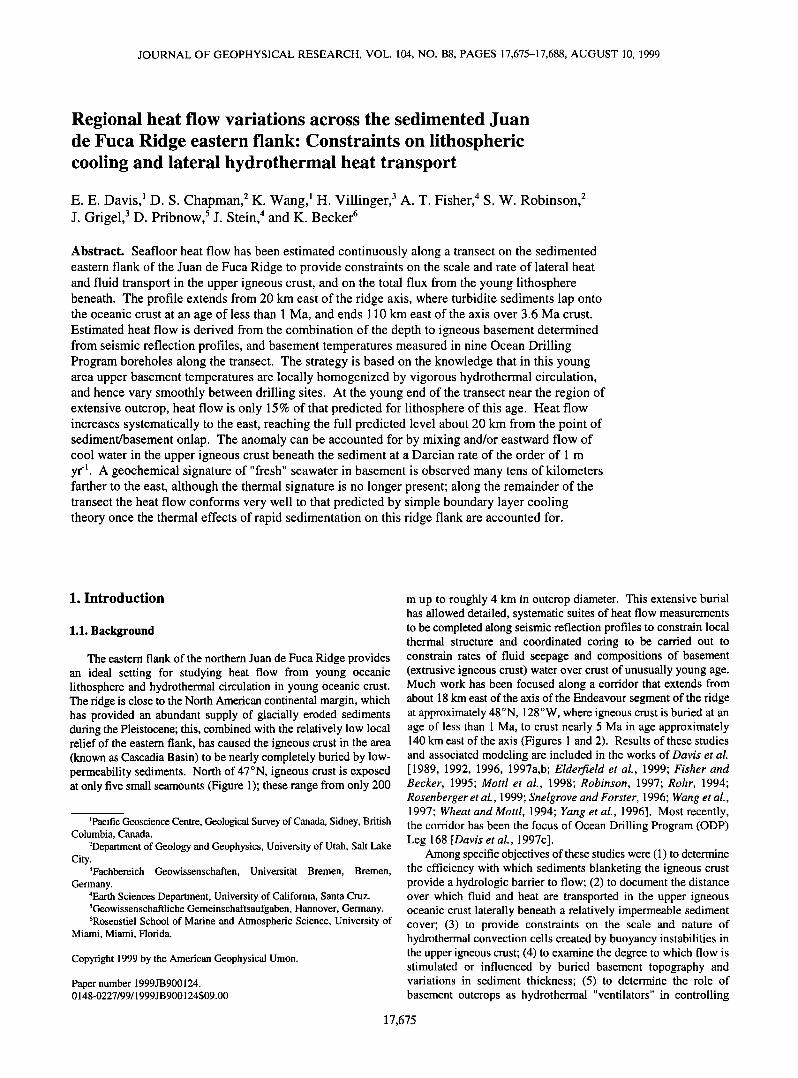
Figure 1. Major tectonic features and crustal ages in the vicinity of the northern Juan de Fuca Ridge showing the location of the Ocean Drilling Program (ODP) Leg 168 sites (triangles) and the transect shown in Figure 2. Approximate crustal ages have been estimated from magnetic anomalies. Locations of known basement outcrops on the otherwise fully sedimented eastern ridge flank are also indicated. Precise locations of drilling sites, seismic profiles, and heat flow measurements are given in Davis et al. [1997c], Rosenberger et al. [1999], and Davis et al. [1997b] respectively.
crustal fluid flow and the advective exchange of fluids and heat between the igneous oceanic crust and the ocean; (6) to quantify geochemical fluxes into and out of the crust and, consequently, to identify the impact that hydrothermal fluid exchange with the oceans has on global geochemical budgets; (7) to correlate changes in hydrothermal regime to changes in the state of alteration of the crust, including the evolution of its chemical composition, mechanical consolidation, and permeability structure; and (8) to determine the rate of heat loss from young lithosphere with measurements made well away from known outcrops that are potential sites of advective heat exchange with the ocean.
1.2. Goals of the Present Analysis
Many of these objectives have been well addressed directly through previous studies, but two remain largely unresolved. These are (1) to determine the distance over which and rate at which fluids and heat can be transported laterally in the upper igneous crust beneath sediments, in particular, between areas of basement outcrop where hydrothermal circulation in the igneous crust is ventilated to the ocean and areas of continuous sediment cover where
hydrothermal circulation is isolated from the ocean; and (2) to establish in this area the total rate at which heat is lost from young lithosphere. These objectives are highly intertwined and formally cannot be achieved with heat flow data only. Fortunately, fluid geochemical constraints and results of modeling can be used to overcome this difficulty.
The thermal and chemical importance of lateral fluid flow in the upper igneous crust coupled with advective exchange at permeable seafloor outcrops has been recognized for more than 2 decades [e.g., Lister, 1972; Sclater et al., 1976; Davis and Lister, 1977; Langseth and Herman, 1981; Langseth et al., 1984, 1992; Baker et al., 1991 ], although constraints on the rates of flow and the scale of thermally and chemically significant transport are not well
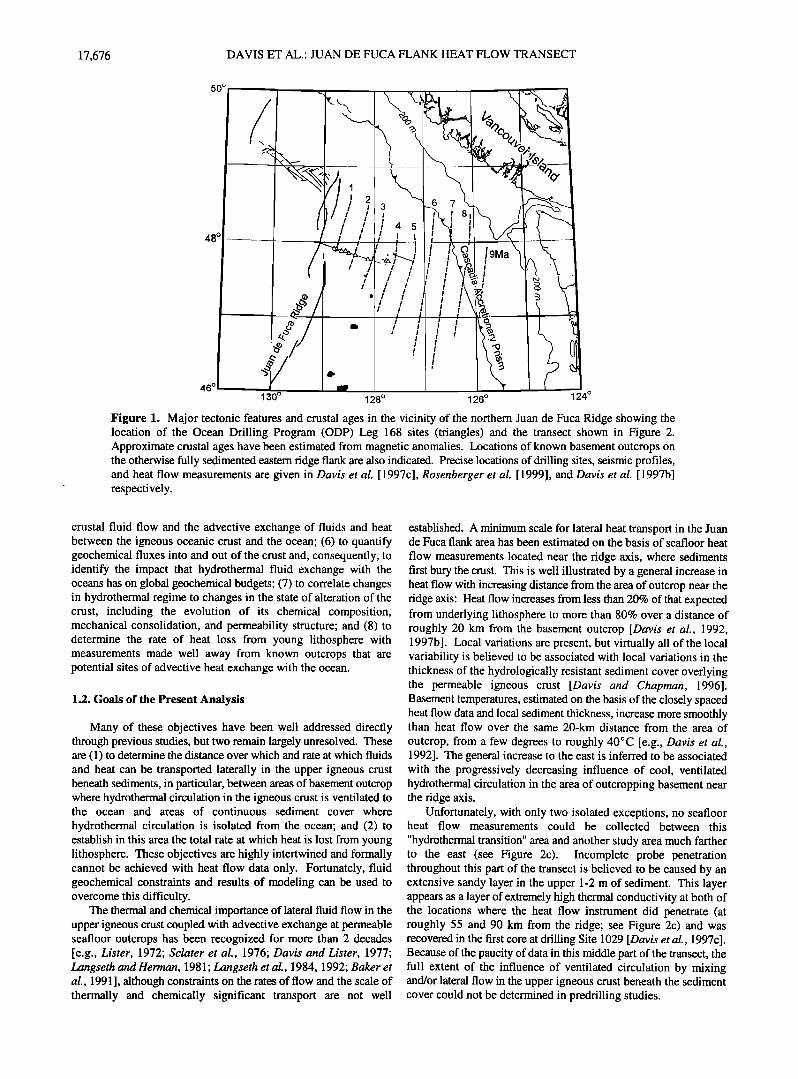
established. A minimum scale for lateral heat transport in the Juan de Fuca flank area has been estimated on the basis of seafloor heat flow measurements located near the ridge axis, where sediments first bury the crust. This is well illustrated by a general increase in heat flow with increasing distance from the area of outcrop near the ridge axis: Heat flow increases from less than 20% of that expected from underlying lithosphere to more than 80% over a distance of roughly 20 km from the basement outcrop [Davis et al., 1992, 1997b]. Local variations are present, but virtually all of the local variability is believed to be associated with local variations in the thickness of the hydrologically resistant sediment cover overlying the permeable igneous crust [Davis and Chapman, 1996]. Basement temperatures, estimated on the basis of the closely spaced heat flow data and local sediment thickness, increase more smoothly than heat flow over the same 20-km distance from the area of outcrop, from a few degrees to roughly 40øC [e.g., Davis et al., 1992]. The general increase to the east is inferred to be associated with the progressively decreasing influence of cool, ventilated hydrothermal circulation in the area of outcropping basement near the ridge axis.
Unfortunately, with only two isolated exceptions, no seafloor heat flow measurements could be collected between this "hydrothermal transition" area and another study area much farther to the east (see Figure 2c). Incomplete probe penetration throughout this part of the transect is believed to be caused by an extensive sandy layer in the upper 1-2 m of sediment. This layer appears as a layer of extremely high thermal conductivity at both of the locations where the heat flow instrument did penetrate (at roughly 55 and 90 km from the ridge; see Figure 2c) and was recovered in the first core at drilling Site 1029 [Davis et al., 1997c]. Because of the paucity of data in this middle part of the transect, the full extent of the influence of ventilated circulation by mixing and/or lateral flow in the upper igneous crust beneath the sediment cover could not be determined in predrilling studies.
DAVIS ET AL.' JUAN DE FUCA FLANK HEAT FLOW TRANSECT 17,677
600
E 500
• 400 E
• 300 o
.,-, 200
:!: lOO
Age (Ma) 0.0 0.5 1.0 1.5 2.0 2.5 3.0 3.5 4.0 4.5 5.0
'' I' ' ' '1 .... I '' '' I''' ' I' '' ' I' '' ' I .... I .... I .... I .... I' -- _
-- _
-- _
-- _
-- C -
140
•' 120 o
½• 100 .,-, 80
½• 60
E 40 20
- / -
3.0
3.5
4.0
4.5
[' I ' '' 'l '' '' I'' '' I .... I ''' 'l''''l' ''' I '''' I'' ['l''''l '
'_ • v o•• o o o o o Sediment •' Basemen•
a ' I I I I I I I I I I I I I I I
0 20 40 60 80 100 120 140
Distance from ridge axis (km)
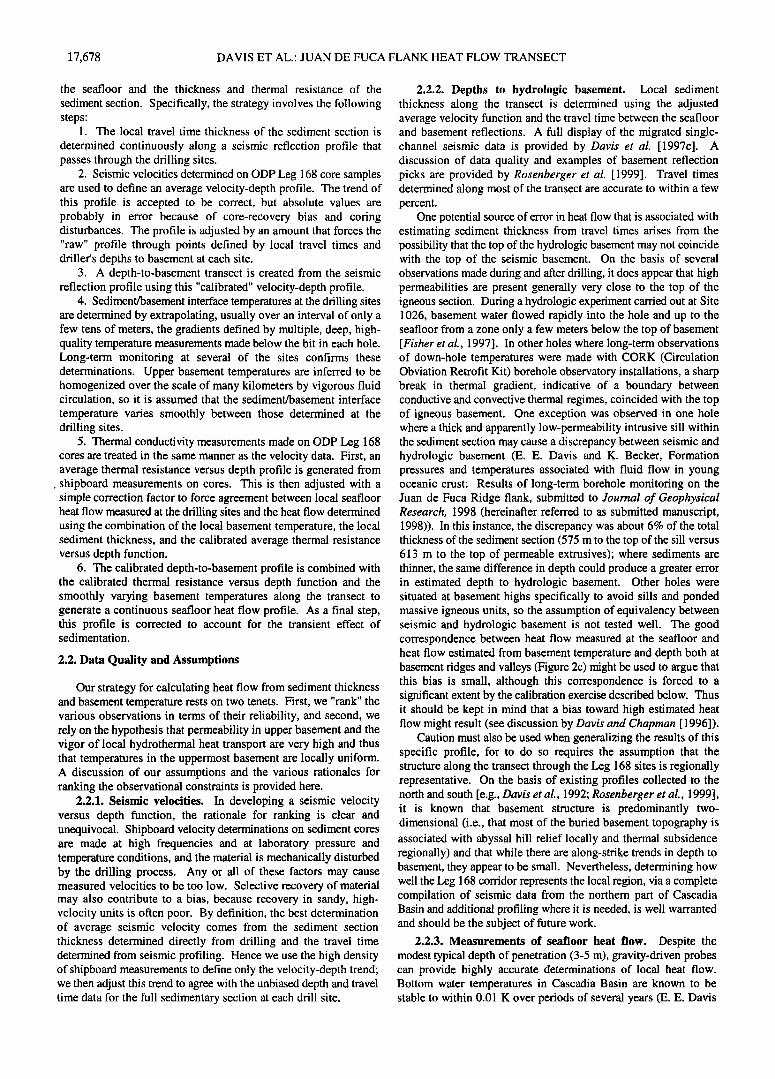
Figure 2. (a) Seismic travel time to the seafloor and to igneous basement derived from seismic reflection profiles crossing through the ODP Leg 168 drilling Sites 1023-1032 (see Figure 1 for location and Davis et al. [ 1997c], and Rosenberger et al. [ 1999] for seismic data). (b) Basement temperatures measured at and interpolated between the drilling sites. The method used to predict basement temperatures east of the oldest drilling site (dashed line) is described in text. (c) Heat flow, measured at the seafloor along the transect (dots) and estimated from sediment thickness and basement temperatures in the manner described in the text (solid line). Distance is determined from the axis of the Endeavour ridge segment. Ages are derived from magnetic chron boundaries as described by Davis et al. [ 1997c]. Precise locations of heat flow measurements are provided by Davis et al. [ 1997b]; all measurements fall within 200 m of the transect (location shown in Figure 1).
Drilling results confirm the trend of increasing basement temperatures along the transect and add valuable new constraints on the rate and extent of lateral flow. In particular, basement water compositions define lateral concentration gradients of several solutes that indicate increasing hydrologic isolation of the igneous crust from the ocean to the east, just as suggested by the heat flow data. The lateral scale of the geochemical influence of ventilated circulation is much greater than that of the thermal influence. For example, while diminished, sulfate concentrations remain nearly half that of seawater along the full extent of the drilling transect, despite the rapid consumption of sulfate within the sediment section and the lack of a source in basement itself [Davis et al., 1997c; Elderfield et al., 1999]. Other observations that argue unequi- vocally for rapid transport of water over a distance greater than 20 km include the ages of basement water determined from •4C isotopic compositions that are no older than 8000 years anywhere along the drilling transect. These and other constraints on lateral fluid flow from basement water compositions along the drilling transect will
be presented elsewhere [Elderfield et al., 1999]. The analysis presented in this paper focuses on the complementary constraints provided by the thermal structure along the transect.
2. Strategy
2.1. Estimating a Continuous Heat Flow Profile
To make the best use of all geophysical data, we develop in this paper a strategy that is built on our understanding of the physics of hydrothermal circulation in young oceanic crust and that utilizes what we consider to be an optimum combination of seismic reflection times to basement, seafloor heat flow data, ODP observations of basement temperatures, drilled depths to basement,
and sediment physical properties. The result is a continuous profile of heat flow along the seismic reflection/drilling transect, estimated from the temperature difference between the top of basement and
DAVIS ET AL.: JUAN DE FUCA FLANK HEAT FLOW TRANSECT 17,679
and K. Becker, submitted manuscript, 1998). If this stability is characteristic, it should allow geothermal gradients of 200 mK m '• to be determined with an uncertainty of less than 1% over an interval of 5 m below the seafloor.
In situ measurements of thermal conductivity can be made to a similar level of uncertainty (e.g., 1-2% [Lister, 1979; Nagihara and Lister, 1993; Viilinger and Davis, 1987]), and large numbers of measurements can be used to ensure that the measurements are
representative and to overcome the limitation that any individual penetration provides conductivity measurements at only 20- to 30- cm intervals [Robinson, 1997; Davis et al., 1997b].
2.2.4. Integrated thermal resistance. Unfortunately, the same level of confidence cannot be placed on sediment thermal conductivities measured on ODP cores; these are probably biased in much the same way as seismic velocities because of drilling disturbances, unloading effects, and the sampling bias associated with the systematically poor recovery of sandy, highly conductive parts of the section. Hence, in this analysis, we have chosen to honor the seafloor probe data as being more accurate and representative of in situ properties than the shipboard conductivity measurements and thus to adjust the thermal resistance profile defined by shipboard measurements so that the heat flow calculated using the average thermal resistance and the temperature difference from the seafloor to basement agrees with the local seafloor heat flow. By its nature, this adjustment also incorporates the thermal effect of sedimentation that causes the heat flow at the seafloor to be lower than that determined across the full thickness of the sediment section. This effect is relatively small and is discussed in section 3.2.2.
2.2.5. Temperatures in hydrologic basement. Bottom-hole temperature probe measurements were made at typically 20- to 30- m intervals immediately after core retrieval in each hole of the transect (Davis et al., 1997c]. Uncertainties of these measurements are probably less than about 0.1 K, and extrapolation of them is believed to provide an estimate of the temperature at the depth of the sediment/basement interface that is probably accurate to well within 1 K. Because the local average thermal conductivity varies very slowly with depth at depths greater than about 100 m, this extrapolation can be done either in the depth or integrated thermal resistance domain. As discussed above, the greatest uncertainty with the basement temperature determinations is associated with the possibility that the transition from hydrologically resistive to transmissive material may occur below the top of the seismic basement. Confirmation of extrapolated basement temperatures and the general coincidence of seismic and hydrologic basement is provided by CORK borehole observatory data at four of the drilling sites (E. E. Davis and K. Becker, submitted manuscript, 1998).
The other assumption involved in the use of basement temperatures in this analysis is that they vary slowly and monotonically over the intervals between drilling sites. This assumption is founded on the hypothesis that vigorous hydrothermal circulation maintains upper basement at a highly uniform temperature over a scale of several kilometers (in the absence of other effects such as those present at the western end of the transect). This hypothesis and the degree of isothermality have been investigated using the relationship of sediment thickness and heat flow in the area near sites 1026 and 1027, with the result that basement appeared to be isothermal to within about _+5 K [Davis et al., 1997a]. Drilling and postdrilling observations have subsequently confirmed this. The two sites are separated by 2.2 km, and sediment thickness differs by a factor of 2.5, yet basement temperatures differ by only 3 K (E. E. Davis and K. Becker, submitted manuscript, 1998). Even in the western part of the drilling transect, where there is a strong effect of ventilated hydrothermal circulation near the ridge axis, the lateral gradient is
only a few degrees per kilometer. Hence, for this analysis, we have simply interpolated linearly between the basement temperatures determined at each of the sites to create a slowly varying, lateral basement temperature profile along the transect (see Figure 2b).
3. Results
3.1. Profiles of Physical Properties
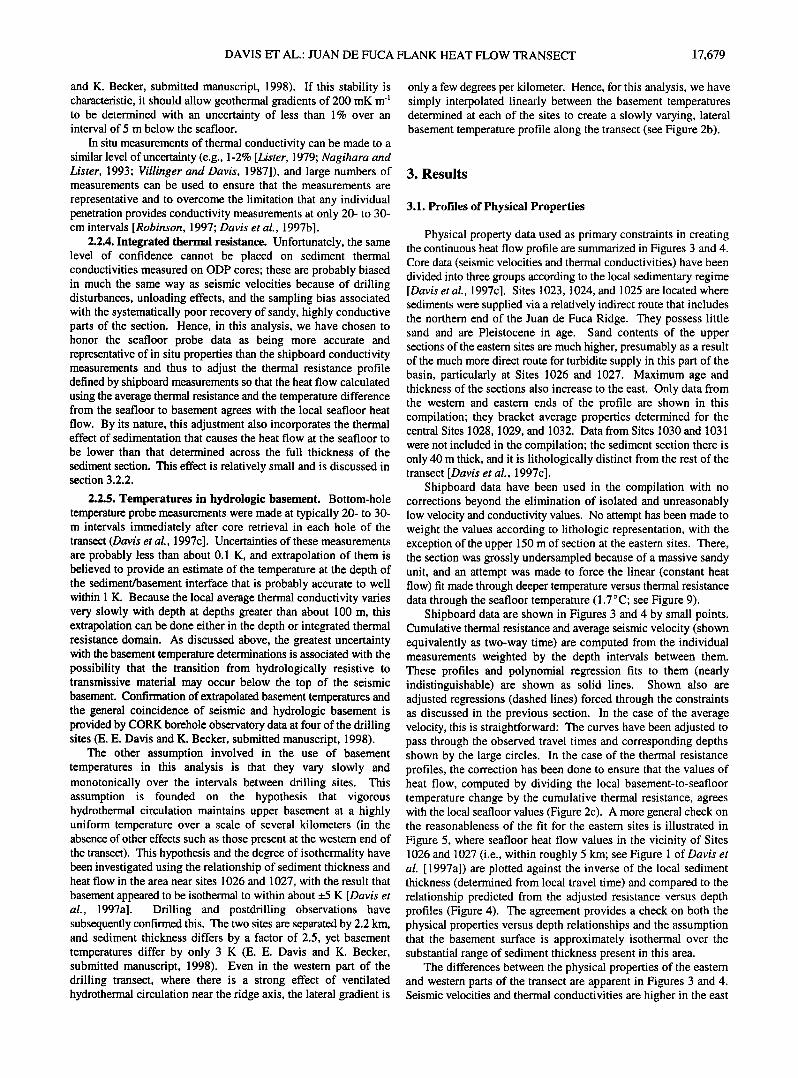
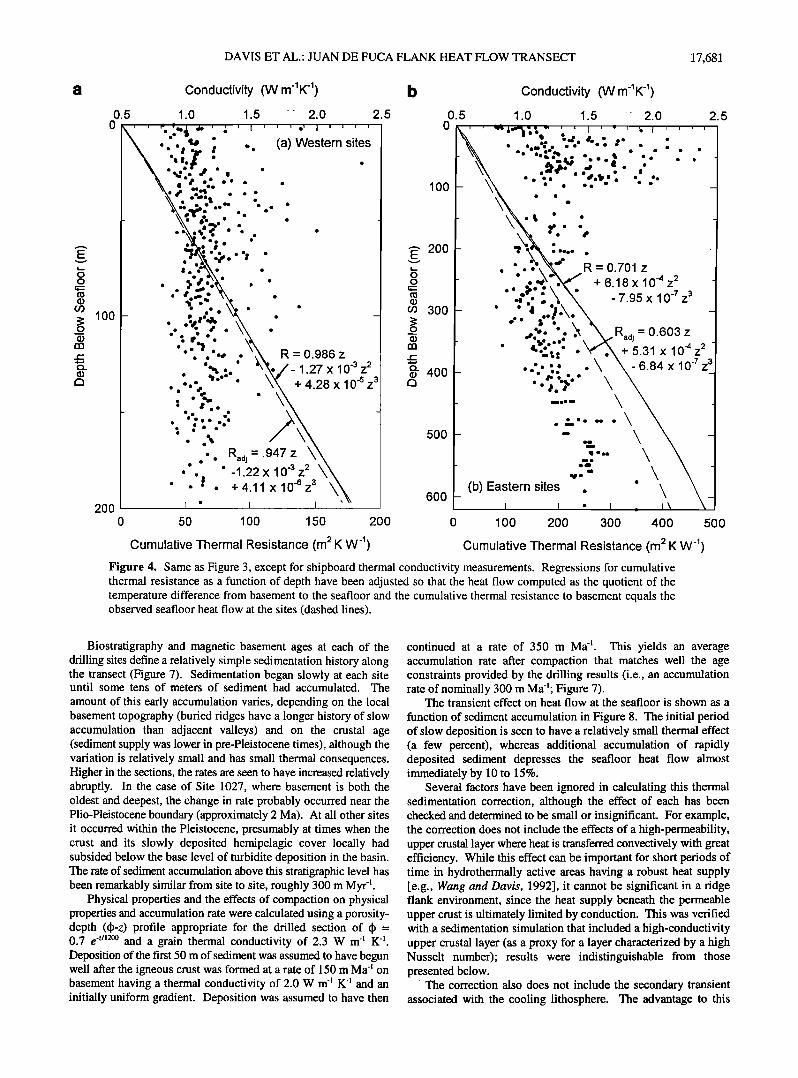
Physical property data used as primary constraints in creating the continuous heat flow profile are summarized in Figures 3 and 4. Core data (seismic velocities and thermal conductivities) have been divided into three groups according to the local sedimentary regime [Davis et al., 1997c]. Sites 1023, 1024, and 1025 are located where sediments were supplied via a relatively indirect route that includes the northern end of the Juan de Fuca Ridge. They possess little sand and are Pleistocene in age. Sand contents of the upper sections of the eastern sites are much higher, presumably as a result of the much more direct route for turbidite supply in this part of the basin, particularly at Sites 1026 and 1027. Maximum age and thickness of the sections also increase to the east. Only data from the western and eastern ends of the profile are shown in this compilation; they bracket average properties determined for the central Sites 1028, 1029, and 1032. Data from Sites 1030 and 1031 were not included in the compilation; the sediment section there is only 40 m thick, and it is lithologically distinct from the rest of the transect [Davis et al., 1997c].
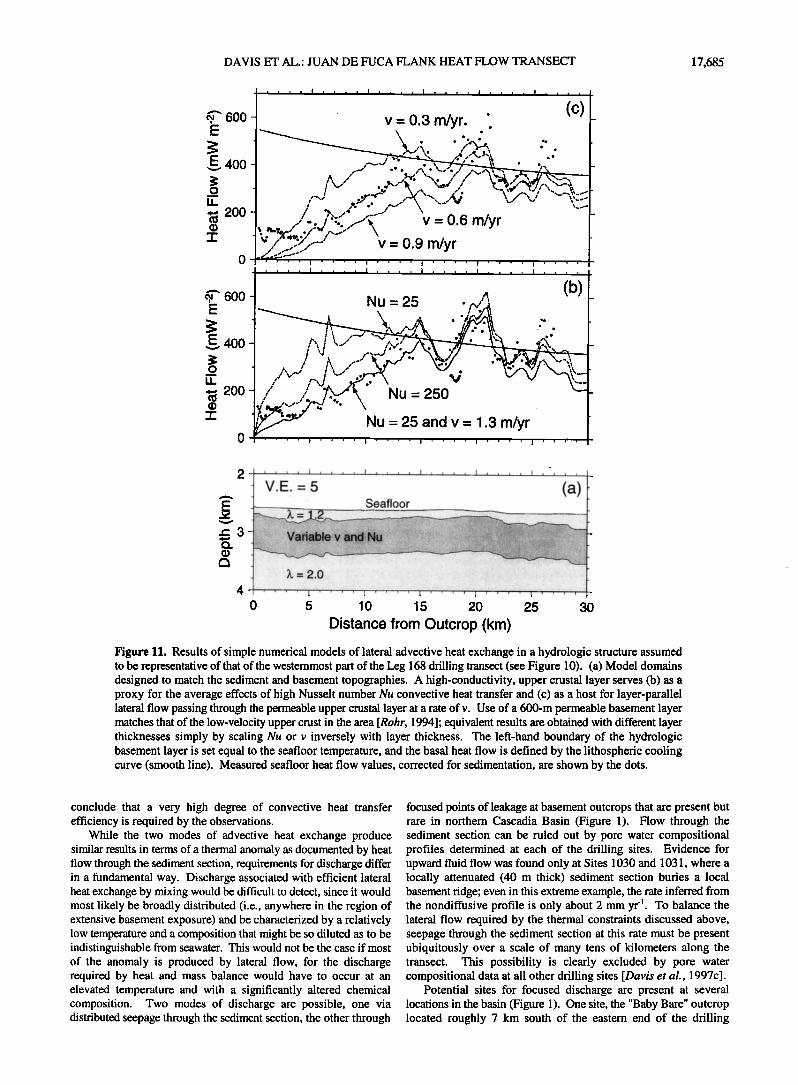
Shipboard data have been used in the compilation with no corrections beyond the elimination of isolated and unreasonably low velocity and conductivity values. No attempt has been made to weight the values according to lithologic representation, with the exception of the upper 150 m of section at the eastern sites. There, the section was grossly undersampled because of a massive sandy unit, and an attempt was made to force the linear (constant heat flow) fit made through deeper temperature versus thermal resistance data through the seafloor temperature (1.7øC; see Figure 9).
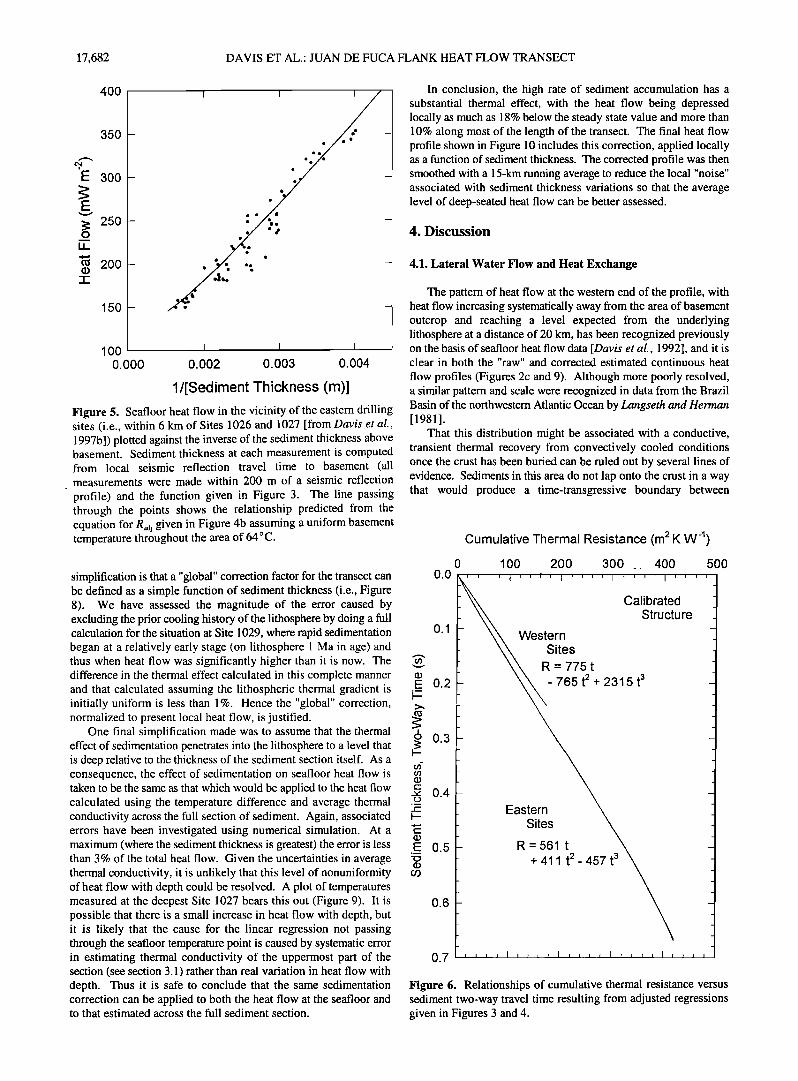
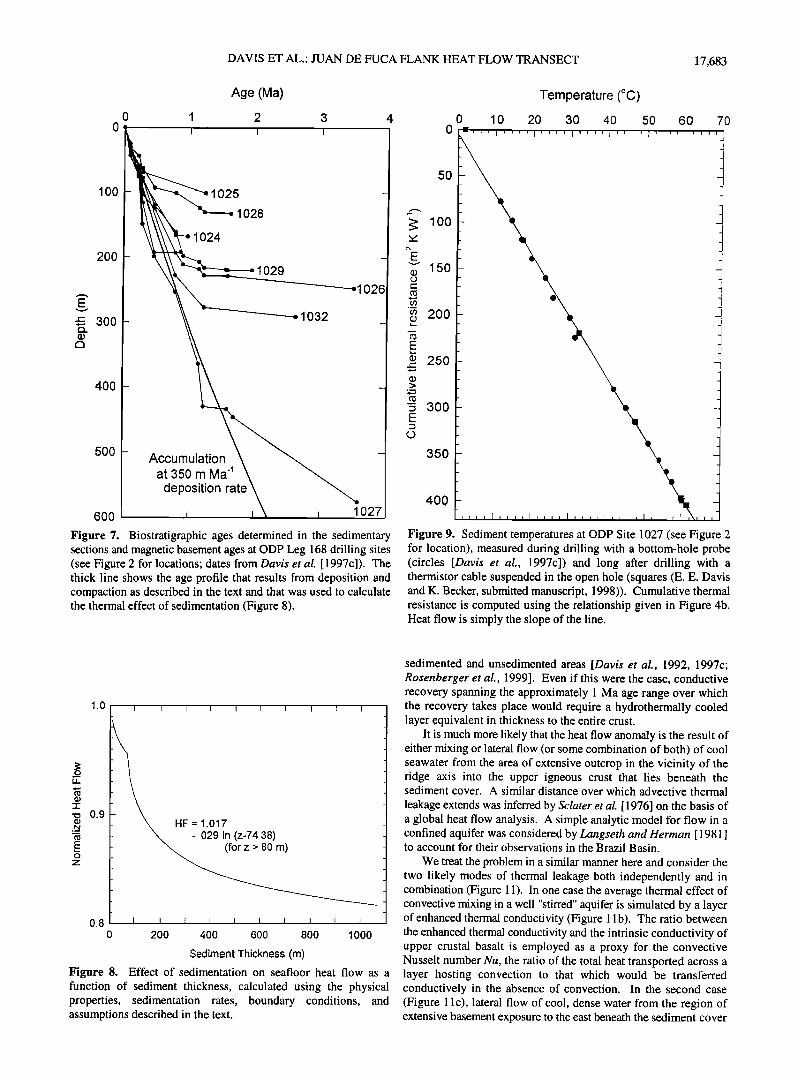
Shipboard data are shown in Figures 3 and 4 by small points. Cumulative thermal resistance and average seismic velocity (shown equivalently as two-way time) are computed from the individual measurements weighted by the depth intervals between them. These profiles and polynomial regression fits to them (nearly indistinguishable) are shown as solid lines. Shown also are adjusted regressions (dashed lines) forced through the constraints as discussed in the previous section. In the case of the average velocity, this is straightforward: The curves have been adjusted to pass through the observed travel times and corresponding depths shown by the large circles. In the case of the thermal resistance profiles, the correction has been done to ensure that the values of heat flow, computed by dividing the local basement-to-seafloor temperature change by the cumulative thermal resistance, agrees with the local seafloor values (Figure 2c). A more general check on the reasonableness of the fit for the eastern sites is illustrated in Figure 5, where seafloor heat flow values in the vicinity of Sites 1026 and 1027 (i.e., within roughly 5 km; see Figure 1 of Davis et al. [ 1997a]) are plotted against the inverse of the local sediment thickness (determined from local travel time) and compared to the relationship predicted from the adjusted resistance versus depth profiles (Figure 4). The agreement provides a check on both the physical properties versus depth relationships and the assumption that the basement surface is approximately isothermal over the substantial range of sediment thickness present in this area.
The differences between the physical properties of the eastern and western parts of the transect are apparent in Figures 3 and 4. Seismic velocities and thermal conductivities are higher in the east
17,680 DAVIS ET AL.' JUAN DE FUCA FLANK HEAT FLOW TRANSECT
lOO
200
Velocity (km s -1) b Velocity (km s -1) 1.4 1.6 1'.8 2,0 2.0
0 ,
ß ß ß ß
ß eß e e ß
eeß eee • ß ee
ß
ß ß ß©
ß ß \ ß ß
ß
ß ß©
ß ß ee ee ß •:'' ed• ß ß ß
•b 3 e • ß ß e ß
e•e ß ß e ß ß ß ß ..- ..
ß O
ß ß ee d • ßeee
.•' ß ß t
e q, ß
ß
ß ß
ß
ßß
(a) Western sites
\
Zad j = 817 t +98t 2 _ 81t 3
Z •
778 t +93t 2
ß - 77 t 3
1.4 o
lOO
•, 200- o o -
(o 300-
o (D _
•- 400-
500 -
_
600 -
1'8 i ß ß ß1
to ß ßß ß
ßß
1.6
ß ß
ß
•, '****ß ß ß ß
ß ßß
ø' z=815t - 94 t 2
"•'" • + 163 t 3 e•e•e• ß ee• • x
, ';..o. '.\ ß \
ß *• ,•%** 957 t • ß ...% ß \ + 187 t 3
ß ßß
ß . ,.z., ß ß ß ß
(b) Eastern sites \ I I I
0.0 0.1 0.2 0.0 0.1 0.2 0.3 0.4 0.5 0.6 0.7
Two-Way Time (s) Two-Way Time (s) Figure 3. ODP shipboard seismic velocity measurements on cores recovered from the (a) western and (b) eastern Leg 168 drilling sites (Sites 1023-1025 and Sites 1026 and 1027, respectively [Davis et al., 1997c]) (small circles). A line shows two-way travel time computed by assuming that individual velocity values are representative of the depth intervals that separate them. A third-order polynomial fit to the first is indistinguishable from the computed line shown. The dashed line shows the polynomial fit adjusted with a multiplier that causes it to pass through the observed seismic reflection travel time and drilled depths to basement at each of the drilling sites (large circles). The raw and adjusted regressions are also given.
than in the west at any given depth. In addition, the systematic sampling bias implied by the greater correction factors applied is greater in the east than the west. For example, the adjustment to the average velocity profile ranges from 3% in the west, to 7% for the central sites (1028, 1029, and 1032, not shown), and to 13% at Sites 1026 and 1027. These trends are consistent with the systematic differences in lithology and associated differences in core disturbance and sampling bias from west to east and justify the decision made to group the data.
The final relationships between cumulative thermal resistance and travel time that are used with basement temperatures to calculate heat flow differ little from west to east, and the relationships are remarkably linear over the full range of travel time thickness sampled by drilling (Figure 6). This is a consequence of the similar effects of lithology on thermal conductivity and velocity; increases in sand content and decreases in porosity increase the values of both of these physical properties, and hence the cumulative thermal resistance for any given travel time is similar for both areas. For calculating heat flow, the two relationships derived from the eastern and western sites were used for the western and eastern ends of the line, respectively; the results were merged near Site 1028.
3.2. A Continuous Profile of Seafloor Heat Flow 3.2.1. Estimated seafloor heat flow. The continuous profile of
heat flow, computed from the distribution of basement temperatures, sediment seismic travel time thickness, and sediment physical properties, is shown in Figure 2c. Local variability associated with sediment thickness variations is apparent along the full length of the line. The quality of the physical property calibration is seen by the excellent match between the seafloor heat flow observations (points) and the estimated heat flow profile, including the two isolated measurements in the central part of the transect (55 and 88 km east of the ridge axis) that were not used in the calibration process.
3.2.2. Sedimentation effects and a corrected heat flow profile. Before this profile can be accepted as being representative of the local, deep-seated heat flow along the transect, one final step is necessary, which is to determine the thermal influence of the rapid sedimentation characteristic of this region. A simple description of this history has been used to calculate numerically a thermal correction factor that accounts for the transient conditions of a
growing sediment section deposited on a half-space (basement) having an initially uniform heat flow (similar to calculations of Hutchison [ 1985]).
DAVIS ET AL.: JUAN DE FUCA FLANK HEAT FLOW TRANSECT 17,681
lOO
2oo
0.5 0
Conductivity (W m'lK -1) b 1.0 1.5 4. 2.0 2.5
ß
t o. (a) Western sites
R = 0.986 z - 1.27 x 10 -3 Z 2 + 4.28 x 10 .6 Z 3
Rad j - .947 z \
ß -1.22 x 10 '3 z 2 + 4.11 x 10.6 z 3 I I
lOO
200
300
400
500
600
0 100 150 200 0
Cumulative Thermal Resistance (m2K W -1)
0.5 0
Conductivity (W m-lK -1) 1.0 1.5 -' 2.0 2.5
1 i • •1111!• % •1• '111 lß i [ i •' I •1, I i I [ I t.. .... •.. .. .
ß ee • ß ß ß ß ß ß e ß ß ß ß ß ...1,'•......ß ß ..- . . -,• ß ß ß ß •e' ß ß ß ee
-- •• ß ß ß Ii ii ß ß ! _ - :, - - v ,•,• ..... .
ß '.''•X•'*' R=0.701 z - 'Z'•\."-•, ' +618x10-"z 2 ß ß •'ß •'• ß ' -v ,,',,• . •,-•-7_3
e4. ß e• -/.•QX /U
.,.'o. *.• \ R ..=0.603z e•lae. ß e e '- \ •' aaj , ,. -I ß '.;.q=' ß .\ + x lO z /
ß .'.. '..'... • •-6.84 x 10 '7 z•J ß ';."."' ', /
'"' t ß :- .... \ \ / -= \
,:'- \ \ / '•* , • \ /
(b) Eastern sites . ' • •, _• 100 200 300 400 500
Cumulative Thermal Resistance (m2K W -•) Figure 4. Same as Figure 3, except for shipboard thermal conductivity measurements. Regressions for cumulative thermal resistance as a function of depth have been adjusted so that the heat flow computed as the quotient of the temperature difference from basement to the seafloor and the cumulative thermal resistance to basement equals the observed seafloor heat flow at the sites (dashed lines).
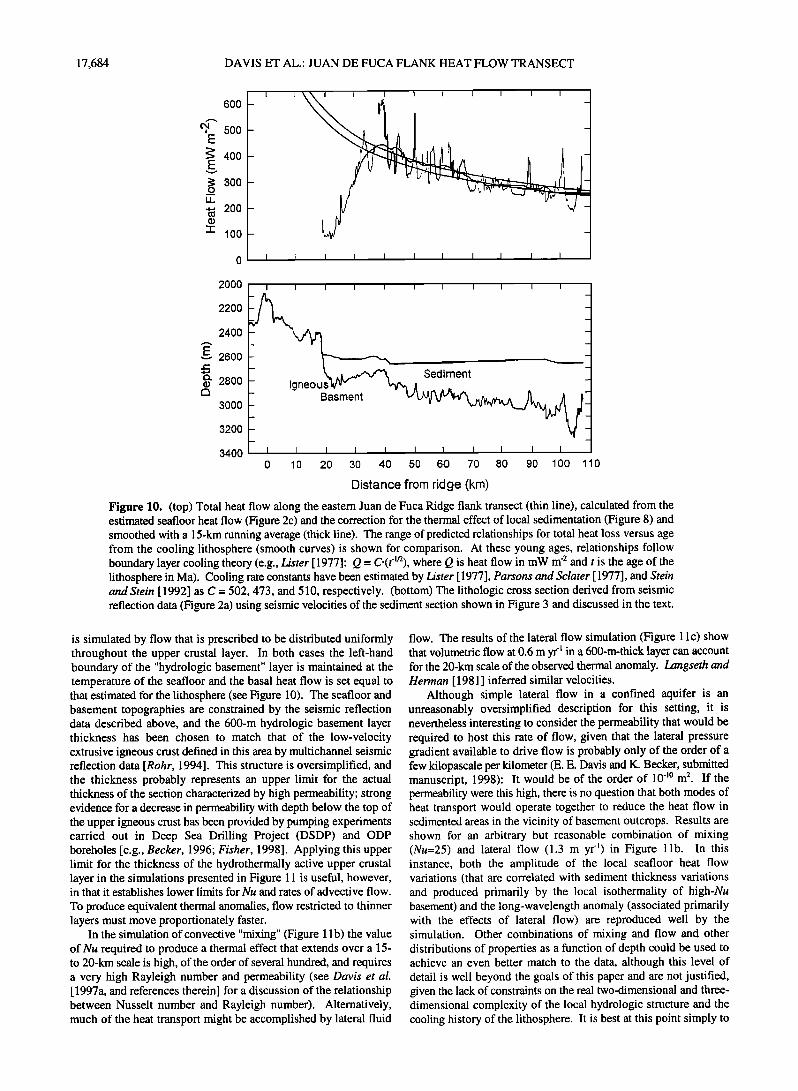
Biostratigraphy and magnetic basement ages at each of the drilling sites define a relatively simple sedimentation history along the transect (Figure 7). Sedimentation began slowly at each site until some tens of meters of sediment had accumulated. The amount of this early accumulation varies, depending on the local basement topography (buried ridges have a longer history of slow accumulation than adjacent valleys) and on the crustal age (sediment supply was lower in pre-Pleistocene times), although the variation is relatively small and has small thermal consequences. Higher in the sections, the rates are seen to have increased relatively abruptly. In the case of Site 1027, where basement is both the oldest and deepest, the change in rate probably occurred near the Plio-Pleistocene boundary (approximately 2 Ma). At all other sites it occurred within the Pleistocene, presumably at times when the crust and its slowly deposited hemipelagic cover locally had subsided below the base level of turbidite deposition in the basin. The rate of sediment accumulation above this stratigraphic level has been remarkably similar from site to site, roughly 300 m Myr".
Physical properties and the effects of compaction on physical properties and accumulation rate were calculated using a porosity- depth (•-z) profile appropriate for the drilled section of • = 0.7 e -z/•2øø and a grain thermal conductivity of 2.3 W m" K '•. Deposition of the first 50 m of sediment was assumed to have begun well after the igneous crust was formed at a rate of 150 m Ma 4 on basement having a thermal conductivity of 2.0 W m -• K -' and an initially uniform gradient. Deposition was assumed to have then
continued at a rate of 350 m Ma 4. This yields an average accumulation rate after compaction that matches well the age constraints provided by the drilling results (i.e., an accumulation rate of nominally 300 m Ma4; Figure 7).
The transient effect on heat flow at the seafloor is shown as a function of sediment accumulation in Figure 8. The initial period of slow deposition is seen to have a relatively small thermal effect (a few percent), whereas additional accumulation of rapidly deposited sediment depresses the seafloor heat flow almost immediately by 10 to 15%.
Several factors have been ignored in calculating this thermal sedimentation correction, although the effect of each has been checked and determined to be small or insignificant. For example, the correction does not include the effects of a high-permeability, upper crustal layer where heat is transferred convectively with great efficiency. While this effect can be important for short periods of time in hydrothermally active areas having a robust heat supply [e.g., Wang and Davis, 1992], it cannot be significant in a ridge flank environment, since the heat supply beneath the permeable upper crust is ultimately limited by conduction. This was verified with a sedimentation simulation that included a high-conductivity upper crustal layer (as a proxy for a layer characterized by a high Nusselt number); results were indistinguishable from those presented below.
'The correction also does not include the secondary transient associated with the cooling lithosphere. The advantage to this
17,682 DAVIS ET AL.' JUAN DE FUCA FLANK HEAT FLOW TRANSECT
400
35O
t;:: 300
E
• 250 o
m 200
150 -
100 0.000
I
ß e#
I I I
0.002 0.003 0.004
I/[Sediment Thickness (m)] Figure 5. Seafloor heat flow in the vicinity of the eastern drilling sites (i.e., within 6 km of Sites 1026 and 1027 [from Davis et al., 1997b]) plotted against the inverse of the sediment thickness above basement. Sediment thickness at each measurement is computed from local seismic reflection travel time to basement (all measurements were made within 200 m of a seismic reflection profile) and the function given in Figure 3. The line passing through the points shows the relationship predicted from the equation for Radj given in Figure 4b assuming a uniform basement temperature throughout the area of 64øC.
simplification is that a "global" correction factor for the transect can be defined as a simple function of sediment thickness (i.e., Figure 8). We have assessed the magnitude of the error caused by excluding the prior cooling history of the lithosphere by doing a full calculation for the situation at Site 1029, where rapid sedimentation began at a relatively early stage (on lithosphere 1 Ma in age) and thus when heat flow was significantly higher than it is now. The difference in the thermal effect calculated in this complete manner and that calculated assuming the lithospheric thermal gradient is initially uniform is less than 1%. Hence the "global" correction, normalized to present local heat flow, is justified.
One final simplification made was to assume that the thermal effect of sedimentation penetrates into the lithosphere to a level that is deep relative to the thickness of the sediment section itself. As a consequence, the effect of sedimentation on seafloor heat flow is taken to be the same as that which would be applied to the heat flow calculated using the temperature difference and average thermal conductivity across the full section of sediment. Again, associated errors have been investigated using numerical simulation. At a maximum (where the sediment thickness is greatest) the error is less than 3% of the total heat flow. Given the uncertainties in average thermal conductivity, it is unlikely that this level of nonuniformity of heat flow with depth could be resolved. A plot of temperatures measured at the deepest Site 1027 bears this out (Figure 9). It is possible that there is a small increase in heat flow with depth, but it is likely that the cause for the linear regression not passing through the seafloor temperature point is caused by systematic error in estimating thermal conductivity of the uppermost part of the section (see section 3.1) rather than real variation in heat flow with depth. Thus it is safe to conclude that the same sedimentation correction can be applied to both the heat flow at the seafloor and to that estimated across the full sediment section.
In conclusion, the high rate of sediment accumulation has a substantial thermal effect, with the heat flow being depressed locally as much as 18% below the steady state value and more than 10% along most of the length of the transect. The final heat flow profile shown in Figure 10 includes this correction, applied locally as a function of sediment thickness. The corrected profile was then smoothed with a 15-km running average to reduce the local "noise" associated with sediment thickness variations so that the average level of deep-seated heat flow can be better assessed.
4. Discussion
4.1. Lateral Water Flow and Heat Exchange
The pattern of heat flow at the western end of the profile, with heat flow increasing systematically away from the area of basement outcrop and reaching a level expected from the underlying lithosphere at a distance of 20 km, has been recognized previously on the basis of seafloor heat flow data [Davis et al., 1992], and it is clear in both the "raw" and corrected estimated continuous heat flow profiles (Figures 2c and 9). Although more poorly resolved, a similar pattern and scale were recognized in data from the Brazil Basin of the northwestern Atlantic Ocean by Langseth and Herman []98]].
That this distribution might be associated with a conductive, transient thermal recovery from convectively cooled conditions once the crust has been buried can be ruled out by several lines of evidence. Sediments in this area do not lap onto the crust in a way that would produce a time-transgressive boundary between
Cumulative Thermal Resistance (m2K W -•)
0.4
0.5
0 100 200 300 4. 400 500 0.0
•_ • Structure 0.1 ]_ xx• Western t • Sites [ x,,• R= 775t
0.2 -765 t2+ 2315 t 3
0.3 Eastern
Sites • R=561 t • -
+41
_
0.6
0.7
Figure 6. Relationships of cumulative thermal resistance versus sediment two-way travel time resulting from adjusted regressions given in Figures 3 and 4.
DAVIS ET AL.' JUAN DE FUCA FLANK HEAT FLOW TRANSECT 17,683
Age (Ma) 2 I
3 4
100
2OO
300
1025
1028
1024
1029
1032
-,1026
400
5OO Accumulation
at 350 m Ma '• deposition rate
600 • • 1027 Figure 7. Biostratigraphic ages determined in the sedimentary sections and magnetic basement ages at ODP Leg 168 drilling sites (see Figure 2 for locations; dates from Davis et al. [1997c]). The thick line shows the age profile that results from deposition and compaction as described in the text and that was used to calculate the thermal effect of sedimentation (Figure 8).
5O
• lOO
E • 150
.m
8 200
• 250
'5 300 E
350
4OO
Temperature (øC) 0 10 20 30 40 50 6o 7o
t
I
-
-
-
_
_
-
-
_
_
-
'1'
Figure 9. Sediment temperatures at ODP Site 1027 (see Figure 2 for location), measured during drilling with a bottom-hole probe (circles [Davis et al., 1997c]) and long after drilling with a thermistor cable suspended in the open hole (squares (E. E. Davis and K. Becker, submitted manuscript, 1998)). Cumulative thermal resistance is computed using the relationship given in Figure 4b. Heat flow is simply the slope of the line.
1.0
HF = 1.017
• -.029 In (z-74.38)
0 200 400 600 800 1000
Sediment Thickness (m) Figure 8. Effect of sedimentation on seafloor heat flow as a function of sediment thickness, calculated using the physical properties, sedimentation rates, boundary conditions, and assumptions described in the text.
sedimented and unsedimented areas [Davis et al., 1992, 1997c; Rosenberger et al., 1999]. Even if this were the case, conductive recovery spanning the approximately 1 Ma age range over which the recovery takes place would require a hydrothermally cooled layer equivalent in thickness to the entire crust.
It is much more likely that the heat flow anomaly is the result of either mixing or lateral flow (or some combination of both) of cool seawater from the area of extensive outcrop in the vicinity of the ridge axis into the upper igneous crust that lies beneath the sediment cover. A similar distance over which advective thermal leakage extends was inferred by Sclater et al. [ 1976] on the basis of a global heat flow analysis. A simple analytic model for flow in a confined aquifer was considered by Langseth and Herman [ 1981 ] to account for their observations in the Brazil Basin.
We treat the problem in a similar manner here and consider the two likely modes of thermal leakage both independently and in combination (Figure 11). In one case the average thermal effect of convective mixing in a well "stirred" aquifer is simulated by a layer of enhanced thermal conductivity (Figure 11 b). The ratio between the enhanced thermal conductivity and the intrinsic conductivity of upper crustal basalt is employed as a proxy for the convective Nusselt number Nu, the ratio of the total heat transported across a layer hosting convection to that which would be transferred conductively in the absence of convection. In the second case (Figure 11 c), lateral flow of cool, dense water from the region of extensive basement exposure to the east beneath the sediment cover
17,684 DAVIS ET AL.' JUAN DE FUCA FLANK HEAT FLOW TRANSECT
6OO
, 500 E • 400 E
v
• 300 o
-,-- 200
1- 100
i\\ i I i I i i i I
• I I I I I I I I ! J
2OOO
2200
24OO
26OO
2800
3000
3200
3400
- k• ,• • Sediment - Igneousk/v" • /I . _.
0 10 20 30 40 50 60 70 80 90 100 110
Distance from ridge (km)
Figure 10. (top) Total heat flow along the eastern Juan de Fuca Ridge flank transect (thin line), calculated from the estimated seafloor heat flow (Figure 2c) and the correction for the thermal effect of local sedimentation (Figure 8) and smoothed with a 15-km running average (thick line). The range of predicted relationships for total heat loss versus age from the cooling lithosphere (smooth curves) is shown for comparison. At these young ages, relationships follow boundary layer cooling theory (e.g., Lister [ 1977]: Q = C.(rm), where Q is heat flow in mW m '2 and t is the age of the lithosphere in Ma). Cooling rate constants have been estimated by Lister [ 1977], Parsons and Sclater [ 1977], and Stein and Stein [ 1992] as C = 502, 473, and 510, respectively. (bottom) The lithologic cross section derived from seismic reflection data (Figure 2a) using seismic velocities of the sediment section shown in Figure 3 and discussed in the text.
is simulated by flow that is prescribed to be distributed uniformly throughout the upper crustal layer. In both cases the left-hand boundary of the "hydrologic basement" layer is maintained at the temperature of the seafloor and the basal heat flow is set equal to that estimated for the lithosphere (see Figure 10). The seafloor and basement topographies are constrained by the seismic reflection data described above, and the 600-m hydrologic basement layer thickness has been chosen to match that of the low-velocity extrusive igneous crust defined in this area by multichannel seismic reflection data [Rohr, 1994]. This structure is oversimplified, and the thickness probably represents an upper limit for the actual thickness of the section characterized by high permeability; strong evidence for a decrease in permeability with depth below the top of the upper igneous crust has been provided by pumping experiments carried out in Deep Sea Drilling Project (DSDP) and ODP boreholes [e.g., Becker, 1996; Fisher, 1998]. Applying this upper limit for the thickness of the hydrothermally active upper crustal layer in the simulations presented in Figure 11 is useful, however, in that it establishes lower limits for Nu and rates of advective flow. To produce equivalent thermal anomalies, flow restricted to thinner layers must move proportionately faster.
In the simulation of convective "mixing" (Figure 11 b) the value of Nu required to produce a thermal effect that extends over a 15- to 20-km scale is high, of the order of several hundred, and requires a very high Rayleigh number and permeability (see Davis et al. [ 1997a, and references therein] for a discussion of the relationship between Nusselt number and Rayleigh number). Alternatively, much of the heat transport might be accomplished by lateral fluid
flow. The results of the lateral flow simulation (Figure 11 c) show that volumetric flow at 0.6 m yr 4 in a 600-m-thick layer can account for the 20-km scale of the observed thermal anomaly. Langseth and Herman [ 1981 ] inferred similar velocities.
Although simple lateral flow in a confined aquifer is an unreasonably oversimplified description for this setting, it is nevertheless interesting to consider the permeability that would be required to host this rate of flow, given that the lateral pressure gradient available to drive flow is probably only of the order of a few kilopascale per kilometer (E. E. Davis and K. Becker, submitted manuscript, 1998): It would be of the order of 10 '20 m 2. If the permeability were this high, there is no question that both modes of heat transport would operate together to reduce the heat flow in sedimented areas in the vicinity of basement outcrops. Results are shown for an arbitrary but reasonable combination of mixing (Nu=25) and lateral flow (1.3 m yr 4) in Figure 1 lb. In this instance, both the amplitude of the local seafloor heat flow variations (that are correlated with sediment thickness variations and produced primarily by the local isothermality of high-Nu basement) and the long-wavelength anomaly (associated primarily with the effects of lateral flow) are reproduced well by the simulation. Other combinations of mixing and flow and other distributions of properties as a function of depth could be used to achieve an even better match to the data, although this level of detail is well beyond the goals of this paper and are not justified, given the lack of constraints on the real two-dimensional and three- dimensional complexity of the local hydrologic structure and the cooling history of the lithosphere. It is best at this point simply to
DAVIS ET AL.: JUAN DE FUCA FLANK HEAT FLOW TRANSECT 17,685
600 v = 0.3 m/yr. : (c) ^ /'-" / . 400 .:- ,,..
ß ,""-'" -.,,";'C.,
-4 / -, ,•' ' _;" \ / /-. ,,-•: .--'•- v = 0.6 m/yr J• ,"-•;;...,--%,,,,-' \ • ,o .•., , ! "'""'-' v = 0.9 m/yr ._/_'.-....-._.,.-..•---' I
600 • Nu = 25 A (b) 1 -• .• • ../,•.•,• 1 ß. I 1 '..,: ,,---; -.-•.,''.• ,,,.. 400 -• -;"-"'--" "'-:; • • ' I
i 4 ,, / /',, ,,,'-' ',,• • ', r•'/%"-\• / * / "'%__
200 4 / / "-*/,,,..,zi• - kl,, _ o•,',, '--' / :' _ _/._ I'.."• \ I•u:,,,'•u
0
'•:•--'•-• - -- ........ ....... .•.... . ............ • ................... ,!--•!•.;:f..:.,?•i,:•?•:•:.::.?i;:.•-•i•:::..• •:
10 15 20 25 :30 Distance from Outcrop (kin)
Figure 11. Results of simple numerical models of lateral advective heat exchange in a hydrologic structure assumed to be representative of that of the westernmost part of the Leg 168 drilling transect (see Figure 10). (a) Model domains designed to match the sediment and basement topographies. A high-conductivity, upper crustal layer serves (b) as a proxy for the average effects of high Nusselt number Nu convective heat transfer and (c) as a host for layer-parallel lateral flow passing through the permeable upper crustal layer at a rate of v. Use of a 600-m permeable basement layer matches that of the low-velocity upper crust in the area [Rohr, 1994]; equivalent results are obtained with different layer thicknesses simply by scaling Nu or v inversely with layer thickness. The left-hand boundary of the hydrologic basement layer is set equal to the seafloor temperature, and the basal heat flow is defined by the lithospheric cooling curve (smooth line). Measured seafloor heat flow values, corrected for sedimentation, are shown by the dots.
conclude that a very high degree of convective heat transfer efficiency is required by the observations.
While the two modes of advective heat exchange produce similar results in terms of a thermal anomaly as documented by heat flow through the sediment section, requirements for discharge differ in a fundamental way. Discharge associated with efficient lateral heat exchange by mixing would be difficult to detect, since it would most likely be broadly distributed (i.e., anywhere in the region of extensive basement exposure) and be characterized by a relatively low temperature and a composition that might be so diluted as to be indistinguishable from seawater. This would not be the case if most of the anomaly is produced by lateral flow, for the discharge required by heat and mass balance would have to occur at an elevated temperature and with a significantly altered chemical composition. Two modes of discharge are possible, one via distributed seepage through the sediment section, the other through
focused points of leakage at basement outcrops that are present but rare in northern Cascadia Basin (Figure 1). Flow through the sediment section can be ruled out by pore water compositional profiles determined at each of the drilling sites. Evidence tbr upward fluid flow was found only at Sites 1030 and 1031, where a locally attenuated (40 m thick) sediment section buries a local basement ridge; even in this extreme example, the rate inferred from the nondiffusive profile is only about 2 mm yr -•. To balance the lateral flow required by the thermal constraints discussed above, seepage through the sediment section at this rate must be present ubiquitously over a scale of many tens of kilometers along the transect. This possibility is clearly excluded by pore water compositional data at all other drilling sites [Davis et ai., 1997c].
Potential sites for focused discharge are present at several locations in the basin (Figure 1). One site, the "Baby Bare" outcrop located roughly 7 km south of the eastern end of the drilling
17,686 DAVIS ET AL.' JUAN DE FUCA FLANK HEAT FLOW TRANSECT
transect (directly on strike from drilling Site 1026), provides clear evidence for focused flow. Pore fluid compositional profiles, heat flow data, and water column anomalies constrain the total thermal output from this small edifice (diffuse and focused flow) to be of the order of 2-3 MW [e.g., Mottl et al., 1998; Thomson et al., 1995]. On the basis of their thermal structure, two larger outcrops that lie to the north of the transect (Figure 1) are also known to be points of discharge [Davis et al., 1992], although the advected heat or chemical fluxes through these edifices have not been determined [Wheat et al., 1997]. The next closest possible point of discharge that is known lies about 40 km to the south (Figure 1). Another, much farther to the west, lies along the buffed ridge where Sites 1030 and 1031 are located. No thermal or chemical data have been collected at these latter two sites, but discharge is likely.
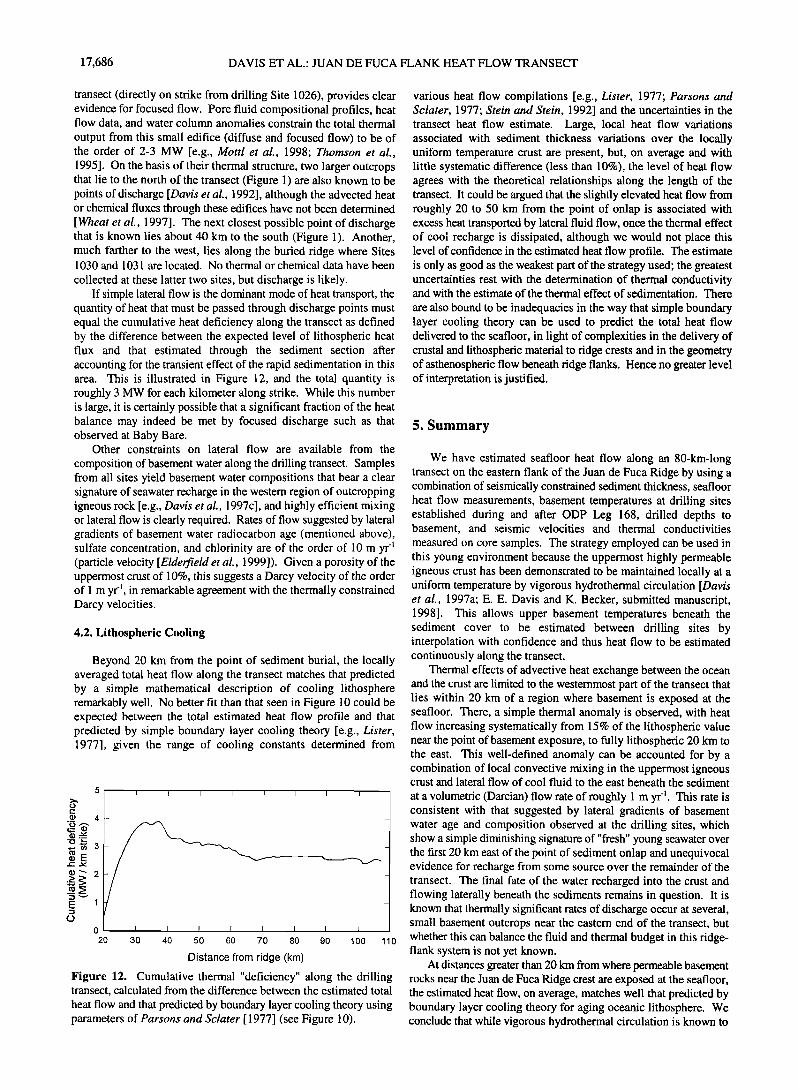
If simple lateral flow is the dominant mode of heat transport, the quantity of heat that must be passed through discharge points must equal the cumulative heat deficiency along the transect as defined by the difference between the expected level of lithospheric heat flux and that estimated through the sediment section after accounting for the transient effect of the rapid sedimentation in this area. This is illustrated in Figure 12, and the total quantity is roughly 3 MW for each kilometer along strike. While this number is large, it is certainly possible that a significant fraction of the heat balance may indeed be met by focused discharge such as that observed at Baby Bare.
Other constraints on lateral flow are available from the composition of basement water along the drilling transect. Samples from all sites yield basement water compositions that bear a clear signature of seawater recharge in the western region of outcropping igneous rock [e.g., Davis et al., 1997c], and highly efficient mixing or lateral flow is clearly required. Rates of flow suggested by lateral gradients of basement water radiocarbon age (mentioned above), sulfate concentration, and chlorinity are of the order of 10 m yr 4 (particle velocity [Elderfield et al., 1999]). Given a porosity of the uppermost crust of 10%, this suggests a Darcy velocity of the order of 1 m yr -l, in remarkable agreement with the thermally constrained Darcy velocities.
4.2. Lithospheric Cooling
Beyond 20 km from the point of sediment burial, the locally averaged total heat flow along the transect matches that predicted by a simple mathematical description of cooling lithosphere remarkably well. No better fit than that seen in Figure 10 could be expected between the total estimated heat flow profile and that predicted by simple boundary layer cooling theory [e.g., Lister, 1977], given the range of cooling constants determined from
5
o 2o 30 40 50 60 70 80 90 lOO 1
Distance from ridge (km)
Figure 12. Cumulative thermal "deficiency" along the drilling transect, calculated from the difference between the estimated total heat flow and that predicted by boundary layer cooling theory using parameters of Parsons and Sclater [ 1977] (see Figure 10).
various heat flow compilations [e.g., Lister, 1977; Parsons and Sclater, 1977; Stein and Stein, 1992] and the uncertainties in the transect heat flow estimate. Large, local heat flow variations associated with sediment thickness variations over the locally uniform temperature crust are present, but, on average and with little systematic difference (less than 10%), the level of heat flow agrees with the theoretical relationships along the length of the transect. It could be argued that the slightly elevated heat flow from roughly 20 to 50 km from the point of onlap is associated with excess heat transported by lateral fluid flow, once the thermal effect of cool recharge is dissipated, although we would not place this level of confidence in the estimated heat flow profile. The estimate is only as good as the weakest part of the strategy used; the greatest uncertainties rest with the determination of thermal conductivity and with the estimate of the thermal effect of sedimentation. There are also bound to be inadequacies in the way that simple boundary layer cooling theory can be used to predict the total heat flow delivered to the seafloor, in light of complexities in the delivery of crustal and lithospheric material to ridge crests and in the geometry of asthenospheric flow beneath ridge flanks. Hence no greater level of interpretation is justified.
5. Summary
We have estimated seafloor heat flow along an 80-km-long transect on the eastern flank of the Juan de Fuca Ridge by using a combination of seismically constrained sediment thickness, seafloor heat flow measurements, basement temperatures at drilling sites established during and after ODP Leg 168, drilled depths to basement, and seismic velocities and thermal conductivities measured on core samples. The strategy employed can be used in this young environment because the uppermost highly permeable igneous crust has been demonstrated to be maintained locally at a uniform temperature by vigorous hydrothermal circulation [Davis et al., 1997a; E. E. Davis and K. Becker, submitted manuscript, 1998]. This allows upper basement temperatures beneath the sediment cover to be estimated between drilling sites by interpolation with confidence and thus heat flow to be estimated continuously along the transect.
Thermal effects of advective heat exchange between the ocean and the crust are limited to the westernmost part of the transect that lies within 20 km of a region where basement is exposed at the seafloor. There, a simple thermal anomaly is observed, with heat flow increasing systematically from 15% of the lithospheric value near the point of basement exposure, to fully lithospheric 20 km to the east. This well-defined anomaly can be accounted for by a combination of local convective mixing in the uppermost igneous crust and lateral flow of cool fluid to the east beneath the sediment at a volumetric (Darcian) flow rate of roughly 1 m yr 4. This rate is consistent with that suggested by lateral gradients of basement water age and composition observed at the drilling sites, which show a simple diminishing signature of "fresh" young seawater over the first 20 km east of the point of sediment onlap and unequivocal evidence for recharge from some source over the remainder of the transect. The final fate of the water recharged into the crust and flowing laterally beneath the sediments remains in question. It is known that thermally significant rates of discharge occur at several, small basement outcrops near the eastern end of the transect, but whether this can balance the fluid and thermal budget in this ridge- flank system is not yet known.
At distances greater than 20 km from where permeable basement rocks near the Juan de Fuca Ridge crest are exposed at the seafloor, the estimated heat flow, on average, matches well that predicted by boundary layer cooling theory for aging oceanic lithosphere. We conclude that while vigorous hydrothermal circulation is known to
DAVIS ET AL.: JUAN DE FUCA FLANK HEAT FLOW TRANSECT 17,687
persist in the igneous crust beneath the sediments along the full length of the transect and that significant geochemical exchange with the ocean must take place, this circulation must be thermally fully isolated from the effects of advective exchange between the ocean and the crust.
Once hydrothermal isolation is complete, basement temperatures can be estimated in young ridge-flank environments like this one by inverting the strategy used to estimate heat flow. Predictions of upper basement temperature are potentially useful for providing technological constraints for in situ borehole experiments, for considering microbiological habitats, and for estimating basement water compositions and rock-alteration conditions. This has been done for a short section east of the ODP Leg 168 transect, where seismic reflection but no drilling data exist; the results are shown in Figure 2b. This prediction employs the physical property profile of Figure 6 extrapolated to greater depths, the lithospheric heat flow of Parsons and Sclater [1977], the sedimentation correction discussed in section 3, and a hydrothermal "homogenization" scale of 15 km, over which locally estimated basement temperatures are averaged. East of the oldest drilling sites, basement subsidence associated with lithospheric cooling is augmented by loading by the Cascadia accretionary prism; the rapidly increasing thickness of sediment causes basement temperatures to climb sharply. This trend must continue to the accretionary prism itself, for the decreasing heat flow from the aging Juan de Fuca plate is more than balanced by the increase in thickness of the thermally resistive sediment blanket.
Acknowledgments. It should be noted that the heat flow age relationship for lithospheric cooling, which is matched so well by the Juan de Fuca Ridge flank transect, as well as estimates of the lateral scale of the influence of advective heat exchange, were established more than 2 decades ago [e.g., Lister, 1972, 1977; Sclater et al., 1976; Langseth and Herman, 1981]. Given the sparse distribution and often poor quality of the observations on which those inferences were drawn, much credit must be given to the judgement of the investigators who drew them. We would also like to credit the work of many individuals who have been involved in the current work through instrument development, seagoing data collection, and shipboard operations on the research vessels Par&eau, Tully, and Atlantis, and the drilling vessel JOIDES Resolution. Funding for the work was provided through grants from the National Science Foundation, Deutsche Forschungsgemeinschaft, and Geological Survey of Canada. GSC Contribution Number 1998209.
References
Baker, P. A., M. P. Stout, M. Kastner, and H. Elderfield, Large-scale lateral advection of seawater through oceanic crust in the central equatorial Pacific, Earth Planet. Sci. Lett., 105, 522-533, 1991.
Becker, K., Permeability measurements in Hole 896A and implications for the lateral variability of upper crustal permeability at Sites 504 and 896, Proc. Ocean Drill. Program Sci. Results, 148, 353-363, 1996.
Davis, E. E., and D. S. Chapman, Problems with imaging cellular hydrothermal convection in oceanic crust, Geophys. Res. Lett., 23, 3551- 3554, 1996.
Davis, E. E., and C. R. B. Lister, Heat flow measured over the Juan de Fuca Ridge: Evidence for widespread hydrothermal circulation in a highly heat transportive crust, J. Geophys. Res., 82, 4845-4860, 1977.
Davis, E. E., D. S. Chapman, C. B. Forster, and H. Villinger, Heat-flow variations correlated with buried basement topography on the Juan de Fuca Ridge flank, Nature, 342, 533-537, 1989.
Davis, E. E., et al., FlankFlux: An experiment to study the nature of hydrothermal circulation in young oceanic crust, Can. J. Earth Sci., 29, 925- 952, 1992.
Davis, E. E., D. S. Chapman, and C. B. Forster, Observations concerning the vigor of hydrothermal circulation in young oceanic crust, J. Geophys. Res., 101, 2927- 2942, 1996.
Davis, E. E., K. Wang, J. He, D. S. Chapman, H. Viilinger, and A. Rosenberger, An unequivocal case for high Nusselt-number hydrothermal convection in sediment-buried igneous oceanic crust, Earth Planet. Sci. Lett., 146, 137-150, 1997a.
Davis, E. E., D. S. Chapman, H. Villinger, S. Robinson, J. Grigel, A. Rosenberger, and D. Pribnow, Seafloor heat flow on the eastern flank of the Juan de Fuca Ridge: Data from "FlankFlux" studies through 1995, Proc. Ocean Drill. Program Initial Rep. 168, 23-33, 1997b.
Davis, E. E., A. T. Fisher, J. V. Firth, and the Shipboard Scientific Party, Proceedings of the Ocean Drilling Program, Initial Reports, 168, 470 pp., Ocean Drill. Program, College Station, Tex., 1997c.
Elderfield, H., C. G. Wheat, M. J. Mottl, C. Monnin, and B. Spiro, Fluid and geochemical transport through oceanic crust: A transect across the eastern flank of the Juan de Fuca Ridge, Earth Planet. Sci. Lett., in press, 1999.
Fisher, A. T., Permeability within basaltic oceanic crust, Rev. Geophys., 36, 143-182, 1998.
Fisher, A. T., and K. Becker, Correlation between seafloor heat flow and basement relief: Observational and numerical examples and implications for upper crustal permeability, J. Geophys. Res., 100, 12,641-12,657, 1995.
Fisher, A. T., K. Becker, and E. E. Davis, The permeability of young oceanic crust east of Juan de Fuca Ridge determined using borehole thermal measurements, Geophys. Res. Lett., 24, 1311-1314, 1997.
Hutchison, I., The effect of sedimentation and compaction on oceanic heat flow, Geophys. J. R. Astron. Soc., 82, 439-459, 1985.
Langseth, M. G., and B. M. Herman, Heat transfer in the oceanic crust of the Brazil Basin, J. Geophys. Res., 86, 10,805-10,819, 1981.
Langseth, M. G., R. D. Hyndman, K. Becker, S. H. Hickman, and M. H. Salisbury, The hydrogeological regime of isolated sediment ponds in mid-ocean ridges, Initial Rep. Deep Sea Drill. Proj., 78B, 825-837, 1984.
Langseth, M. G., K. Becker, R. P. Von Herzen, and P. Schultheiss, Heat and fluid flux through sediment on the western flank of the Mid-Atlantic Ridge: A hydrogeological study of north pond, Geophys. Res. Lett., 19, 517-520, 1992.
Lister, C. R. B., On the thermal balance of a mid-ocean ridge, Geophys. J. R. Astron. Soc., 26, 515-535, 1972.
Lister, C. R. B., Estimators for heat flow and deep rock properties based on boundary layer theory, Tectonophysics, 41, 157-171, 1977.
Lister, C. R. B., The pulse-probe method of conductivity measurement, Geophys. J. R. Astron. Soc., 57, 451-461, 1979.
Mottl, M.J., et al., Warm springs discovered on 3.5 Ma-old crust, eastern flank of the Juan de Fuca Ridge, Geology, 26, 51-54, 1998.
Nagihara, S., and C. R. B. Lister, Accuracy of marine heat flow instrumentation: Numerical studies on the effects of probe construction and the data reduction scheme, Geophys. J. Int., 112, 161-177, 1993.
Parsons, B., and J. G. Sclater, An analysis of the variation of ocean floor bathymetry and heat flow with age, J. Geophys. Res., 82, 803- 827, 1977.
Robinson, S. W., Thermal conductivity, heat flow, and basement temperature on the eastern flank of the Juan de Fuca Ridge, M.Sc. thesis, Univ. of Utah, Salt Lake City, 1997.
Rohr, K., Increase of seismic velocities in upper oceanic crust and hydrothermal circulation in the Juan de Fuca plate, Geophys. Res. Lett., 21, 2163-2166, 1994.
Rosenberger, A., E. E. Davis, and H. Villinger, Data Report: Hydrocell-95 and -96 single-channel seismic data on the eastern Juan de Fuca Ridge flank, Proc. Ocean Drill. Program Sci. Results, 169, in press, 1999.
Sclater, J. G., J. Crowe, and R. N. Anderson, On the reliability of oceanic heat flow averages, J. Geophys. Res., 81, 2997-3006, 1976.
Snelgrove, S., and C. B. Forster, Impact of seafloor sediment permeability and thickness on off-axis hydrothermal circulation: Juan de Fuca Ridge eastern flank, J. Geophys. Res., 101, 2915-2925, 1996.
Stein, C. A., and S. Stein, A model for the global variation in oceanic depth and heat flow with lithospheric age, Nature, 359, 123-129, 1992.
Thomson, R. E., E. E. Davis, and B. J. Burd, Hydrothermal venting and geothermal heating in Cascadia Basin, J. Geophys. Res., 100, 6121-6141, 1995.
Viilinger, H., and E. E. Davis, A new reduction algorithm for marine heat flow measurements, J. Geophys. Res., 92, 12,846-12,856, 1987.
Wang, K., and E. E. Davis, Thermal effects of marine sedimentation in hydrothermally active areas, Geophys. J. Int., 110, 70-78, 1992.
Wang, K., J. He, and E. E. Davis, Influence of basement topography on hydrothermal circulation in sediment-buried igneous oceanic crust, Earth Planet. Sci. Lett., 146, 151-164, 1997.
Wheat, C. G., and M. J. Mottl, Hydrothermal circulation, Juan de Fuca eastern flank: Factors controlling basement water composition, J. Geophys. Res., 99, 3067-3080, 1994.
Wheat, C. G., M. J. Mottl, E. T. Baker, R. Feely, J. Lupton, F. Sansone, J.

17,688 DAVIS ET AL.: JUAN DE FUCA FLANK HEAT FLOW TRANSECT
Resing, G. Lebon, and N. Becker, Chemical plumes from low- temperature hydrothermal venting on the eastern flank of the Juan de Fuca Ridge, J. Geophys. Res., 102, 15,433-15,446, 1997.
Yang, J., R. N. Edwards, J. W. Molson, and E. A. Sudicky, Fracture-induced hydrothermal convection in the oceanic crust and the interpretation of heat-flow data, Geophys. Res. Lett., 23, 929-932, 1996.
K. Becker, Rosenstiel School of Marine and Atmospheric Science, University of Miami, 4600 Rickenbacker Causeway, Miami, FL, 33149. (kbecker @ rsmas.miami.edu.)
D. S. Chapman and S. W. Robinson, Department of Geology and Geophysics, University of Utah, Salt Lake City, UT 84112. ([email protected].)
E. E. Davis and K. Wang, Pacific Geoscience Centre, Geological Survey of Canada, P.O. Box 6000, Sidney, B.C., Canada V8L 4B2. (davis @pgc.nrcan.gc.ca. )
A. T. Fisher and J. Stein, Earth Sciences Department, University of California, Santa Cruz, CA 95064. ([email protected].)
J. Grigel and H. Viilinger, Fachbereich Geowissenschaften, Universit[it Bremen, Postfach 330 440, D-28334 Bremen, Germany. ([email protected] bremen.de.)
D. Pribnow, Geowissenschaftliche Gemeinschaftsaufgaben, Stilleweg 2, D-30655 Hannover, Germany. (d.pribnow@gga-hannover. de.)
(Received September 23, 1998; revised February 10, 1999; accepted March 23, 1999.)


![files/Chamber/[Clarinet_Institute] Salamon... · Piano Sean Salarnon 10 Variations on a Theme: 'Brâul" ... Variations on a Theme Variations on a Theme Lento Variations on a Theme](https://img.pdfslide.us/doc/110x75/5b3431957f8b9a7e4b8bd2d8/clarinetinstitute-salamon-piano-sean-salarnon-10-variations-on-a-theme.jpg)


![Automated detection and location of Cascadia tremorcourses.washington.edu/ess403/CascadiaResources/WechCreagerGRL2008.pdf · analysis of tremor in Cascadia [Wech and Creager, 2007]](https://img.pdfslide.us/doc/110x75/5e187a60f049b343d36c2a25/automated-detection-and-location-of-cascadia-analysis-of-tremor-in-cascadia-wech.jpg)