Embed Size (px)
Citation preview

NIAR Report 93-18
Supersonic Flow VisualizationOf a Nacelle in Close ProximityTo a Simulated Wing
Kasim BiberDavid R. Ellis
August 1993
NIARNational Institute for Aviation Research
The Wichita State University
Wichita, Kansas 67260-0093
https://ntrs.nasa.gov/search.jsp?R=19940012787 2020-05-22T20:00:14+00:00Z
I
FINAL TECHNICAL REPORT
NIAR Report 93-18
SUPERSONIC FLOW VISUALIZATION
OF A NACELLE IN CLOSE PROXIMITY TO A SIMULATED WING
by
Kasim Biber and David R. Ellis
National Institute for Aviation Research
Wichita State University
Wichita, KS 67260
Contract _ : A24888D(MXR)
Technical Monitor: Joel Mendoza
NASA Ames Research Center
Moffett Field, California
July 1993

Supersonic Flow Visualization
of a Nacelle in Close Proximity to a Simulated Wing
by
Kasim Biber and David R. Ellis
National Institute for Aviation Research
Wichita State University
Wichita, Kansas 67260
Abstract
A flow visualization study was made in the 9 × 9-inch supersonic wind tunnel at
Wichita State University to examine shock and boundary layer flow interaction for a
nacelle in close proximity to the lower surface of a simulated wing. The test matrix
included variations of angle of attack from -2 ° to +4 ° , nacelle-wing gap from 0.5-
to 3-nacelle inlet diameter (0.12-inch) and Reynolds number based on nacelle length
(1.164-inch) from 1.16 × 10 e to 1.45 x 10⁶ at a nominal Mach number of 2. Schlieren
pictures of wing and nacelle flowfield were recorded by a video camera during each
tunnel run. Results show that the nacelle inlet shock wave remains attached to
the inlet lip and its impingement does not significantly affect the wing boundary
layer. At the nacelle trailing edge location, the wing boundary layer thickness is
approximately one-nacelle _nlet diameter at a = 0 ° and it decreases with increase
of angle of attack.

Table of Contents
oo°
List of Tables ........................ 111
ivList of Figures ........................
viNomenclature ........................
11. INTRODUCTION .......................
2. EXPERIMENTAL ARRANGEMENT ............ 2
22.1 Wind Tunnel ........................
22.2 Test Model .........................
32.3 Test Conditions .......................
2.4 Flow Visualization Technique ................. 3
3. RESULTS AND DISCUSSION ................. 4
43.1 Wing Alone Tests ......................
3.2 Nacelle Alone Tests ...................... 5
3.3 Wing and Nacelle Tests .................... 6
- Results for Y/D = 3 Case .................. 6
- Results for Y/D = 2 Case .................. 7
- Results for Y/D = 1 Case .................. 7
- Results for Y/D = 0.5 Case ................. 8
3.4 Future Work ......................... 9
94. CONCLUSIONS ........................
5. REFERENCES ......................... 10

0
111
Table
List of Tables
Test cases presented on the Hi 8 mm video tape .............. 12

Figure
1
2
3
4
5
6
7
9
I0
ii
12
13
14
15
List of Figures
Typical nacelle-wing arrangement for a supersonic transport aircraft
with underwing interference region, Reference 3
Attached/detached shock flow position for a sharp-lip pitot nacelle
inlet: a) Attached normal shock to the inlet lip, b) Detached shock
with flow restrictor inside the nacelle
Nacelle inlet position with respect to the wing boundary layer: a)
Non-affected inlet internal flow, b) Distorted inlet internal flow due
to boundary layer ingestion
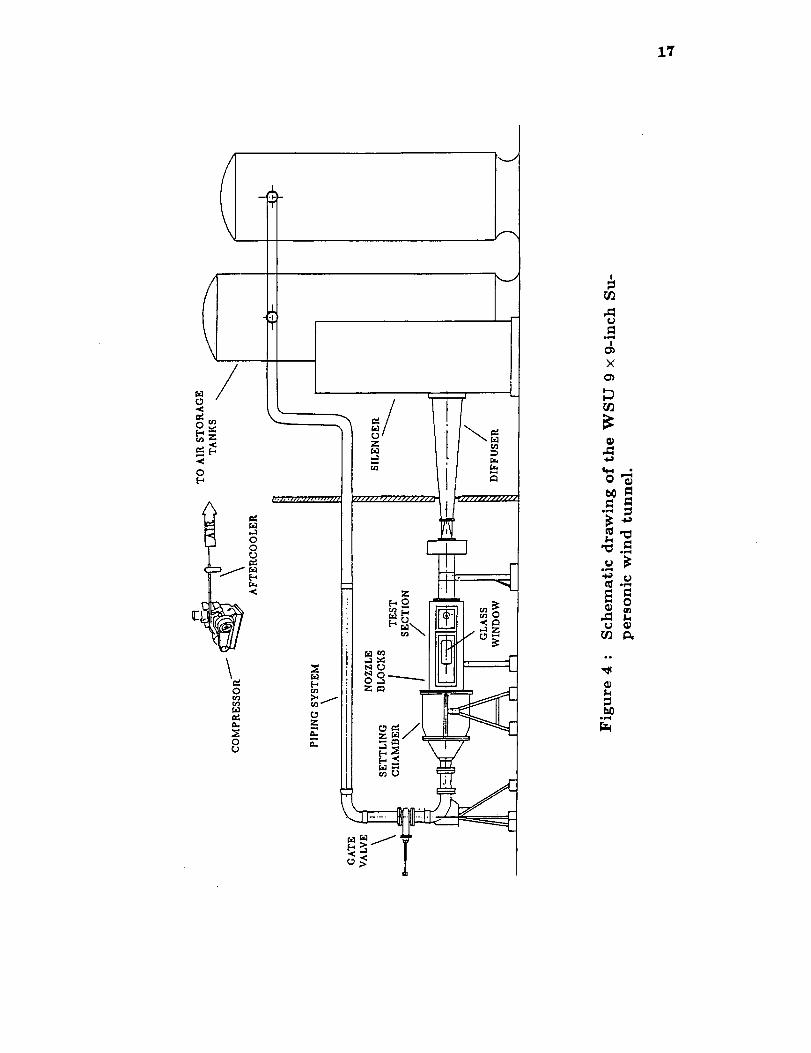
Schematic drawing of the WSU 9 × 9-inch Supersonic wind tunnel
Geometric details of nacelle/pylon
Geometric details of simulated wing
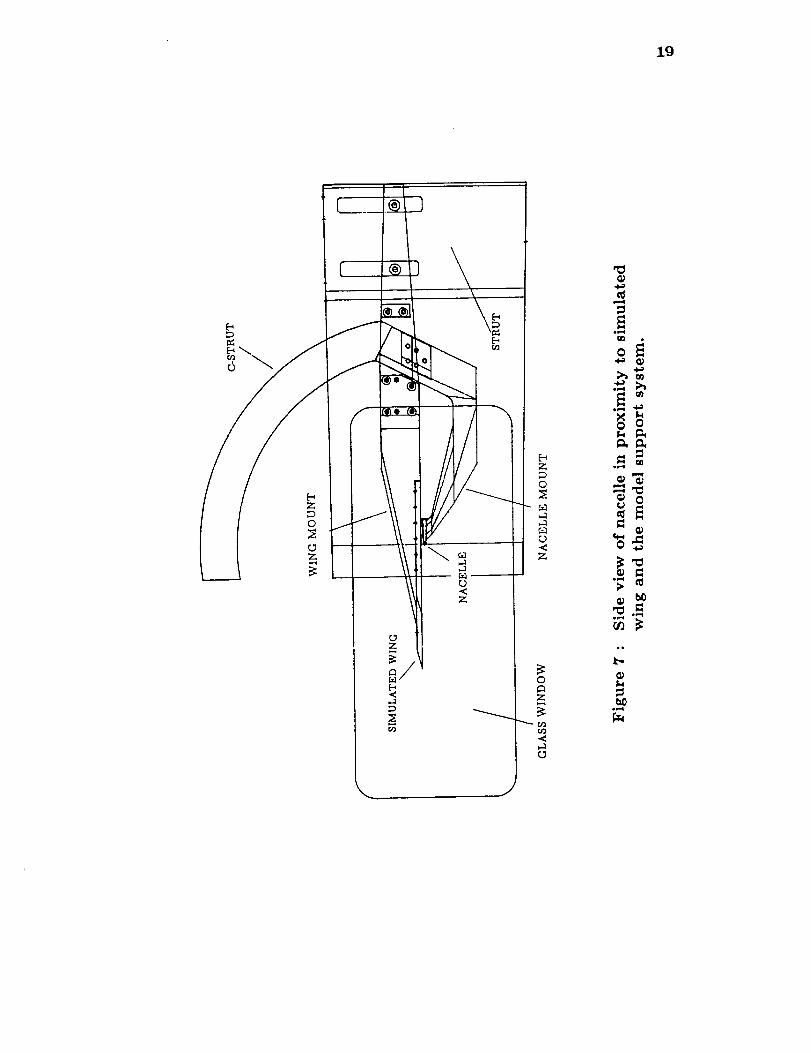
Side view of nacelle in proximity to simulated wing and the model
support system.
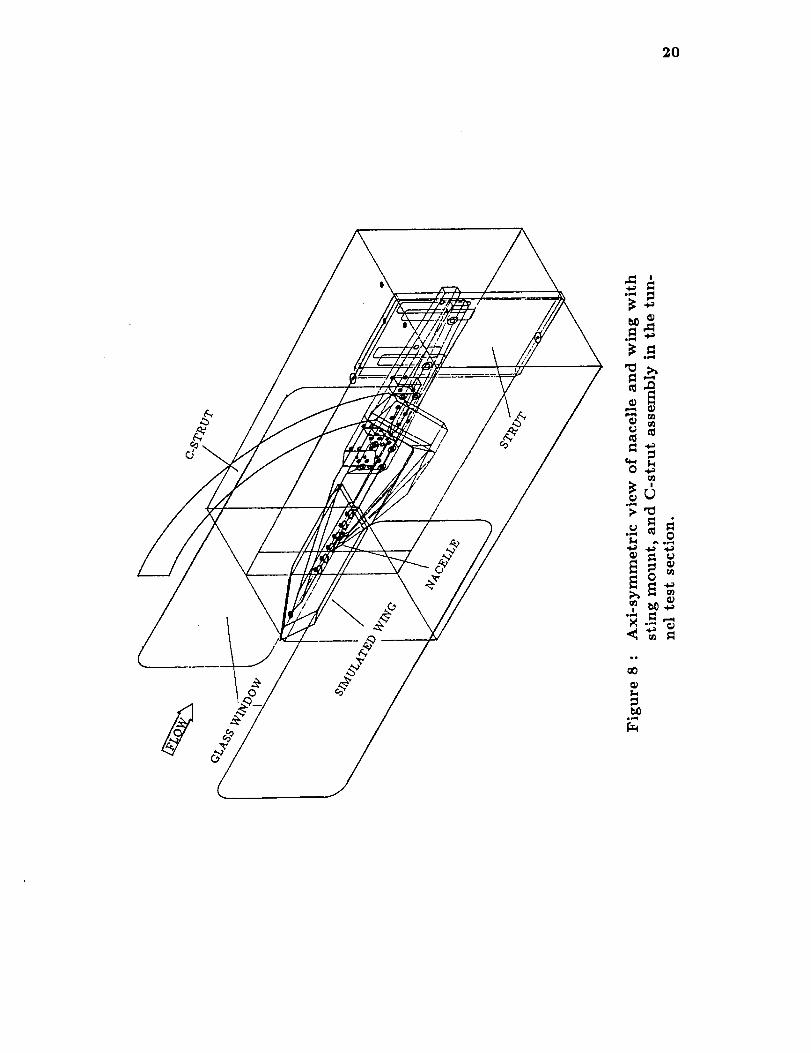
Axi-symmetric view of nacelle and wing with sting mount, and C-
strut assembly in the tunnel test section
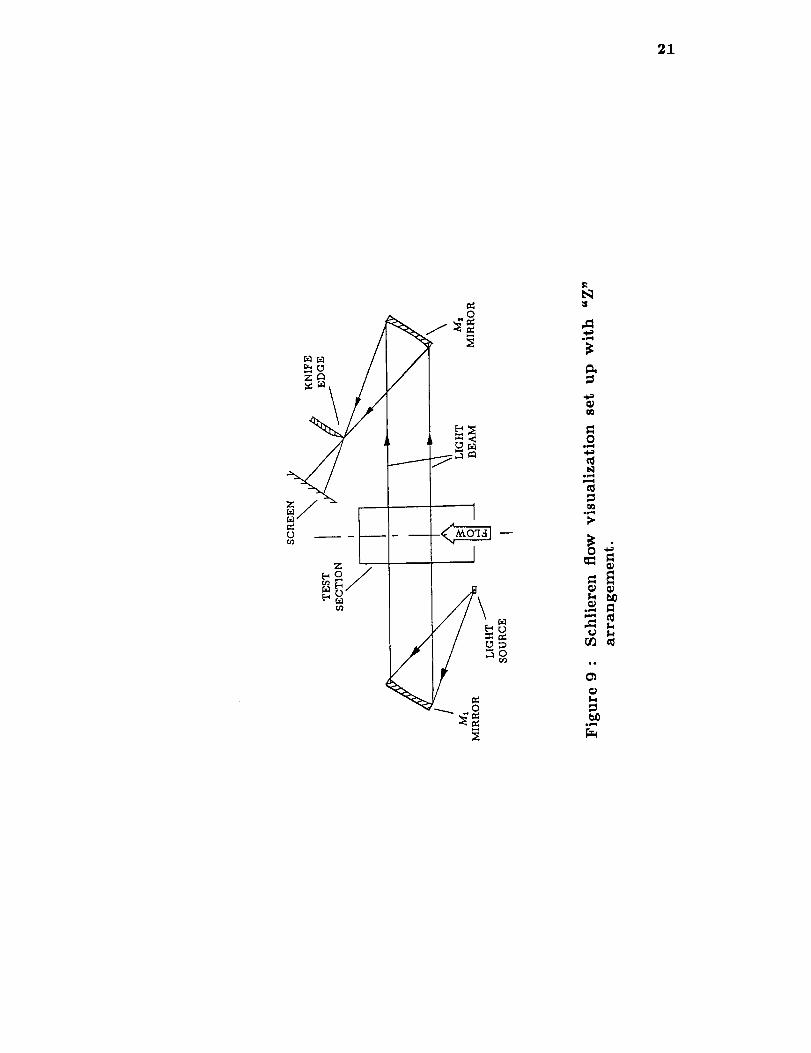
Schlieren flow visualization set up with "Z" arrangement
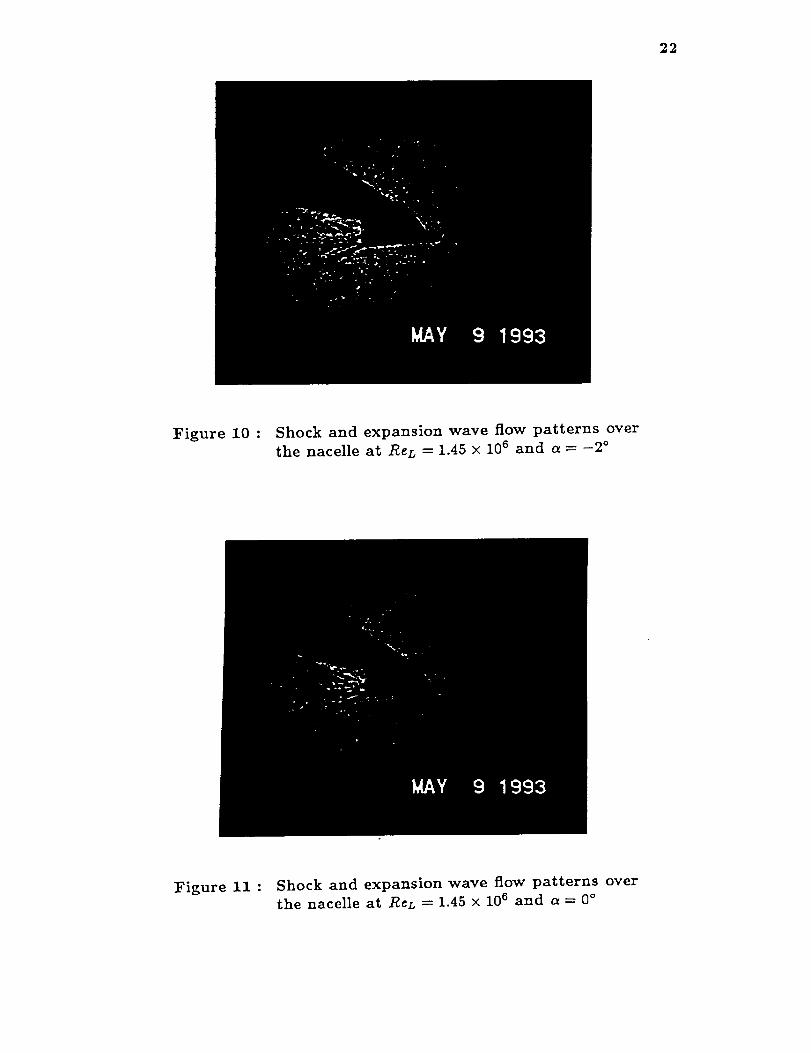
Shock and expansion wave flow patterns over the nacelle at ReL ----
1.45 x 10 6 and a -- -2 °
Shock and expansion wave flow patterns over the nacelle at ReL =
1.45x 10⁶ anda--0 °
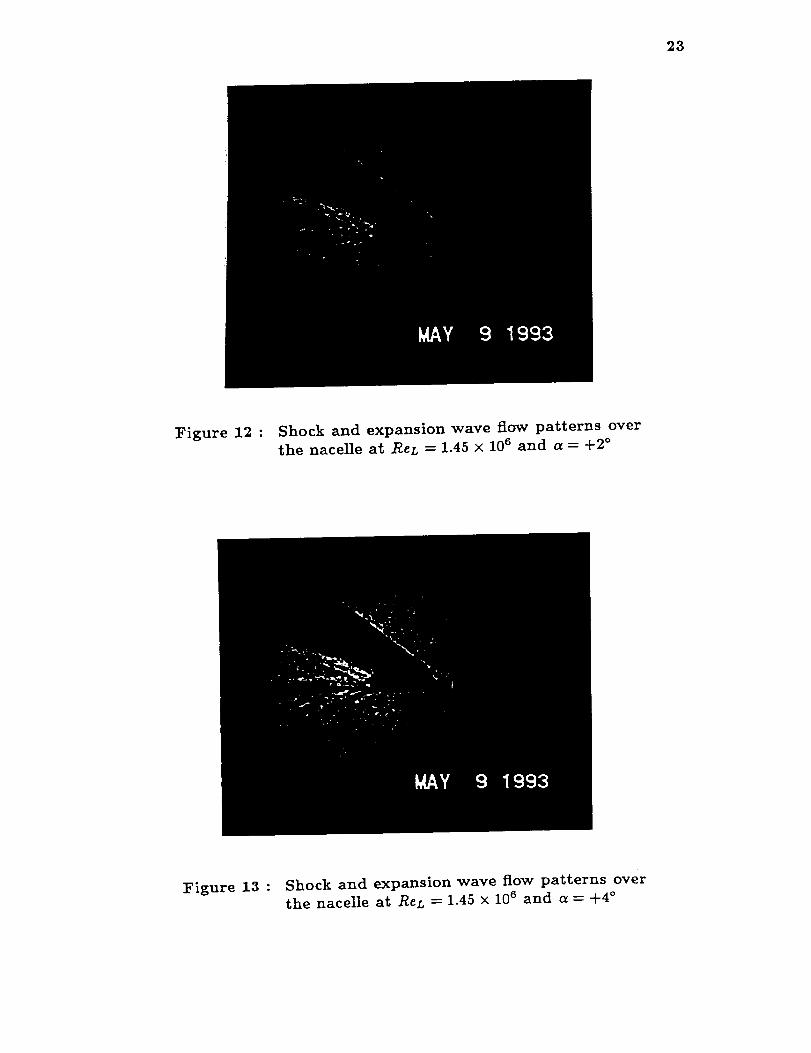
Shock and expansion wave flow patterns over the nacelle at ReL =
1.45 x 10⁶ and a =- +2 °
Shock and expansion wave flow patterns over the nacelle at ReL -=
1.45 x 10 6 and a = +4 °
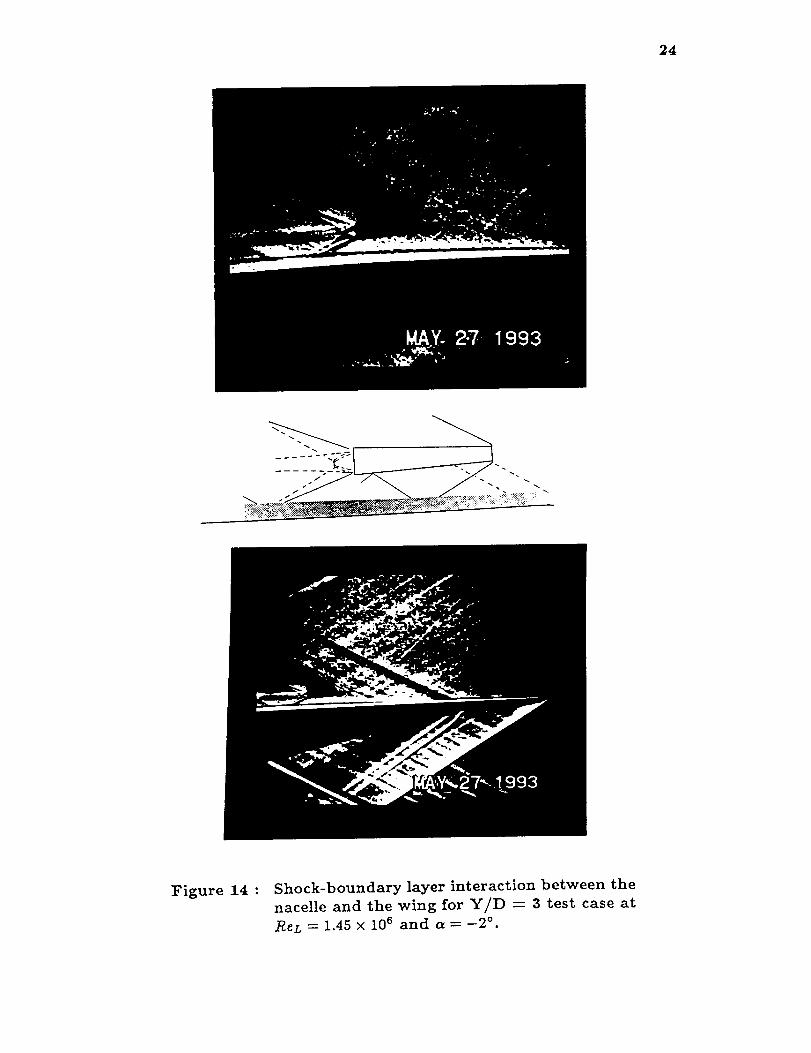
Shock-boundary layer interaction between the nacelle and the wing
for Y/D = 3 test case at ReL = 1.45 × 10⁶ and ex = -2 °
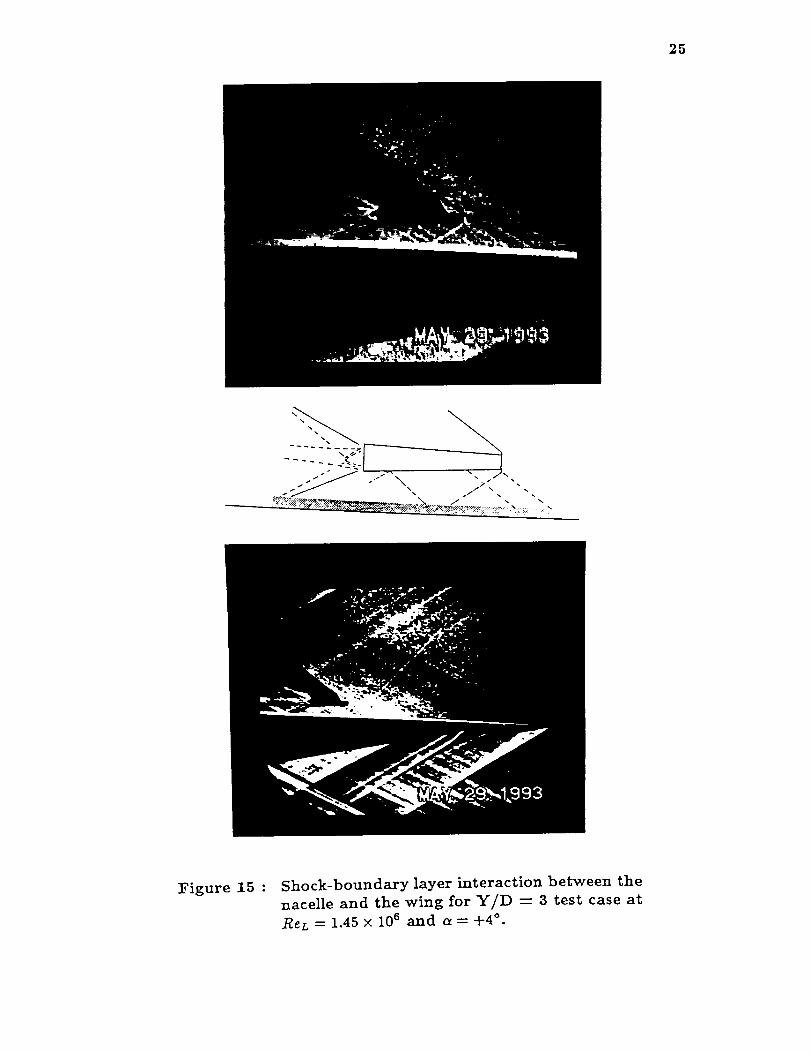
Shock-boundary layer interaction between the nacelle and the wing
for Y/D = 3 test case at ReL = 1.45 × 10⁶ and a = +4 °
iv
16
16
17
18
18
19
2O
21
22
22
23
23
24
25

V
Figure
16
17
18
19
2O
21
22
23
24
25
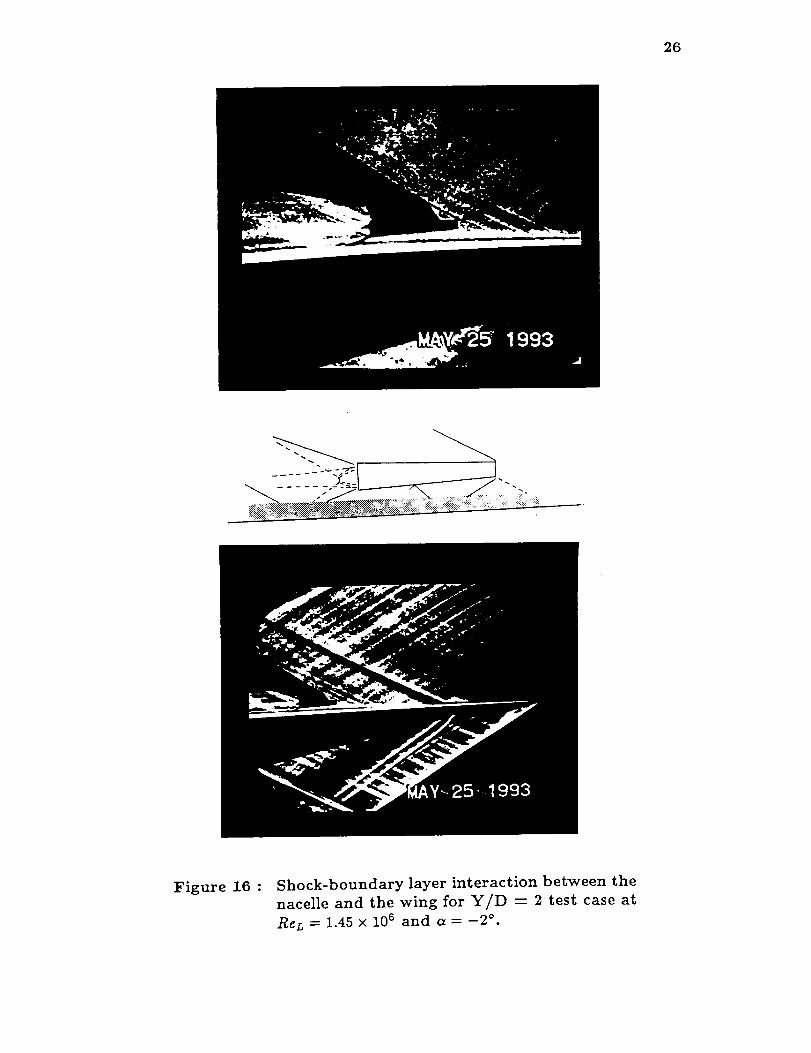
Shock-boundary layer interaction between the nacelle and the wing
for Y/D --- 2 test case at ReL = 1.45 x 10⁶ and c_ = -2 °
Shock-boundary layer interaction between the nacelle and the wing
for Y/D = 2 test case at ReL = 1.45 x 10⁶ and a = +4 °
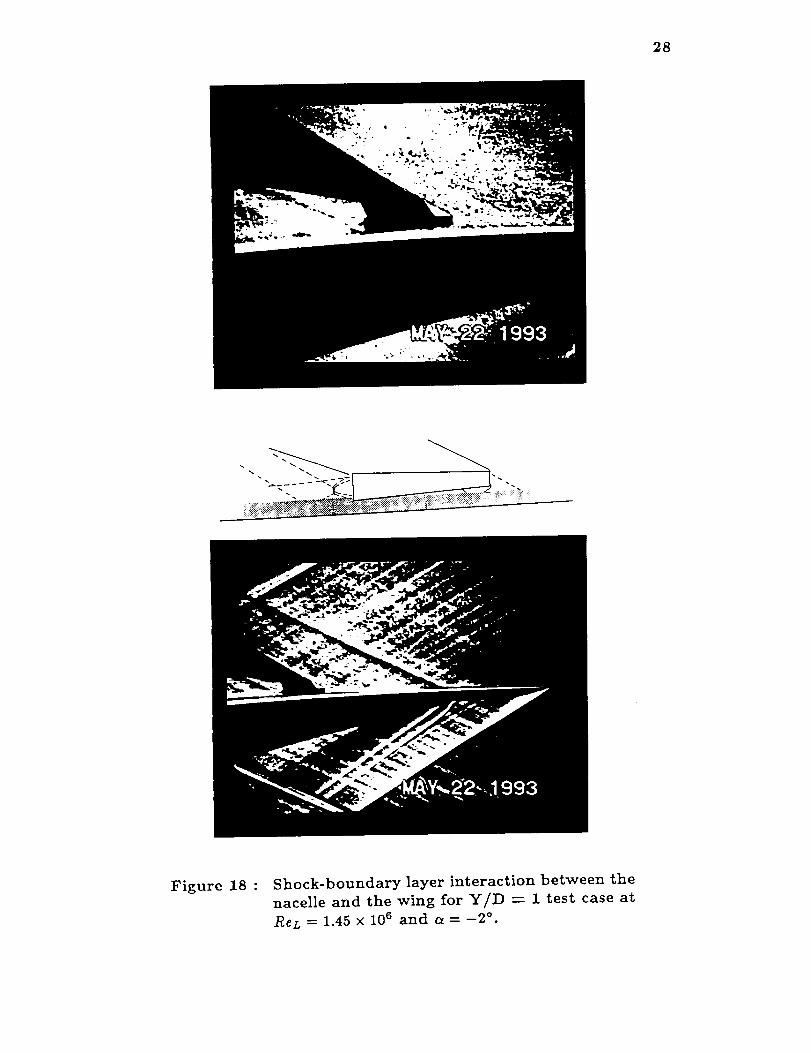
Shock-boundary layer interaction between the nacelle and the wing
for Y/D = 1 test case at ReL = 1.45 X 10⁶ and a = -2 °
Shock-boundary layer interaction between the nacelle and the wing
for Y/D -- 1 test case at ReL = 1.45 x 10⁶ and a = 0 °
Shock-boundary layer interaction between the nacelle and the wing
for Y/D = 1 test case at ReL = 1.45 x 10⁶ and a = +2 °
Shock-boundary layer interaction between the nacelle and the wing
for Y/D = 1 test case at ReL = 1.45 x 10⁶ and a = +4 °
Shock-boundary layer interaction between the nacelle and the wing
for Y/D = 0.5 test case at ReL = 1.45 x 10⁶ and a =
Shock-boundary layer interaction between the nacelle
for Y/D = 0.5 test case at ReL = 1.45 x 10⁶ and a =
Shock-boundary layer interaction between the nacelle
for Y/D -- 0.5 test case at Ren ----1.45 x 10⁶ and a =
Shock-boundary layer interaction between the nacelle
for Y/D = 0.5 test case at Ren = 1.45 x 10⁶ and a =
_2 °
and the wing
0 °
and the wing
+2 °
and the wing
+4 °
26
27
28
29
3O
31
32
33
34
35

vi
D
M
PT
ReL
Refit
X
Y
Y/D
O_
Nomenclature
nacelle inlet diameter : 0.12-inch
test Mach number : 1.94
settling chamber pressure : 42 and 52 psia [lb/in 2]
Reynolds number based on nacelle length : 1.16 × 10⁶
and 1.45 × 10⁶
Reynolds number based on a foot : 12 × 106 and 15 × 106
horizontal downstream distance from the wing leading edge
vertical spacing between wing and nacelle : 0.06, 0.12, 0.24,
and 0.36-inch
wing-nacelle gap : 0.5, 1, 2, and 3
angle of attack : -2 °, 0 °, +2 °, and +4 °
boundary layer thickness, [inch]

1. INTRODUCTION
Nacelle/airframe integration is of major importance for aerodynamically effi-
cient supersonic transport aircraft design and development. 1'2 For such aircraft,
the nacelles are commonly positioned beneath the wing to produce relatively low
wave drag. Figure 1 shows a typical nacelle/wing arrangement used for computa-
tional studies 3,4 of interference effects. In its proper location, the nacelle should
normally have an attached normal shock at its inlet lip and capture the oncoming
air mass without any spillage (Figure 2a). If the mass flow through the nacelle was
reduced by using, for instance a flow restrictor as in Fig. 2b, then the normal shock
wave would move upstream progressively and become detached from the inlet lip.
In this case, the subsonic flow behind the detached shock would involve with spillage
drag, which would degrade engine thrust. 5 Flow through such isolated nacelles was
visualized in an early study made at the Wichita State University. 6
When a nacelle is integrated with an aircraft wing, its flowfield is affected by the
wing boundary layer, depending on the nacelle proximity to the wing surface. If the
nacelle inlet is placed completely outside the boundary layer (as in Fig. 3a), then
there will be an increase of wave drag. If the wing boundary layer flows through
the nacelle (as in Fig 3b), then loss in total pressure and distortion in the velocity
distribution will result, causing a reduction in the engine flow cycle 7. Therefore,
the boundary layer is removed by means of bleed and diverter before it enters to the
nacelle. 5,_ However, such a boundary layer control requires a detailed knowledge of
both isolated and integrated wing-nacelle flowfields at various Reynolds numbers,
angles of attack and wing-nacelle gaps.
This report presents the results of a flow visualization study featuring wind
tunnel tests of a simulated flow-through nacelle with a sharp-lip pitot intake under
a flat planform wing with swept back subsonic leading edge. The study brings some
insight into the shock-boundary layer interaction between the nacelle and the wing.
The test matrix included variations of angle of attack from -2 ° to +4 ° , wing-nacelle
gap from half- to three-nacelle inlet diameter and Reynolds number based on the
nacelle length from 1.16 x 10 e to 1.45 x 10 e at a nominal Mach number of 2.
1
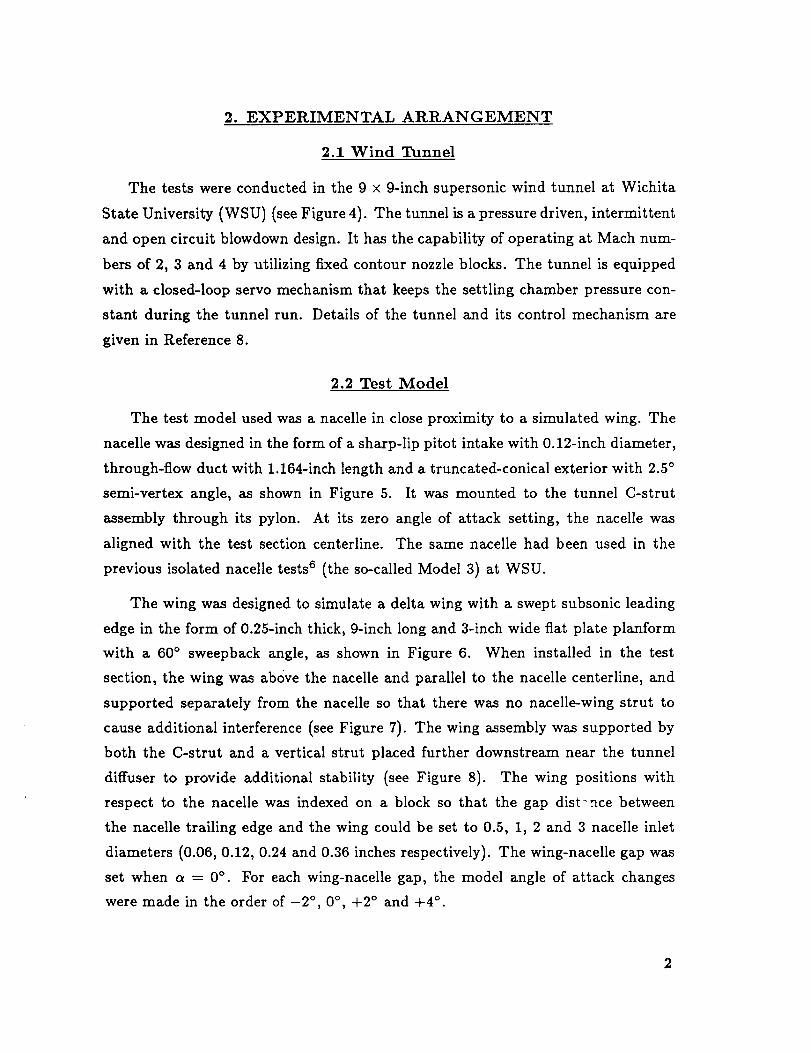
2. EXPERIMENTAL ARRANGEMENT
2.1 Wind Tunnel
The tests were conducted in the 9 x 9-inch supersonic wind tunnel at Wichita
State University (WSU) (see Figure 4). The tunnel is a pressure driven, intermittent
and open circuit blowdown design. It has the capability of operating at Mach num-
bers of 2, 3 and 4 by utilizing fixed contour nozzle blocks. The tunnel is equipped
with a closed-loop servo mechanism that keeps the settling chamber pressure con-
stant during the tunnel run. Details of the tunnel and its control mechanism are
given in Reference 8.
2.2 Test Model
The test model used was a nacelle in close proximity to a simulated wing. The
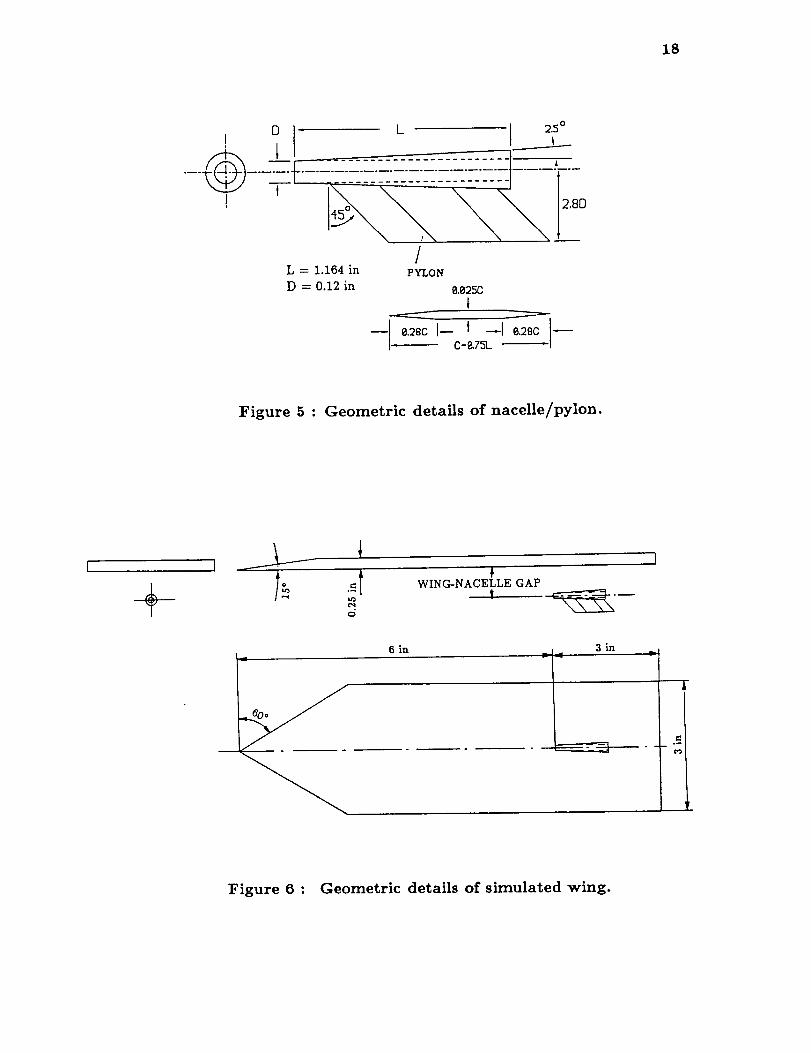
nacelle was designed in the form of a sharp-lip pitot intake with 0.12-inch diameter,
through-flow duct with 1.164-inch length and a truncated-conical exterior with 2.5 °
semi-vertex angle, as shown in Figure 5. It was mounted to the tunnel C-strut
assembly through its pylon. At its zero angle of attack setting, the nacelle was
aligned with the test section centerline. The same nacelle had been used in the
previous isolated nacelle tests 6 (the so-called Model 3) at WSU.
The wing was designed to simulate a delta wing with a swept subsonic leading
edge in the form of 0.25-inch thick, 9-inch long and 3-inch wide flat plate planform
with a 60 ° sweepback angle, as shown in Figure 6. When installed in the test
section, the wing was above the nacelle and parallel to the nacelle centerline, and
supported separately from the nacelle so that there was no nacelle-wing strut to
cause additional interference (see Figure 7). The wing assembly was supported by
both the C-strut and a vertical strut placed further downstream near the tunnel
diffuser to provide additional stability (see Figure 8). The wing positions with
respect to the nacelle was indexed on a block so that the gap distance between
the nacelle trailing edge and the wing could be set to 0.5, 1, 2 and 3 nacelle inlet
diameters (0.06, 0.12, 0.24 and 0.36 inches respectively). The wing-nacelle gap was
set when a = 0 °. For each wing-nacelle gap, the model angle of attack changes
were made in the order of -2 °, 0 °, +2 ° and +4 °.
2

3
2.3 Test Conditions
Test conditions were characterized by the settling chamber pressure for the flow
produced by the Mach 2 nozzle blocks. Considering the losses at the downstream of
the nozzle throat (see Ref. 9), the actual test Mach number was 1.94, as determined
from shock wave angle over the simulated wing, and the ratio of test section pitot
pressure to settling chamber pressure.
Reynolds number was calculated from the settling chamber pressure and tem-
perature for the prescribed Mach number. The viscosity was determined from
Sutherland's formula as given in Reference 10. Tests were made for settling cham-
ber pressures of 42 and and 52 psia, corresponding to Reynolds number based on
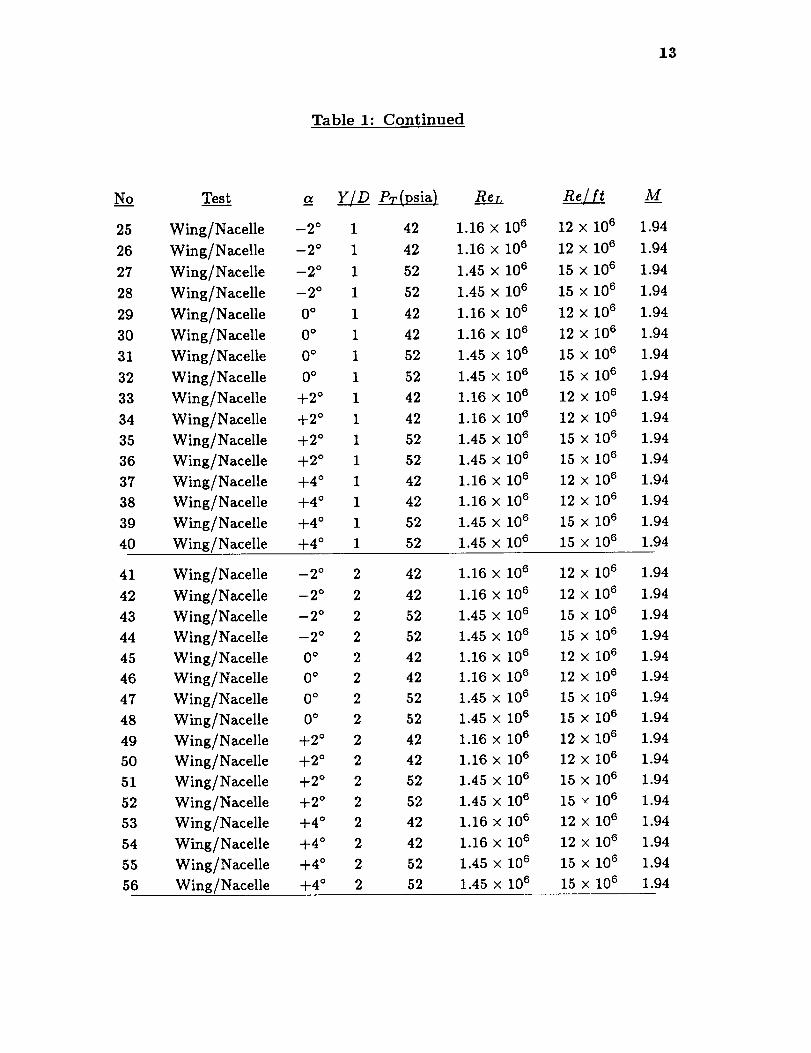
nacelle length (1.164-inch) of 1.16 × 10⁶ and 1.45 x 10⁶ respectively. Table 1 shows
complete test cases. The settling chamber pressure and therefore Reynolds number
range was limited by the nacelle/pylon strength.
The flow unsteadiness in the settling chamber was observed qualitatively by
time history of stagnation pressures for about 10 seconds of tunnel runs. s There
were fluctuations on the pressure signals, but these were below ±5% for the present
test values. These fluctuations apparently caused some vibration on the nacelle
model during runs. Because of its rather thin shape to prevent flow interference
with the nacelle, the nacelle/pylon failed during the last tunnel run (Run 72) shown
in Table 1.
2.4 Flow Visualization Technique
The schlieren method in a "Z" arrangement was used to visualize shock and
boundary layer flow patterns. The method provides a picture of variations of density
gradients in the two-dimensional plane of flow field 11 by using the set up shown in
Figure 9. Obtaining satisfactory picture quality required a careful adjustment of
apparatus used for the schlieren set up. A knife edge was placed horizontally near
the second mirror focal point to highlight boundary layer effects and shock-boundary
layer flow patterns. The focal plane was rectangular with a length-to-width ratio
of 4. The model image was viewed on a white screen, upside down due to lack of
a third mirror to reflect the image back to its original orientation. The schlieren
pictures on the viewing screen were recorded by using an 8 mm video camera. Test

4
cases were identified orally on the video during the tunnel runs, and later they were
transcribed onto white title cards during editing. Table 1 shows a list of test cases
shown on the 8 mm video tape.
3. RESULTS AND DISCUSSION
Results of this study are presented on still pictures taken from the video tape.
They are not as clear as the video. The hand drawn sketches should illustrate some
details for wing-nacelle test cases. As stated previously, images are upside down on
the video tape because of the mirror arrangement. Here results are given for only
the higher Reynolds number c_e. In fact, there is not a qualitative difference of
shock-boundary layer flow characteristics at Reynolds number of either 1.16 x 10⁶
or 1.45 x 10⁶. However, the higher Reynolds number case provided sharper images
of the model flowfield. Tunnel runs were made for tests of wing alone, nacelle alone
and then wing and nacelle together.
3.1 Wing Alone Tests
The simulated wing was first tested to check if there was any blockage or design
problem in the tunnel test section and also to visualize the shock and boundary
layer flow patterns of the wing lower surface when there was no nacelle present.
The visualized boundary layer thickness was compared with the one calculated at
a = 0 ° by using the fiat plate approximations 12 given for incompressible flow. The
calculation was made for the higher Reynolds number case, which corresponds to a
local Reynolds number of 9 x 10⁶ at 7.164 inches downstream from the wing leading
edge. The comparison is given below:
Flat Plate at a = 0 °
Laminar-Incompressible
Turbulent-Incompressible
Experiment at M = 1.94
6 at x = 7.164-inch
0.012-inch
0.1-inch
0.12-inch
It was concluded that the wing lower surface boundary layer was tripped to tur-
bulent in character from the wing leading edge. Also, comparison with the wing
and nacelle tests showed that the nacelle presence did not change the wing flowfield
significantly. Therefore, the wing alone tests were not presented on the final copy
of the video tape.
3.2 Nacelle Alone Tests
The nacelle alone flow field was visualized for comparison when the nacelle was
positioned under the simulated wing. As shown in Figs. 10-13, a conical oblique
shock wave forms at the nacelle inlet lip and its orientation with the freestream
flow changes with the angle of attack. It remains attached to the inlet lip and
is symmetric only when a = 0 °. In fact, at a -- +4 °, an expansion wave could
be expected at the leeward side of the nacelle (remember the semi-vertex angle is
2.5°), but this is not noticable on the pictures. The schlieren method, which is
sensitive to variations of density gradients and not change of directions, is evidently
not sensitive enough to detect this expansion.
There is also a normal shock at the nacelle inlet, although it is not seen on the
pictures. The normal shock may not be exactly at the nacelle leading edge but just
a little bit downstream of the nacelle intake, interacting with the internal boundary
layer of the ducted nacelle. It naturally remains normal to the freestream flow at all
angles of attack. Therefore, the normal shock orientation with the nacelle leading
edge is altered with the angle of attack changes. That is, at a = -2 ° the normal
shock is more upstream on the inlet lower side than that on the upper side, and at
a = +2 ° the reverse of this is true. In fact, at a sufficiently high angle of attack
(say 10°), the normal shock might be detached from only the upper side of the
inlet. However, as can seen from the figures, this detachment did not occur during
the present tests, probably because the highest angle of attack was only +4 ° . The
leading edge shock wave has some curvature near the inlet lip, as shown in the
figures. This is also believed to be due to changes in the normal shock orientation
with the nacelle leading edge in addition to the flow turbulence and the model
vibration.
The nacelle boundary layer is not visible on the recorded pictures. This means
that the nacelle boundary layer is evidently quite thin, and that there is not any
indication of nacelle boundary layer separation due to the leading edge shock waves.
In fact, the nacelle has a conical exterior with 2.5 ° semi-vertex cone angle. There-
fore, it is subject to three-dimensional exterior flowfield at angles of attack. The
flow three-dimensionality has apparently a favorable effect on the nacelle boundary
layer behaviour.
6
The flow through the ducted nacelle expands to the freestreamat the nacelle
exit. The flow inside the duct is evidently fully turbulent and free of shockwaves.
This was mainly becausethe nacelle length-to-inlet diameter ratio (L/D = 9.7)
was not large enough for the internal boundary layer to create any choking flow
conditions and subsequent supersonic flow in the duct (see Reference 13). In other
words, the exit flow is subsonic and has relatively high pressure and hence expands
to a lower back pressure region. The schlieren pictures show the free-jet boundary
running away from the nacelle centerline. The expansion waves from the nacelle exit
on the other hand merge with each other at about nacelle centerline when c_ = 0 °
(presumably symmetric flow). However, at angles of attack, there is a distortion of
symmetry even though it is not very significant on the pictures.
3.3 Win_ and Nacelle Tests
The tests were made with the nacelle positioned 6-inch downstream from the
wing leading edge and at several distances below the wing horizontal centerline. The
wing clearance from the nacelle (Y) was measured from the wing-side of the nacelle
trailing edge and normalized with the nacelle inlet diameter (D). The angle of attack
changes were made simultaneously for both the wing and nacelle for a prescribed
gap between them. At its test position, the nacelle was in a flowfield with a local
Mach number slightly higher than the freestream Mach number at a = -2 ° due to
expansion waves, and lower than the freestream Mach number at c_ = +2 ° and +4 °
due to compression waves from the wing leading edge. Furthermore, there was no
change of Mach number when _ -- 0 °. Another effect considered was the influence of
vorticity generated along the swept back wing leading edge when the model angle of
attack was negative (a = -2°). It was believed that the vorticity was insignificant
and washed away without having much effect on the nacelle flowfield. The shock-
boundary layer interaction between the nacelle and the wing was visualized for four
different wing-nacelle gap cases and discussed in the subsequent sections.
Results for Y/D -- 3 Case: As shown in Figs. 14 and 15, the nacelle is
far below the wing and is not influenced by the wing boundary layer. The wing
boundary layer gets thinner with increase in angle of attack. There are shock waves
from the edges of the wing where the sweep ends. This wave becomes significant
only when a = -2 ° (see Fig. 14), but has no apparent effect on the nacelle flowfield.
7
By looking carefully at the secondpicture in Fig. 14, a free arc shapewave canbe
seenextending acrossthe vertical plane of test section where the nacelle is under
the wing. It is not clear what causesthis wave. It also occurs in all other test cases
when _ = -2 °. In fact, the arc wave gradually disappears as the angle of attack
increases to a = 4-4 °, as also evidenced in the other test cases discussed later.
The leading edge shock and exhaust free-jet layer at the nacelle wing-side im-
pinge on the wing boundary layer and reflect back towards the nacelle. The shock
impingement apparently does not have any effect on the already turbulent wing
boundary layer. The reflection patterns are very similar at both a -- -2 ° and
4-4 ° except that shock wave angles change with the angle of attack and as do the
reflected wave angles. Furthermore, there is a slight distortion of symmetry on the
nacelle exhaust flow for non-zero angles of attack, as evidenced from the location
where the expansion waves cross each other.
Results for Y/D ---- 2 Case: As shown in Figs. 16 and 17, the nacelle is clear
from the wing boundary layer about one-nacelle inlet diameter. The trends of the
shock-boundary layer interaction are similar to the Y/D = 3 test case. However,
in this case the nacelle leading edge shock waves are reflected back from the wing
surface to the nacelle upper (leeward for a > 0 °) side at further upstream locations.
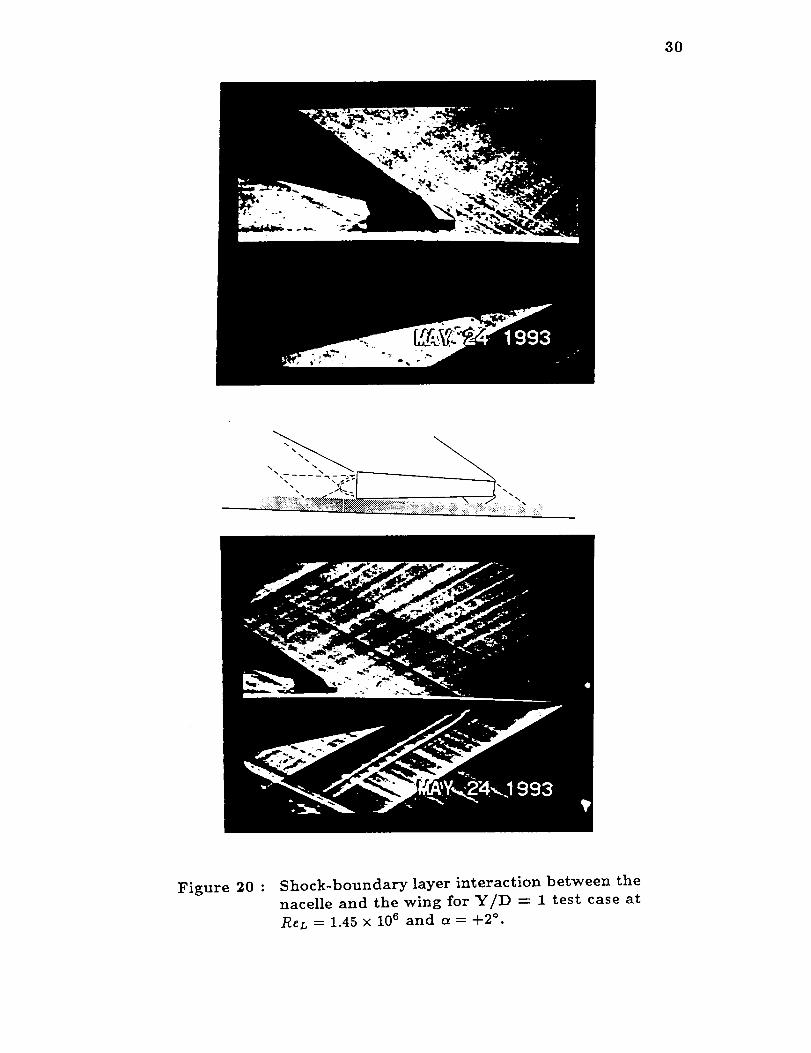
Results for Y/D -- 1 Case: At a = 0 °, the wing boundary layer is tangent
to the nacelle trailing edge (see Figures 18-21). In other words, the wing bound-
ary layer thickness fills the gap between the wing and nacelle. Furthermore, the
boundary layer thickness changes slightly with angle of attack.
The leading edge shock impinges on the boundary layer and reflects back to
the nacelle in a relatively short downstream distance. This impingement normally
goes through the subsonic boundary layer until it reaches the solid surface, and
its effect is felt in a region subject to an increase in the pressure. The pressure
rise associated with the shock system is apparently not high enough to cause any
boundary layer separation as seen from the pictures. However, as explained in Ref.
14, there are compression waves generated by the pressure change in the subsonic
layer and these waves coalesce with the reflected wave in and out of the boundary
layer. In fact, Ref. 14 also states that the turbulent boundary layer thickness
should decrease because of the interaction, but this is not evident from the present
8
results. The pictures show no sign of change in the boundary layer thickness due to
the leading edge shock impingement. There is also a possibility of merging of the
nacelle and wing boundary layers, but again this is not observed on the schlieren
pictures. The nacelle exhaust flow is similar to the preceding two test cases, except
that its wing-side is absorbed by the wing boundary layer.
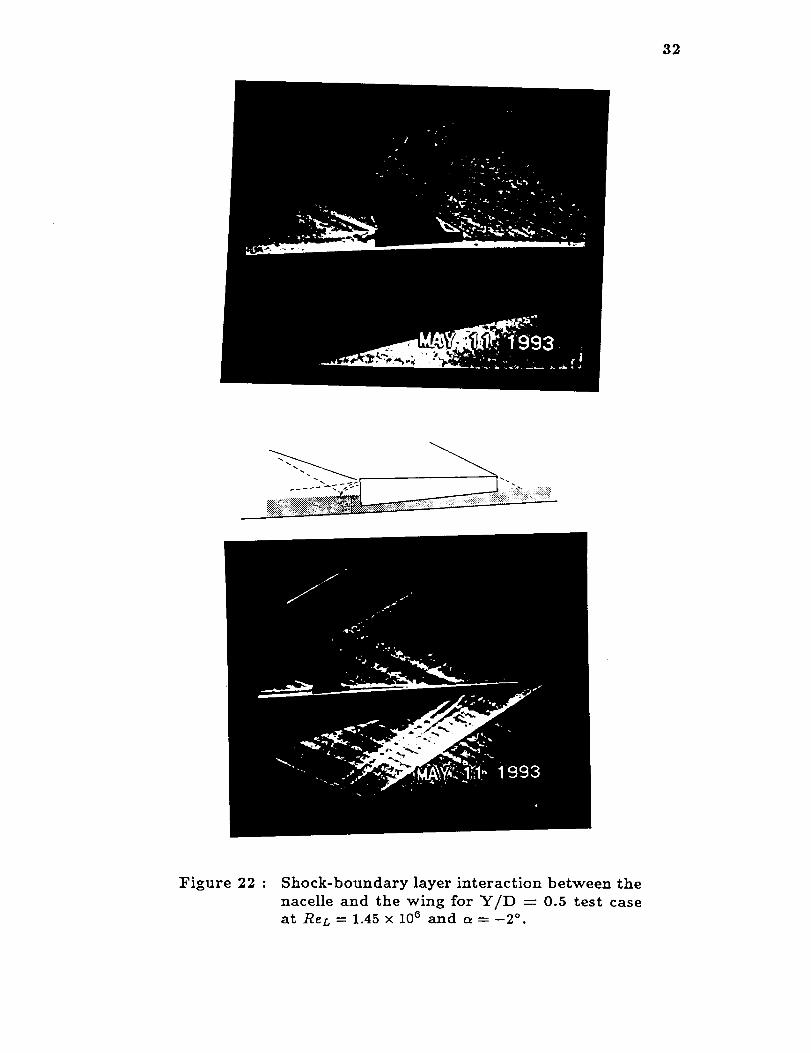
Results for Y/D -- 0.5 Case: One important aspect of the present study was
to bring the nacelle as close to the wing as possible and observe the interference
effects. For this reason, the nacelle was positioned so that its inlet could be partially
inside the wing boundary layer. As shown in the pictures (Figs. 22-25), the nacelle
leading edge shock wave at the wing-side is completely absent and there is an
attached shock wave from the nacelle lower (windward for a > 0 °) side. The wing
boundary layer appears to have no effect on the inlet normal shock.
For the thickest boundary layer (at a = -2°), a small fraction of the wing
boundary layer is entering to the nacelle. As it travels inside the nacelle duct,
it evidently thickens the internal boundary layer and partially distorts the internal
velocity distribution. How much thickness the wing boundary layer adds to the duct
is not seen on the pictures, but its effect on the flowfield becomes more pronounced
at the nacelle exit. The wing boundary layer just after the nacelle shows an increased
thickness, and it prevents the formation of one of the branches of the exit expansion
waves. The increase of thickness is also as a result of the additional turbulence
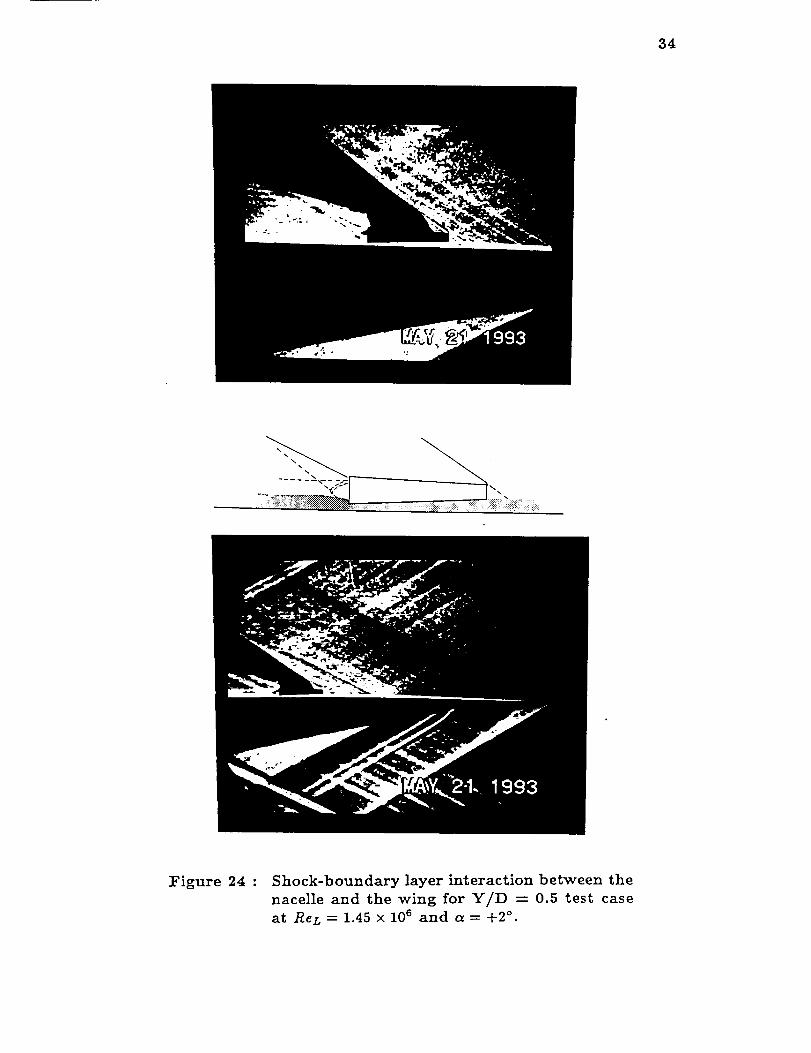
produced by the nacelle entry to the wing boundary layer. As the angle of attack is
increased from -2 ° to +4 °, there is a decrease in the wing boundary layer entering
to the duct and hence in the boundary layer thickness just downstream from the
nacelle. Furthermore, the nacelle exhaust flow appears to show a lessened effect of
the wing boundary layer impingement.
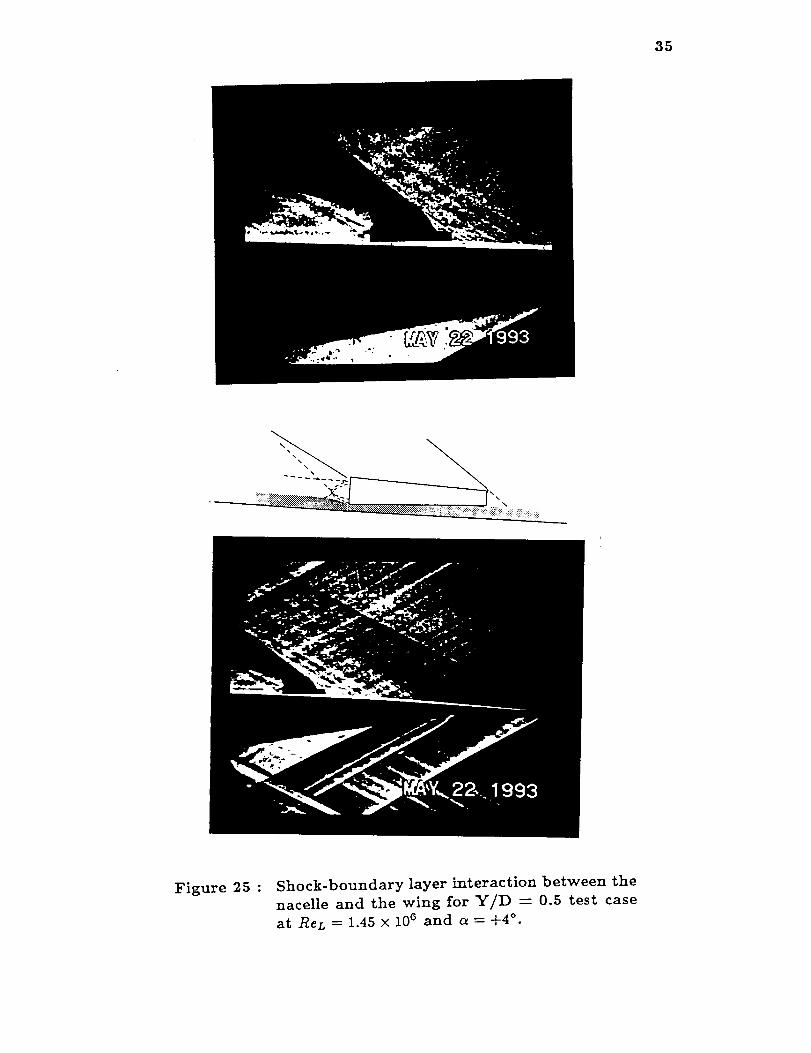
For this test case, the nacelle exit flow discharges into the wing boundary layer
flow. Since the boundary layer has lower velocity than both the freestream and
the nacelle exit flow, an over-expansion wave pattern occurs for the region where
the nacelle exit is inside the wing boundary layer. The occurence of both under-
and over-expansion flow for the same nacelle exit flow creates a rather complex
phenomenon and not clearly defined in the pictures. The merits of designing nacelles
which do not ingest boundary layer flow are evident from these pictures.

9
3.4 Future Work
The present study was made over relatively small range of angle of attack and
Reynolds number, mainly due to the supersonic wind tunnel limitations. Therefore,
there was not a significant difference in pictures obtained at either Reynolds number
of 1.16 x 10⁶ or 1.45 x 10⁶. It is known that boundary layer thickness of wing lower
surface increases with decrease of either Reynolds number or angle of attack. If a
study were made over a relatively wider range of Reynolds numbers even with the
present test angles of attack, there would be considarable information regarding the
shock-boundary layer interaction phenomena. In fact, a typical supersonic transport
aircraft operates at a cruise Reynolds number based on its nacelle length (say 12.5
foot) in the range of about 3 x 10⁷ at 50,000 foot altitude. This means that the test
Reynolds number was about 25 times lower than its flight counterpart.
Tests should be conducted for nacelles with reduced internal flow to produce a
detached shock in front. The detached shock wave interaction with the wing bound-
ary layer and subsequent mass flow spillage at the nacelle lip would be interesting
phenomena to visualize. This could be done by using the nacelle model with a flow
restrictor inside. The shock detachment characteristics could be studied by using
flow restrictors with various internal diameters.
4. CONCLUSIONS
A flow visualization study was made in the 9 x 9-inch supersonic wind tunnel
at Wichita State University to examine the shock and boundary layer flow patterns
between a nacelle and a simulated wing. Schlieren pictures recorded on a video tape
support the following conclusions:
1) The nacelle leading edge shock wave appears to be attached to the
inlet lip for all test cases.
2) The boundary layer on the wing lower surface is turbulent and the
shock-expansion waves from the nacelle do not have a significant im-
pingement effect on its character. At large wing-nacelle gaps (Y/D =
2 and 3), the shock-expansion waves are reflected from the boundary
layer back towards the nacelle wing-side.

10
3) When the wing-nacelle gap is set to Y/D = 1, the wing boundary
layer thickness becomes equal to the wing-nacelle gap at the nacelle
trailing edge at zero angle of attack.
4) For the smallest gap (Y/D = 0.5), the nacelle inlet is partially inside
the wing boundary layer. At -2 ° of angle of attack, some boundary
layer enters the nacelle and distorts the nacelle exhaust flow symme-
try. The amount of wing boundary layer flowing through the nacelle
and the associated distortion are lessened with increase in angle of
attack.
5. REFERENCES
[1] Rech, J. and Leyman, C.S., "Concorde Aerodynamics and Associated Systems
Development", AIAA Professional Study Series, 1980.
[2] Ferri, A., "Airframe/Engine Integration", AGARD Lecture Series No. 53,
May 1972.
[3] Mack, R.J., "A Numerical Method for Evaluation and Utilization of Supersonic
Nacelle-Wing Interference", NASA TN D-5057, March 1969.
[4] Harris, R.V., "A Numerical Technique for Analysis of Wave Drag at Lifting
Conditions", NASA TN D-3586, October 1966.
[5] Seddom, J. and Goldsmith, E.L., Intake Aerodynamics, AIAA Education Se-
ries, 1985.
[6] Irani, E. and Ellis, D.R., "Supersonic Wind Tunnel Visualization of Shock
Structures on Flow Through Engine Nacelles", Wichita State University, NIAR
Report 92-16, August 1992.
[7] Kuchemann, D., The Aerodynamic Design of Aircraft, Pergamon Press, 1978.
[8] Biber, K., "Calibartion and Use of WSU 9 × 9-inch Supersonic Wind Tunnel",
Wichita State University, NIAR Report 93-17, January 1993.
[9] Pope, A. and Goin, L.K., High-Speed Wind Tunnel Testing, Krieger, Inc.,
Malabar, FL, 1965.
[10] NASA Ames Research Staff, "Equations, Tables, and Charts for Compressible
Flow", NACA 1135 Report, 1953.

11
[11] Merzkirch, W., Flow Visualization, Academic Press, 1974.
[12] Schlichting, H., Boundary-Layer Theory, Seventh Edition, McGraw-Hill Co.,
1979.
[13] Shapiro, A.H., The Dynamics and Thermodynamics of Compressible Fluid
Flow, Volume I and II, The Ronald Press Co., 1954.
[14] Green, J.E., "Interactions Between Shock Waves and Turbulent Boundary
Layers", Progress in Aerospace Sciences, edited by D. Kuchemann, Pergamon
Press, 1970, pp. 235-340.

12
Table 1: Test cases presented on the Hi 8 mm video tape*
No Test Y_/p_P.(Dsia) M___1 Nacelle Alone -2 ° - 42 1.16 × 10⁶ 12 x 106 1.94
2 Nacelle Alone -2 ° - 52 1.45 x 10⁶ 15 x 106 1.94
3 Nacelle Alone 0 ° - 42 1.16 x 10⁶ 12 × 106 1.94
4 Nacelle Alone 0 ° - 52 1.45 × 10⁶ 15 x 106 1.94
5 Nacelle Alone +2 ° - 42 1.16 x 10⁶ 12 x 106 1.94
6 Nacelle Alone +2 ° - 52 1.45 × 10⁶ 15 x 106 1.94
7 Nacelle Alone +4 ° - 42 1.16 x 10⁶ 12 x 106 1.94
8 Nacelle Alone +4 ° - 52 1.45 x 10⁶ 15 × 106 1.94
9 Wing/Nacelle -2 ° 0.5 42 1.16 x 10⁶ 12 × 106 1.94
10 Wing/Nacelle -2 ° 0.5 42 1.16 x 10⁶ 12 x 106 1.94
11 Wing/Nacelle -2 ° 0.5 52 1.45 × 10⁶ 15 × 106 1.94
12 Wing/Nacelle -2 ° 0.5 52 1.45 × 10 e 15 x 106 1.94
13 Wing/Nacelle 0 ° 0.5 42 1.16 × 10⁶ 12 × 106 1.94
14 Wing/Nacelle 0 ° 0.5 42 1.16 × 10⁶ 12 x 106 1.94
15 Wing/Nacelle 0 ° 0.5 52 1.45 × 10⁶ 15 x 106 1.94
16 Wing/Nacelle 0 ° 0.5 52 1.45 x 10⁶ 15 × 106 1.94
17 Wing/Nacelle +2 ° 0.5 42 1.16 x 10 e 12 × 106 1.94
18 Wing/Nacelle +2 ° 0.5 42 1.16 x 10⁶ 12 x 106 1.94
19 Wing/Nacelle +2 ° 0.5 52 1.45 × 10⁶ 15 × 106 1.94
20 Wing/Nacelle +2 ° 0.5 52 1.45 x 10⁶ 15 × 106 1.94
21 Wing/Nacelle +4 ° 0.5 42 1.16 x 10⁶ 12 x 106 1.94
22 Wing/Nacelle +4 ° 0.5 42 1.16 × 10⁶ 12 x 106 1.94
23 Wing/Nacelle +4 ° 0.5 52 1.45 × 10⁶ 15 × 106 1.94
24 Wing/Nacelle +4 ° 0.5 52 1.45 × 10⁶ 15 × 106 1.94
Note that the wing/nacelle runs were repeated for each test case: the whole
wing/nacelle flowfield was filmed on the first run, while only the region close to
the nacelle was captured on the second.
13
Table 1: Continued
No
25
26
27
28
29
30
31
32
33
34
35
36
37
38
39
40
Test
Wing/Nacelle
Wing/Nacelle
Wing/Nacelle
Wing/Nacelle
Wing/Nacelle
Wing/Nacelle
Wing/Nacelle
Wing/Nacelle
Wing/Nacelle
Wing/Nacelle
Wing/Nacelle
Wing/Nacelle
Wing/Nacelle
Wing/Nacelle
Wing/Nacelle
Wing/Nacelle
Y_LD_p (Dsia)
-2 ° 1 42
-2 ° 1 42
-2 ° 1 52
-2 ° 1 52
0 ° 1 42
0° 1 42
0° 1 52
0° 1 52
+2 ° 1 42
+2 ° 1 42
+2 ° 1 52
+2 ° 1 52
+4 ° 1 42
+4 ° 1 42
+4 ° 1 52
+4 ° 1 52
1.16 x I0e
1.16 x 10⁶
1.45 x 10⁶
1.45 x 10⁶
1.16 x 10 6
1.16 x 10 6
1.45 x 10⁶
1.45 x 10⁶
1.16 x 10 6
1.16 x 10 6
1.45 x 10⁶
1.45 x 10⁶
1.16 x 10⁶
1.16 x 10⁶
1.45 x 10⁶
1.45 x 10⁶
12 x 106
12 x 106
15 X 106
15 × 106
12 x 106
12 x 106
15 x 106
15 × 106
12 x 106
12 x 10 6
15 x 106
15 x 10 6
12 x 106
12 x 106
15 x 10 6
15 x I06
M
1.94
1.94
1.94
1.94
1.94
1.94
1.94
1.94
1.94
1.94
1.94
1.94
1.94
1.94
1.94
1.94
41
42
43
44
45
46
47
48
49
50
51
52
53
54
55
56
Wing/Nacelle -2 ° 2 42
Wing/Nacelle -2 ° 2 42
Wing/Nacelle -2 ° 2 52
Wing/Nacelle -2 ° 2 52
Wing/Nacelle 0 ° 2 42
Wing/Nacelle 0° 2 42
Wing/Nacelle 0 ° 2 52
Wing/Nacelle 0 ° 2 52
Wing/Nacelle +2 ° 2 42
Wing/Nacelle +2 ° 2 42
Wing/Nacelle +2 ° 2 52
Wing/Nacelle +2 ° 2 52
Wing/Nacelle +4 ° 2 42
Wing/Nacelle +4 ° 2 42
Wing/Nacelle +4 ° 2 52
Wing/Nacelle +4 ° 2 52
1.16 x 10⁶
1.16 x 10⁶
1.45 x 10 6
1.45 x 10 6
1.16 × 10⁶
1.16 x 10⁶
1.45 x 10 6
1.45 x 10⁶
1.16 x 10⁶
1.16 × 10⁶
1.45 x 10 6
1.45 x 10 6
1.16 x 10 6
1.16 x 10⁶
1.45 × 10⁶
1.45 x 10⁶
12 x 106
12 x 10 6
15 x 10 6
15 x 10 6
12 x 106
12 × 106
15 x 106
15 x 10 6
12 x 106
12 x 106
15 × i06
15 "_106
12 × 10 6
12 × 106
15 x 10 6
15 × 106
1.94
1.94
1.94
1.94
1.94
1.94
1.94
1.94
1.94
1.94
1.94
1.94
1.94
1.94
1.94
1.94

14
Table 1: Concluded
No
57
58
59
60
61
62
63
64
65
66
67
68
69
70
71
72
Test
Wing/Nacelle
Wing/Nacelle
Wing/Nacelle
Wing/Nacelle
Wing/Nacelle
Wing/Nacelle
Wing/Nacelle
Wing/Nacelle
Wing/Nacelle
Wing 'Nacelle
Wing 'Nacelle
Wing 'Nacelle
Wing 'Nacelle
Wing 'Nacelle
Wing rNacelle
Wing ¢Nacelle
P.r(psi )
-2 ° 3 42
-2 ° 3 42
-2 ° 3 52
-2 ° 3 52
0 ° 3 42
0 ° 3 42
0 ° 3 52
0 ° 3 52
+2 ° 3 42
+2 ° 3 42
+2 ° 3 52
+2 ° 3 52
+4 ° 3 42
+4 ° 3 42
+4 ° 3 52
+4 ° 3 52
1.16 x 10⁶
1.16 x 10⁶
1.45 x 10⁶
1.45 x 10⁶
1.16 x 10⁶
1.16 x 10⁶
1.45 × 10⁶
1.45 x 10⁶
1.16 x 10⁶
1.16 x 10⁶
1.45 x 10⁶
1.45 x 10⁶
1.16 x 10⁶
1.16 x 10⁶
1.45 x 10⁶
1.45 x 10⁶
R _tktt
12 x 106
12 x 106
15 x 106
15 x 106
12 x 106
12 x 106
15 x 106
15 x 106
12 x 106
12 x 10 6
15 x 106
15 x I06
12 x 106
12 x 10 6
15 x 106
15 × 106
M
1.94
1.94
1.94
1.94
1.94
1.94
1.94
1.94
1.94
1.94
1.94
1.94
1.94
1.94
1.94
1.94

/I I
t_
• O
_ u
_p.,I

16
ATTACHED
NORMAL SHOCK
___ •
M>I
CON__
OBLIQUE SHOCK
a)
DETACHED SHOCK
\
\
M>I
FLOW
, RESTR/CTOR
SPILLAGE /
_ SONIC LINE
b)
Figure 2 : Attached/detached shock flow position for a
sharp-lip pitot nacelle inlet: a) Attached nor-
mal shock to the inlet lip, b) Detached shock
with flow restrictor inside the nacelle.
WING SURFACE a)
DISTORTION OF VELOCITY
DISTRIBUTION
___ ._ .... f--
b)Figure 3 : Nacelle inlet position with respect to the wing
boundary layer: a) Non-affected inlet internal
flow, b) Distorted inlet internal flow due to
boundary layer injection.
17
oo
\0
o
I
og.-_!
_'_
X
@
ol
18
D L ' 2.5 °
! , I I____.__L__
..... _ ........................ A
8D
1L = 1.164 in PYLON
D = 0.12 in &e25c
6
--I 8.28C '-- 'C-(_.751_--' (_._8C I--
Figure 5 : Geometric details of nacelle/pylon.
l t 'o .= WING-NACELLE GAP
0
o_
6 in 3 in
°
I rI
Figure 6 : Geometric details of simulated wing.
19
0
Z
0
z
z
0
D_,=I
'_._
oo
20
1
/
1
•_ _
B_MI
Q_ lilO "4"_!
QO
00
l'l
r_
21
z
m
0
n
bl
• p,,,I
Qep,_
o F,,,I
• ,..4 _
Go
22
Figure 10 : Shock and expansion wave flow patterns overthe nacelle at .ReL = 1.45 × 10⁶ and a = -2 °
Figure 11 : Shock and expansion wave flow patterns overthe nacelle at ReL = 1.45 x 10⁸ and a = 0 °
23
Figure 12 : Shock and expansion wave flow patterns overthe nacelle at /_eL = 1.45 X 10⁸ and a = +2 °
Figure 13 : Shock and expansion wave flow patterns overthe nacelle at ReL = 1.45 x l0 s and _ = +4 °
24
Figure 14 : Shock-boundary layer interaction between the
nacelle and the wing for Y/D -'- 3 test case at
_ReL = 1.45 × 10⁶ and a = -2 ° •
25
:Figure 15 : Shock-boundary layer interaction between the
nacelle and the wing for Y/D = 3 test case at
ReL = 1.45 X 10⁸ and a = +4 °.
26
Figure 16 : Shock-boundary layer interaction between the
nacelle and the wing for Y/D -----_ test case at
ReL=l.45x10 s and a=-2 °•

_7
: ==_=:=:=
Figure 17 : Shock-boundary layer interaction between the
nacelle and the wing for Y/D _- _ test case at
ReL=l.45× 106 and _--+4 °•
28
Figure 18 : Shock-boundary layer interaction between the
nacelle and the wing for Y/D = 1 test case at
ReL -----1.45 x 10⁶ and a = -2 °.

29
Figure 19 : Shock-boundary layer interaction between the
nacelle and the wing for Y/D = 1 test case at
ReL=l.45x106 and a=0 °.
30
Figure 20 : Shock-boundary layer interaction between the
nacelle and the wing for Y/I) -- 1 test case at
ReL = 1.45 x 10⁶ and a = +2 °.

31
Figure 21 : Shock-boundary layer interaction between the
nacelle and the wing for Y/D -- i test case at
_eL=1.45× 10⁶ and _=+4 °.
32
ii ilili! i !ii
Figure 22 : Shock-boundary layer interaction between the
nacelle and the wing for Y/D = 0.5 test caseat ReL =1.45x 10⁶ and a=-2 ° .

33
Figure 23 : Shock-boundary layer interaction between the
nacelle and the wing for Y/D -- 0.5 test caseat ReL=1.45×10⁶ and _=0 °.
34
%_-\%
. !i!!_i!_i_!!!i!iii_!i_i!ii!_ii_iiii!! i!_iiiiii_ii_:iii_!i_?i/!!!_iii:_
Figure 24 : Shock-boundary layer interaction between the
nacelle and the wing for Y/D = 0.5 test case
at ReL=l.45 × 106 and a= +2 °.
35
Figure 25 : Shock-boundary layer interaction between the
nacelle and the wing for Y/D = 0.5 test case
at ReL = 1.45x 10⁶ and _=+4 ° •