Embed Size (px)
Citation preview
WISCONSIN FREIGHT RAIL DAYOCTOBER 26, 2012
Superior Silica Sands“We’re in the Logistics Business”
Rick ShearerPresident & CEOSuperior Silica Sands
WELL STIMULATION AND FRACTURING
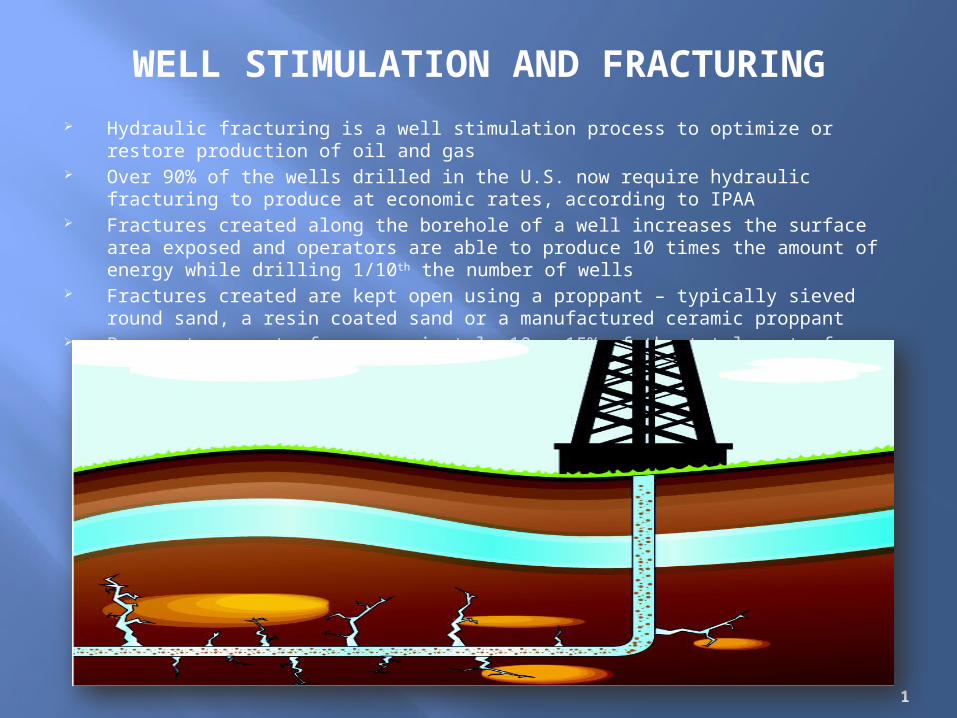
Hydraulic fracturing is a well stimulation process to optimize or restore production of oil and gas Over 90% of the wells drilled in the U.S. now require hydraulic fracturing to produce at economic rates,
according to IPAA Fractures created along the borehole of a well increases the surface area exposed and operators are able
to produce 10 times the amount of energy while drilling 1/10 th the number of wells Fractures created are kept open using a proppant – typically sieved round sand, a resin coated sand or a
manufactured ceramic proppant Proppant accounts for approximately 10 – 15% of the total cost of drilling and completing a typical
horizontal well
1
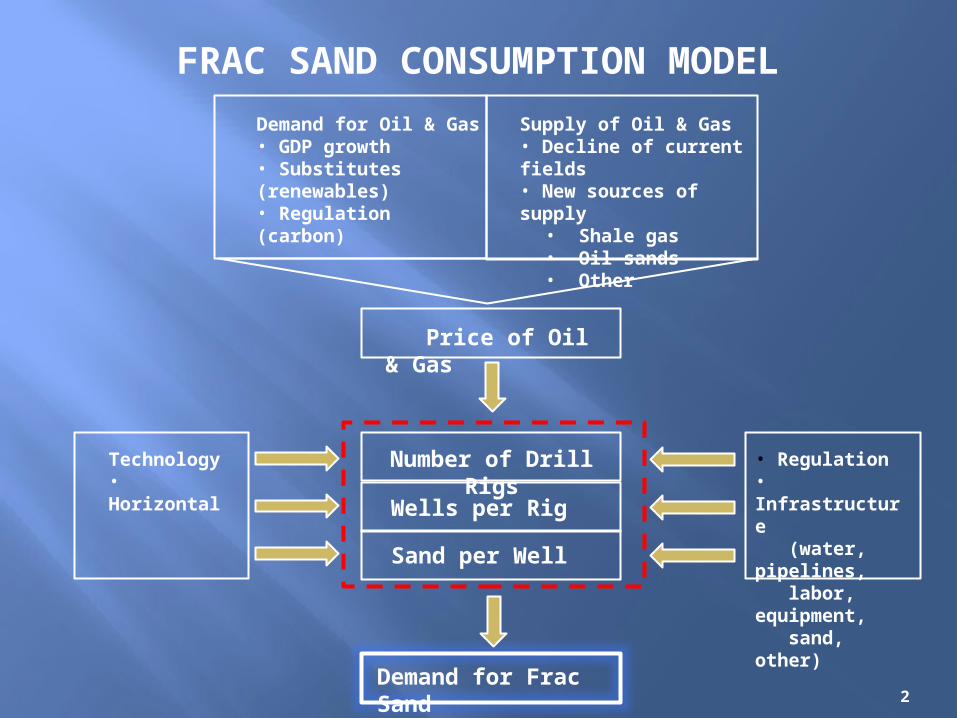
FRAC SAND CONSUMPTION MODEL
Demand for Oil & Gas• GDP growth• Substitutes (renewables)• Regulation (carbon)
Supply of Oil & Gas• Decline of current fields• New sources of supply• Shale gas• Oil sands• Other
Price of Oil & Gas
Number of Drill Rigs
Wells per Rig
Sand per Well
Demand for Frac Sand
Technology• Horizontal drilling• Hydraulic fracturing
• Regulation• Infrastructure (water, pipelines, labor, equipment, sand, other)
2
Atwood Industry Review 20070601 v2
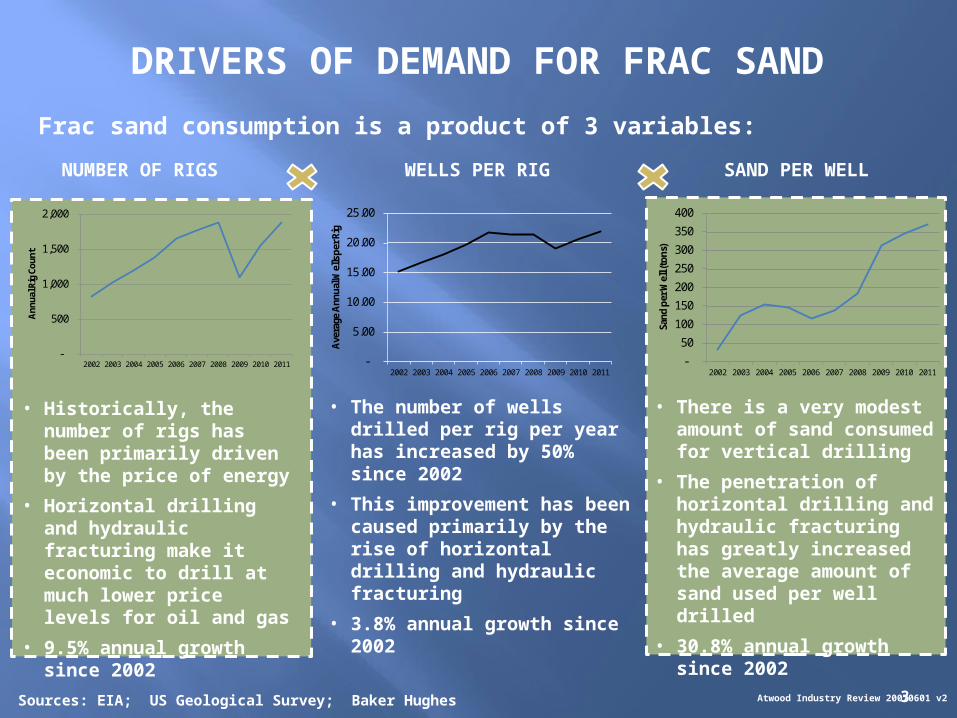
DRIVERS OF DEMAND FOR FRAC SAND
NUMBER OF RIGS SAND PER WELLWELLS PER RIG
• The number of wells drilled per rig per year has increased by 50% since 2002
• This improvement has been caused primarily by the rise of horizontal drilling and hydraulic fracturing
• 3.8% annual growth since 2002
• There is a very modest amount of sand consumed for vertical drilling
• The penetration of horizontal drilling and hydraulic fracturing has greatly increased the average amount of sand used per well drilled
• 30.8% annual growth since 2002
Sources: EIA; US Geological Survey; Baker Hughes
Frac sand consumption is a product of 3 variables:
-
50
100
150
200
250
300
350
400
2002 2003 2004 2005 2006 2007 2008 2009 2010 2011
Sand
per
Wel
l (to
ns)
3
• Historically, the number of rigs has been primarily driven by the price of energy
• Horizontal drilling and hydraulic fracturing make it economic to drill at much lower price levels for oil and gas
• 9.5% annual growth since 2002
-
500
1,000
1,500
2,000
2002 2003 2004 2005 2006 2007 2008 2009 2010 2011
Ann
ual R
ig C
ount

HORIZONTAL DRILLING PENETRATION
4
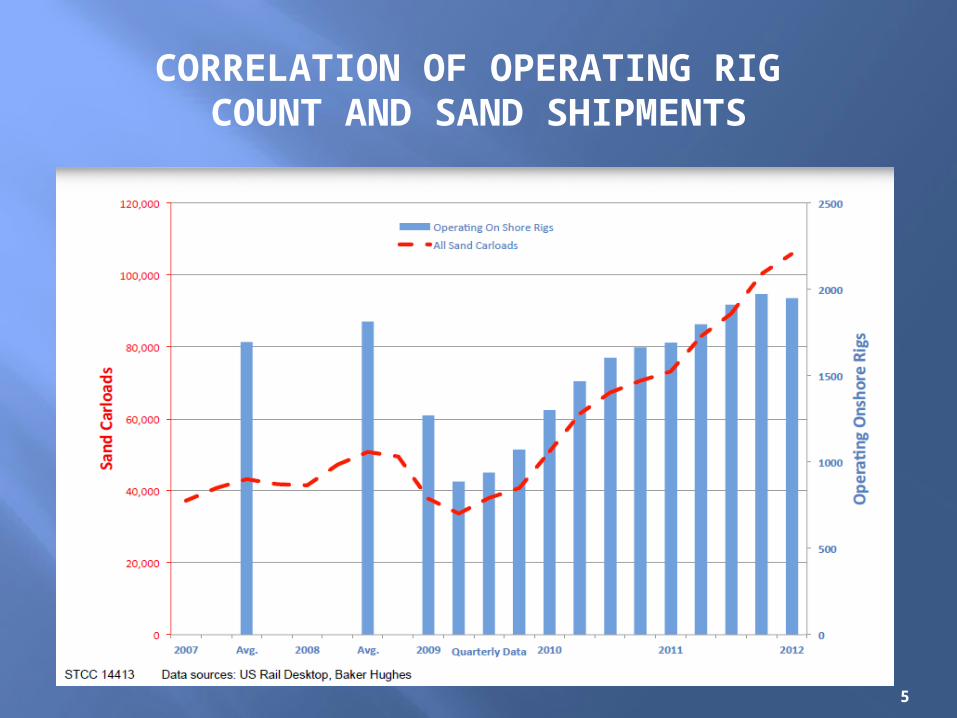
CORRELATION OF OPERATING RIG COUNT AND SAND SHIPMENTS
5
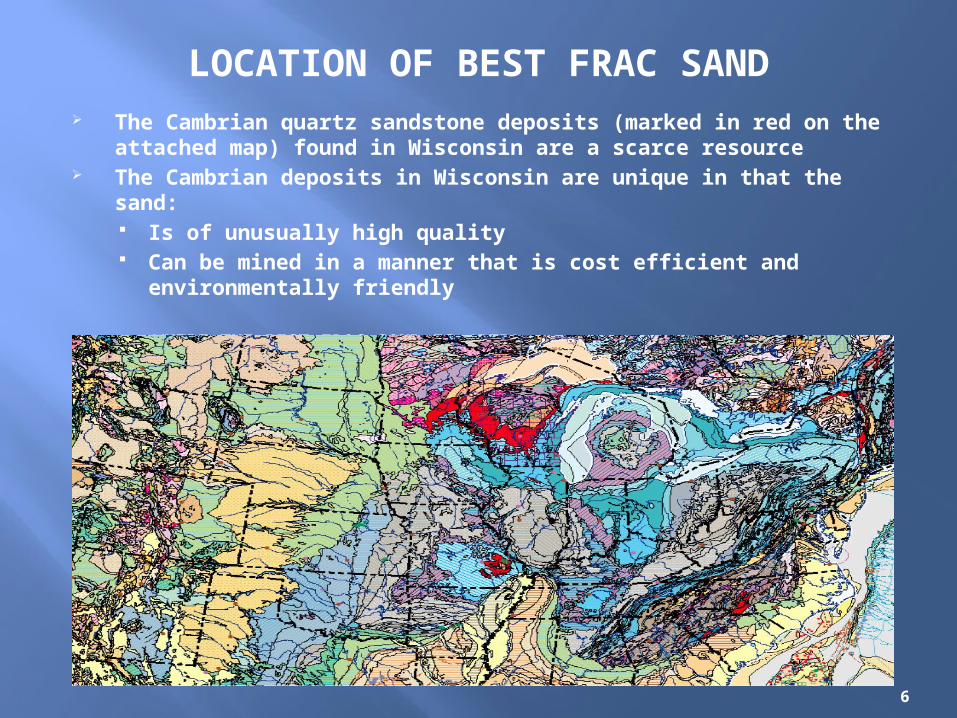
LOCATION OF BEST FRAC SAND The Cambrian quartz sandstone deposits (marked in red on the attached map) found
in Wisconsin are a scarce resource The Cambrian deposits in Wisconsin are unique in that the sand:
Is of unusually high quality Can be mined in a manner that is cost efficient and environmentally friendly
WHERE THE BEST FRAC SAND IS (RED)
Source: Where-the-best-sand-is – Brown Presentation
6
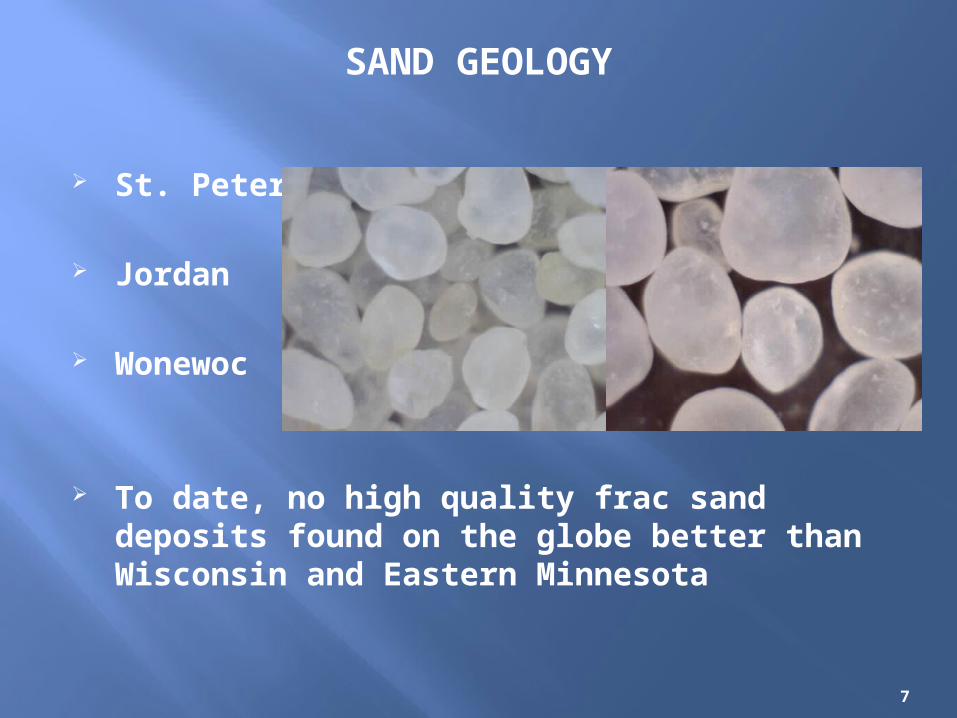
St. Peter’s
Jordan
Wonewoc
To date, no high quality frac sand deposits found on the globe better than Wisconsin and Eastern Minnesota
SAND GEOLOGY
7
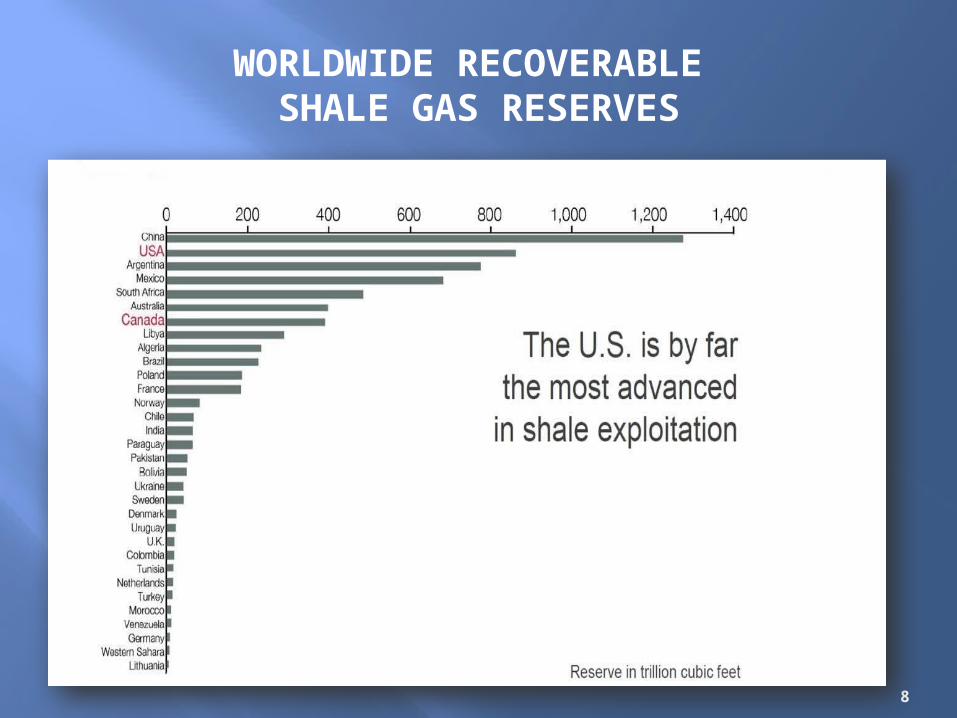
WORLDWIDE RECOVERABLE SHALE GAS RESERVES
8
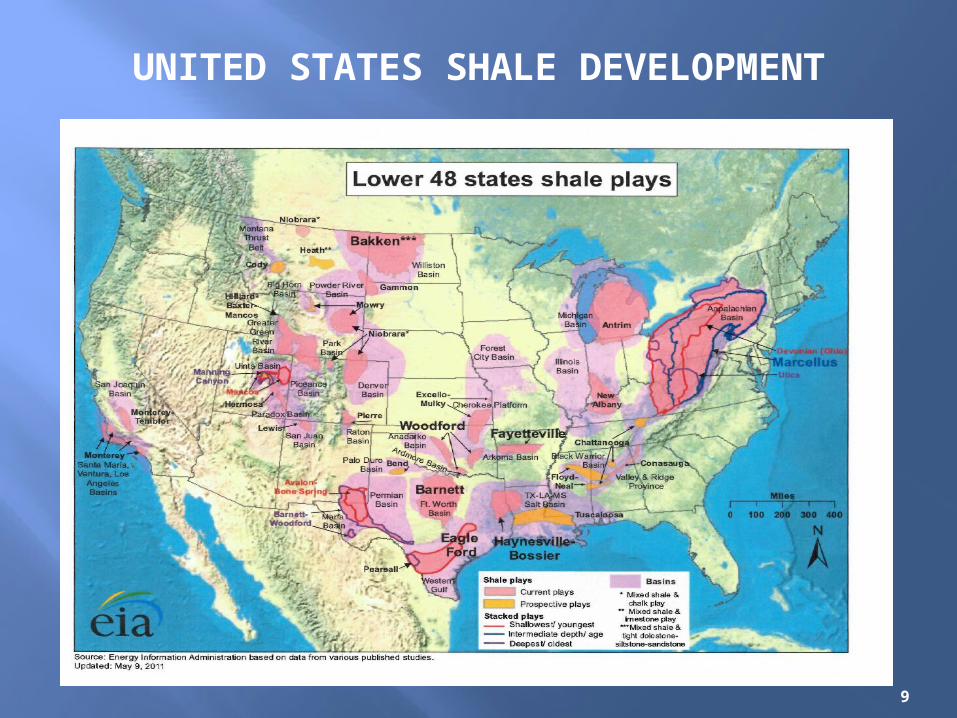
UNITED STATES SHALE DEVELOPMENT
9
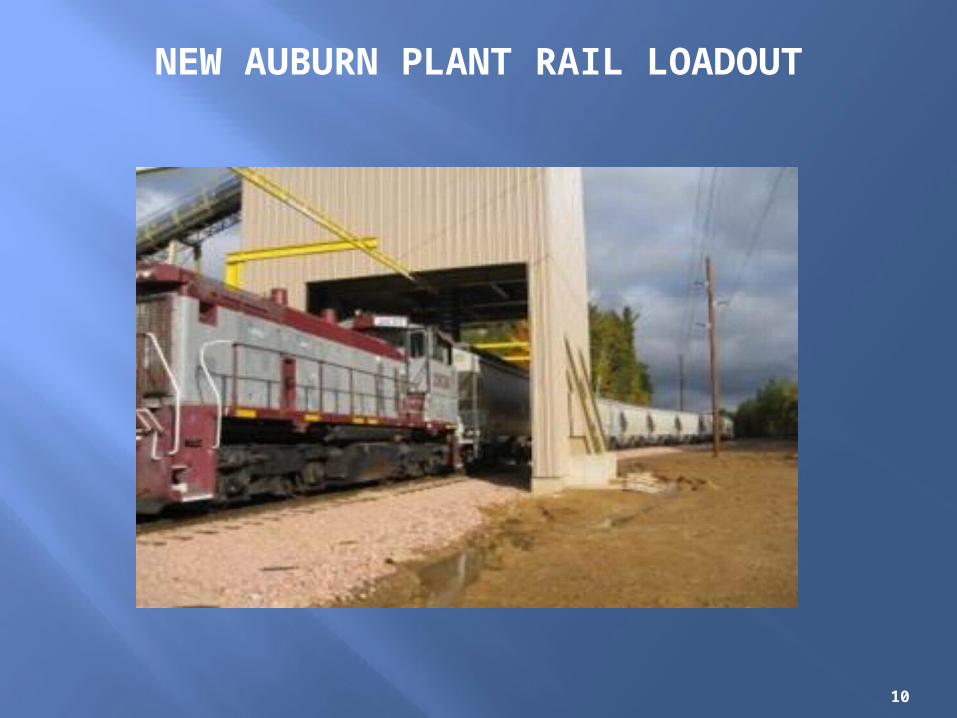
NEW AUBURN PLANT RAIL LOADOUT
10
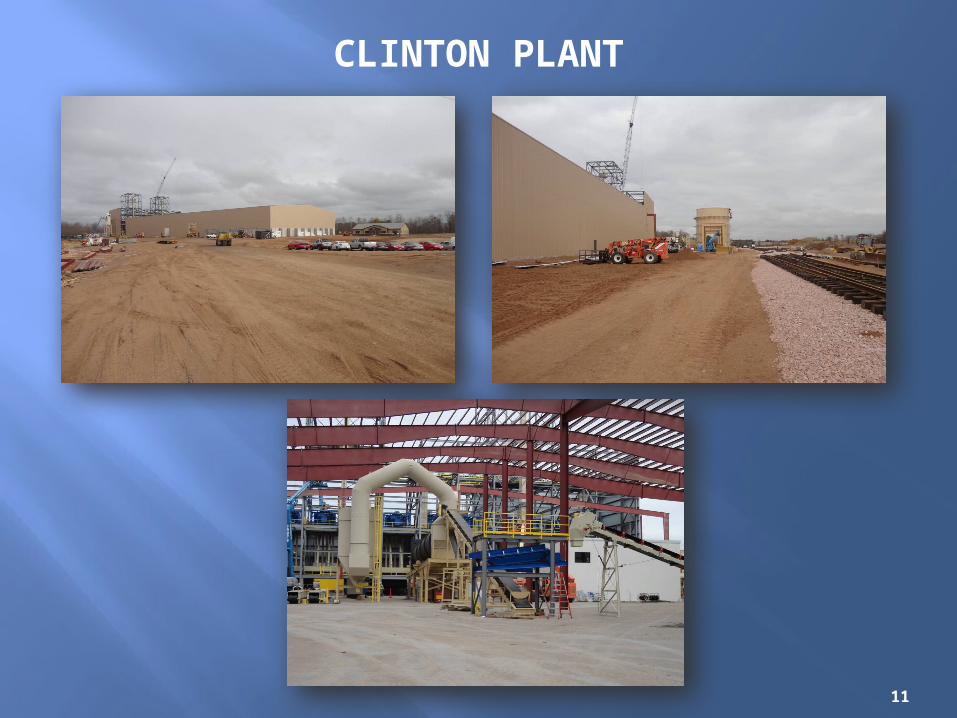
CLINTON PLANT
11
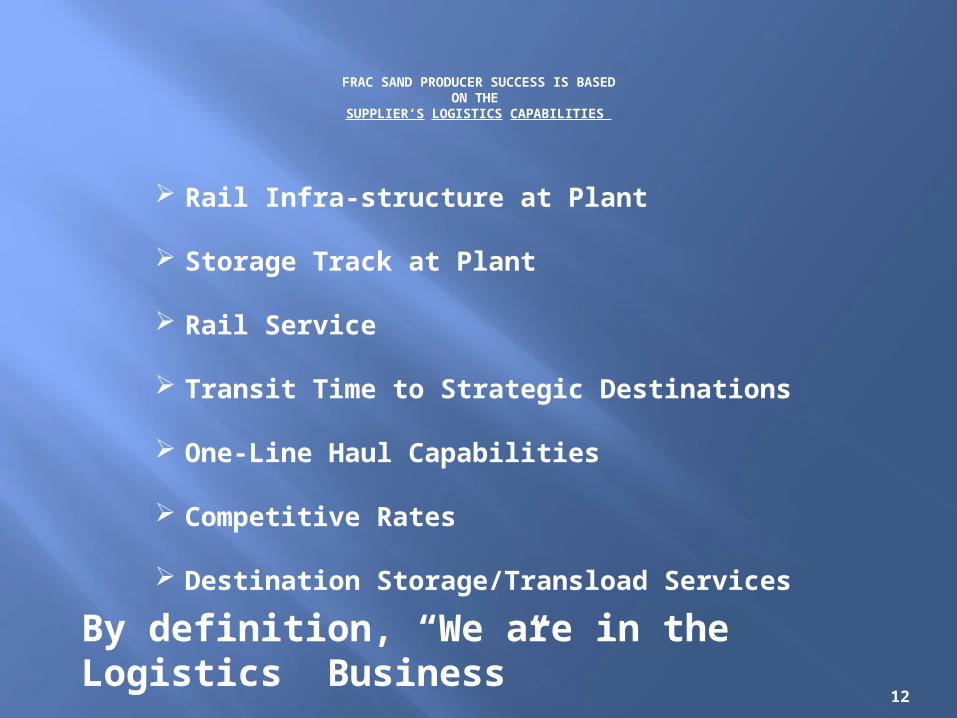
FRAC SAND PRODUCER SUCCESS IS BASEDON THE
SUPPLIER’S LOGISTICS CAPABILITIES
12
Rail Infra-structure at Plant
Storage Track at Plant
Rail Service
Transit Time to Strategic Destinations
One-Line Haul Capabilities
Competitive Rates
Destination Storage/Transload Services
By definition, “We are in the Logistics Business”
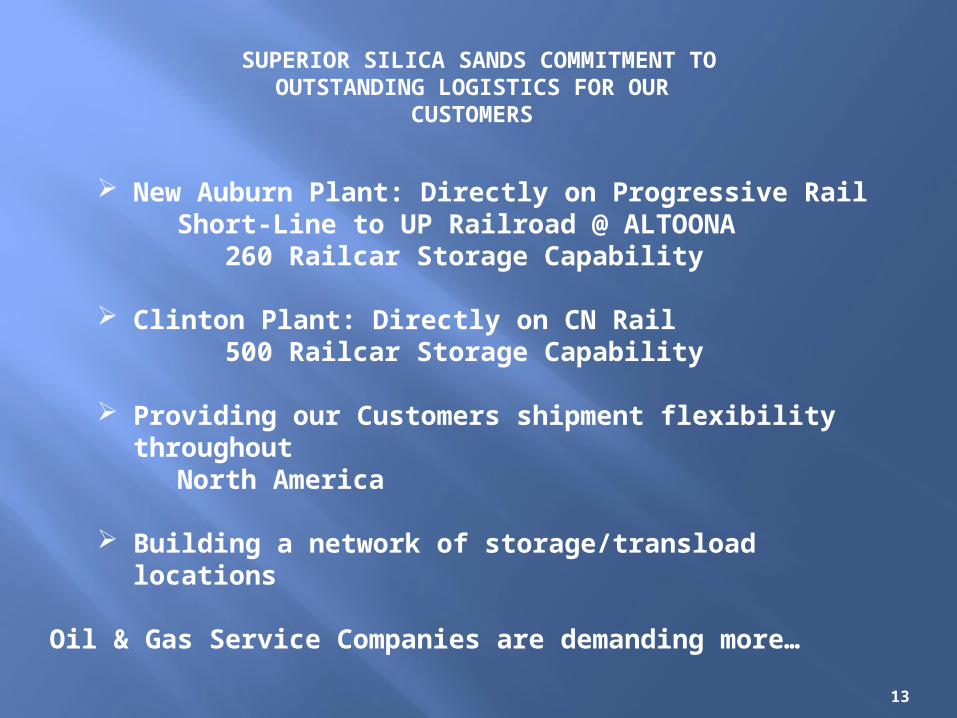
SUPERIOR SILICA SANDS COMMITMENT TOOUTSTANDING LOGISTICS FOR OUR
CUSTOMERS
13
New Auburn Plant: Directly on Progressive Rail Short-Line to UP Railroad @ ALTOONA 260 Railcar Storage Capability
Clinton Plant: Directly on CN Rail 500 Railcar Storage Capability
Providing our Customers shipment flexibility throughout North America
Building a network of storage/transload locations
Oil & Gas Service Companies are demanding more…
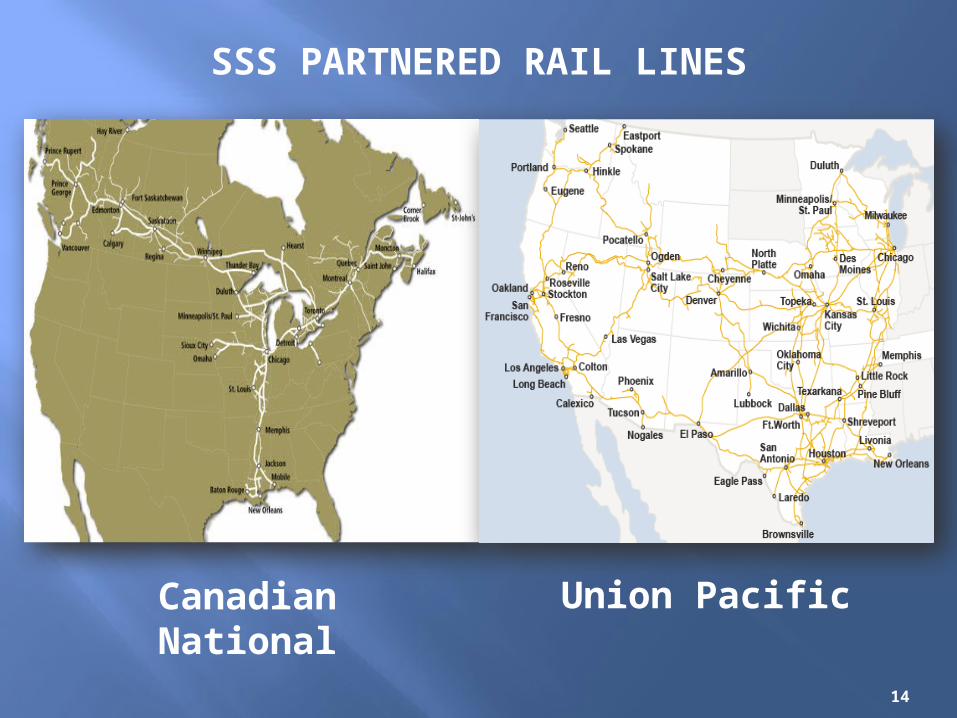
SSS PARTNERED RAIL LINES
14
Canadian National Union Pacific
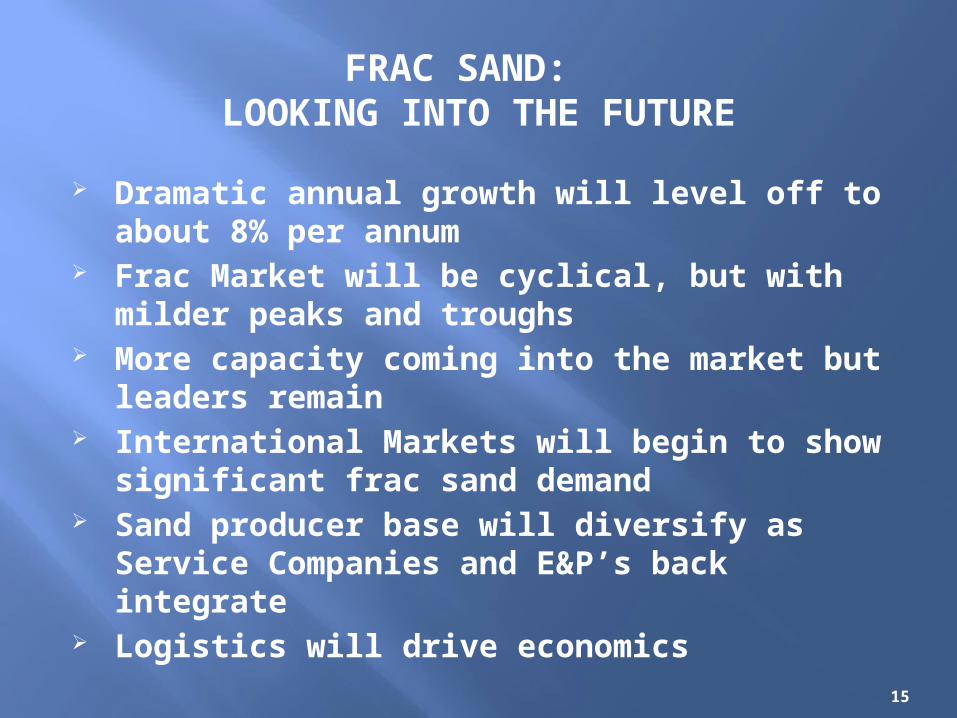
FRAC SAND: LOOKING INTO THE FUTURE
Dramatic annual growth will level off to about 8% per annum
Frac Market will be cyclical, but with milder peaks and troughs
More capacity coming into the market but leaders remain
International Markets will begin to show significant frac sand demand
Sand producer base will diversify as Service Companies and E&P’s back integrate
Logistics will drive economics
15
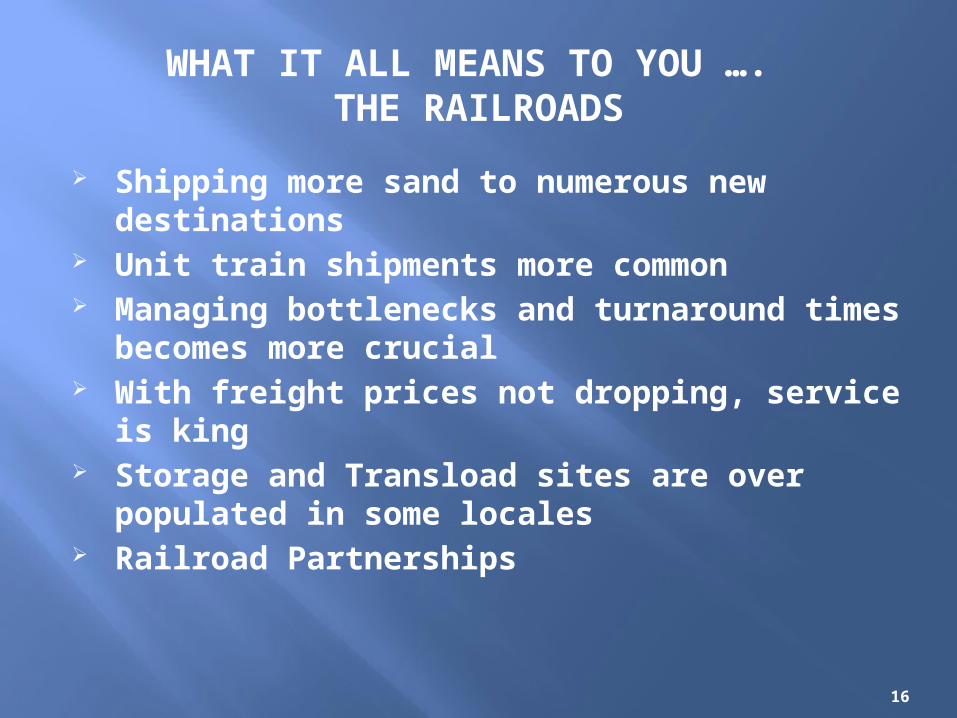
WHAT IT ALL MEANS TO YOU …. THE RAILROADS
Shipping more sand to numerous new destinations Unit train shipments more common Managing bottlenecks and turnaround times becomes
more crucial With freight prices not dropping, service is king Storage and Transload sites are over populated in some
locales Railroad Partnerships
16
CONCLUSIONS
The Frac Sand Boom is a “Once in a Lifetime” event. Wisconsin is the Global Epicenter Efficiency and cost Effectiveness in shipping this
important proppant is critical Rail is a major focal point to complete market success Any successful frac sand producer is actually in the
Logistics Business!
17