Embed Size (px)
Citation preview
-Xi amral
Environment Research Council
British Geological Survey
TECHNICAL REPORT WG/93/11
Mineralogy and Petrology Series
Industrial minerals potential of Fiji
OJ Harri son, S 0 J Inglethorpe & C J Mitchell
Mineralogy & Petrology Group British Geological Survey Keyworth Tottingham
United Kingdom G 12 5GG

This report has been generated from a scanned image of the document with any blank pages removed at the scanning stage. Please be aware that the pagination and scales of diagrams or maps in the resulting report may not appear as in the original
<) .'
BRITISH GEOLOGICAL SURVEY
TECHNICAL REPORT
Mineralogy & Petrology Series
REPORT NO. WG/93/11
INDUSTRIAL MINERALS POTENTIAL OF FIJI
D J Harrison, S D J Inglethorpe & C J Mitchell
Date 4 May 1993
Classification Open-file
Geographical index Fiji
Subject index
Industrial minerals, limestone, brick clay, mineral sand, aggregate
Bibliographic reference
Harrison, D J, Inglethorpe, S D J & Mitchell, C J {l993) Industrial minerals potential of Fiji. British
Geological Survey Technical Report WGt93tll
© NERC 1993 . British Geological Survey, Keyworth, Nottingham NG12 5GG, UK
---------- - ---
1. INTRODUCTION
British Geological Survey
Mineralogy & Petrology Group
Technical Report WG/93/11
Industrial minerals potential of Fiji
CONTENTS
2. INDUSTRIAL MINERALS IN FIJI
3. IMPORTS OF INDUSTRIAL MINERALS IN FIJI
4. LABORATORY STUDIES
4.1. Limestones
4.2. Clays for brickmaking
4.3. Mineral sands
4.4. Aggregates
4.5. Bauxite
5. CONCLUSIONS
6. RECOMMENDATIONS
7. BIBLIOGRAPHY
(i)
Page
1
1
3
4
4
10 17 22
24
24
26
27
British Geological Survey Mineralogy & Petrology Group
Technical Report WG/93/11 INDUSTRIAL MINERALS POTENTIAL OF FIJI
D J Harrison, S D J Inglethorpe and C J Mitchell
1. INTRODUCTION
This report details the preliminary evaluation of industrial minerals in Fiji undertaken by BGS on behalf of the ODAJBGS R&D Programme Project No.91/1, 'Minerals for Development'. The Programme forms part of the British Government's provision of technical assistance to the developing countries. A visit was made to the Mineral Resources Department (MRD), Fiji, between 21 September and 5 October 1992 for the purposes of collating information of known industrial mineral deposits, for examining and sampling some potential deposits on Viti Levu and Vanua Levu and for gathering information on current and likely future requirements for industrial minerals in Fiji. Details of the visit are given in a short report (Harrison, 1992).
The rock and mineral samples were transported to the UK and have been investigated in some detail by project staff in the Mineralogy and Petrology Group laboratories at BGS, Keyworth. This report gives the results of the laboratory studies and of the data assessment; some statistical information on industrial mineral imports in Fiji and suggested recommendations for further detailed investigations. Such investigations are required to provide a basis for the Fijian Government to plan the best use of the country's natural resources and ·to consider export potential and import substitution. A Bibliography is included which lists the most important literature sources for each major potential industrial mineral in Fiji.
2. INDUSTRIAL MINERALS IN FIJI
This section outlines the most important industrial mineral deposits in Fiji. All of these deposits have been previously identified and reported on (see Bibliography) but in most cases no systematic studies or inventories of the various deposits were made. In some cases, the source information was difficult to locate or obtain.
Fiji has known deposits of the following industrial minerals, some of which may have economic potential;
1. Brick clays 2. Limestones 3. Marble and other dimension stones 4. Phosphates 5. Coralline sand 6. Aggregates (crushed rock, sand and gravel, pumice) 7. Mineral sands 8. Bauxite 9. Minor deposits of baryte, zeolite, perlite, kaolinite etc.
At the time of the visit the only deposits actually being extracted were aggregates (crushed basalt and alluvial sand and grave!), although coralline sands were also dredged offshore for cement manufacture. There is, however, local demand for dimension stone and two marble/limestone deposits are potentially exploitable resources and have attracted some development interest. It is known that in the recent past Fiji has produced lime and bricks from local deposits and there is sufficient geological knowledge to be confident that these commodities form potential resources in Fiji. What is lacking are detailed evaluations, including field investigations, laboratory characterizations and assessments.
1
This study contributes to the knowledge base on potential resources by including detailed laboratory assessments of samples taken from the most important brick clay, limestone, marble and mineral sand deposits. Some laboratory analytical and test data are also included on certain crushed rock aggregate, pumice and bauxite samples. Phosphate rock was not considered as there was insufficient time available to visit these relatively remote deposits, many of which have also been previously investigated to at least the reconnaissance level.
2.1. Limestones and marbles
There are many deposits of carbonate rock in Fiji, but the the most important are situated on Viti Levu. A few smaller deposits occur on Vanua Levu. The location, geology and sparse quality data on these limestones and marbles are summarised by Rahiman (1983). Other relevant references are given in the Bibliography. The main deposits of relatively pure carbonate rock are:
Viti Levu Wainevesi marble Qalimare limestone Tau limestone
Vanua Levu Tua Tua limestone Devodara limestone
Samples of all these rocks were obtained during the visit and a range of analytical and laboratory procedures were carried out to determine their physical and chemical properties. Details of the laboratory assessment are given in Section 4.1.
Limestones or marbles are not currently quarried in Fiji, although until recently the Tau Limestone was extracted for lime production for use in the processing of gold ore. The demand for dimension stone has led to extensive recent investigations (including cored borehole exploration programmes) of the marble deposits at Wainevesi, north east Viti Levu and the limestone deposits at Qalimare in the Sigatoka valley.
2.2. Brick clays
Clay bricks used to be manufactured in Fiji, but production ceased over 70 years ago and concrete blocks or concrete are now the preferred building materials. Ceramic floor and wall tiles are used in Fiji, particularly in office construction or hotel developments, but none are manufactured in Fiji.
Clay deposits have previously been identified (see Bibliography) near Nadi in western Viti Levu and also on the Rewa delta in the vicinity of Koronivia flat and Bau in eastern Viti Levu. Some reconnaissance investigations including augering, sampling and firing tests have been carried out on these clays, but no systematic resource assessments have been attempted. 10 samples from exposures, excavations and auger holes in the Koronivia and Bau clays were collected during the visit in order to assess their potential as brick clays. Details of the laboratory investigations which included determinations of mineralogy, particle size and firing properties are given in Section 4.2.
2.3. Mineral sands
The largest deposits of heavy mineral sands in Fiji are the iron sands forming the Sigatoka sand dunes and adjacent offshore deposits at the mouth of the Sigatoka river. These deposits have generally been extensively explored and large reserves of magnetite-bearing sands have been proved in the aeolian dunes and significant resources are indicated in the offshore area. The dunes, however, are unavailable for mining as they were declared a National Nature Reserve in 1988.
2
Silica sands are known to occur at several localities near Suva (Ibbotson,1959) as residual deposits presumably formed by weathering of rhyolite bedrock. Only limited reconnaissance data are available on the quality or quantity of the sands and in order to assess the likely quality of the silica sand two samples were taken from surface exposures. Details of the laboratory analysis of these sands, which includes particle-size analysis, mineralogical characterisation and chemical analysis, are given in Section 4.3. No field mapping, trial pitting or boring has been carried out to indicate deposit size, but initial field inspections suggest the deposits are of limited areal extent although one pit exposed over 1m thickness of silica sand.
2.4. Aggregates
River sands and gravels are the main source of aggregate in Fiji and are extracted at several sites either directly from the river bed or from adjacent terrace deposits. Basalts and associated agglomerates are quarried for crushed rock aggregates and coated roads tone at two sites near Suva. These are the only source of crushed rock aggregates in Fiji although there are many potentially large resources of hard rock. In the Nadi area, where construction is booming, there has been recent interest (by Geopacific Ltd.) in developing igneous rocks (as host rocks from a gold prospect) as high grade aggregates. Samples of these rocks, and of basalts from near Suva, were collected for investigation of their physical and mechanical properties and for an assessment of their likely in-service performance as aggregates. Details of the laboratory testing are given in Section 4.4.
Pumice deposits are extensive on the north coast of Vanua Levu, near Labasa, and are a potential source of lightweight aggregate. One sample was collected for laboratory examination and the results are included in Section 4.4.
2.5. Bauxite
Bauxite deposits are found at a number of localities in Fiji and have been well documented in the revised Metallic Mineral Memoir (Colley and Flint, in press). The Wainunu deposits on Vanua Levu were briefly examined during the visit in 1992 and several samples were collected for laboratory analysis. Details of the mineralogical and chemical analysis are given in Section 4.5.
3. IMPORTS OF INDUSTRIAL MINERALS IN FIJI
Some industrial minerals are imported into Fiji but in the short time available during the visit it was not possible to investigate import details. Fiji's industries are based on sugar production, tourism, gold mining, fisheries and agriculture; there is little local manufacturing industry. Demand for industrial minerals is therefore likely to be small but it is known that lime, ornamental stone, phosphate fertilisers, gypsum, silica sands, oil absorbents and paint pigments are imported. Details are difficult to quantify, as amounts may be too small or may not be recorded. Despite these difficulties considerable effort was made by MRD to investigate import details and the information given in Table I was generated from data gathered by Jo Maikeli ofMRD from the Fiji Bureau of Statistics. These data show, for each commodity, the quantity imported and its value in Fijian dollars.
By far the most important commodity is fertiliser raw materials, reflecting the strategic importance of agriculture to the Fijian economy. Salt is also a major import and abrasives (emery,corundum,gamet etc.), kaolinitic clays, lime and chalk, refractory bricks and diatomite are all significant imports. Building stones, refractory cements, bricks, baryte, silica sands, pumice and gypsum are also imported, but on a smaller scale.
3
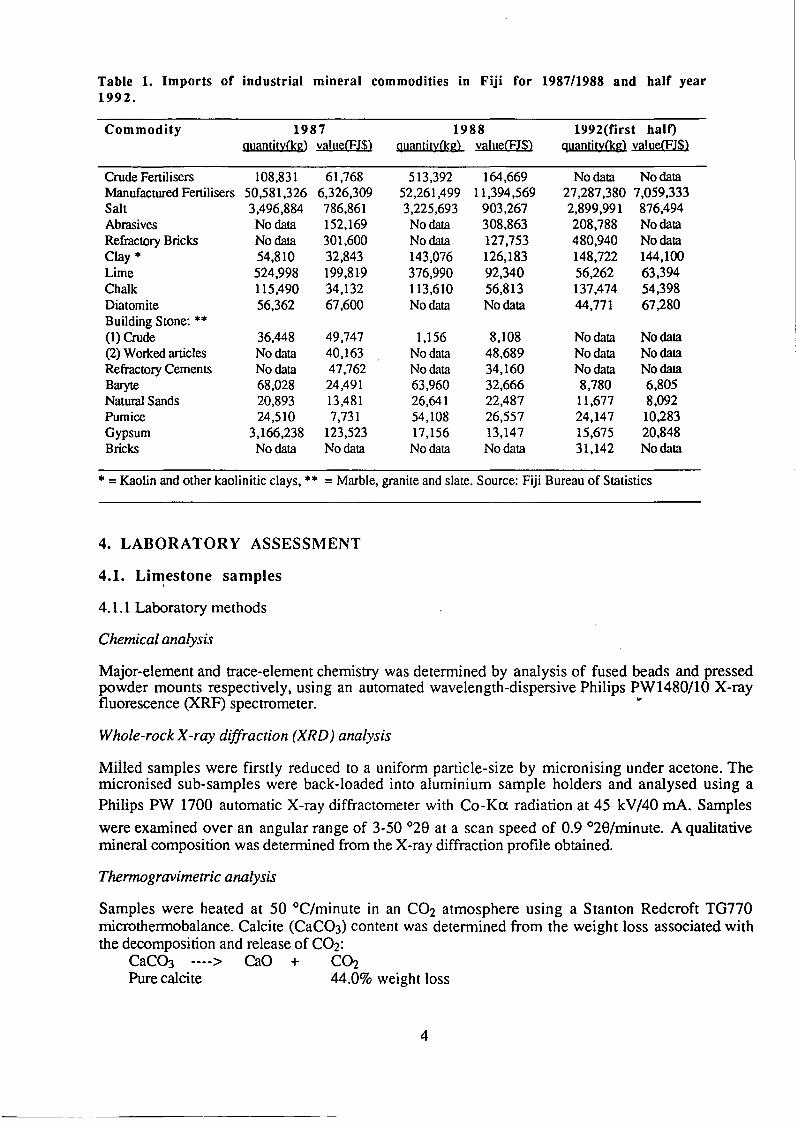
Table 1. Imports of industrial mineral commodities in Fiji for 1987/1988 and half year 1992.
Commodity 1987 1988 1992(first half) gyantil:t(kg) v!!lu~(FI$) gy!!ntit:t(kg) value(Fl$) quantit:tlKg) vruye(FI$)
Crude Fertilisers 108,831 61,768 513,392 164,669 No data No data Manufactured Fertilisers 50,581,326 6,326,309 52,261,499 11,394,569 27,287,380 7,059,333 Salt 3,496,884 786,861 3,225,693 903,267 2,899,991 876,494 Abrasives No data 152,169 No data 308,863 208,788 No data Refractory Bricks No data 301,600 No data 127,753 480,940 No data
Clay • 54,810 32,843 143,076 126,183 148,722 144,100 Lime 524,998 199,819 376,990 92,340 56,262 63,394 Chalk 115,490 34,132 113,610 56,813 137,474 54,398 Diatomite 56,362 67,600 No data No data 44,771 67,280 Building Stone: •• (1) Crude 36,448 49,747 1,156 8,108 No data No data (2) Worked articles No data 40,163 No data 48,689 No data No data Refractory Cements No data 47,762 No data 34,160 No data No data Baryte 68,028 24,491 63,960 32,666 8,780 6,805 Natural Sands 20,893 13,481 26,641 22,487 11,677 8,092 Pumice 24,510 7,731 54,108 26,557 24,147 10,283 Gypsum 3,166,238 123,523 17,156 13,147 15,675 20,848 Bricks No data No data No data No data 31,142 No data
• = Kaolin and other kaolinitic clays,·· = Marble, granite and slate. Source: Fiji Bureau of Statistics
4. LABORATORY ASSESSMENT
4.1. Limestone samples ,
4.1.1 Laboratory methods
Chemical analysis
Major-element and trace-element chemistry was determined by analysis of fused beads and pressed powder mounts respectively, using an automated wavelength-dispersive Philips PW1480/l0 X-ray fluorescence (XRF) spectrometer. "
Whole-rock X -ray diffraction (XRD) analysis
Milled samples were firstly reduced to a uniform particle-size by micron ising under acetone. The micronised sub-samples were back-loaded into aluminium sample holders and analysed using a Philips PW 1700 automatic X-ray diffractometer with Co-Ka radiation at 45 kV/40 rnA. Samples
were examined over an angular range of 3-50 °28 at a scan speed of 0.9 °28/minute. A qualitative mineral composition was determined from the X-ray diffraction profile obtained.
Thermogravimetric analysis
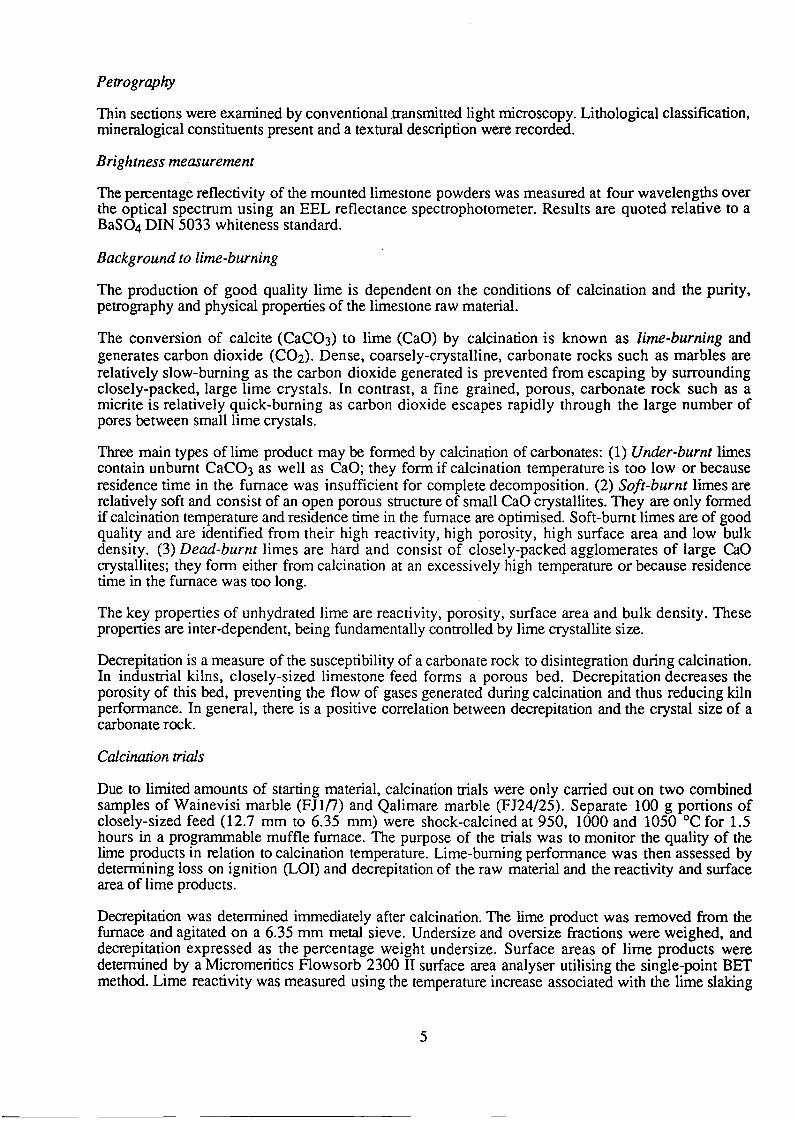
Samples were heated at 50°C/minute in an C02 atmosphere using a Stanton Redcroft TG770 microthermobalance. Calcite (CaC03) content was determined from the weight loss associated with the decomposition and release of C02:
CaCDJ ----> CaD + C~ Pure calcite 44.0% weight loss
4
Petrography
Thin sections were examined by conventional transmitted light microscopy. Lithological classification, mineralogical constituents present and a textural description were recorded.
Brightness measurement
The percentage reflectivity of the mounted limestone powders was measured at four wavelengths over the optical spectrum using an EEL reflectance spectrophotometer. Results are quoted relative to a BaS04 DIN 5033 whiteness standard.
Background to lime-burning
The production of good quality lime is dependent on the conditions of calcination and the purity, petrography and physical properties of the limestone raw material.
The conversion of calcite (CaC03) to lime (CaO) by calcination is known as lime-burning and generates carbon dioxide (C02). Dense, coarsely-crystalline, carbonate rocks such as marbles are relatively slow-burning as the carbon dioxide generated is prevented from escaping by surrounding closely-packed, large lime crystals. In contrast, a fine grained, porous, carbonate rock such as a micrite is relatively quick-burning as carbon dioxide escapes rapidly through the large number of pores between small lime crystals.
Three main types of lime product may be formed by calcination of carbonates: (1) Under-burnt limes contain unburnt CaC03 as well as CaO; they form if calcination temperature is too low or because residence time in the furnace was insufficient for complete decomposition. (2) Soft-burnt limes are relatively soft and consist of an open porous structure of small CaO crystallites. They are only formed if calcination temperature and residence time in the furnace are optimised. Soft-burnt limes are of good quality and are identified from their high reactivity, high porosity, high surface area and low bulk density. (3) Dead-burnt limes are hard and consist of closely-packed agglomerates of large Cao crystallites; they form either from calcination at an excessively high temperature or because residence time in the furnace was too long.
The key properties of unhydrated lime are reactivity, porosity, surface area and bulk density. These properties are inter-dependent, being fundamentally controlled by lime crystallite size.
Decrepitation is a measure of the susceptibility of a carbonate rock to disintegration during calcination. In industrial kilns, closely-sized limestone feed forms a porous bed. Decrepitation decreases the porosity of this bed, preventing the flow of gases generated during calcination and thus reducing kiln performance. In general, there is a positive correlation between decrepitation and the crystal size of a carbonate rock.
Calcination trials
Due to limited amounts of starting material, calcination trials were only carried out on two combined samples of Wainevisi marble (FJ1n) and Qalimare marble (FJ24/25). Separate 100 g portions of closely-sized feed (12.7 mm to 6.35 mm) were shock-calcined at 950, 1000 and 1050 °C for 1.5 hours in a programmable muffle furnace. The purpose of the trials was to monitor the quality of the lime products in relation to calcination temperature. Lime-burning performance was then assessed by determining loss on ignition (LOI) and decrepitation of the raw material and the reactivity and surface area of lime products.
Decrepitation was determined immediately after calcination. The lime product was removed from the furnace and agitated on a 6.35 mm metal sieve. Undersize and oversize fractions were weighed, and decrepitation expressed as the percentage weight undersize. Surface areas of lime products were determined by a Micromeritics Flowsorb 2300 II surface area analyser utilising the single-point BET method. Lime reactivity was measured using the temperature increase associated with the lime slaking
5
reaction, and is a modified version of the ASTM ClIO (1990) procedure. Temperature is monitored for 120 seconds after the addition of 25 g of unhydrated lime to 150ml of water in a vacuum flask. The lime/water mixture was stirred constantly at 300 rpm throughout the test. Temperture increase
(~T) is noted at 5, 10, 15, 30, 60 and 120 seconds. Reactivity is quoted as the ~T value at 30 seconds.
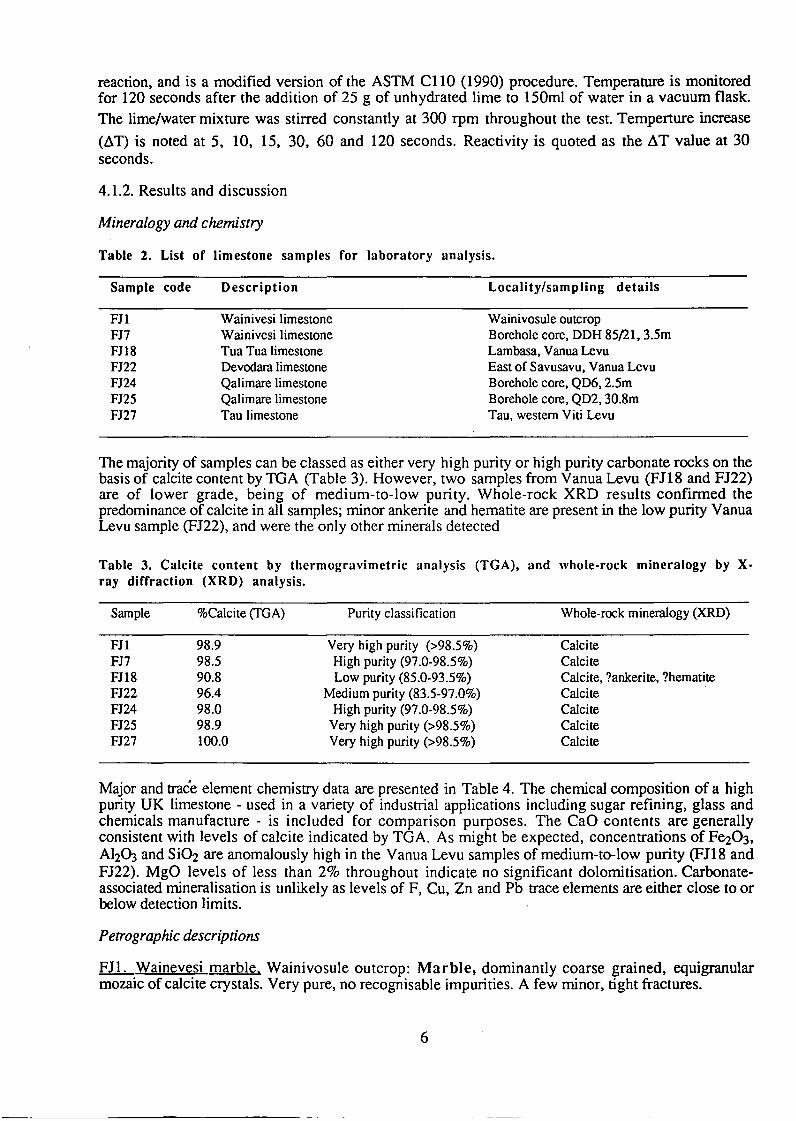
4.1.2. Results and discussion
Mineralogy and chemistry
Table 2. List of limestone samples for laboratory analysis.
Sample code
FJ1 FJ7 FJ18 FJ22 FJ24 FJ25 FJ27
Description
Wainivesi limestone Wainivesi limestone Tua Tua limestone Devodara limestone Qalimare limestone Qalimare limestone Tau limestone
Locality/sampling details
Wainivosule outcrop Borehole core, DOH 85/21, 3.5m Lambasa, Vanua Levu East of Savusavu, Vanua Levu Borehole core, QD6, 2.5m Borehole core, QD2, 30.8m Tau, western Viti Levu
The majority of samples can be classed as either very high purity or high purity carbonate rocks on the basis of calcite content by TGA (Table 3). However, two samples from Vanua Levu (FIl8 and FJ22) are of lower grade, being of medium-to-Iow purity. Whole-rock XRD results confirmed the predominance of calcite in all samples; minor ankerite and hematite are present in the low purity Vanua Levu sample (FJ22), and were the only other minerals detected
Table 3. Calcite content by thermogravimetric analysis (TGA), and whole-rock mineralogy by xray diffraction (XRD) analysis.
Sample %Calcite (TGA) Purity classification Whole-rock mineralogy (XRD)
FJ1 98.9 Very high purity (>98.5%) Calcite FJ7 98.5 High purity (97.0-98.5%) Calcite FJ18 90.8 Low purity (85.0-93.5%) Calcite, ?ankerite, ?hematite FJ22 96.4 Medium purity (83.5-97.0%) Calcite FJ24 98.0 High purity (97.0-98.5%) Calcite FJ25 98.9 Very high purity (>98.5%) Calcite FJ27 100.0 Very high purity (>98.5%) Calcite
Major and trace element chemistry data are presented in Table 4. The chemical composition of a high purity UK limestone - used in a variety of industrial applications including sugar refining, glass and chemicals manufacture - is included for comparison purposes. The CaO contents are generally consistent with levels of calcite indicated by TGA. As might be expected, concentrations of Fe203, Al2DJ and Si02 are anomalously high in the Vanua Levu samples of medium-to-low purity (FIl8 and FJ22). MgO levels of less than 2% throughout indicate no significant dolomitisation. Carbonateassociated mineralisation is unlikely as levels of F, Cu, Zn and Pb trace elements are either close to or below detection limits.
Petrographic descriptions
FJl. Wainevesi marble. Wainivosule outcrop: Marble, dominantly coarse grained, equigranular mozaic of calcite crystals. Very pure, no recognisable impurities. A few minor, tight fractures.
6
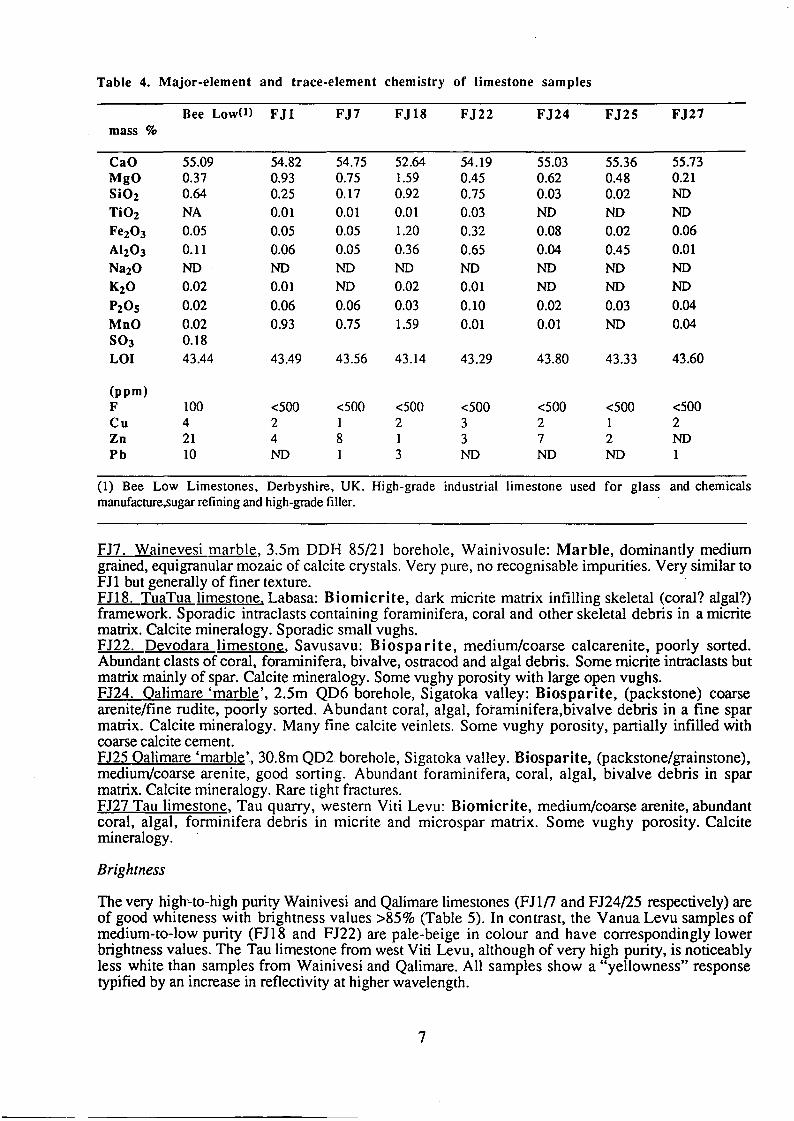
Table 4. Major-element and trace-element chemistry of limestone samples
Bee Low(l) FJI FJ7 FJ18 FJ22 FJ24 FJ2S FJ27 mass %
CaO 55.09 54.82 54.75 52.64 54.19 55.03 55.36 55.73 MgO 0.37 0.93 0.75 1.59 0.45 0.62 0.48 0.21 SiOz 0.64 0.25 0.17 0.92 0.75 0.03 0.02 NO
TiOz NA 0.01 0.01 0.01 0.03 NO ND NO
FeZ03 0.05 0.05 0.05 1.20 0.32 0.08 0.02 0.06
Alz03 0.11 0.06 0.05 0.36 0.65 0.04 0.45 0.01
NazO ND ND ND NO ND ND ND NO
KzO 0.02 0.01 ND 0.02 0.01 ND ND NO
P20S 0.02 0.06 0.06 0.03 0.10 0.02 0.03 0.04
MoO 0.02 0.93 0.75 1.59 0.01 0.01 ND 0.04 S03 0.18
LOI 43.44 43.49 43.56 43.14 43.29 43.80 43.33 43.60
(ppm) F 100 <500 <500 <500 <500 <500 <500 <500 Cu 4 2 1 2 3 2 1 2 Zn 21 4 8 1 3 7 2 NO Pb 10 NO 3 ND ND ND 1
(1) Bee Low Limestones, Derbyshire, UK. High-grade industrial limestone used for glass and chemicals manufacture,sugar refining and high-grade filler.
FJ7. Wainevesi marble, 3.5m DDH 85/21 borehole, Wainivosule: Marble, dominantly medium grained, equigranular mozaic of calcite crystals. Very pure, no recognisable impurities. Very similar to FJ1 but generally of finer texture. FJI8. TuaTua limestone. Labasa: Biomicrite, dark micrite matrix infilling skeletal (coral? algal?) framework. Sporadic intraclasts containing foraminifera, coral and other skeletal debris in a micrite matrix. Calcite mineralogy. Sporadic small vughs. FJ22. Devodara limestone, Savusavu: Biosparite, medium/coarse calcarenite, poorly sorted. Abundant clasts of coral, foraminifera, bivalve, ostracod and algal debris. Some micrite intraclasts but matrix mainly of spar. Calcite mineralogy. Some vughy porosity with large open vughs. FJ24. Oalimare 'marble', 2.5m QD6 borehole, Sigatoka valley: Biosparite, (packstone) coarse arenite/fine rudite, poorly sorted. Abundant coral, algal, foraminifera,bivalve debris in a fine spar matrix. Calcite mineralogy. Many fine calcite veinlets. Some vughy porosity, partially infilled with coarse calcite cement. FJ25 Oalimare 'marble', 30.8m QD2 borehole, Sigatoka valley. Biosparite, (packstone/grainstone), medium/coarse arenite, good sorting. Abundant foraminifera, coral, algal, bivalve debris in spar matrix. Calcite mineralogy. Rare tight fractures. FJ27 Tau limestone, Tau quarry, western Viti Levu: Biomicrite, medium/coarse arenite, abundant coral, algal, forminifera debris in micrite and microspar matrix. Some vughy porosity. Calcite mineralogy .
Brightness
The very high~to-high purity Wainivesi and Qalimare limestones (FJIn and FJ24/25 respectively) are of good whiteness with brightness values >85% (Table 5). In contrast, the Vanua Levu samples of medium-to-Iow purity (FJI8 and FJ22) are pale-beige in colour and have correspondingly lower brightness values. The Tau limestone from west Viti Levu, although of very high purity, is noticeably less white than samples from Wainivesi and Qalimare. All samples show a "yellowness" response typified by an increase in reflectivity at higher wavelength.
7
------------------------------------------------
Table 5. Percentage reflectivity ("brightness") of limestone samples measured relative to BaS04
DIN 5033 whiteness standard.
602 filter 604 filter 606 filter 608 ruter Blue Green Yellow Red
Sample (4700A) (5200A) (5800A) (6600A)
FJl 93 94 96 96 FJ7 95 95 96 97 FJl8 66 68 80 84 FJ22 64 65 75 80 FJ24 87 86 92 93 FJ25 91 92 93 95 FJ27 78 79 84 86
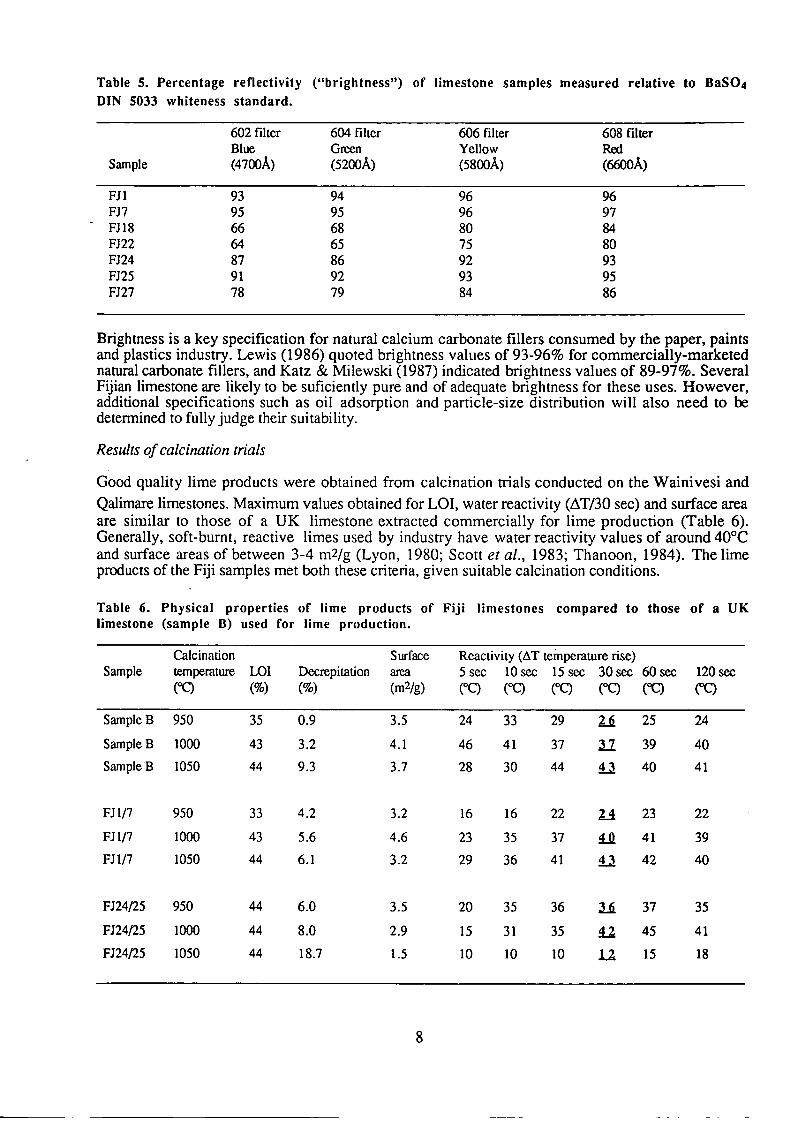
Brightness is a key specification for natural calcium carbonate fillers consumed by the paper, paints and plastics industry. Lewis (1986) quoted brightness values of 93-96% for commercially-marketed natural carbonate fillers, and Katz & Milewski (1987) indicated brightness values of 89-97%. Several Fijian limestone are likely to be suficiently pure and of adequate brightness for these uses. However, additional specifications such as oil adsorption and particle-size distribution will also need to be detennined to fully judge their suitability.
Results of calcination trials
Good quality lime products were obtained from calcination trials conducted on the Wainivesi and
Qalimare limestones. Maximum values obtained for LOI, water reactivity (~T/30 sec) and surface area are similar to those of a UK limestone extracted commercially for lime production (Table 6). Generally, soft-burnt, reactive limes used by industry have water reactivity values of around 40°C and surface areas of between 3-4 m2/g (Lyon, 1980; Scott et al., 1983; Thanoon, 1984). The lime products of the Fiji samples met both these criteria, given suitable calcination conditions.
Table 6. Physical properties of lime products of Fiji limestones compared to those of a UK limestone (sample B) used for lime production.
Calcination Surface Reactivity (.1T temperature rise) Sample temperature LOI Decrepitation area 5 sec 10 sec 15 sec 30 sec 60 sec 120 sec
rq (%) (%) (m2/g) rC) (OC) rC) rq (OC) rc>
SampleB 950 35 0.9 3.5 24 33 29 li 25 24
SampleB 1000 43 3.2 4.1 46 41 37 II 39 40
Sample B 1050 44 9.3 3.7 28 30 44 i1 40 41
FJl/7 950 33 4.2 3.2 16 16 22 24 23 22
FJl/7 1000 43 5.6 4.6 23 35 37 !.U 41 39
FJl/7 1050 44 6.1 3.2 29 36 41 i1 42 40
FJ24/25 950 44 6.0 3.5 20 35 36 li 37 35
FJ24/25 1000 44 8.0 2.9 15 31 35 U 45 41
FJ24/25 1050 44 18.7 1.5 10 10 10 II 15 18
8
50~--------------------~
-9 ~45
~ c:
.~ 40 o (/) (/)
o ~ 35 Q) c: .9 ~ 30 E
:.:J
25+1----~----~--_,r_--_;
900 950 1000 1050 1100 Calcination temperature (OC)
20~1----------------------' 19
\0 18 17 16 15
-14 ~ 13 c: 12 .g 11
~ 1~ ~ 8 ~ 7 o 6
5 4 3 2 1 041----,-----r----r--~ 900 950 1000 1050 1100
Calcination temperature (0C)
• * •
• * •
Sample B
FJ1/7
FJ24/25
Sample B
·FJ1/7
FJ24/25
51 4.5
4
~3.5 g 3 ro ~ 2.5
~ 2 ro 't: ~ 1.5
1
0.5
O~I----'---li---'--~ 900 950 1000 1050 1100
Calcination temperature (0C)
45~1 -----=:--==;;--1 _40 ()
~35 Q) (/)
.;: 30 a. E $ 25 o ~ 20 o C")
~ 15 .::;
~ 10 ro Q)
a: 5
oll---r--~~~~ 900 950 1050 1100 1000
Calcination temperature (0C)
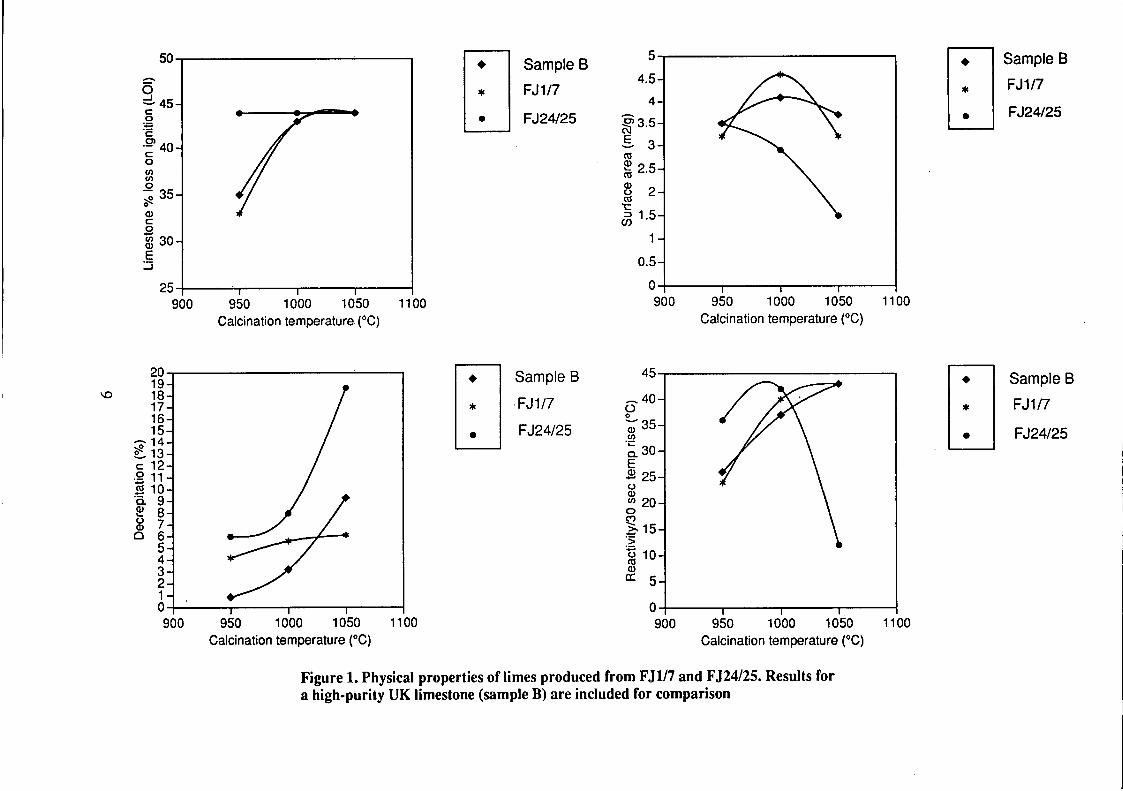
Figure 1. Physical properties of limes produced from FJ117 and FJ24/2S. Results for a high-purity UK limestone (sample B) are included for comparison
• * •
• * •
Sample B
FJ1/7
FJ24/25
Sample B
FJ117
FJ24/25
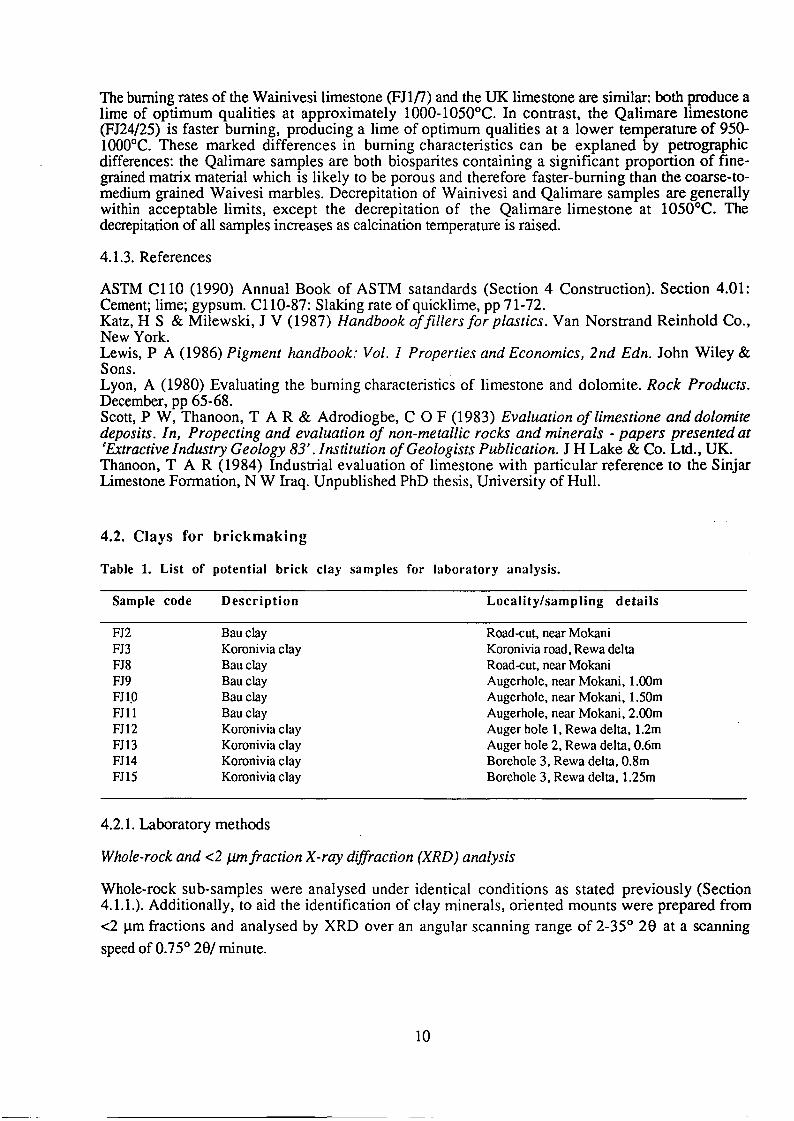
The burning rates of the Wainivesi limestone (FJ1n) and the UK limestone are similar: both produce a lime of optimum qualities at approximately 1000-1 050°C. In contrast, the Qalimare limestone (FJ24/25) is faster burning, producing a lime of optimum qualities at a lower temperature of 950-lOOO°C. These marked differences in burning characteristics can be explaned by petrographic differences: the Qalimare samples are both biosparites containing a significant proportion of finegrained matrix material which is likely to be porous and therefore faster-burning than the coarse-tomedium grained Waivesi marbles. Decrepitation of Wainivesi and Qalimare samples are generally within acceptable limits, except the decrepitation of the Qalimare limestone at 1050°C. The decrepitation of all samples increases as calcination temperature is raised.
4.1.3. References
ASTM CllO (1990) Annual Book of ASTM satandards (Section 4 Construction). Section 4.01: Cement; lime; gypsum. CllO-87: Slaking rate of quicklime, pp 71-72. Katz, H S & Milewski, J V (1987) Handbook offillersfor plastics. Van Norstrand Reinhold Co., New York. Lewis, P A (1986) Pigment handbook: Vol. I Properties and Economics, 2nd Edn. John Wiley & Sons. Lyon, A (1980) Evaluating the burning characteristics of limestone and dolomite. Rock Products. December, pp 65-68. Scott, P W, Thanoon, TAR & Adrodiogbe, C 0 F (1983) Evaluation of limestione and dolomite deposits. In, Propecting and evaluation of non-metallic rocks and minerals - papers presented at 'Extractive Industry Geology 83' . Institution of Geologists Publication. J H Lake & Co. Ltd., UK. Thanoon, TAR (1984) Industrial evaluation of limestone with particular reference to the Sinjar Limestone Formation, N W Iraq. Unpublished PhD thesis, University of Hull.
4.2. Clays for brick making
Table 1. List of potential brick clay samples for laboratory analysis.
Sample code
FJ2 FJ3 FJ8 FJ9 FHO FJll FJl2 FJl3 FJl4 FJl5
Description
Bauclay Koronivia clay Bauclay Bau clay Bauclay Bau clay Koronivia clay Koronivia clay Koronivia clay Koronivia clay
4.2.1. Laboratory methods
Locality/sampling details
Road-cut, near Mokani Koronivia road, Rewa delta Road-cut, near Mokani Augerhole, near Mokani, 1.()()m Augerhole, near Mokani, 1.50m Augerhole, near Mokani, 2.()()m Auger hole I, Rewa delta, 1.2m Auger hole 2, Rewa delta, O.6m Borehole 3, Rewa delta, O.8m Borehole 3, Rewa delta, 1.25m
WhoLe-rock and <2 J.1mfraction X -ray diffraction (XRD) analysis
Whole-rock sub-samples were analysed under identical conditions as stated previously (Section 4.1.1.). Additionally, to aid the identification of clay minerals, oriented mounts were prepared from
<2 Ilm fractions and analysed by XRD over an angular scanning range of 2-35° 28 at a scanning
speed of 0.75° 28/ minute.
10
- - --- -----------------------
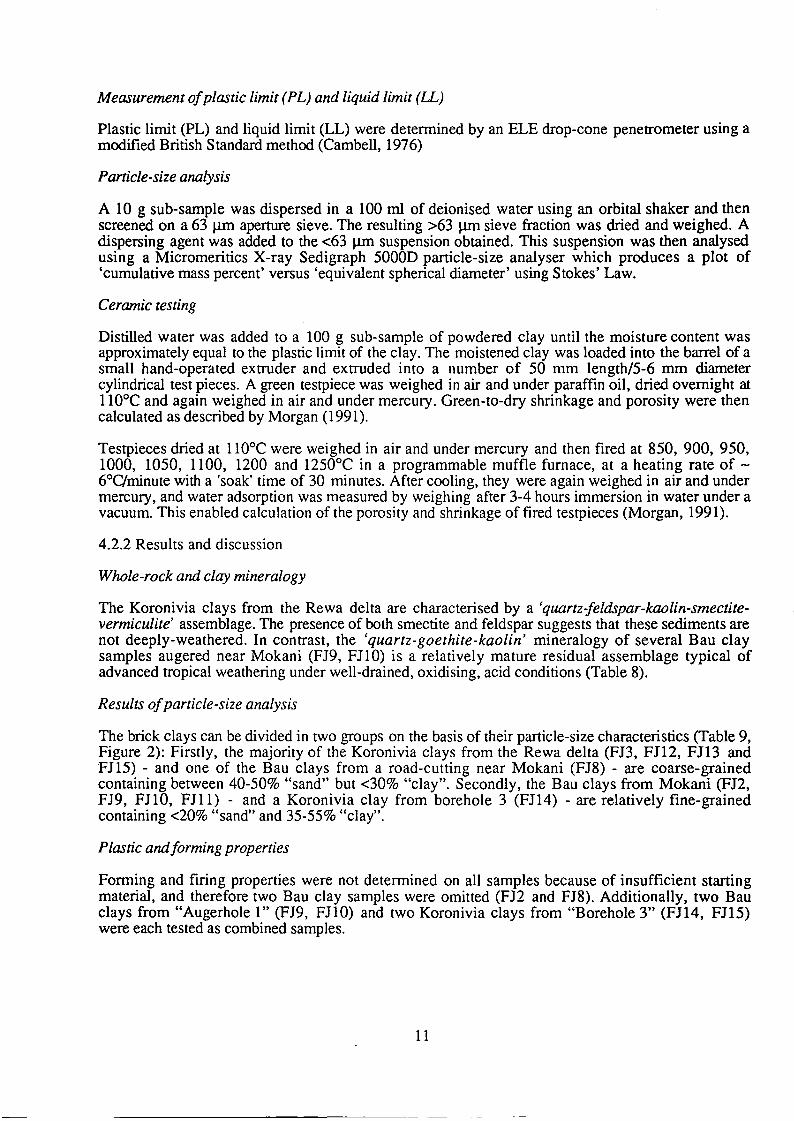
Measurement of plastic limit (PL) and liquid limit (LL)
Plastic limit (PL) and liquid limit (LL) were determined by an ELE drop-cone penetrometer using a modified British Standard method (Cambell, 1976)
Particle-size analysis
A 10 g sub-sample was dispersed in a 100 rnl of deionised water using an orbital shaker and then screened on a 63 ~ aperture sieve. The resulting >63 ~ sieve fraction was dried and weighed. A dispersing agent was added to the <63 J.1m suspension obtained. This suspension was then analysed using a Micromeritics X-ray Sedigraph 5000D particle-size analyser which produces a plot of 'cumulative mass percent' versus 'equivalent spherical diameter' using Stokes' Law.
Ceramic testing
Distilled water was added to a 100 g sub-sample of powdered clay until the moisture content was approximately equal to the plastic limit of the clay. The moistened ylay was loaded into the barrel of a small hand-operated extruder and extruded into a number of 50 mm length/5-6 mm diameter cylindrical test pieces. A green testpiece was weighed in air and under paraffin oil, dried overnight at 110°C and again weighed in air and under mercury. Green-to-dry shrinkage and porosity were then calculated as described by Morgan (1991).
Testpieces dried at 110°C were weighed in air and under mercury and then fired at 850, 900, 950, 1000, 1050, 1100, 1200 and 1250°C in a programmable muffle furnace, at a heating rate of -6°C/minute with a 'soak' time of 30 minutes. After cooling, they were again weighed in air and under mercury, and water adsorption was measured by weighing after 3-4 hours immersion in water under a vacuum. This enabled calculation of the porosity and shrinkage of fired testpieces (Morgan, 1991).
4.2.2 Results and discussion
Whole-rock and clay mineralogy
The Koronivia clays from the Rewa delta are characterised by a (quartz{eldspar-kaolin-smectitevermiculite' assemblage. The presence of both smectite and feldspar suggests that these sediments are not deeply-weathered. In contrast, the (quartz-goethite-kaolin' mineralogy of several Bau clay samples augered near Mokani (FI9, FJ10) is a relatively mature residual assemblage typical of advanced tropical weathering under well-drained, oxidising, acid conditions (Table 8).
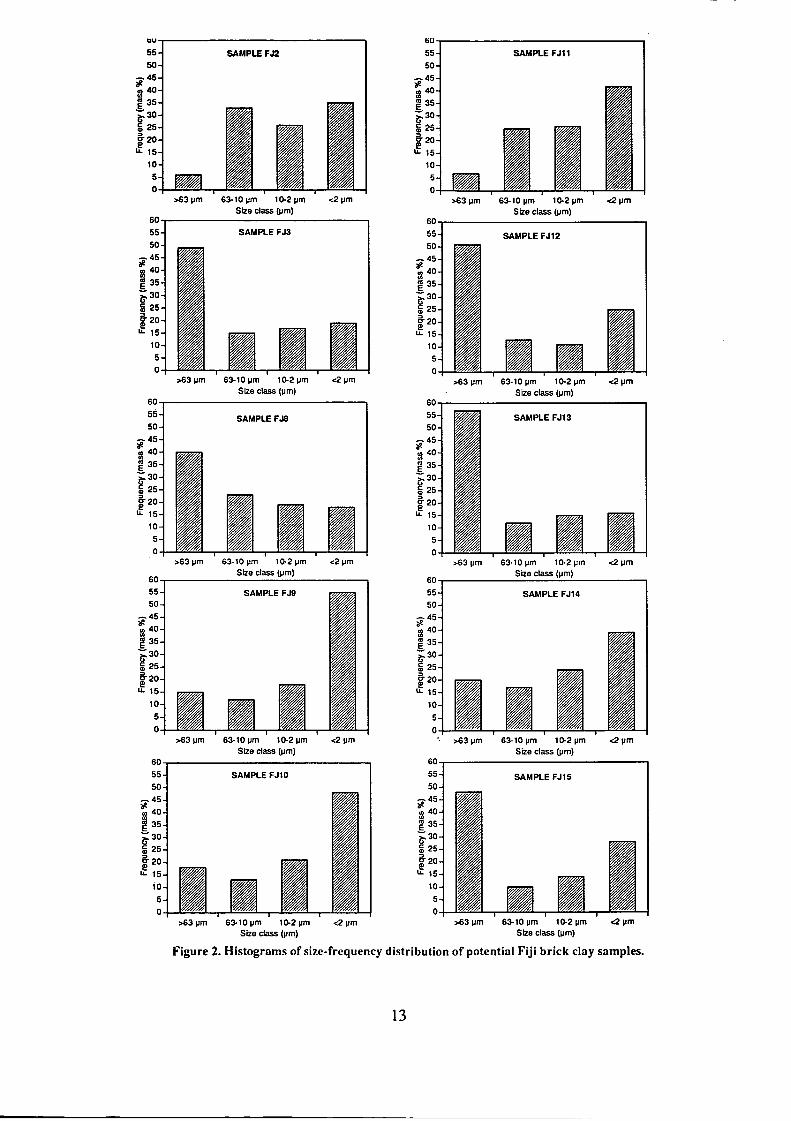
Results of particle-size analysis
The brick clays can be divided in two groups on the basis of their particle-size characteristics (Table 9, Figure 2): Firstly, the majority of the Koronivia clays from the Rewa delta (FJ3, FJ12, FI13 and FJ15) - and one of the Bau clays from a road-cutting near Mokani (FI8) - are coarse-grained containing between 40-50% "sand" but <30% "clay". Secondly, the Bau clays from Mokani (FJ2, FI9, FIlO, FIll) - and a Koronivia clay from borehole 3 (FJ14) - are relatively fine-grained containing <20% "sand" and 35-55% "clay".
Plastic andforming properties
Forming and firing properties were not determined on all samples because of insufficient starting material, and therefore two Bau clay samples were omitted (FJ2 and FI8). Additionally, two Bau clays from "Augerhole 1" (FI9, FJ10) and two Koronivia clays from "Borehole 3" (FIl4, FJ15) were each tested as combined samples.
11
- ------------
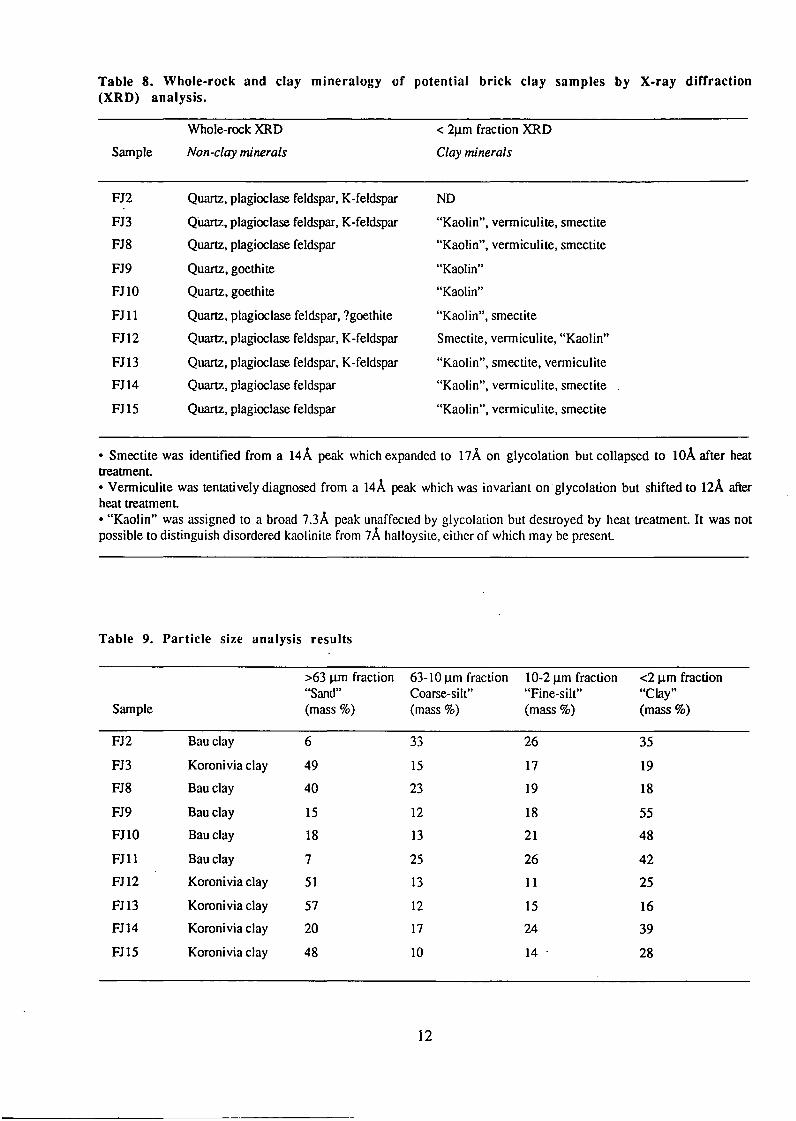
Table 8. Whole-rock and clay mineralogy of potential brick clay samples by X-ray diffraction (XRD) analysis.
Whole-rock XRD < 211m fraction XRD
Sample Non-clay minerals Clay minerals
FJ2 Quartz, plagioclase feldspar, K-feldspar NO
FJ3 QUartz, plagioclase feldspar, K-feldspar "Kaolin", vermiculite, smectite
FJ8 Quartz, plagioclase feldspar "Kaolin", vermiculite, smectite
FJ9 Quartz, goethite "Kaolin"
FJlO Quartz, goethite "Kaolin"
FJIl Quartz, plagioclase feldspar, ?goethite "Kaolin", smectite
FJI2 Quartz, plagioclase feldspar, K-feldspar Smectite, vermiculite, "Kaolin"
FJI3 Quartz, plagioclase feldspar, K-feldspar "Kaolin", smectite, vermiculite
FJI4 Quartz, plagioclase feldspar "Kaolin", vermiculite, smectite
FJI5 Quartz, plagioclase feldspar "Kaolin", vermiculite, smectite
• Smectite was identified from a 14A peak which expanded to 17A on glycolation but collapsed to loA after heat treatment • Vermiculite was tentatively diagnosed from a 14A peak which was invariant on glycolation but shifted to 12A after heat treatment • "Kaolin" was assigned to a broad 7.3A peak unaffected by glycolation but destroyed by heat treatment. It was not possible to distinguish disordered kaolinite from 7A halloysite, either of which may be present.
Table 9. Particle size analysis results
>63 11m fraction 63-10 11m fraction 10-2 11m fraction <211m fraction "Sand" Coarse-silt" "Fine-silt" "Clay"
Sample (mass %) (mass %) (mass %) (mass %)
FJ2 Bau clay 6 33 26 35
FJ3 Koronivia clay 49 15 17 19
FJ8 Bau clay 40 23 19 18
FJ9 Bauclay 15 12 18 55
FJIO Bau clay 18 13 21 48
FJIl Bau clay 7 25 26 42
FJI2 Koronivia clay 51 13 11 25
FJI3 Koronivia clay 57 12 15 16
FJI4 Koronivia clay 20 17 24 39
FJ15 Koronivia clay 48 10 14 28
12
6U,-------------------------------, 55 SAMPLE FJl1
63-10 ~m 10-2 ~m >63~m 63-10 ~m 10-2 ~m <2~m Size class (~m) Size class (~m)
>63~m 63-10 ~m 10-2 ~m <2 ~m >63 ~m 63-10 ~m 10-2~m <2~m Size class (~m) Size class (~m)
SAMPLE FJ8 SAMPLE FJ13
~ ~ ::l ::l cc cc .5. .5. l; l; c c .. .. " " I:T I:T e e u. 1 u. 1
>63 ~m 63-10 ~m 10-2~m <2 ~m
60 Size class (~m)
60 55 SAMPLE FJ9 55 SAMPLE FJ14 50 50
_45 -45 111 40 :.!!
::l ~ 40
135 ~ 35
l; ~30 c ; 25 .. " 5-20 I:T e e u. u. 15
10
5
0 >63 ~m 63-10 ~m 10-2~m <2~m >63~m 63-10 ~m 10-2~m <2~m
Size class (~m) Size class (~m)
63-10 ~m 10-2 ~m <2~m 63-10 ~m 1 0-2 ~m <2~m
Size class (~m) Size class (~m)
Figure 2. Histograms of size-frequency distribution of potential Fiji brick clay samples.
13
so ---0-- POf05lty - SMn""".
40 30
i i • E • JO • E C • o!-C o!- 20 • ~ !:' • ~ ~ 20 i
~ 0 '" ..
10 10
0 0 800 900 1000 1100 1200 1300
Tempenture ("C)
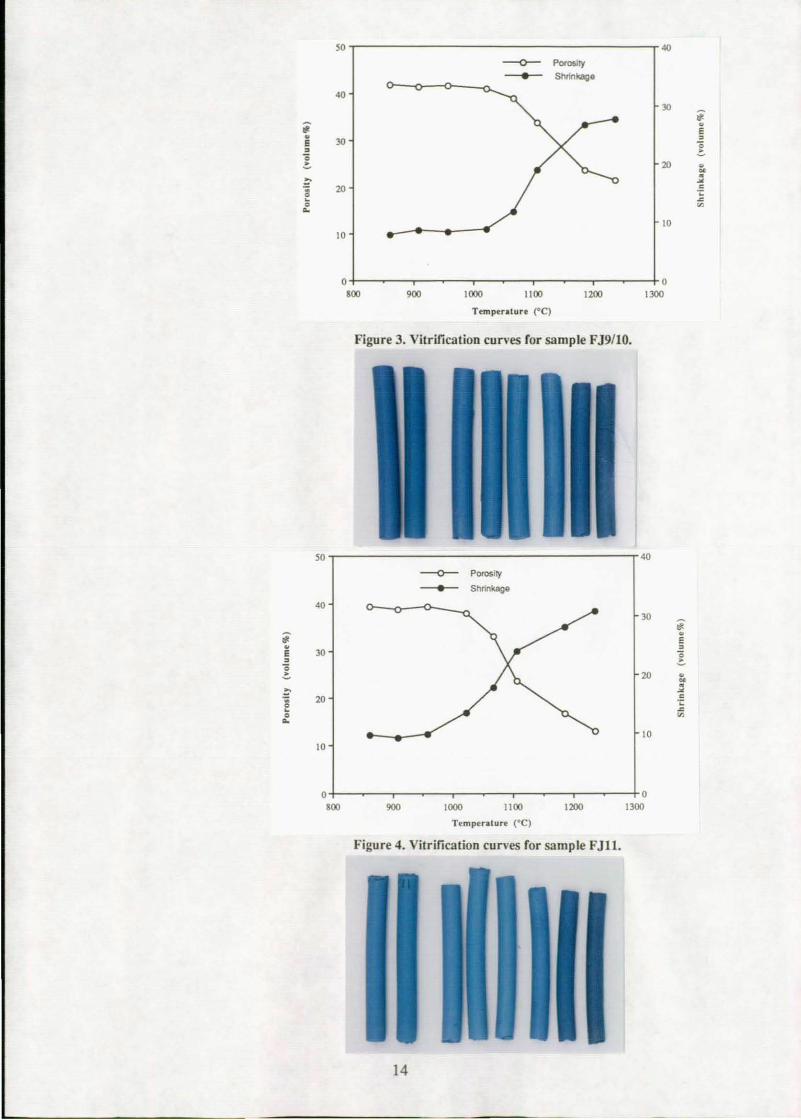
Figu re 3. Vitr ification curves for sample FJ9ilO.
50 40
---0-- Porosity - Shrinkage
40 JO
i i E E JO • • ! c o!- 20 • :.-!:' ~
~ 20 i ~
0 '" .. 10
10
0 0 800 900 1000 1100 1200 1300
Tempuaturtl (-C)
Figure 4. Vitrification curves for sample FJlI.
14
so 4()
--0-- Po,",,~ (YoIu"""') - Shrinkage ('II'Olume%) 4()
JI)
i i e • • E JI) "0 • ~ "0 ~ 20 r. !' • ~ ~ 20 c
-;: • ~ 0 ~ ..
10 10
0 0 800 900 1000 1100 1200 1300
Temperature ("'C)
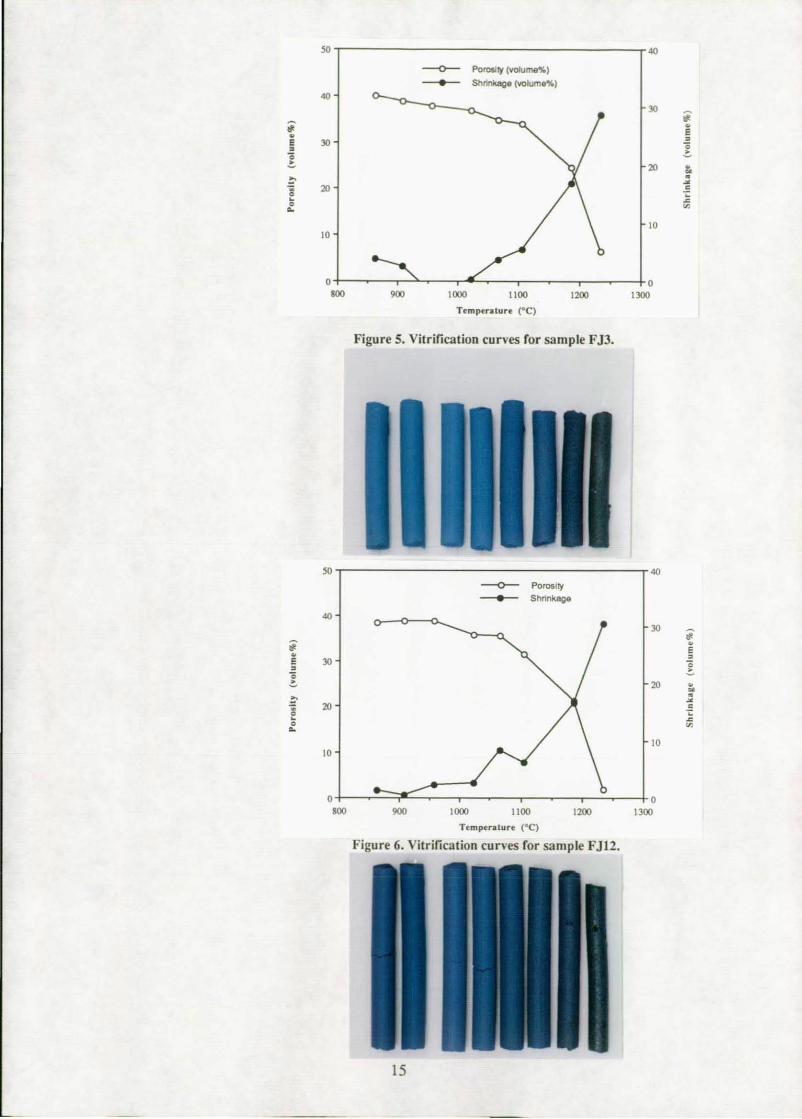
Figure 5. Vitrilication curves for sample FJ3.
~ Porosity ~ Shrinkage
4()
i • E JI) • "0
i • E • !
~
!' 20
~ 0 ..
10
0 800
Figure 6. Vitrilication curves for sample F J 12.
15
50 40
---0-- Porosity - Shrinkage 40
30 " " • e • , e 30 "0 , -!, "0
-!, 20 • ~ ~
• 20 '" c
0 1: • .c 0
'" .. 10
10
0 0 800 900 1000 1100 1200 1300
Temperature (DC)
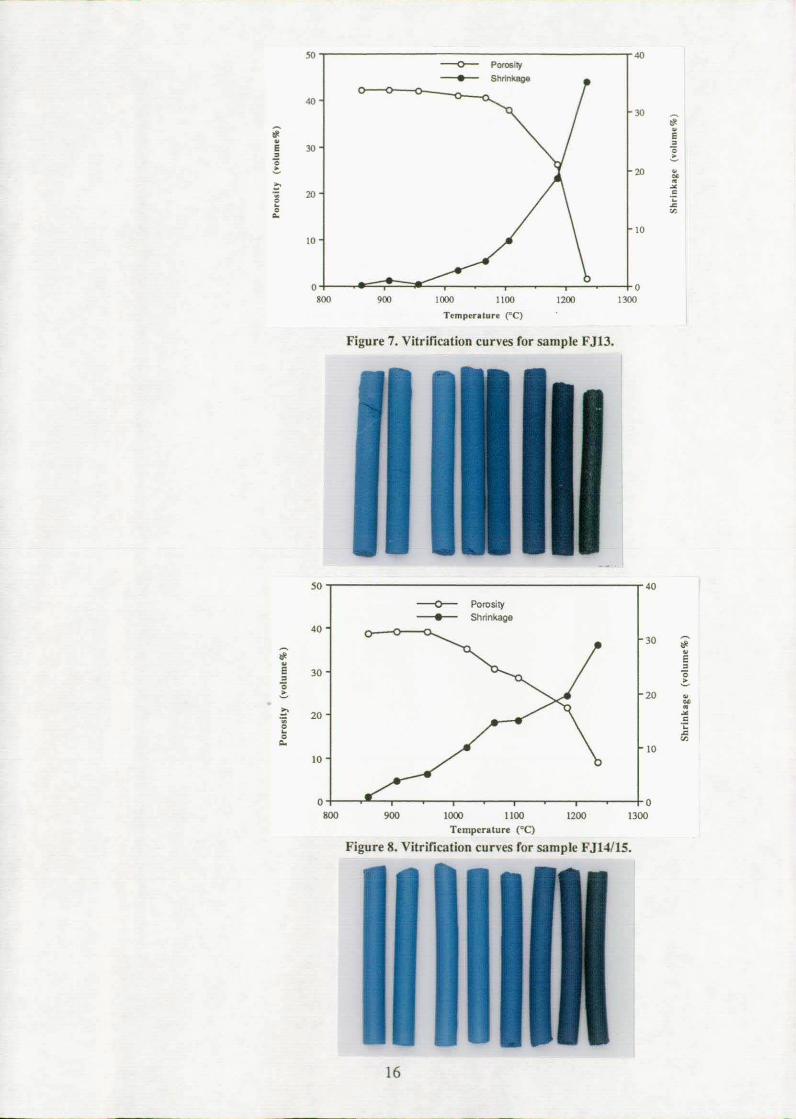
Figure 8. Vitrification curves for sample FJ14/1S.
16
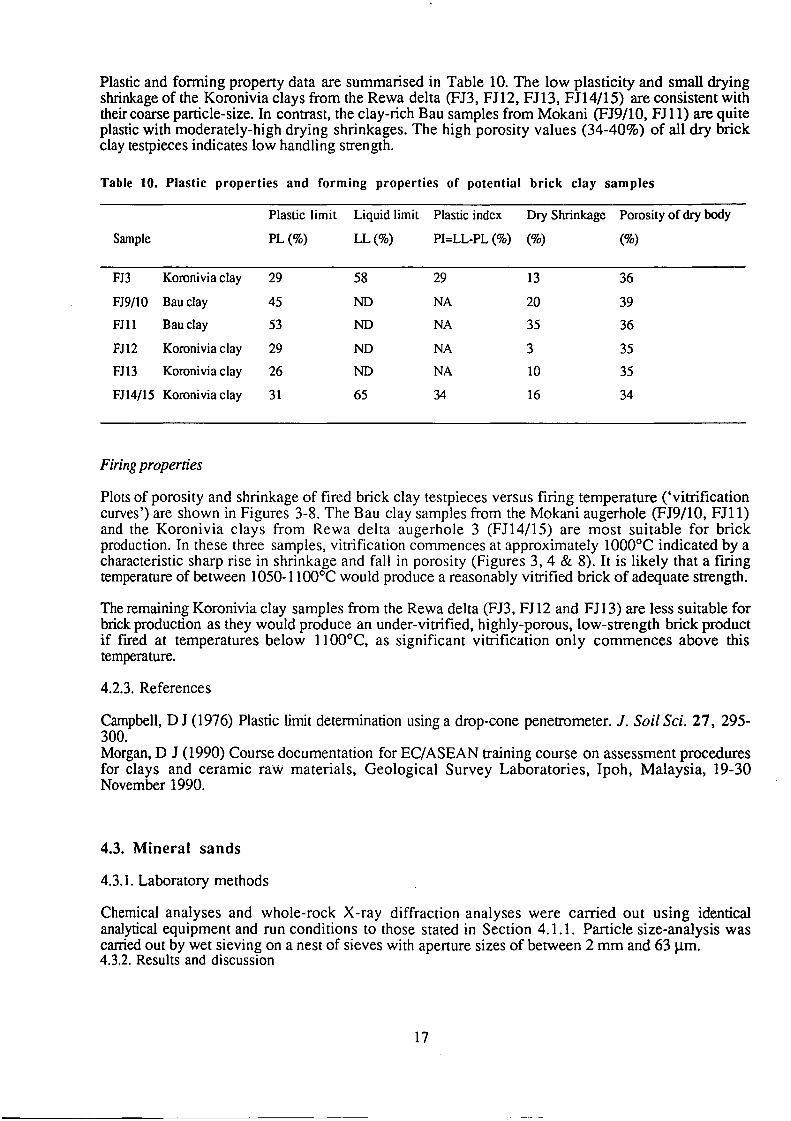
Plastic and forming property data are summarised in Table lO. The low plasticity and small drying shrinkage of the Koronivia clays from the Rewa delta (FB, FJ12, FJ13, FJ14/15) are consistent with their coarse particle-size. In contrast, the clay-rich Bau samples from Mokani (FJ9/lO, FJ11) are quite plastic with moderately-high drying shrinkages. The high porosity values (34-40%) of all dry brick clay testpieces indicates low handling strength.
Table 10. Plastic properties and forming properties of potential brick clay samples
Plastic limit Liquid limit Plastic index Dry Shrinkage Porosity of dry body
Sample PL(%) LL(%) PI=LL-PL (%) (%) (%)
FJ3 Koronivia clay 29 58 29 13 36
FJ9/1O Bau clay 45 NO NA 20 39
FJll Bau clay 53 NO NA 35 36
FJ12 Koronivia clay 29 NO NA 3 35
FJ13 Koronivia clay 26 NO NA 10 35
FJ14/15 Koronivia clay 31 65 34 16 34
Firing properties
Plots of porosity and shrinkage of fired brick clay testpieces versus firing temperature (,vitrification cUIves') are shown in Figures 3-8. The Bau clay samples from the Mokani augerhole (FJ9/lO, FJ11) and the Koronivia clays from Rewa delta augerhole 3 (FJ14/15) are most suitable for brick production. In these three samples, vitrification commences at approximately lOOO°C indicated by a characteristic sharp rise in shrinkage and fall in porosity (Figures 3, 4 & 8). It is likely that a firing temperature of between 1050-1100°C would produce a reasonably vitrified brick of adequate strength.
The remaining Koronivia clay samples from the Rewa delta (FB, FJ12 and FJ13) are less suitable for brick production as they would produce an under-vitrified, highly-porous, low-strength brick product if fired at temperatures below 1100°C, as significant vitrification only commences above this temperature.
4.2.3. References
Campbell, D J (1976) Plastic limit determination using a drop-cone penetrometer. J. Soil Sci. 27, 295-300. Morgan, D J (1990) Course documentation for EC/ASEAN training course on assessment procedures for clays and ceramic raw materials, Geological Survey Laboratories, Ipoh, Malaysia, 19-30 November 1990.
4.3. Mineral sands
4.3.1. Laboratory methods
Chemical analyses and whole-rock X-ray diffraction analyses were carried out using identical analytical equipment and run conditions to those stated in Section 4.1.1. Particle size-analysis was carried out by wet sieving on a nest of sieves with aperture sizes of between 2 mm and 63 J.l.m. 4.3.2. Results and discussion
17
4.3.2. Results and discussion
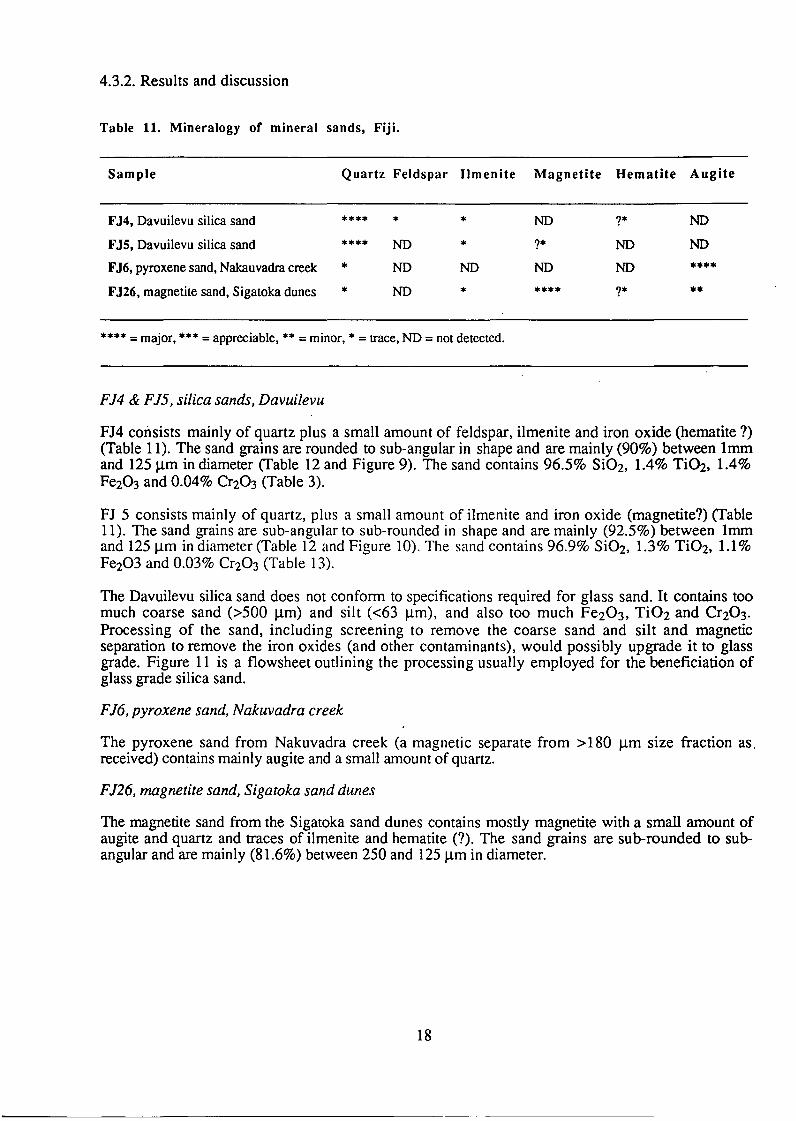
Table 11. Mineralogy or mineral sands, Fiji.
Sample Quartz Feldspar Ilmenite Magnetite Hematite Augite
FJ4, Davuilevu silica sand **** * * NO ?* NO
FJS, Davuilevu silica sand **** NO * ?* NO NO
FJ6, pyroxene sand, Nakauvadra creek * NO NO NO NO •••• FJ26, magnetite sand, Sigatoka dunes * NO * .*** ?* ••
*.** = major, .** = appreciable, ** = minor, * = trace, ND = not detected.
FJ4 & FJ5, silica sands, Davuilevu
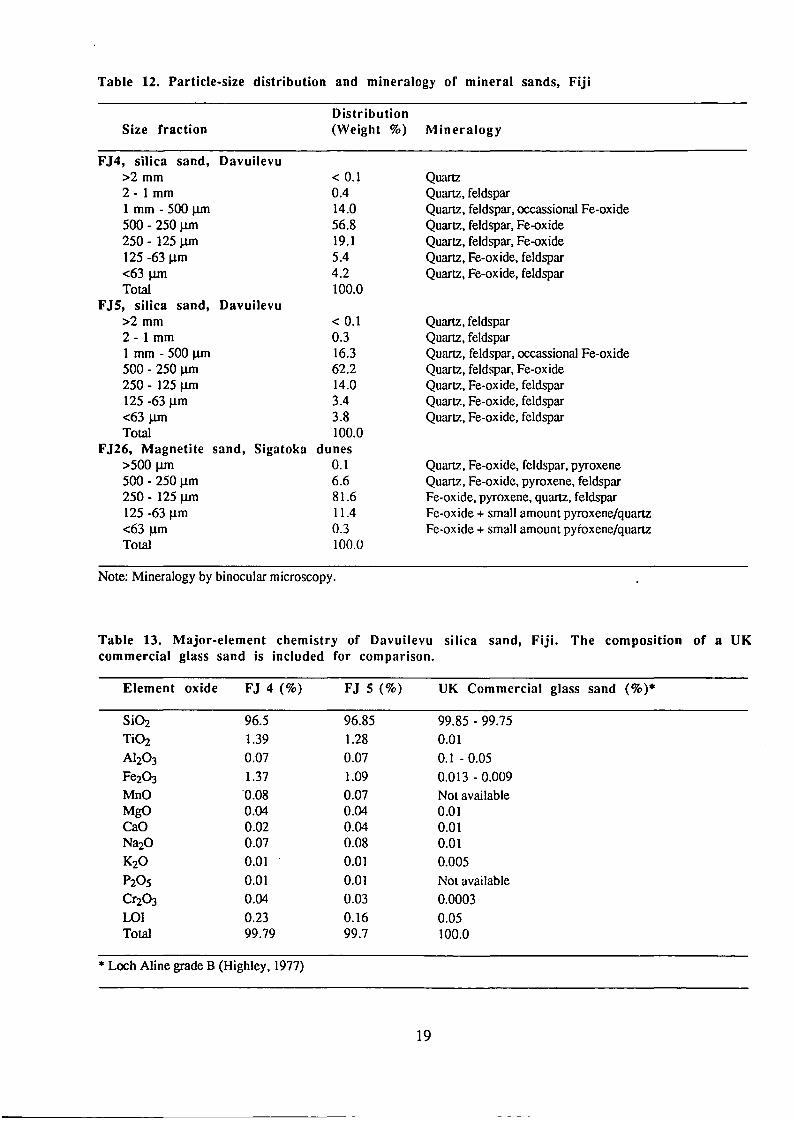
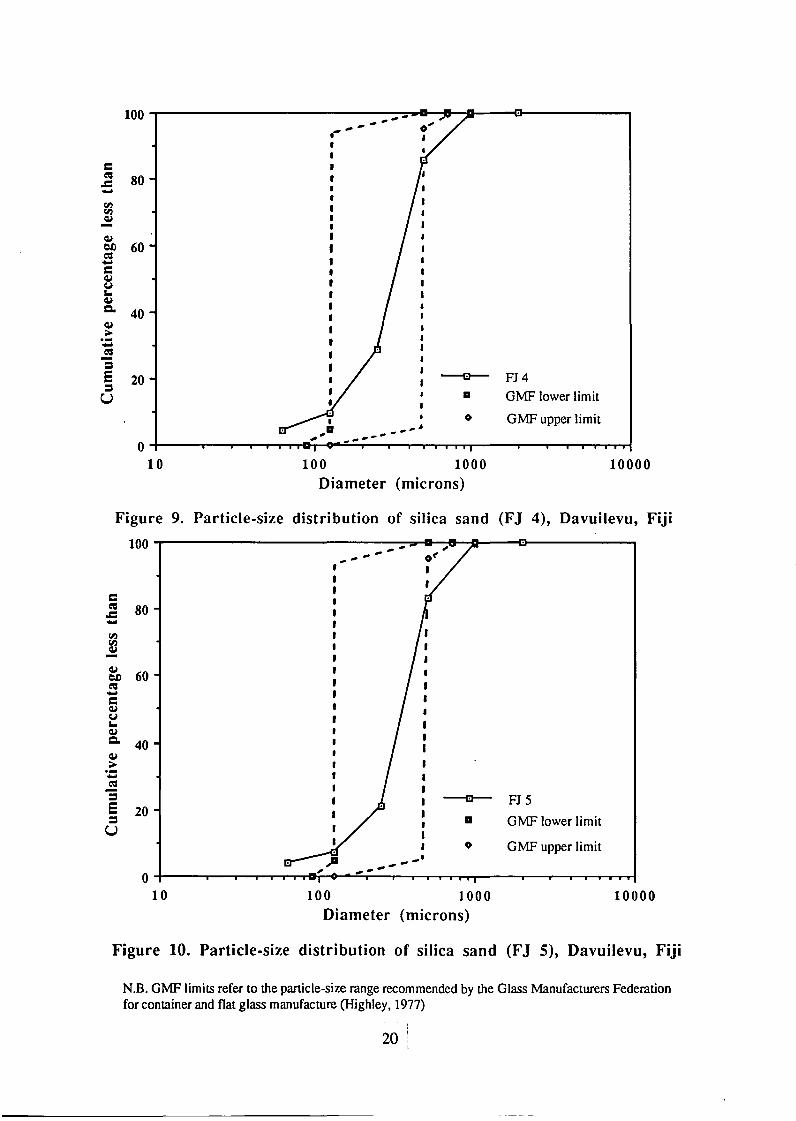
FJ4 consists mainly of quartz plus a small amount of feldspar, ilmenite and iron oxide (hematite ?) (Table 11). The sand grains are rounded to sub-angular in shape and are mainly (90%) between Imm and 125 Jlm in diameter (Table 12 and Figure 9). The sand contains 96.5% Si02, 1.4% Ti02, 1.4% Fe203 and 0.04% Cr203 (Table 3).
FJ 5 consists mainly of quartz, plus a small amount of ilmenite and iron oxide (magnetite?) (Table 11). The sand grains are sub-angular to sub-rounded in shape and are mainly (92.5%) between Imm and 125 Jlm in diameter (Table 12 and Figure 10). The sand contains 96.9% Si02, 1.3% Ti02, 1.1 % Fe203 and 0.03% Cr203 (Table 13).
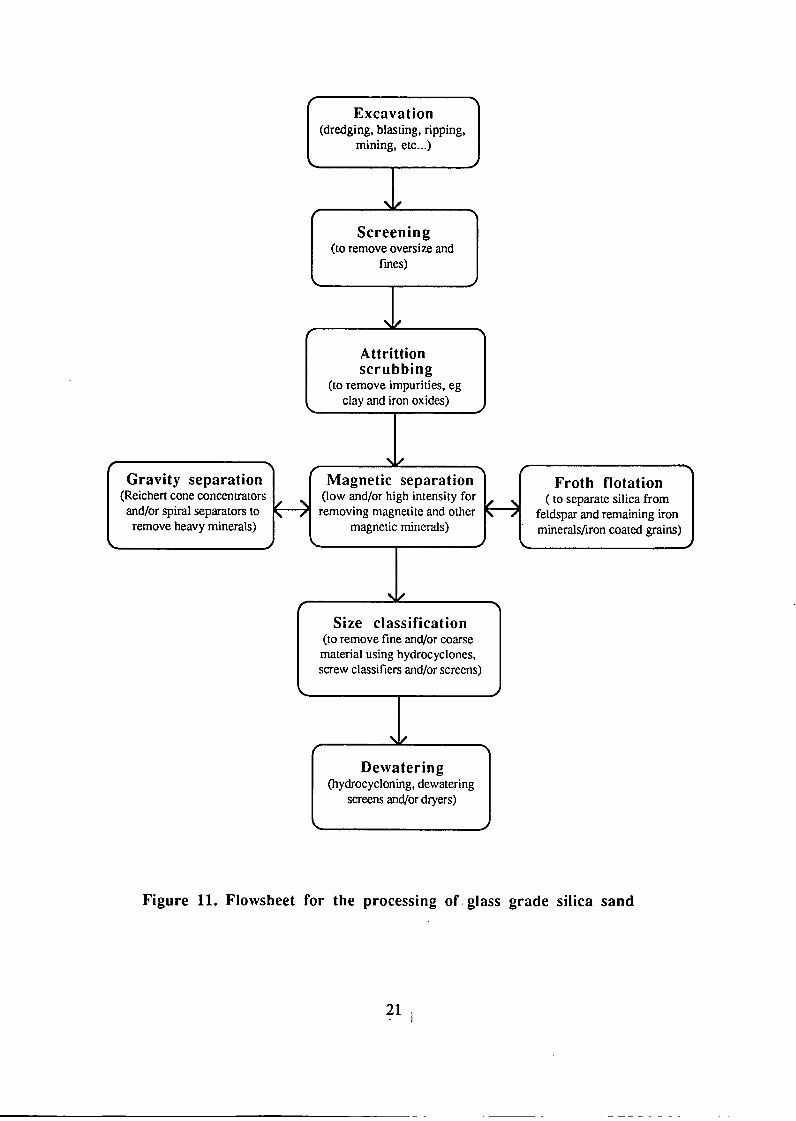
The Davuilevu silica sand does not conform to specifications required for glass sand. It contains too much coarse sand (>500 Jlm) and silt «63 Jlm), and also too much Fe203, Ti02 and Cr203. Processing of the sand, including screening to remove the coarse sand and silt and magnetic separation to remove the iron oxides (and other contaminants), would possibly upgrade it to glass grade. Figure 11 is a flow sheet outlining the processing usually employed for the beneficiation of glass grade silica sand.
FJ6, pyroxene sand, Nakuvadra creek
The pyroxene sand from Nakuvadra creek (a magnetic separate from >180 Jlm size fraction as, received) contains mainly augite and a small amount of quartz.
FJ26, magnetite sand, Sigatoka sand dunes
The magnetite sand from the Sigatoka sand dunes contains mostly magnetite with a small amount of augite and quartz and traces of ilmenite and hematite (?). The sand grains are sub-rounded to subangular and are mainly (8l.6%) between 250 and 125 !lm in diameter.
18
------------------------------------
Table 12. Particle-size distribution and mineralogy of mineral sands, Fiji
Size fraction
FJ4, silica sand, Davuilevu >2 mm 2 - 1 mm 1 mm - 500 J.U11 500 - 250 J.U11 250 - 125 J.U11 125 -631lm <63 J.U11 Total
FJS, silica sand, Davuilevu >2 mm 2 - 1 mm 1 mm - 500 J.U11 500 - 250 J.U11 250 - 125 J.U11 125 -631lm <63 J.U11 Total
FJ26, Magnetite sand, Sigatoka >500 J.U11 500 - 250 Ilm 250 - 1251lm 125 -631lm <63 Ilm Total
Distribution (Weight %) Mineralogy
< 0.1 0.4 14.0 56.8 19.1 5.4 4.2 100.0
< 0.1 0.3 16.3 62.2 14.0 3.4 3.8 100.0
dunes 0.1 6.6 81.6 11.4 0.3 100.0
Quartz Quartz, feldspar Quartz, feldspar, occassional Fe-oxide Quartz, feldspar, Fe-oxide Quartz, feldspar, Fe-oxide Quartz, Fe-oxide, feldspar Quartz, Fe-oxide, feldspar
Quartz, feldspar Quartz, feldspar Quartz, feldspar, occassional Fe-oxide Quartz, feldspar, Fe-oxide Quartz, Fe-oxide, feldspar Quartz, Fe-oxide, feldspar Quartz, Fe-oxide, feldspar
Quartz, Fe-oxide, feldspar, pyroxene Quartz, Fe-oxide, pyroxene, feldspar Fe-oxide, pyroxene, quartz, feldspar Fe-oxide + small amount pyroxene/quartz Fe-oxide + small amount pyroxene/quartz
Note: Mineralogy by binocular microscopy.
Table 13. Major·element chemistry of Davuilevu silica sand, Fiji. The composition of a UK commercial glass sand is included for comparison.
Element oxide FJ 4 (%)
Si02 96.5
Ti~ 1.39 AI20 3 0.07
Fe203 1.37
MnO ·0.08 MgO 0.04 Cao 0.02 Na20 0.07
K20 0.Ql
P20S 0.01
Cr2~ 0.04
LOI 0.23 Total 99.79
'" Loch Aline grade B (Highley, 1977)
FJ 5 (%)
96.85
1.28
0.07
1.09
0.07 0.04 0.04 0.08 0.Ql
0.Ql
0.03
0.16 99.7
19
UK Commercial glass sand (%)'"
99.85 - 99.75
0.01
0.1 - 0.05
0.013 - 0.009
Not available 0.01 0.01 0.01
0.005
Not available
0.0003
0.05 100.0
100~--------------------------~~-&~~--~----------~
c ~ 80 .c -~ ~
~ QJ eJ) 60 cu -C QJ V "-QJ Co 40 QJ
>-.--.! = S 20 = U
FJ 4
GMF lower limit
GMF upper limit
0 10 100 1000 10000
Diameter (microns)
Figure 9. Particle-size distribution of silica sand (FJ 4), Davuilevu, Fiji
100~------------------------~~~'-~--~~--------~
c cu 80 .c -~ ~
~ QJ
60 eJ) cu -C QJ V "-QJ Co 40 QJ
>-.--cu
-= S 20 = U
FJ 5
GMF lower limit
GMF upper limit
0 10 100 1000 10000
Diameter (microns)
Figure 10. Particle-size distribution of silica sand (F J 5), Davuilevu, Fiji
N.B. GMF limits refer to the particle-size range recommended by the Glass Manufacturers Federation for container and flat glass manufacture (Highley. 1977)
20
Gravity separation (Reichert cone concentrators and/or spiral separators to ~' .) remove heavy minerals)
Excavation (dredging, blasting, ripping,
mining, etc ... )
-,'/
Screening (to remove oversize and
fmes)
Attrittion scrubbing
(to remove impurities, eg clay and iron oxides)
Magnetic separation (low and/or high intensity for removing magnetite and other
magnetic minerals)
Size classification (to remove fine and/or coarse material using hydrocyclones, screw classifiers and/or screens)
Dewatering (hydrocycloning, dewatering
screens and/or dryers)
Froth notation ( to separate silica from
feldspar and remaining iron minerals/iron coated grains)
Figure 11. Flowsheet for the processing of. glass grade silica sand
21
----------
4.3.4. References
Highley, D E (1977) Silica: Mineral Dossier No.18. Mineral Resources Consultative Committee. HMSO.
4.4 Aggregates
4.4.1. Laboratory Methods
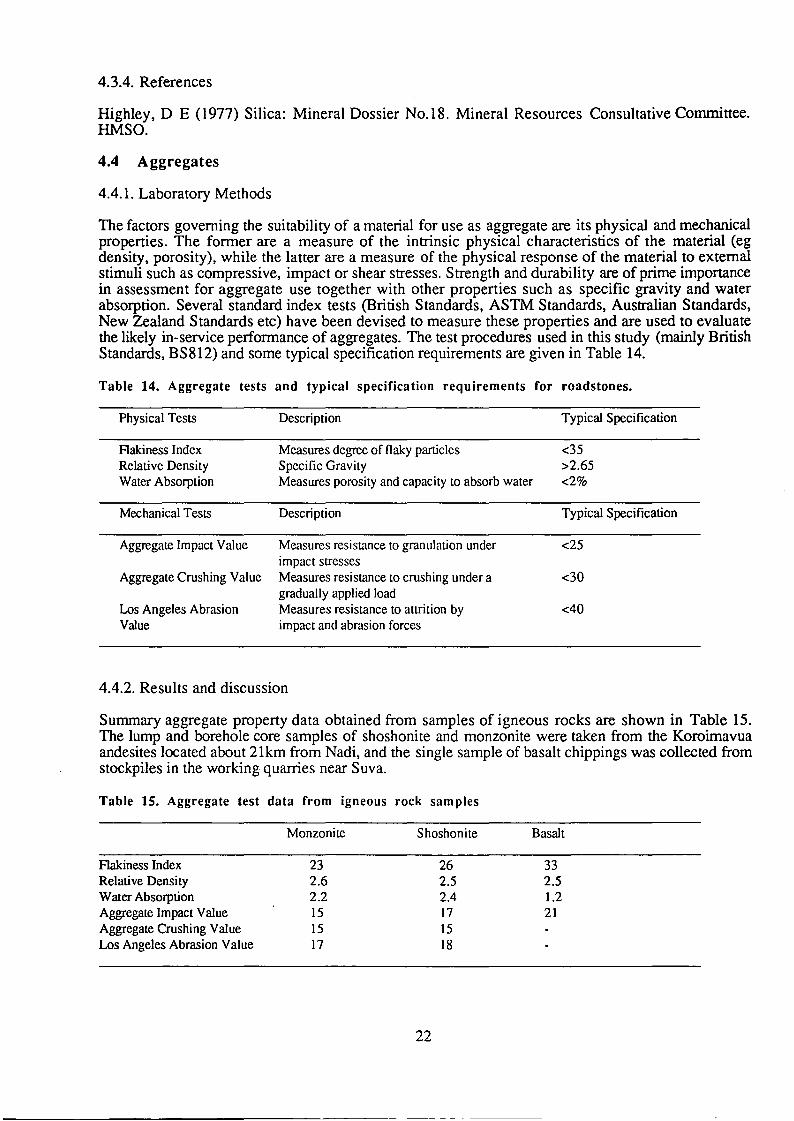
The factors governing the suitability of a material for use as aggregate are its physical and mechanical properties. The former are a measure of the intrinsic physical characteristics of the material (eg density, porosity), while the latter are a measure of the physical response of the material to external stimuli such as compressive, impact or shear stresses. Strength and durability are of prime importance in assessment for aggregate use together with other properties such as specific gravity and water absorption. Several standard index tests (British Standards, ASTM Standards, Australian Standards, New Zealand Standards etc) have been devised to measure these properties and are used to evaluate the likely in-service performance of aggregates. The test procedures used in this study (mainly British Standards, BS812) and some typical specification requirements are given in Table 14.
Table 14. Aggregate tests and typical specification requirements for roadstones.
Physical Tests Description
Measures degree of flaky particles Specific Gravity
Typical Specification
Flakiness Index Relative Density Water Absorption Measures porosity and capacity to absorb water
<35 >2.65 <2%
Mechanical Tests
Aggregate Impact Value
Aggregate Crushing Value
Los Angeles Abrasion Value
Description
Measures resistance to granulation under impact stresses Measures resistance to crushing under a gradually applied load Measures resistance to attrition by impact and abrasion forces
4.4.2. Results and discussion
Typical Specification
<25
<30
<40
Summary aggregate property data obtained from samples of igneous rocks are shown in Table 15. The lump and borehole core samples of shoshonite and monzonite were taken from the Koroimavua andesites located about 21km from Nadi, and the single sample of basalt chippings was collected from stockpiles in the working quarries near Suva.
Table 15. Aggregate test data from igneous rock samples
Monzonite Shoshonite Basalt
Aakiness Index 23 26 33 Relative Density 2.6 2.5 2.5 Water Absorption 2.2 2.4 1.2 Aggregate Impact Value 15 17 21 Aggregate Crushing Value 15 15 Los Angeles Abrasion Value 17 18
22
----------------
Testing data indicate that all three samples produced strong, durable aggregates suitable for most construction purposes, although the monzonite/shoshonite aggregates were markedly stronger than the basalt quarry chippings. This may be due in part to the flaky shape of the basalt quarry products, as a high proportion of flaky particles (a high flakiness index) tends to reduce aggregate strength (gives a high AIV). Both monzonite and shoshonite samples gave relatively high values of water absorption, although within the range expected from these rock types. Further surveys, involving systematic sampling and testing, are required to fully evaluate their aggregate resource potential.
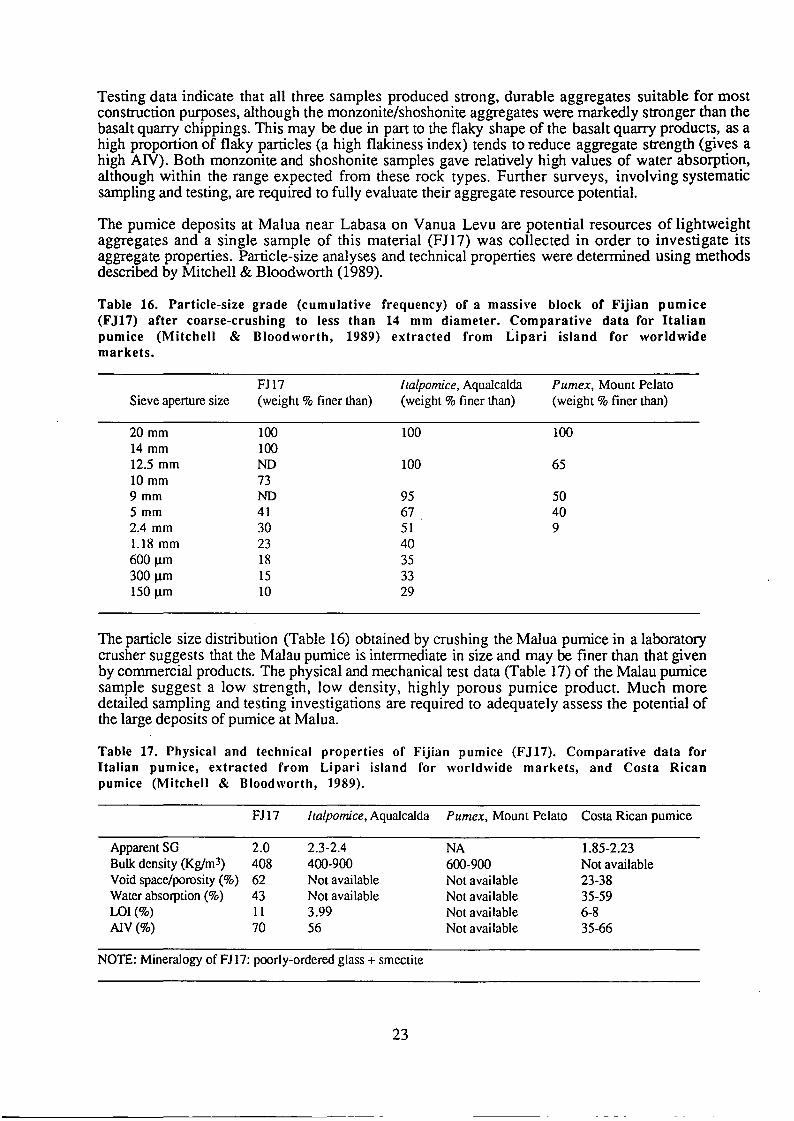
The pumice deposits at Malua near Labasa on Vanua Levu are potential resources of lightweight aggregates and a single sample of this material (FJ17) was collected in order to investigate its aggregate properties. Particle-size analyses and technical properties were determined using methods described by Mitchell & Bloodworth (1989).
Table 16. Particle-size grade (cumulative frequency) of a massive block of Fijian pumice (FJ17) after coarse-crushing to less than 14 mm diameter. Comparative data for Italian pumice (Mitchell & Bloodworth, 1989) extracted from Lipari island for worldwide markets.
FJl7 l/alpomice, Aqualcalda Pumex, Mount Pelato Sieve aperture size (weight % finer than) (weight % finer than) (weight % finer than)
20mm 100 100 100 14 mm 100 12.5 mm ND 100 65 10 mm 73 9 mm ND 95 50 5 mm 41 67 40 2.4 mm 30 51 9 1.18 mm 23 40 600 J..lm 18 35 300 J..lm 15 33 150 J..lm 10 29
The particle size distribution (Table 16) obtained by crushing the Malua pumice in a laboratory crusher suggests that the Malau pumice is intermediate in size and may be finer than that given by commercial products. The physical and mechanical test data (Table 17) of the Malau pumice sample suggest a low strength, low density, highly porous pumice product. Much more detailed sampling and testing investigations are required to adequately assess the potential of the large deposits of pumice at Malua.
Table 17. Physical and technical properties of Fijian pumice (FJ17). Comparative data for Italian pumice, extracted from Lipari island for worldwide markets, and Costa Rican pumice (Mitchell & Bloodworth, 1989).
FJl7 Italpomice, Aqualcalda Pumex, Mount Pelato Costa Rican pumice
ApparentSG 2.0 2.3-2.4 NA 1.85-2.23 Bulk density (Kg/m3) 408 400-900 600-900 Not available Void space/porosity (%) 62 Not available Not available 23-38 Water absorption (%) 43 Not available Not available 35-59 LOI (%) 11 3.99 Not available 6-8 AIV (%) 70 56 Not available 35-66
NOTE: Mineralogy ofF]17: poorly-ordered glass + smectite
23
4.4.3. References
British Standards Institution (1990). Methods for sampling and testing of mineral aggregates, sands and fillers. BS812.
Mitchell, C J & Bloodworth, A J (1989) Evaluation of pumice from Costa Rica as Lightweight aggregate. Rep. Brit. Geol. Surv. WG/89/21R.
4.5. Bauxite
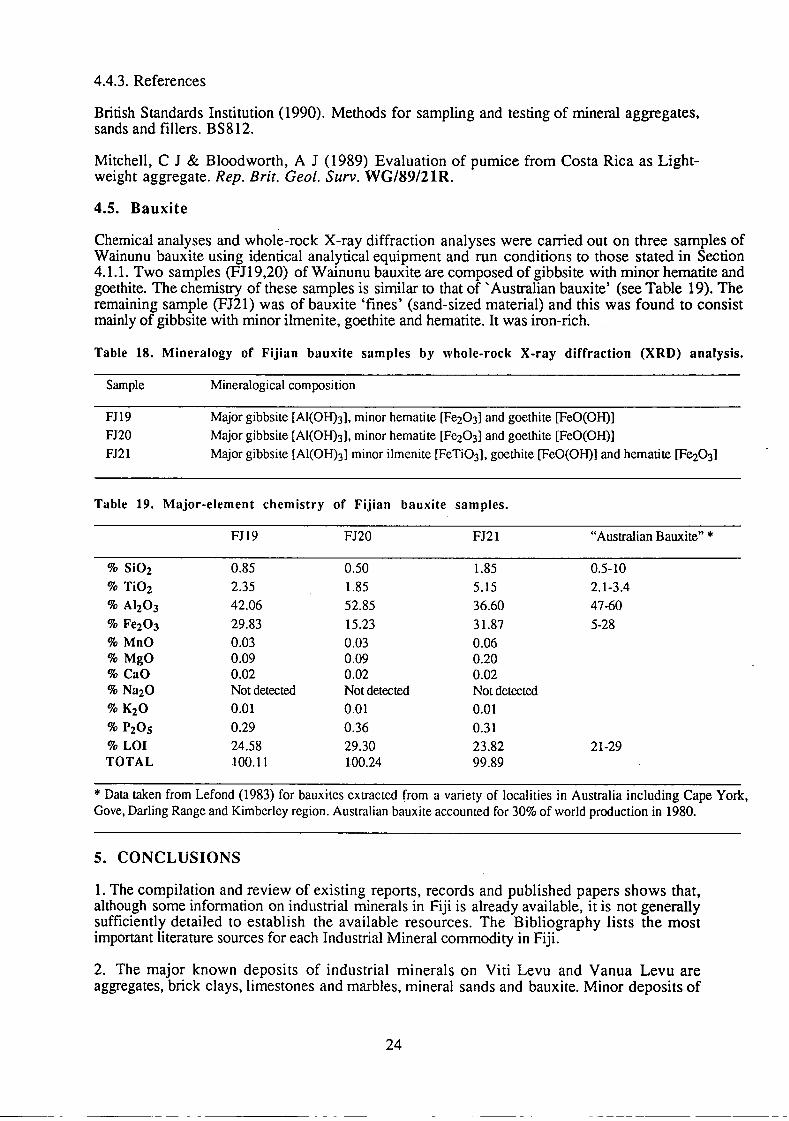
Chemical analyses and whole-rock X-ray diffraction analyses were carried out on three samples of Wainunu bauxite using identical analytical equipment and run conditions to those stated in Section 4.1.1. Two samples (FJ19,20) of Wainunu bauxite are composed of gibbsite with minor hematite and goethite. The chemistry of these samples is similar to that of 'Australian bauxite' (see Table 19). The remaining sample (FJ21) was of bauxite 'fines' (sand-sized material) and this was found to consist mainly of gibbsite with minor ilmenite, goethite and hematite. It was iron-rich.
Table 18. Mineralogy of Fijian bauxite samples by whole-rock X-ray diffraction (XRD) analysis.
Sample
FJ19 FJ20
FJ21
Table 19.
% Si02
% Ti02 % AI20 3 % Fe203 %MnO %MgO % CaO % Na20 %K2O
% P20S %LOI TOTAL
Mineralogical composition
Major gibbsite [AI(OHh], minor hematite [Fe203] and goethite [FeO(OH)] Major gibbsite [AI(OH)3], minor hematite [Fe203] and goethite [FeO(OH)]
Major gibbsite [Al(OH)3] minor ilmenite [FeTi03], goethite [FeO(OH)] and hematite [Fe203]
Major-element chemistry of Fijian bauxite
FJ19 FJ20
0.85 0.50 2.35 1.85 42.06 52.85
29.83 15.23
0.03 0.03 0.09 0.09 0.02 0.02 Not detected Not detected 0.01 0.01
0.29 0.36 24.58 29.30 100.11 100.24
samples.
FJ21
1.85 5.15
36.60
31.87
0.06 0.20 0.02 Not detected
0.01
0.31
23.82 99.89
"Australian Bauxite" *
0.5-10
2.1-3.4
47-60
5-28
21-29
* Data taken from Lefond (1983) for bauxites extracted from a variety of localities in Australia including Cape York, Gove, Darling Range and Kimberley region. Australian bauxite accounted for 30% of world production in 1980.
5. CONCLUSIONS
1. The compilation and review of existing reports, records and published papers shows that, although some information on industrial minerals in Fiji is already available, it is not generally sufficiently detailed to establish the available resources. The Bibliography lists the most important literature sources for each Industrial Mineral commodity in Fiji.
2. The major known deposits of industrial minerals on Viti Levu and Vanua Levu are aggregates, brick clays, limestones and marbles, mineral sands and bauxite. Minor deposits of
24
-------- --
baryte, kaolinite, zeolite and perlite also occur and phosphate deposits have been recorded at a number of sites, particularly on islands of the Lau Group.
3. The review of statistical records of imported industrial mineral commodities and manufactured products shows that large amounts of fertilisers are imported to sustain the sugar growing and other agricultural industries. The phosphate deposits of the Lau Group need to be fully explored to investigate their potential for economic development as fertiliser raw materials including their possible suitability for direct application. Significant amounts of lime, chalk and marble (and other building stones) are also imported despite known occurrences of carbonate rocks, principally on Viti Levu but also on Vanua Levu. Small amounts of bricks, silica sand, kaolinite and pumice are also imported although deposits of these raw materials and brick clays are known, but not quantified, in Fiji.
4. There is a general lack of compositional data and basic technical data on Industrial Minerals in Fiji. The laboratory assessment of the samples collected for this preliminary evaluation are summarised below.
LimestoneslMarbles The lump and core samples of Wainevesi marble, the two core samples of Qalimare limestone and the single lump sample of Tau limestone are all of very high purity (>98.5%CaC03) and contain only small amounts of magnesia, silica, iron and alumina. The Qalimare limestone samples are particularly pure. These results indicate that all these limestones are potentially suitable for a wide range of industrial applications, such as iron and steel manufacture, sugar refining, glass and chemical manufacture and for fillers and pigments. The high brightness values of the Wainevesi/Qalimare samples further indicate their potential application as carbonate fillers. The results of calcination trials on the samples also shows that good quality limes can be produced from the Wainevesi marble and the Qalimare limestone, although the latter is faster burning. Their potential for use as dimension stone or aggregates has not been investigated in this preliminary study, but the use of Wainevesi marble and Qalimare limestone as building stone has been assessed previously (see Bibliography). The latter deposit has recently been extensively drilled for potential development of a marble (dimension stone) quarry. The limited laboratory testing programme reported here and the indications of previous studies show that the limestone deposits of Qalimare and Tau in western Viti Levu and the Wainevesi marble in eastern Viti Levu are potential high grade resources of industrial grade carbonate rock. The Qalimare and Wainevesi deposits are also potential dimension stone resources. All deposits are suitable for cement manufacture and they are also potential crushed rock aggregate resources. The limestones from Vanua Levu are generally expected to be less pure, but nevertheless they are potentially suitable for many applications. Further systematic field and laboratory investigations are required to establish resources or reserves and ensure their optimal development and usage.
Brick Clays The clay samples from both Koronivia flat and Bau on the Rewa delta are characterised by a quartz-feldspar-kaolin-smectite-verrniculite assemblage or a quartz-goethite-kaolin assemblage. The samples contained varying amounts of 'sand'; some are coarse grained containing 40-50% 'sand', whereas others are finer grained containing less than 20% 'sand'. These latter clays are quite plastic and generally exhibit high drying shrinkage. The coarser-grained clays are generally of lower plasticity and smaller drying shrinkage. All the clay samples gave high porosity values indicating low handling strengths.
The firing characteristics of the clays are variable, but most samples indicate that the production of bricks of adequate strength is possible. It is likely that the coarser clay samples which gave poor results would improve by blending with the finer clay materials.
These positive results are in general accord with previous studies (see Bibliography), although to date no systematic investigations, involving detailed field mapping, sampling, laboratory characterisations and firing trials, of clay deposits in Fiji have been undertaken.
25
Silica Sands The two samples of residual silica sand from Davuilevu were relatively coarse grained and contained mainly quartz (around 97% Si02) plus small amounts of feldspar, ilmenite and iron oxide (hematite or magnetite). The samples fall outside of the recognised specifcations for glass sand, as they contain both too much coarse sand and silt, and unacceptable levels of impurities (Fe203, Ti02 and Cr203). However, it is possible that mineral processing techniques involving screening and magnetic separation could upgrade the sands to glass grade raw materials. The silica sand deposits of Fiji are largely unexplored despite the existence of potential resources with good access near Suva. Where deposits are known, the boundaries have not been mapped in any detail and compositional data are sparse.
Aggregates The samples of monzonite and shoshonite obtained from the Geopacific gold prospect in the Koroinavua andesites near Nadi both produced aggregate of good quality. The mechanical test data indicate high aggregate strengths and durability and the physical test data are similar those to specified for igneous crushed rock aggregates used in roadstone. A single sample of basalt from the quarries near Suva gave an index value indicating high strength,despite a flaky particle shape. A sample of pumice from the extensive deposits at Malau on Vanua Levu gave test results indicating low strength and both high porosity and water absorption. Much more detailed sampling and laboratory evaluations are required to assess the potential of these pumice deposits as resources of lightweight aggregates, building stone or abrasives. Fiji appears to be self-sufficient in aggregates but there has been no systematic assessment of aggregate resources in the country and no database of basic technical (aggregate quality) data exists. As Fiji further develops its economy and infrastructure there will be an increasing demand for construction aggregates. In many cases these aggregates (either crushed rock or river sands and gravels) will be required to meet stringent specifications for their mineralogical, physical and mechanical properties.
Bauxite Three samples of nodular bauxite from Wainunu on Vanua Levu were all composed of gibbsite with minor hematite and goethite. Chemical analysis indicates that the bauxites grade around 40-50% alumina, but they are iron-rich (up to 30% Fe203). The sample of 'fines' was particularly iron-rich.
6. RECOMMENDATIONS
This report outlines the potential of Fiji's indigenous industrial mineral deposits. Further detailed field and laboratory based investigations are required to evaluate fully these natural resources. It is recommended that a project to systematically explore and evaluate the industrial mineral potential of Fiji should be undertaken. The project objectives should be :
1. To compile a basic inventory of all significant occurrences of industrial minerals in Fiji.
2. To make detailed field and laboratory investigations of selected industrial mineral deposits in Fiji. Emphasis would be placed on limestones for lime, dimension stones, clay materials for burnt-brick production and phosphates.
3. To identify new industrial mineral resources and to research new markets for known mineral deposits.
4. To prepare reports and maps detailing the results of 1 to 3 above, for the Mineral Resources Department and for potential investors from within and outside Fiji.
5. To prepare appropriate guidelines for environmentally acceptable sustainable development of industrial mineral resources in Fiji.
26
---------------------
6. To carry out the above tasks in conjunction with counterparts from the Mineral Resources Department wherever possible.
7. To train Fijian counterpart staff in the necessary techniques for evaluating industrial minerals.
It is anticipated that this project would require the secondment of one qualified industrial minerals geologist to the Mineral Resources Department, Suva for a period of two years, with the possibility of extension for one more year.
The necessary laboratory facilities are not available in the Mineral Resources Department and detailed laboratory testwork would be carried out in fully equipped industrial minerals laboratories outside Fiji.
In order for the Mineral Resources Department (MRD) to carry out some testwork on industrial minerals it is recommended that appropriate equipment is provided to establish a basic laboratory test facility at MRD.
It is also recommended that a technician from the Mineral Resources Department is seconded (for 3 months) to the British Geological Survey for training in industrial mineral laboratory assessment techniques. This should be undertaken before the industrial minerals geologist takes post. Consideration should also be given to sending a geologist from the Mineral Resources Department on a one year MSc industrial minerals course at an appropriate university.
7. BIBLIOGRAPHY
Industrial Mineral Deposits of Fiji
BARYTES
Guest, N.J., 1958. Barytes in Fiji, with details of the Koroisa deposit,western Viti Levu. Geological Survey, Fiji. Report No. 38.
BAUXITE
Colley, H. and Flint, D.J. (in press). Mineral deposits of Fiji (metallic deposits). Fiji Mineral Resources Division Memoir 1. Greenbaum, D. 1980. An assessment of the mineral resources of Fiji. Commonwealth Geological Liaison Office, Special Liaison Report 3/1. Houtz,R.E. and Phillips, K.A. 1963. Interim report on the economic geology of Fiji. Fiji Geological Survey Economic Report 1. Williams, M. 1969. Bauxites and related clay deposits. Fiji Geological Survey Colloquium 1969, Paper 23.
CLAYS
Adams, M.E. 1970. The Rewa peat bog and related clay horizons. Fiji Agricultural Journal 32. Anon. 1985. Fiji: a study of clay brick and tile manufacture. Commonwealth Secretariat. Commonwealth Fund for Technical Cooperation. Industrial Development Unit. Bain, J.A., Stacey, F.R. and Livingstone, A. 1965. Amineralogical and ceramic investigation of superficial clays from Viti Levu, Fiji. Overseas Geological Surveys, Mineral Resources Division Report 184. Kirkendale, G. A. 1971. Feasibility study for a facebrick industry in Fiji. UN Industrial Development Organisation, Suva. Knight, D.J. 1986. Geotechnical properties and behaviour of the Monosavu Halloysite clay, Fiji. Clay Minerals, 21. 311-332.
27
Loki, S. 1977. Testing of clay from northwestern Viti Levu. Fiji Mineral Resources Division Note BP16/6. Loki, S. 1990. Report on Tavua clay investigation. Fiji Mineral Resources Department Note BP16/88. McKissock, G., Morgan, D. and Bain, J .A. 1968. The mineralogy of four clay samples from Fiji. Overseas Geological Surveys, Mineral Resources Division Report 288. Petersham, D. and Petersham, M. 1978. Fiji Mineral Resources Department Miscellaneous Report 1. Rahiman, A. 1974. Clay deposit near Nadi. Fiji Mineral Resources Division Report 2. Rahiman, A., 1975. Report on Koronivia clay investigation. Fiji Mineral Resources Division Note BP 5/10. Rahiman, A. 1976. Report on investigation of clays at Bau. Fiji Mineral Resources Division Note BP 5/14. Whippy, F. 1986. Preliminary report on Nausori urban geology. Fiji Mineral Resources Department Note BP39/15. Williams, M. 1969. Tests of soils and weathered rock as materials for brick manufacture. Fiji Geological Survey Note MW8.
LIMESTONE (including Marble)
Becker, J. 1981. Wainevesi marble In Fiji. ESCAP Regional Mineral Resources Development Centre. Report No. 148. Dave, N. G. 1981. Technical feasibility studies for the establishment of lime and some lime based industries in Fiji. Fiji Ministry of Works, Suva. Guest, N.J. 1956. Raw materials for cement manufacture at Lami, near Suva. Geological Survey, Fiji. Report No. 33. Guest, N.J. 1957. Economic possibilities of limestones, Viti Levu, Fiji. Geological Survey, Fiji. Report No. 36. Hathaway, B. 1988. The Eocene to Miocene geology of southwest Viti Levu, Fiji. Unpublished PhD Thesis. Oxford Polytechnic. Ibbotson, P. 1967. Limestone at Tuatua, Labasa. Geological Survey Department, Suva. Note 110. Lum, J.A. 1982. Assessment of the Devodara limestone for a lime pilot plant proposal. Fiji Mineral Resources Department Report 47. . Rahiman, A. 1983. Raw materials for cement in Fiji. Fiji Mineral Resources Department, Economic Investigation No.2. Rodda, P. 1982. Notes on DDH (ENG) 77/28 Tamavua and the composition of the Lami limestone. Fiji Mineral Resources Department Report No. 29. Rodda, P. 1989. Provenance of certain concrete from Labasa. Fiji Mineral Resources Department Note BPln2. Shadmon, A. 1982. Advisory Mission in Marble Development, Fiji. UN{fCD INT/80-R45 Project.
MINERAL SANDS
Colley, H. and Flint, D.J. (in press). Mineral deposits of Fiji (metallic deposits). Fiji Mineral Resources Division Memoir 1. Htay, T. and Flint, D.J. 1991. Sedimentology of a fluvial sand from Nakauvadra Creek, Vaileka area, Viti Levu. Fiji Mineral Resources Department Note BP 60/6. Ibbotson, P. 1959. Silica sands of the Suva area. Fiji Geological Survey Department, Geological Survey Notes No. 68. Rodda, P. 1990. Notes on some beach sands from Fiji. Fiji Mineral Resources Department Note BP 1/86.
PHOSPHATES
Colley, H. 1975. A review of investigations carried on phosphate deposits in the Lau Group. Fiji Mineral Resources Department Note BP 9/13.
28
Greenbaum, D. 1980. An assessment of the mineral resources of Fiji. Commonwealth Geological Liaison Office, Special Liaison Report 3/1. Houtz, R.E. and Phillips, K.A. 1963. Interim Report on the Economic Geology of Fiji. Fiji Geological Survey Department, Economic Report No. 1. Kennedy, E.M. 1965. Vanua Latu phosphates. Fiji Mineral Resources Department Exploration Report 283/386/411-1. Rodda, P. 1976. Report on the Phosphate survey, Tuvuca, 1975. Fiji Mineral Resources Division Report 1. Rodda, P. 1981. The phosphate deposits and geology of Tuvutha. Fiji Mineral Resources Department Economic Investigation 3. Rodda, P. and Lum, J. 1990. Geological evolution and mineral deposits of Fiji. In: Geological evolution and hydrothermal activity in the Lau and North Fiji Basins, southwest Pacific Ocean. Results of SONNE Cruise SO-35. Ulrich von Stackelberg, Ulrich von Rad (editors). Geologisches lahrbuch D92. Simonyi, J.S. 1963. Preliminary report on investigations on the phosphate deposits on Vanua Vatu island in the Lau Group, Fiji. Fiji Department of Agriculture, Chemistry Division. Singh, A. and Simonyi, J.S. 1971. Report on the investigation ofLau phosphate. Fiji Department of AgriCUlture, Suva. Warin, O.N. 1964. The Fiji islands - the Lau Group. In: A survey of phosphate deposits in the SW Pacific and Australian waters. White, W.C. and Warin, O. N. Bureau of Mineral Resources, Geology and Geophysics Bulletin 69. Canberra.
PUMICE
Rickard, M.J. 1961. The possibility of a pumice products industry in Fiji. Geological Survey Department, Suva. Report No.70.
29