Embed Size (px)
Citation preview

SUPERELEVATION
superelevation = change of crossfall of the road (fig. 0340):
horizontal straight….normal crown (cross-section in fig. 0340)
transition curve……„L“ superelevation development (between cross-sections and in fig. 0340)
horizontal curve…....full superelevation (cross-section in fig. 0340)
fig. 0340 (superelevation around the centre line)

Superelevation around centre line:
TS SC ... ascending development
CS ST ... descending development
Used variables (in fig. 0350): v0 [m]..... elevation of centre line (already known) ve [m]..... elevation of outer channel line vi [m] ..... elevation of inner channel line
Chanel lines in cross-section of road categories: S 6,5 – outer edges of traffic lane “a” S 7,5 – outer edges of guiding strips “v” S 9,5
a).. channel lines V – outer edges of guiding strips “v” b).. channel lines C – outer edges of hard shoulders “c”
S 11,5 a).. channel lines V – outer edges of guiding strips “v” b).. channel lines C – outer edges of hard shoulders “c”
fig. 0345 (position of channel lines in cross-section)

fig. 0350 (profile of superelevation around the centre line)
fig. 0351 (sections of superelevation around the centre line)
Table of superelevation for channel lines S 6,5 + S 7,5 + S 9,5V + S 11,5V
Preparation for calculation of the table of superelevation: width between the centre line and channel lines:
straight section ........................... a + v
horizontal curve (R 250 m) ........ a + v
horizontal curve (R 250 m) ........ a + a + v

determine the traffics lane width extension in horizontal
curve („a“) according to the radius „R“ in the table in fig.
0360 – only if R < 250 m (R 250 m a = 0 m)
fig. 0360 (traffic lane width extension in the curve „a“)
list of constant values (already known):
S [%]…….cross fall (in a general place)
S0 [%]……cross fall of normal crown (straight section)
a [m]…….width of traffic lane
v [m]….....width of guiding strip (v = 0 m for S 6,5 !!!)
a [m]…..traffic lane width extension in the curve calculation of new constant values (fig. 0350) – h0, h´:
based on cross-section in fig. 0340:
100
Svah 0
0
based on cross-section in fig. 0340:
100
SvΔaahh´ 0
100
SΔaSvaSvah´ 0
100
SΔaSSvah´ 0

Tabulated superelevation:
table for calculation of superelevation (in case „a = 0 m“ fig. 0380) – just in sections:
TS SC
SC ST use header as in fig. 0370
fig. 0370 (tabulated superelevation – header with variables)
column 1 = serial number of each calculated point (fill in all points which were calculated in the tabulated
longitudinal profile in sections TS SC a CS ST) column 2 = chainage [km] on 5 decimal places column 3 = point name (in case it has any – examples in
fig. 0380) column 4 = elevation of centre line („v0 [m]“) copied
from the tabulated longitudinal profile (on 2 decimal places)
column 5 = depth of channel line in horizontal straight – fill in the constant „h0 [m]“ to all points
column 6 = lane width extension „a [m]“ (fill in only for case R < 250 m) – fill in values:

in points TS and ST .. a = 0 m
in points SC and CS .. „a“ from the table in fig. 0360 corresponding to the radius „R“
in other points ........... interpolate by the extreme values in points TS and SC, or CS and ST
column 7 = height of full superelevation – fill in the constant „h´ [m]“ to all points
column 8 = gradient of the runout(off) – fill in the constant „h´/L“ to all points
column 9 = distance of the calculated point from point TS or ST („x“ [m]) – fill in values according to fig. 0350:
in points TS and ST……….x = 0
in points SC and CS………x = L
in other points interpolate by the extreme values in points TS and SC, or CS and ST
column 10 = height above the elevation of channel line in horizontal straight [m] = (xh´)/L
column 11 = variable value „hx (x) [m]“ depends on the „x“ for inner and outer channel line separately („height“ above or below the centre line):
according to the similarity of triangles in fig. 0350:
x
hxh
L
h́ 0x
0x hL
h́xxh
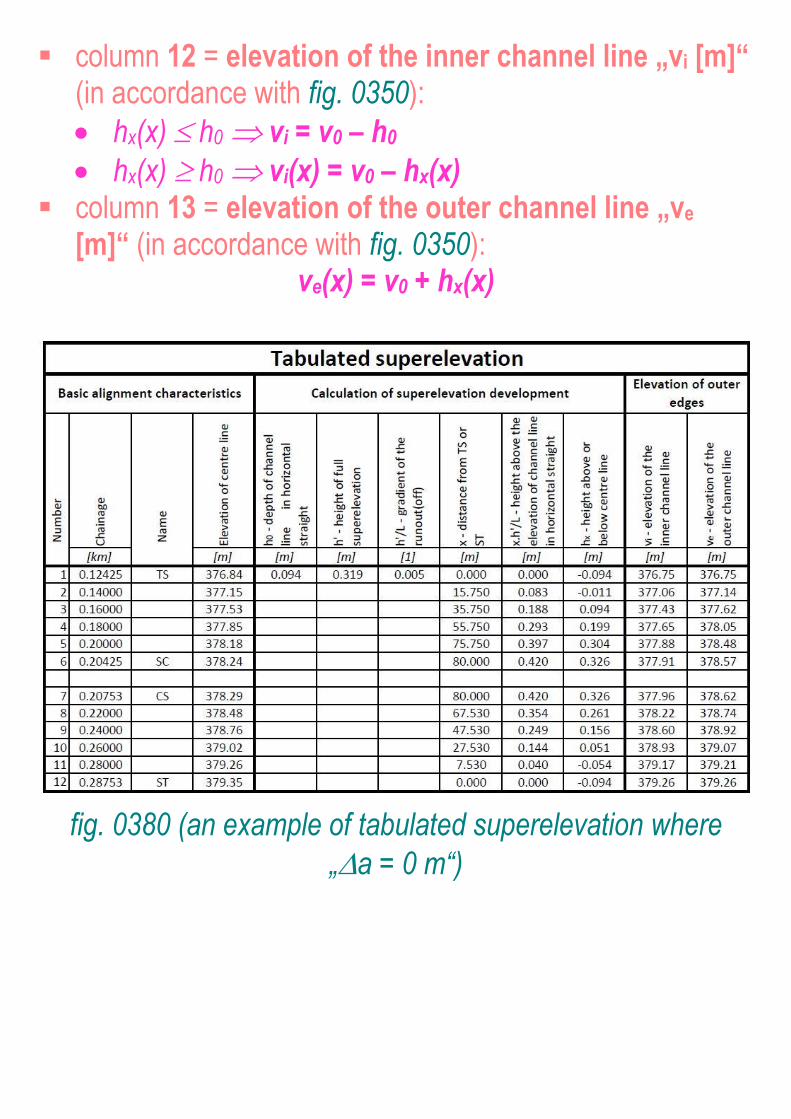
column 12 = elevation of the inner channel line „vi [m]“ (in accordance with fig. 0350):
hx(x) h0 vi = v0 – h0
hx(x) h0 vi(x) = v0 – hx(x) column 13 = elevation of the outer channel line „ve
[m]“ (in accordance with fig. 0350): ve(x) = v0 + hx(x)
fig. 0380 (an example of tabulated superelevation where
„a = 0 m“)

Table of superelevation for channel lines S9,5C + S11,5C
for road categories S 9,5 or S 11,5 one more table of superelevation should be made
copy the previous table of superelevation and adjust it for calculation of elevation of channel lines S 9,5C and S 11,5C according to fig. 0340, fig. 0345 and fig. 0350
Preparation for calculation of the table of superelevation: width between the centre line and channel lines:
straight section ........................... a + v + c
horizontal curve (R 250 m) ........ a + v + c
horizontal curve (R 250 m) ........ a + a + v + c
based on cross-section in fig. 0340:
100
Svah 0
0
based on cross-section in fig. 0340:
100
SΔaSSvah´ 0
Superelevation in other drawings Draw superelevation development symbols (fig. 0390) in the longitudinal profile (according to fig. 0400 and fig. 0410)
fig. 0390 (an example of superelevation development symbols in longitudinal profile)

fig. 0400 (longitudinal profile – second phase of plotting)
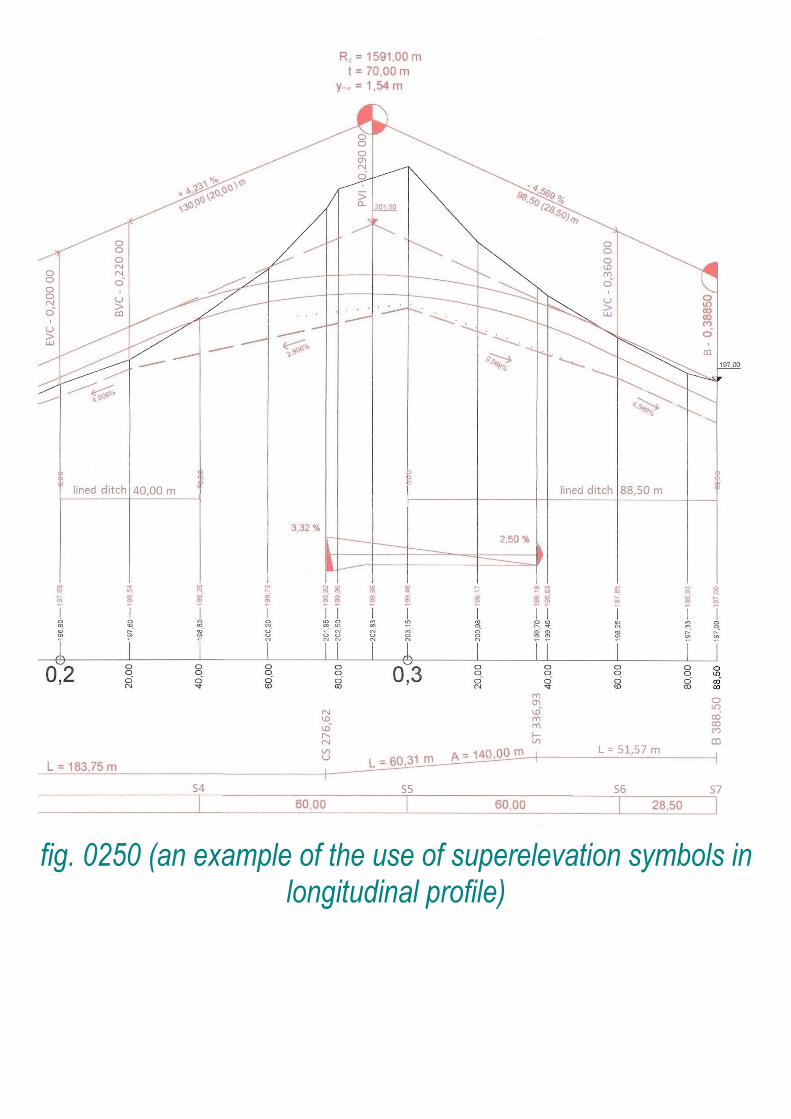
fig. 0250 (an example of the use of superelevation symbols in longitudinal profile)