Embed Size (px)
Citation preview
1
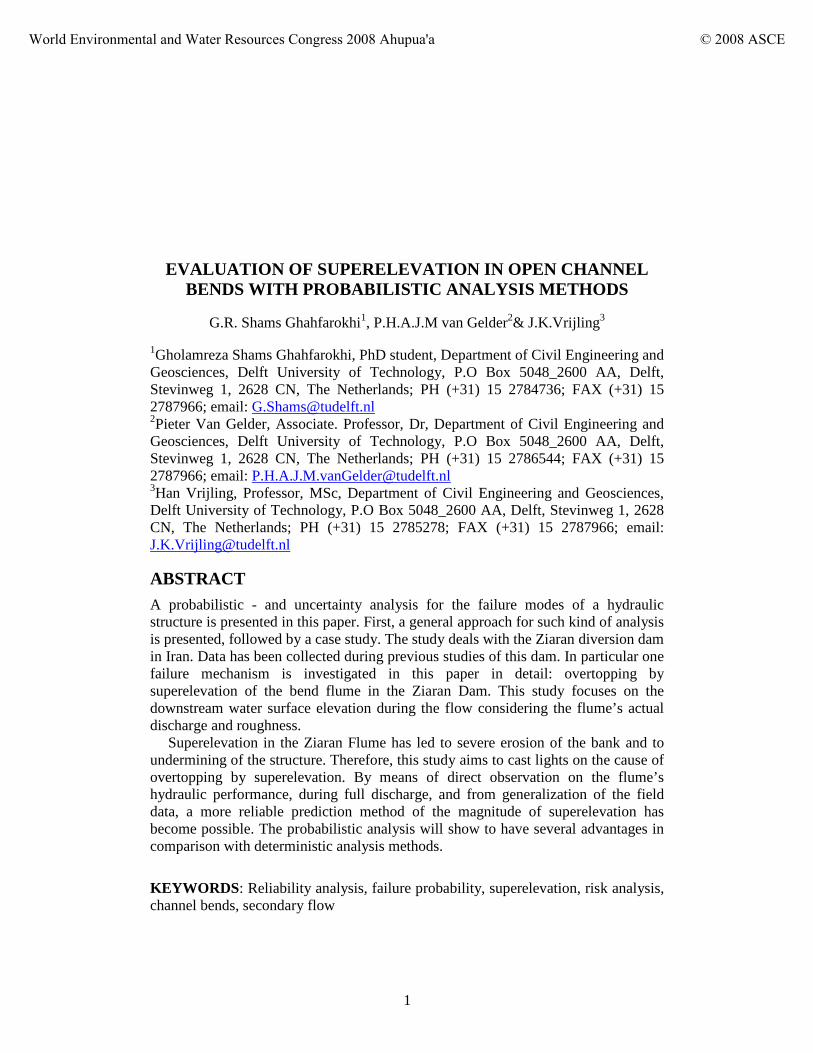
EVALUATION OF SUPERELEVATION IN OPEN CHANNEL BENDS WITH PROBABILISTIC ANALYSIS METHODS
G.R. Shams Ghahfarokhi1, P.H.A.J.M van Gelder2& J.K.Vrijling 3
1Gholamreza Shams Ghahfarokhi, PhD student, Department of Civil Engineering and Geosciences, Delft University of Technology, P.O Box 5048_2600 AA, Delft, Stevinweg 1, 2628 CN, The Netherlands; PH (+31) 15 2784736; FAX (+31) 15 2787966; email: [email protected] 2Pieter Van Gelder, Associate. Professor, Dr, Department of Civil Engineering and Geosciences, Delft University of Technology, P.O Box 5048_2600 AA, Delft, Stevinweg 1, 2628 CN, The Netherlands; PH (+31) 15 2786544; FAX (+31) 15 2787966; email: [email protected] 3Han Vrijling, Professor, MSc, Department of Civil Engineering and Geosciences, Delft University of Technology, P.O Box 5048_2600 AA, Delft, Stevinweg 1, 2628 CN, The Netherlands; PH (+31) 15 2785278; FAX (+31) 15 2787966; email: [email protected]
ABSTRACT A probabilistic - and uncertainty analysis for the failure modes of a hydraulic structure is presented in this paper. First, a general approach for such kind of analysis is presented, followed by a case study. The study deals with the Ziaran diversion dam in Iran. Data has been collected during previous studies of this dam. In particular one failure mechanism is investigated in this paper in detail: overtopping by superelevation of the bend flume in the Ziaran Dam. This study focuses on the downstream water surface elevation during the flow considering the flume’s actual discharge and roughness.
Superelevation in the Ziaran Flume has led to severe erosion of the bank and to undermining of the structure. Therefore, this study aims to cast lights on the cause of overtopping by superelevation. By means of direct observation on the flume’s hydraulic performance, during full discharge, and from generalization of the field data, a more reliable prediction method of the magnitude of superelevation has become possible. The probabilistic analysis will show to have several advantages in comparison with deterministic analysis methods.
KEYWORDS: Reliability analysis, failure probability, superelevation, risk analysis, channel bends, secondary flow
World Environmental and Water Resources Congress 2008 Ahupua'a © 2008 ASCE

2
1-INTRODUCTION
Uncertainty and risk are central features in hydraulic structural engineering. Engineers can deal with uncertainty by ignoring it, by being conservative, by using the observation method, or by quantifying it. In recent years, reliability analysis and probabilistic methods have found wide application in hydraulic engineering. Development of reliability based analysis methods for engineering application can be found in many references (Cornell 1969; Ang and Tang 1984; Yen and Cheng, and Tang, 1980; Tung and Mays 1980; Yen and Tung 1993). Several applications of the methods to hydraulic design have been reported in literature (Tang and Yen 1972; Cornell 1972; Yen and Tung 1993; Vrijling 2001).The probabilistic design approach is a powerful tool in the reliability analysis of hydraulic structure. This allows us to determine the true probability of the component failure and of the whole system.
The so-called centrifugal force caused by flow around a curve results in a rise in the water surface at the outside wall and a depression of the surface along the inside wall. This phenomenon is called superelevation. The problems associated with flow through open channel bends deserves special attention in hydraulic engineering. Water surface slopes have been frequently reported to be a function of the curvature. But due to the difficulties in operation, the theoretical basis of superelevation has been discussed thoroughly in references. Furthermore experience indicates that existing theory does not lead to good results at their present status.
In the present study, the probabilistic method will be used for estimating superelevation in the Ziaran Flume (Ziaran Dam in Iran). The probabilistic design method is an approach that can provide a better understanding of the failure mechanisms, its occurrence probabilities, as well as its consequences of failure of such important infrastructure.
2-BACKGROUND AND THEORY
2.1- Basics of Open Channel Flow
The following basic model for open channel flow is shown in Figure 1. In an open channel, the mean total head (Energy head) is defined as:
2.cos 0 2
VH d Z
gθ α= + + (1)
Where: H is the total head, θ is the bed slope, Vis the depth-averaged flow velocity, g is the gravity acceleration, d is the water depth (d.cosθ is the pressure head), Z0 is the bed elevation, (V2/2g) is the kinetic energy head, A is the wet area of the cross section, B is the free surface width, Q is total discharge and α is the kinetic energy correction coefficient.
2.2- Flow in Bend
Bends occur frequently in natural water courses and need to be provided even in artificial channels because of the constraints in the alignment of such channels. The flow in bends is non-uniform and is more complex to analyse than that in straight channels because of the presence of normal acceleration in curved flows (Reinauer
World Environmental and Water Resources Congress 2008 Ahupua'a © 2008 ASCE

3
1997). It is often necessary for the engineer to understand and control the behavior of the flow around bends in rivers and canals.
A bend may introduce only small losses, but may at the same time also set up a disturbance in the flow, which persists for some distance downstream, perhaps damaging the banks of the river or canal, or perhaps overtopping the banks through wave action of some kind. There may be, downstream of the bend, also some critical important structure such as a spillway.
Besides, when water flows in a bend, we are confronted with spiral flow. Spiral flow refers to movement of water particles along a helical path in the general direction of the flow. Thus, in addition to the major velocity components normal to the channel cross section, there are transverse velocity components in the cross section. These transverse components will create a so-called secondary flow. (See Figure 2)
2.3- Basic Character of Flow around Bend
Consider the channel cross section shown in Figure 3a. In the following analysis, it will be assumed that any energy loss incurred in flow around the bend is very small and may be neglected. This assumption is very close to the truth in many cases, and in all cases, it is accurate enough for the results of the analysis to be qualitatively useful. All the stream filaments across the width will have the same total energy H according to Eqn. (1). If d is the height of the water surface above datum, than at any vertical section such as AB, V is the given velocity as a function of the depth. Let r be the radius of curvature of the streamlines at any section AB, and n the distance measured outwards across the width of the section. If all the streamlines are concentric, n and r can be made identical by measuring n outward from the common center, but this condition will not in general be fulfilled.
The Euler's equation of motion in the direction normal to the flow may be written as if the pressure distribution is hydrostatic, then ∂(p+γz)/∂z=-γ∂h/∂n, since at all points on AB, p+γz=γh. Then (Chow 1986):
2( )d rgh Vr
dr r= (2)
Where V is average velocity in the vertical at radius r. Equation 2 shows that there is a transverse slope of the water surface in a channel bend. The water level on the concave side is higher. By differentiation from Eqn. (2), we obtain:
0dh V dV
dr g dr+ = (3)
Combining Eqn. (2) and (3), we obtain:
0d V V
d r r+ = (4)
3-ZIARAN DIVERSION DAM (CASE STUDY)
The Ziaran diversion dam is a relative small concrete dam near Tehran the capital of Iran (see Figure 4). The Ziaran dam was completed in 1976. The characteristics of the Ziaran dam are:
World Environmental and Water Resources Congress 2008 Ahupua'a © 2008 ASCE

4
height 25 m; length 184 m, Volume reservoir about 225000 m³, Ogee Spillway with controller, Intake Tower and Outlet, Stilling Basin, Transition and Flume (see Figures 4-5).
This Flume was designed for a peak flow of 303 /m s with height 2.85 m, width 5 m for water conveyance to Qazvin city (Shams 1998). The Flume has a concrete bend. The section of this bend is shown in Figure (6) R=30 m, Ө=26º, B=5 m and Hb =2.85 m.
Superelevation in the Ziaran Flume (Ziaran Dam in Iran) has led to severe erosion of the bank and undermining of the structure (see Figure 7). This flume was designed for steady and uniform flow using the Manning equation and the USBR standard and checked with other Iranian standards with a maximum discharge 30 m³/s , n=0.014, B=5 m and d=2.35 m.
Originally, this bend had problems when operated at full capacity. Water was overtopping at the outer bank, undermining the structure, leading to severe erosion and to collapse of the bank. By direct observation of the flume and measurement flow characteristics as discharge and water level in the automatic gauging station downstream, an analysis could be made to find the critical discharge, being 27 m³/s.
3.1. Data Collection
Shams (1998) collected data from 173 experiments in Ziaran Flume. The hydraulic design implies the development of an energy based equation between one point in the flume downstream and one point in the bend centre that can expressed as (Marengo 2006):
42 2 3
1 2423
2. . . .(1 .... )
2f f cb
cb f f n cbf
Q g n L PE Z d K K K dy
gAA
−= + + + + + + + + (5)
Where Ecb denotes the elevation in meter above sea level (masl) in the bend center in the outer bank, df (m) denotes the height of the water level, A denotes the area of the flume (m²), Lf-cb denotes the distance between two points on the flume and bend center (m), dy denotes the amount of superelevation in the flume center, n denotes the Manning friction factor, P denotes the wetted perimeter (m), Ki denotes the dimensionless coefficients of local head losses, Zf denotes the elevation of the bottom of the flume in meter above sea level (masl).
The parameters in Eqn. (5) could be fitted by the data from Shams (1998), leading to the following expression:
0.6797 0.6276 2 0.62450.2786. 0.0341. (2248.71. . 0.4)cb fE Q Q n Q Z−= + + + (6)
4-BEND OVERTOPPING RISK ANALYSIS
4.1-Tools of Reliability Analysis The probabilistic approach of the design and the risk analysis of hydraulic structure are outlined in this section. The probabilistic design methods are well known but the application is unfortunately still limited to simple cases (some exceptions in Vrijling and Bruinsma, 1980), and to the design of codes. The application of the probabilistic
World Environmental and Water Resources Congress 2008 Ahupua'a © 2008 ASCE

5
design methods offers the designer a way to unify the design of structures, dikes, dunes, mechanical, equipment and management systems. For this reason, there is a growing interest in the use of these methods (Van Gelder 2000).
The tools available to the engineer for performing a reliability analysis fall into three broad categories. First are the methods of direct reliability analysis. These propagate the uncertainties in properties, geometries, loads, water levels, etc. through analytical models to obtain probabilistic descriptions of the behavior of a structure or system. The second includes event trees, fault trees, and influence diagrams, which describe the interaction among events and conditions in an engineering system. The third includes other statistical techniques. In particular, some problems are so poorly defined that it is useless to try to formulate mechanical models and the engineer must rely on simple statistics.
4.1.1-Limit state function
A model that discusses about failure of an engineering system can be described as the load S (external forces or demands) on the system exceeding the resistance R (strength, capacity, or supply) of the system, Eqn.7. (Vrijling et al, 1996, Schiereck, 2001):
1 2 1 2( ) ( , ,......., ) ( , ,........, )i ji r s i jZ x Strength Load R S R r r r S s s s= − = − = − (7)
The reliability Ps is described as the probability of safe operation, in which the resistance of the structure exceeds or equals to the load, that is,
( 0) ( )sP P Z P S R= ⟩ = ≤ (8)
In which Pf denotes the failure probability and can be computed as:
( 0) ( ) 1f sP P Z P S R P= ⟨ = ⟩ = − (9)
The definitions of reliability and failure probability, Eqn (8) and (9) are equally applicable to component, as well as the total system. In the reliability function, the strength and load variables are assumed to be stochastic variables. The graph of figure 8 shows the cumulative distribution function (CDF), probability density function (PDF) and Z=0 line of some hypothetical stochastic variables. The probability of failure can determined by solving the following integral:
1 2 1 2
0 0
( , ) .... ( , ,....., ) ....f RS RS n n
Z Z
P f r s drds f x x x dx dx dx⟨ ⟨
= =∫ ∫ ∫ ∫ ∫ (10)
4.1.2-First order reliability method (FORM)
If we know the means and the variances (the second moments) of the variables that enter into the evaluation of a function such as Z, we can estimate the mean and variance of Z using only first order terms in a Taylor expansion (Cornell 1969):
1 2( , ,......, )z xnx xZµ µ µ µ≈ (11)
World Environmental and Water Resources Congress 2008 Ahupua'a © 2008 ASCE

6
2
1 1
( ) ( ) cov( , )n n
z i ji j i j
Z ZX X
X Xµ µσ= =
∂ ∂≈∂ ∂∑∑ (12)
When the variables are correlated, a somewhat more complicated expression is used than when the variables are uncorrelated. When it is difficult to evaluate the partial derivatives directly, central divided partial differences usually provide sufficient accuracy. The first order second moment (FOSM) approach is based on using a linear and quadratic term in the Z function. (Hasofer and Lind 1974) proposed to resolve this difficulty by evaluating the derivatives at the critical point on the failure surface, known as the design point.
Finding this design point usually requires iteration, but the process tends to converge rapidly. If the variables are all normalized by dividing them by their respective standard deviations, the distance between the failure point and the point defined by their normalized means is the reliability index β. This method assumes normal distributions and can be modified to accommodate other distributions.
z
z
µβσ
= (13)
( )fP β= Φ − (14)
4.1.3-Monte Carlo Method
The Monte Carlo simulation method uses the possibility of drawing random numbers from a uniform probability density function between zero and one. Each continuous variable is replaced by a large number of discrete values generated from the underlying distribution; these values are used to compute a large number of values of the function Z and its distribution.
There are also several serious questions of convergence and of randomness in the generated variables. Several so-called variance reduction schemes can be effective in improving convergence and reducing computational effort. Fishman (1995) provides one of many treatments of the method. Monte Carlo simulation with variance reduction is particularly helpful in improving the accuracy of first order reliability method (FORM) results (Baecher and Christian 2003b).
4.1.4-Fault tree analysis
Fault tree, and influence diagrams are techniques for describing the logical interactions among a complex set of events, conditions. Formal calculation of the failure risk can be determined by incorporating the fault tree analysis (Henly and Kumamto 1981; Ang and Tang 1984; Yen and Tung 1993).
Fault trees (see Figure 9) start with an undesired top event. The fault tree contains the conditions that must be met for the failure to occur. For the hydraulic structure in this paper, the top event is inundation. There are four main intermediate events to lead to the top event: Geotechnical, Hydrological, Structural and Mechanical. The analyst develops the tree from top down, moving from condition to condition. In the usual formulation, the conditions at each stage are preferably independent and must encompass all the conditions that could lead to the next stage.
World Environmental and Water Resources Congress 2008 Ahupua'a © 2008 ASCE
7
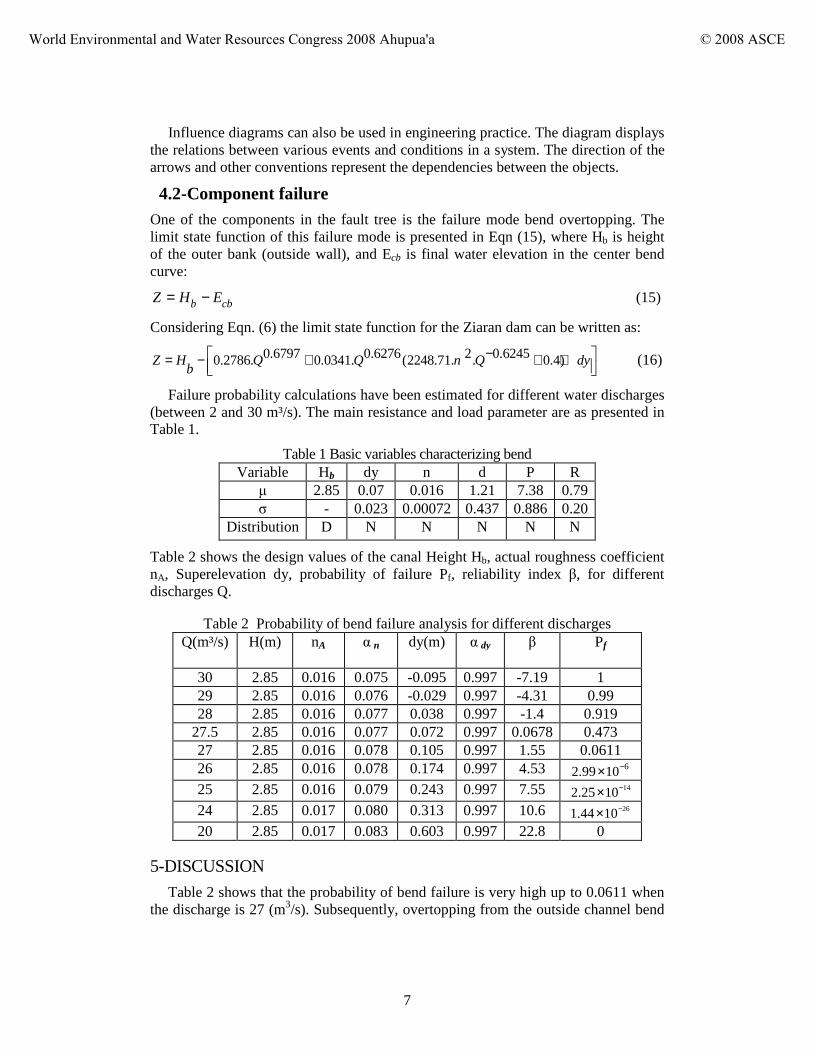
Influence diagrams can also be used in engineering practice. The diagram displays the relations between various events and conditions in a system. The direction of the arrows and other conventions represent the dependencies between the objects.
4.2-Component failure One of the components in the fault tree is the failure mode bend overtopping. The limit state function of this failure mode is presented in Eqn (15), where Hb is height of the outer bank (outside wall), and Ecb is final water elevation in the center bend curve:
b cbZ H E= − (15)
Considering Eqn. (6) the limit state function for the Ziaran dam can be written as:
0.6797 0.6276 2 0.62450.2786. 0.0341. (2248.71. . 0.4)Z H Q Q n Q dyb
−= − + + +
(16)
Failure probability calculations have been estimated for different water discharges (between 2 and 30 m³/s). The main resistance and load parameter are as presented in Table 1.
Table 1 Basic variables characterizing bend Variable Hb dy n d P R µ 2.85 0.07 0.016 1.21 7.38 0.79 σ - 0.023 0.00072 0.437 0.886 0.20
Distribution D N N N N N
Table 2 shows the design values of the canal Height Hb, actual roughness coefficient nA, Superelevation dy, probability of failure Pf, reliability index β, for different discharges Q.
Table 2 Probability of bend failure analysis for different discharges Q(m³/s) H(m) nA α n dy(m) α dy
β Pf
30 2.85 0.016 0.075 -0.095 0.997 -7.19 1 29 2.85 0.016 0.076 -0.029 0.997 -4.31 0.99 28 2.85 0.016 0.077 0.038 0.997 -1.4 0.919
27.5 2.85 0.016 0.077 0.072 0.997 0.0678 0.473 27 2.85 0.016 0.078 0.105 0.997 1.55 0.0611 26 2.85 0.016 0.078 0.174 0.997 4.53 62.99 10−× 25 2.85 0.016 0.079 0.243 0.997 7.55 142.25 10−× 24 2.85 0.017 0.080 0.313 0.997 10.6 261.44 10−× 20 2.85 0.017 0.083 0.603 0.997 22.8 0
5-DISCUSSION
Table 2 shows that the probability of bend failure is very high up to 0.0611 when the discharge is 27 (m3/s). Subsequently, overtopping from the outside channel bend
World Environmental and Water Resources Congress 2008 Ahupua'a © 2008 ASCE

8
will occur which accounts for erosion of the bank and undermining of the structure finally. The probability density function of Z and the probability of failure (Pf) are shown in Figure 11 and 12 for different discharges. In Fig. 12, the influence of the roughness coefficient (shown by the PDF’s in Fig. 10) on the failure probabilities can be observed, with a change of about 10%.
Variation of superelevation may be expressed in terms of discharge rate and is a function of V². Figure 13 shows the variations related to V² (data from Shams (1998)).
It is very important that any designer should keep the upstream flow characteristics in mind before designing a conveyance structure after the outlet works structure. It is required to take into full consideration that hydrodynamic turbulent pressure fluctuation is of great importance. Figure 14 shows variation of superelevation as a function of the Reynolds number Re in the bend.
Comparison between 5 models and field measurements is shown in Figure 15. It shows that the field measurements of superelevation show higher values than the prediction methods. The reason of this difference might be caused by secondary flow.
6-CONCLUSION
In this paper, we presented a probabilistic method for the analysis of superelevation in an open channel bend and estimated the probability of overtopping failure.
Presently, the presented case is witnessing that the existing theory cannot lead to exact results between the observations and the models. For some models, there is an underestimation in the superelevation of a factor 3. Probabilistic modelling can provide a formal approach to the analysis of the performance of hydraulic structures, taking all uncertainties in models, load- and strength variables into account.
The detailed reliability analysis in this paper has concentrated on one component in the failure tree (overtopping). Further analysis of the other components should be carried out in order to find the weak links of the hydraulic structure. The vulnerability of a hydraulic structure can then be improved by strengthening these weak elements.
The probability of failure study in this paper has demonstrated the need to improve the discharge capacity and the bank structure of the flume in the Ziaran dam.
Notation: The following symbols are used in this paper:
H: Total Energy d: Normal Water depth H0: Elevation bed channel E: Specific Energy V: Water Velocity α: Correction coefficient θ: Bed slop g: Gravity acceleration γ: Specific gravity P: Pressure
:h Water depth :r Radius of curved n: Manning coefficient B: Width channel Q: Discharge A: Flow Area P: Wetted parameter Hb: Height of the outer bank Ecb: Elevation water level centre bend df: Water level in flume Af : Area flume Rf: Hydraulic Radius
World Environmental and Water Resources Congress 2008 Ahupua'a © 2008 ASCE

9
Lf-cb : Distance between gage and centre bend Zf : Elevation bottom flume K1, K2 …,Ki: Friction coefficients λ: Algebraic parameter dy: Superelevation Z: Reliability Function Rri: Total Strength SSj: Total load Pf : Failure Probability µz : Mean Value σz : Standard division βZ: Reliability index f(x): Density Function F(x): Probability Distribution Re: Reynolds Number
Figure1.basic characteristic (Chow 1986) Figure 2.secondry Flow (Blanckart 2002a)
Figure 3.Flow Behavior at a channel Bend and Further downstream (Henderson 1966)
World Environmental and Water Resources Congress 2008 Ahupua'a © 2008 ASCE

10
Figure 4. Ziaran diversion dam
Figure 5. Profile of outlet works (Shams 1998)
World Environmental and Water Resources Congress 2008 Ahupua'a © 2008 ASCE

11
Figure 6. Section of bend (Vriend 1977) Figure7. Erosion in bend channel (Shams1998)
Figure 8. Probability distribution, probability density and reliability function
Figure 9. Fault tree for Bend Failure
World Environmental and Water Resources Congress 2008 Ahupua'a © 2008 ASCE

12
Figure 10. Pdf plots of roughness coefficient n
Figure 11. Pdf plots of Z for different discharges
Figure 12. Probability of failure of n as a function of discharge
Figure 13. Distribution of superelevation with Dynamics pressure
World Environmental and Water Resources Congress 2008 Ahupua'a © 2008 ASCE

13
Figure 14. Distribution of dimensionless between (dy/r) and Re [-]
Figure 15. Comparison of superelevation for five methods with actual measurements
REFERENCES Baecher, G. B., and Christian, J. T. (2003b). “Reliability and statistics in geotechnical engineering.” Wiley, Chichester, U.K.
Blanckaert, K. (2002a). “Secondary currents measured in sharp open-channel bends.” Proc., River Flow 2002, Louvain, Belgium.
Chow, V. T., (1986). “Open Channel Hydraulics.” McGraw-Hill, New York.
Christian, J. T., Ladd, C. C., and Baecher, G. B. (1994). “Reliability applied to slope stability analysis.” J. Geotech. Eng., 120(12), 2180–2207.
Cornell, C. A. (1969). “Structural safety specifications based on second moment reliability analysis.” Dept. of Civil Engineering, Massachusetts Institute of Technology, Cambridge, Mass.
Cornell, C. A. (1972). ‘‘First order analysis of model and parameter uncertainty.’’ Proc., Int. Symposium on Uncertainty in Hydrologic and Water Resource Systems, Univ. of Arizona, Tucson, Ariz., 2:1245– 1272.
Fishman, G. S. (1995). ‘‘Monte Carlo: Concepts, algorithms, and applications.” Springer, New York.
Gerrit J.Schiereck. (2001).‘‘Introduction to Bed and Shore Protection.” Delft University press, Delft, The Netherlands, section10, ISBN 90-407-1683-8.
World Environmental and Water Resources Congress 2008 Ahupua'a © 2008 ASCE

14
Hasofer, A. M., and Lind, N. (1974). “Exact and Invariant Second-Moment Code Format.” J. Eng. Mech., 100(1), 111–121.
Henderson. F.M.,(1966). “Open channels flow.” Prentice-Hall, New Jersy, chapter 7.
Henley, E. J., and Kumamoto, H. (1981). “Reliability engineering and risk assessment.” Prentice-Hall, Englewood Cliffs, N.J.
Marengo, H. (2006). “Case Study: Dam Safety during Construction, Lessons of the Overtopping Diversion Works at Aguadilla Dam.” J. Hydr. Eng, 132(11), ASCE, 1121-1127.
Reinauer, R., and Hager, W.H. (1997). “Supercritical Bend Flow.” J. Hydro. Eng, 123(3), ASCE, 208-218.
Shams, G.R. (1998). “Superelevation in open channel bends.” MS Thesis, Amir Kaber Univ., Tehran, Iran.
Tung, Y. K., and Mays, L. W. (1980). ‘‘Risk analysis for hydraulic design.’’ J. Hydr. Div., Am. Soc. Civil. Eng., 106(5), 93–913.
Van Gelder, P.H.A.J.M.(2000). ‘‘Statistical Methods for the Risk-Based Design of Civil Structures’’. PhD thesis, Delft Univ., The Netherlands, ISBN 90-9013452-3.
Vriend, H.J., (1977). “A mathematical model of steady flow in curved shallow channels.” J. Hydro. Res., IAHR, 15(1), 37-54.
Vrijling J.K. and Bruinsma J., (1980).“Hydraulic Boundary Conditions”. Proc., Int. Hydraulic Aspects of Coastal Structures; developments in hydraulic engineering related to the design of the Oosterschelde storm surge barrier in the Netherlands. Editors: A. Paape, J. Stuip, W.A.Venis, Delft Univ Press 1980, 109-133, ISBN 90-6275-0540.
Vrijling, J. K. et al., (1996). “Probability in Civil Engineering.” Publication of the faculty of the civil engineering, CT 4130, TU Delft, The Netherlands.
Vrijling, J. K. (2001). “Probabilistic design of water defense systems in the Netherlands.” Journal of Reliability Engineering &System Safety, 74(3), 337-344.
Yanqing, L. and Yen, B. C., (2003). ‘‘Comparison of risk Calculation Methods for a Culvert.' J. Hyd. Eng Houttuinen 26, 129(2), 140-152.
Yen, B. C., Cheng, S. T., and Tang, W. H. (1980). ‘‘Reliability of hydraulic design of culverts.’’ Proc., Int. Conf. Water Resources Development, IAHR Asian Pacific Div. 2nd Congress, Taipei, Taiwan, 2:991– 1001.
Yen, B. C., and Tung, Y. K. (1993). ‘‘Some recent progress in reliability analysis for hydraulic design.’’ Reliability and uncertainty analysis in hydraulic design, B. C. Yen and Y. K. Tung, eds., ASCE, Reston, VA., 35–79.
World Environmental and Water Resources Congress 2008 Ahupua'a © 2008 ASCE