Embed Size (px)
Citation preview
TRANSPORTATION RESEARCH RECORD 1303
Superelevation and Body Roll Effects on Offtracking of Large Trucks
WILLIAM D. GLAUZ AND DOUGLAS W. HARWOOD
Past research has shown that vehicles, especially large trucks, offtrack on curves and turns; at low speeds the rear axles track inside the front axle (negative offtracking), and at sufficiently high speeds the reverse is true. New research shows that typical amounts of superelevation tend to increase low-speed, negative offtracking of trucks by 10 to 20 percent. Superelevation also tends to reduce the amount of high-speed outward offtracking. The magnitude of the superelevation effect is independent of speed. The superelevation effect is greater with more heavily loaded trucks, trucks with newer tires, and trucks with larger roll steer coefficients. This research also shows that body roll affects both high-speed offtracking and the superelevation contribution to total offtracking. Trucks with softer suspensions are more affected. The net effect is to increase outward offtracking at normal and high speeds and to slightly increase negative offtracking at very low speeds.
When any vehicle makes a turn, its rear wheels do not follow the same path as its front wheels. The magnitude of this difference in paths, known as offtracking, generally increases with the spacing between the axles of the vehicle and decreases for larger-radius turns. Offtracking of passenger cars is minimal because they have relatively short wheelbases; however, many trucks offtrack substantially. The most appropriate descriptor of offtracking for use in highway design is the "swept path width," shown in Figure 1 as the difference in paths between the outside front tractor tire and the inside rear trailer tire.
The AASHTO Green Book (1,2) notes two distinct types of offtracking: low-speed and high-speed. Low-speed offtracking is a purely geometrical phenomenon wherein the rear axles of a truck track toward the inside of a horizontal curve, relative to the front axle. Figure 1 illustrates low-speed offtracking. Because considerable research has been performed concerning low-speed offtracking, as a function of truck and roadway geometrics, it is well understood on level surfaces. However, pavement cross-slope, including superelevation on horizontal curves, has an effect on low-speed offtracking that has not been documented in previous research.
High-speed offtracking, on the other hand, is a dynamic, speed-dependent phenomenon. It is caused by the tendency of the rear of the vehicle to move outward because of the lateral acceleration of the vehicle as it negotiates a horizontal curve at higher speeds. High-speed offtracking is less well understood than low-speed offtracking; it is a function not only of truck and roadway geometrics, but also of the vehicle speed and the vehicle's suspension, tire, and loading characteristics.
Midwest Research Institute, 425 Volker Blvd., Kansas City, Mo. 64110.
Current AASHTO criteria for intersection and channelization geometrics and for pavement widening on horizontal curves consider only low-speed offtracking. The design of intersection and channelization geometrics is properly a function only of low-speed offtracking, because truck operations at intersections usually occur at low speeds. Pavement crossslope effects on offtracking can generally be ignored in the design of intersection and channelization geometrics because normal pavement cross-slopes are small. Turning roadways at channelized intersections do not require much superelevation because operations there usually occur at low speeds. However, pavement widening at horizontal curves should consider both low-speed and high-speed offtracking, as well as superelevation effects.
LOW-SPEED OFFTRACKING WITHOUT SUPERELEVATION
Low-speed offtracking has been researched extensively and is considered in current AASHTO design criteria. An offtracking model for the Apple microcomputer was developed for FHW A in 1983 (3), and an IBM PC version of this model was subsequently developed ( 4). The user specifies the turning path to be followed by the front axles of the truck, and the models plot the path of the rear axle and other specified points on the truck. The Apple and IBM PC models provide plotted output but have no capability for numerical output. Recently the California Department of Transportation (Caltrans) enhanced the IBM PC version of the model to include numerical output of offtracking and swept path widths, as well as the turning plot (5). The Caltrans model runs on an IBM mainframe computer.
The Caltrans model was run as part of a recent study ( 6) to compare the offtracking performance of the design vehicles specified in Table 1. These vehicles are representative of those defined by the 1982 Surface Transportation Assistance Act (STAA). The offtracking performance of these vehicles was compared with those of a conventional tractor and 37-ft semitrailer (the AASHTO WB-50 design vehicle) and a conventional tractor and 45-ft semitrailer, the largest semitrailer in widespread use before the ST AA.
As a truck proceeds into a 90-degree turn, the amount of offtracking increases (see Figure 1). As the truck negotiates the turn, the amount of offtracking reaches a maximum and then gradually decreases as the truck proceeds in the new direction. Figure 2 shows this maximum offtracking for various values of turn radius and total turning angle for the WB-50 design vehicle. Maximum offtracking does not continue to

2
i ------- I Path of Outside Tractor Tire
---- / Path of Center of - ..... - f ...... _ Tractor's Front Axle -------------
Path of Center of ~ Trailer's Rear Axle
Path of Inside Trailer Tire
' ' '
FIGURE 1 Swept path width and offtracking of a truck negotiating 90-degree intersection turn.
increase with turn angle, but reaches a constant value (becomes fully developed) after some angle that depends on the radius. For the WB-50, for example, at a turn radius of 100 ft, offtracking reaches about 6.5 ft for an angle of 90 degrees and does not increase further at larger angles, as shown in Figure 2. The turn angle required to fully develop offtracking is greater for smaller radii, and may exceed 180 degrees for very small radii.
The amount of offtracking depends most significantly on the distance between the kingpin and the center of the rear axles, which is dimension D in Table 1. The data shown in Figure 2, and elsewhere in this paper unless specified otherwise, assume that the rear axles are placed at the rear of the
TRANSPORTATION RESEARCH RECORD 1303
trailer, as indicated in Table 1. Many longer trailers are designed to allow these axles to be moved forward to decrease the low-speed offtracking. In fact, it is common for users of 53-ft trailers to slide the axles forward 5 ft, so their offtracking is essentially the same as the ST AA single with a 48-ft trailer. Similar offtracking plots for the other design vehicles shown in Table 1 have been presented by Harwood et al. (6).
Swept path widths can be calculated directly by adding the effective truck width to the maximum offtracking values such as those shown in Figure 2. Because the Caltrans model calculates offtracking along the truck centerline and the swept path width is the difference in path between the front outside axle and the rear inside axle, the difference between offtracking and swept path width is one-half of the tractor axle width plus one-half of the rear trailer axle width. The front tractor axle is typically 6.66 ft wide, and the rear trailer axle is typically 8.5 ft wide, so half of their sum is 7 .58 ft.
The maximum offtracking for all of the design vehicles considered for selected combinations of turn radius and turn angle is compared in Table 2. The data show that for the single-trailer configurations, the amount of offtracking increases nearly linearly with trailer length. For 90-degree turns, the offtracking of a 53-ft trailer, with axles in the furthest rear position, is almost double that of the WB-50 configuration. The offtracking of doubles is much less than that of ST AA singles and is approximately the same as that of the WB-50.
MODEL FOR LOW-SPEED AND HIGH-SPEED OFFTRACKING INCLUDING SUPERELEV ATION EFFECTS
Various models and formulas have been developed to estimate offtracking by trucks in turns so that turning plots, like
TABLE 1 DETAILED AXLE SPACINGS FOR LONGER DESIGN VEHICLES
Design vehicle
Single-unit truck
Single-trailer truck with 37-ft trailer (WB-50)
Single-trailer truck with 45-ft trailer
STAA single with 48-ft trailer and conventional
tractor
STAA single with 48-ft trailer and long tractor
Long single with 53-ft trailer
STAA double with cab-over-engine tractor
STAA double with cab-behind-engine tractor
Note: Dimensions A through H are defined below.
Dimension (ft)
A B c D E F G H Overall length
4.0 20.0 6.0
2.5 18.0 0.0-2.0 30.0 4.0
2.5 18.0 0.0-2.0 37.5 4.5
2.5 18.0 0.0-2.0 40.5 4.5
2.5 20.0 0.0-2.0 40.5 4.5
2.5 18.0 0.0-2.0 45.5 4.5
2.5 10.0 0.0-2.0 22.5 2.5 6.0 22.5 2.5
2.5 13.0 0.0-2.0 22.5 2.5 6.0 22.5 2.5
30.0
52.5-54.5
60.5-62.5
63.5-65.5
65.5-67.5
68.5-70.5
66.5-68.5
69.5-71.5

G/auz and Harwood 3
Single 37-ft semilrailar with convenlional tractor (WB-50)
A B C D E 3.0 18.0 0::0 30,0 40
180
O b 8 ~ 000 MN "' 150 ' • • • ~~ ~
a; f-
120 o; "' ~ "' a. 90 c <(
E :J f-
60
30
TR= Turn Radius (ft)
3 5 6 10 11 12 13 14 15 16 17
Maximum Olliracking (ft)
FIGURE 2 Offtracking plot for single 37-ft semitrailer truck with conventional tractor (WB-50).
TABLE 2 OFFTRACKING FOR SELECTED COMBINATIONS OF TURN RADIUS AND TURN ANGLE
Maximum offtracking (ft)'
Turn radius (ft) 50 100 300
Turn angle: 60° go0 120° 60° goo 120° 60° go0 120°
Single with 37-ft trailer (WB-50) g,3 11.8 13.3 6.0 6.5 6.6 2.1 2.1 2.1
Single with 45-ft trailer 12.1 15.5 8 .0 g,o g,4 2.g 2.g 2.g
STM single with 48-ft trailer and conventional 13.0 16.9 8.8 10.0 10.5 3.3 3.3 3.3
tractor
STM single with 48-ft trailer and long tractor 13.4 17.4 9.1 10.4 10.8 3.4 3.4 3.4
Long single with 53-ft trailer 14.4 19.5 23.4 10.3 12.1 12.8 4.1 4.1 4.1
STM double with cab-over-engine tractor 9.2 11 .3 12.6 5.8 6.1 6.2 1.9 1.9 1.9
STM double with cab-behind-engine tractor 9.6 11 .9 13.4 6.0 6.4 6.4 2.1 2.1 2.1
• Add 7.58 ft to entries in this table to get maximum swept path width.
Figure 1, need not be developed for every application. An early example is the Western Highway Institute (WHI) offtracking formula (7). Low-speed offtracking develops gradually as a truck traverses a turn, as shown in Figures 1 and 2. The WHI formula estimates the magnitude of fully developed low-speed offtracking, that is, the maximum offtracking that will occur for a given radius of turn if the turn angle is large enough.
In 1981, Bernard and Vanderploeg developed an offtracking model that includes both the low-speed and high-speed contributions to offtracking ( 8) . However, their model applies only to vehicles on a level surface. The new model developed here extends the Bernard and Vanderploeg model by incorporating the added effect of superelevation on offtracking, as well as an explicit accounting for the roll of the truck body
on its suspension relative to the axles. Both the Bernard and Vanderploeg model and the new model give values for fully developed offtracking. On shorter curves, the actual offtracking may be Jess than the fully developed offtracking indicated by turning templates (e.g., Figure 1) or computer models such as the Caltrans model (5).
The new model for offtracking of a second axle or axle set (i.e. , tandem or triaxle), or hitch point , relative to a leading axle, and so forth, is
12 [ ~ (n.f /2) ] OT= - R O.S + n(l + tlf )
w2
[ 1 J 10 +- + S - -SI 0 R C.,g(l + ti/) C.,(1 + ti/) g
(1)
4
where
OT = fully developed offtracking (ft), where offtracking to the inside of the turn is treated as negative, by convention;
l = distance between the two consecutive axles or centerlines of axle sets or hitch points (ft);
R radius of curvature (ft); a; = distance from centerline of axle set to ith axle (ft)
(for single axles, a1 = O; for tandem axles, a1
a2 = 2 ft; for triaxles, a1 = a3 = 2 ft; a2 = O); n = number of axles in set (n = 1 for single axle, n
2 for tandem axle, n = 3 for triaxle); t = pneumatic trail (ft) [for typical values, see Fancher
et al. (9, p. 31)]; U = speed of vehicle (ft/sec); g = acceleration of gravity (ft/sec2) (equivalent to 32.2
ft/sec2 or 9.8 m/sec2);
c" = ratio of total cornering stiffness to total normal load (rad- 1
) (see Equation 2); S = roll steer angle (see Equation 3); and 0 = superelevation of curve (ft/ft).
All vehicle axle characteristics (a;, n, t, C", and S) refer to the second axle set. The ratio of the total cornering stiffness to total normal load is determined as
where
11( ,/ F,,.)( F,,)(n,) (57 .296) W,j
(2)
C" = cornering stiffness of tires (lb- 1 deg- 1) (Fancher et
al. (9, p. 29) indicate that C)F,, is in the range from 0.1 to 0.2 deg- 1];
F,, = rated load of tire (lb) [typical values are given by Fancher et al. (9, p. 27)];
n, = number of tires per axle (usually four); wa = load (weight) carried by the tires for the axle set (lb);
and f = fraction of wa supported by the suspension for the
axle set (WJis the sprung weight for the axle set).
The roll steer angle is determined as
S = MJsh k, - Mafgh
(3)
where
MJ = sprung mass supported by axle set (lb-sec2/ft) ( = Waf/g);
s = suspension roll steer coefficient (degrees of steer per degree of roll) lfor typical values, see Fancher et al. (9, p. 66)];
k, = composite roll stiffness for the axle set (ft-lb/rad) [for typical values, see Fancher et al. (9, p. 60); these values are given on a per-axle basis, so must be multiplied by n];
h = distance between load center of gravity and suspension roll center, hcG - hR6
hcG = height of center of gravity of load carried by the axle set (ft); and
TRANSPORTATION RESEARCH RECORD 1303
hRc = height of roll center of suspension system for the axle set (ft) [for typical values, see Fancher et al. (9, p. 65)].
Equation 1 consists of four terms. The first term represents the traditional low-speed offtracking, without superelevation. For a single axle (a; = 0), the first term reduces to
OT= - 0.512 R
-which is the WHI offtracking formula (7).
(4)
The second term in Equation 1 is the speed-dependent term and represents high-speed offtracking. The sign of the second term is positive, indicating that high-speed offtracking tends to offset the low-speed offtracking.
The third and fourth terms account for the effect of superelevation on offtracking. The third term represents the influence of the superelevation itself, and the fourth term is the contribution to offtracking of roll steer caused by the superelevation. The factor k, accounts for the roll of the truck body and affects the second and fourth terms of the equation.
Equation 1 provides the offtracking for one axle, axle set, or hitch point relative to the preceding axle, axle set, or hitch point. To determine the offtracking for the entire vehicle, Equation 1 is applied successively to each pair of consecutive axles and the results are combined. Thus,
Total OT = 2°: (X1)(0T) (5)
where
1 for an axle or axle set, -1 for a hitch point, and offtracking for axle, axle set, or hitch point determined from Equation 1.
The reason for the minus sign when the second "axle" is a hitch point is that it is normally located ahead of the axles it "follows," so all offsets are in the opposite direction to those given by the convention developed for Equation 1.
The derivation of this new offtracking model is presented in the next section. The following section examines the sensitivity of the offtracking model to typical ranges of the variables in Equations 1, 2, and 3.
DERIVATION OF OFFTRACKING MODEL
Several years ago, Bernard and Vanderploeg described the mathematics of offtracking, including both the commonly known low-speed offtracking and the less studied high-speed offtracking (8). They developed the basic equation of motion for a trailer as a function of the trailer characteristics and the motion of the hitch point. They then examined in detail the special case of most interest-the motion when the trailer is making a steady turn of radius R at speed U.
The present derivation follows that of Bernard and Vanderploeg, but is limited to the special case of constant R and U. However, it incorporates two added features. First, it explicitly includes the effects of superelevation. The superelevation directly reduces high-speed offtracking and interacts
Glauz and Harwood
with the roll steer behavior of the vehicle. Second, roll of the body of the trailer relative to the axles also contributes to roll steer. This derivation uses the basic nomenclature and derivation of Bernard and Vanderploeg, but with the noted changes. A fuller presentation has been given by Harwood et al. (6).
Figure 3 is a schematic of a trailer with its hitch point traveling at speed U on a circular path of radius R. The center of gravity of the trailer is a distance c from the hitch point, along the trailer centerline. From Figure 3, applying Newton's second law in the direction perpendicular to the trailer centerline gives
where
M = trailer mass, Ay = lateral acceleration, Hf = lateral force on the trailer at hinge point, and F,; = lateral force at the tires on axle i.
From Figure 4
(6)
(7)
where I; F,; is the horizontal component of the tire/pavement forces. The superelevation angle is 0. Also from Figure 4, summing forces in the vertical direction yields
L W; + L Ff; sin 0 (8) l ,·
0
R / "'( 1- --1
FIGURE 3 Forces and moments on trailer.
FIGURE 4 Tire/pavement forces with superelevation.
5
where W; is the portion of the trailer weight on the tires of axle i. Eliminating I; F,,; between Equations 7 and 8 yields
L F,; L Ffi cos 0 ;
(9)
Next, consider the sum of moments in the horizontal plane about the trailer CG:
l(f + .:Y) H/c) - L F,;(d;) + L M,; (10) I I
where
I = trailer moment of inertia about its CG, r = rotation rate of the velocity vector, V, and
'Y = angle between the trailer centerline and the velocity vector. (Note: 'Y and .:Y are the first and second time derivatives, respectively, of 'Y, and r is the time derivative of r.)
The side friction force, Ff;, and aligning moment, Mz;, are defined by Ffi = - C"',(o:;) and Mz; = K;(o:;), respectively. C"'' is the combined cornering stiffness for the tires on axle i, K; is the combined aligning moment for those tires, and o:; is the slip angle [angle between the direction of motion of the trailer (V) and the plane of the tire]. This can be shown to be (8)
(! + a1)(r 'Y) tan o:; = -tan O; - tan 'Y -
u co 'Y (11)
where O; is the steer angle of the axle (Figure 5) .
0
Plane of Tire
FIGURE 5 Slip and steer angles.
6
The lateral acceleration of the trailer CG is
AY = Ur cos 'Y - (f + 'Y)c (12)
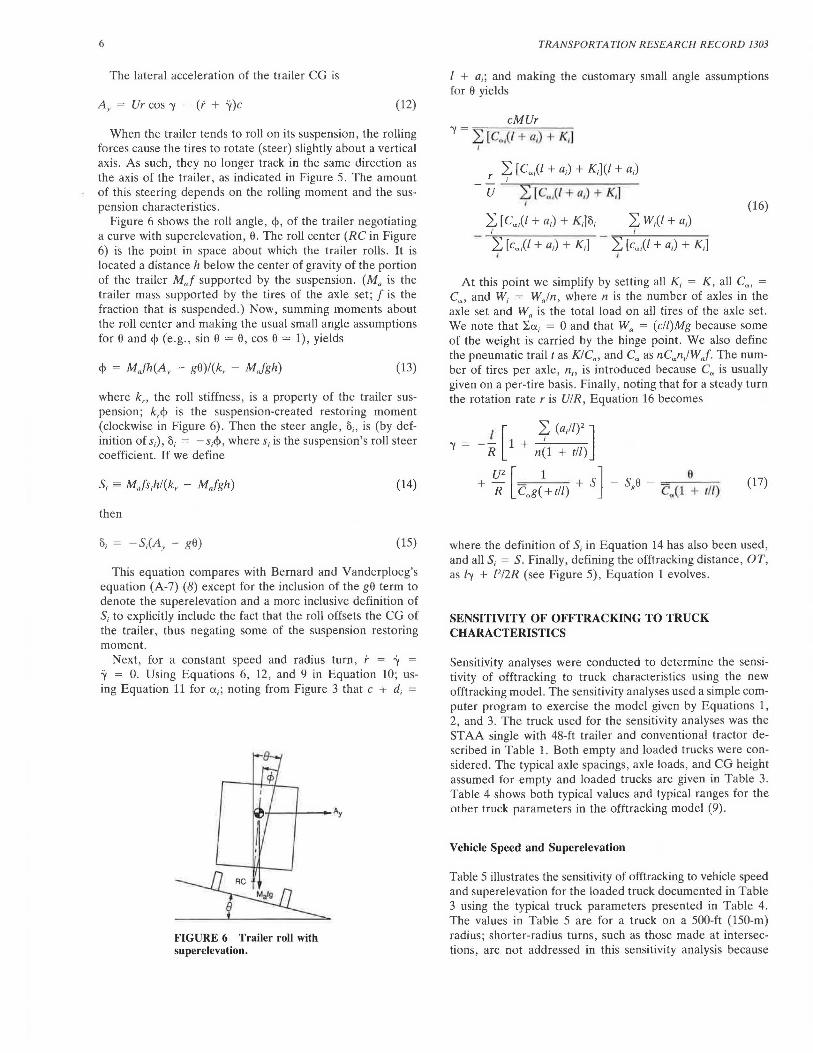
When the trailer tends to roll on its suspension, the rolling forces cause the tires to rotate (steer) slightly about a vertical axis. As such, they no longer track in the same direction as the axis of the trailer, as indicated in Figure 5. The amount of this steering depends on the rolling moment and the suspension characteristics.
Figure 6 shows the roll angle, cj>, of the trailer negotiating a curve with superelevation, 0. The roll center (RC in Figure 6) is the point in space about which the trailer rolls. It is located a distance h below the center of gravity of the portion of the trailer Mnf supported by the suspension. (M. is the trailer mass supported by the tires of the axle set; f is the fraction that is suspended .) Now, summing moments about the roll center and making the usual small angle assumptions for 0 and <f> (e.g., sin 0 = 0, cos 0 = 1), yields
cJ> = MJh(A y - g0)/(k, - MJgh) (13)
where kn the roll stiffness, is a property of the trailer suspension; k,cj> is the suspension-created restoring moment (clockwise in Figure 6). Then the steer angle, 8;, is (by definition of s;), 8; = -s;<f>, wheres; is the suspension's roll steer coefficient. If we define
S; = MJs;hl(k, - MJgh) (14)
then
1\ = -S;(Ay - g0) (15)
This equation compares with Bernard and Vanderploeg's equation (A-7) (8) except for the inclusion of the g0 term to denote the superelevation and a more inclusive definition of S; to explicitly include the fact that the roll offsets the CG of the trailer, thus negating some of the suspension restoring moment.
Next, for a constant speed and radius turn, r = 'Y = 'Y = 0. Using Equations 6, 12, and 9 in Equation 10; using Equation 11 for a;; noting from Figure 3 that c + d; =
FIGURE 6 Trailer roll with superelevation.
TRANSPORTATION RESEARCH RECORD 1303
I + a;; and making the customary small angle assumptions for 0 yields
cMUr
2:: [ C,Jl +a;) + K;](l + a;) r ; U - .... 2:,_[-C,..-,(-l -+-a1-) -+-K-1]-
1 (16) 2:: [Ca;(/ + a;) + K;]8; 2:: W;(l + a;)
I ....,.--'-'------ 2: [ca;(/+ a;) + K;] - 2: [ca;(/+ a;)+ K;] r I
At this point we simplify by setting all K; = K, all Ca; Ca, and W; = W,Jn, where n is the number of axles in the axle set and W" is the total load on all tires of the axle set. We note that ~a; = 0 and that W" = (c/l)Mg because some of the weight is carried by the hinge point. We also define the pneumatic trail t as K!C", and Ca as nCanJW J. The number of tires per axle, n,, is introduced because ca is usually given on a per-tire basis. Finally, noting that for a steady turn the rotation rate r is UI R, Equation 16 becomes
I [ 2:: (a;l/)2 ] 1 + -'---
R n(l + t!l)
+ ~2
[ Cag/+ t!l) + SJ - SgO - Ctt(l 8+ ti/) (17)
where the definition of S; in Equation 14 has also been used, and all S; = S. Finally, defining the offtracking distance, OT, as /-y + l2/2R (see Figure 5), Equation 1 evolves .
SENSITIVITY OF OFFTRACKING TO TRUCK CHARACTERISTICS
Sensitivity analyses were conducted to determine the sensitivity of offtracking to truck characteristics using the new offtracking model. The sensitivity analyses used a simple computer program to exercise the model given by Equations 1, 2, and 3. The truck used for the sensitivity analyses was the STAA single with 48-ft trailer and conventional tractor described in Table 1. Both empty and loaded trucks were considered. The typical axle spacings, axle loads, and CG height assumed for empty and loaded trucks are given in Table 3. Table 4 shows both typical values and typical ranges for the other truck parameters in the offtracking model (9) .
Vehicle Speed and Superelevation
Table 5 illustrates the sensitivity of offtracking to vehicle speed and superelevation for the loaded truck documented in Table 3 using the typical truck parameters presented in Table 4. The values in Table 5 are for a truck on a 500-ft (150-m) radius; shorter-radius turns, such as those made at intersections, are not addressed in this sensitivity analysis because
Glauz and Harwood 7
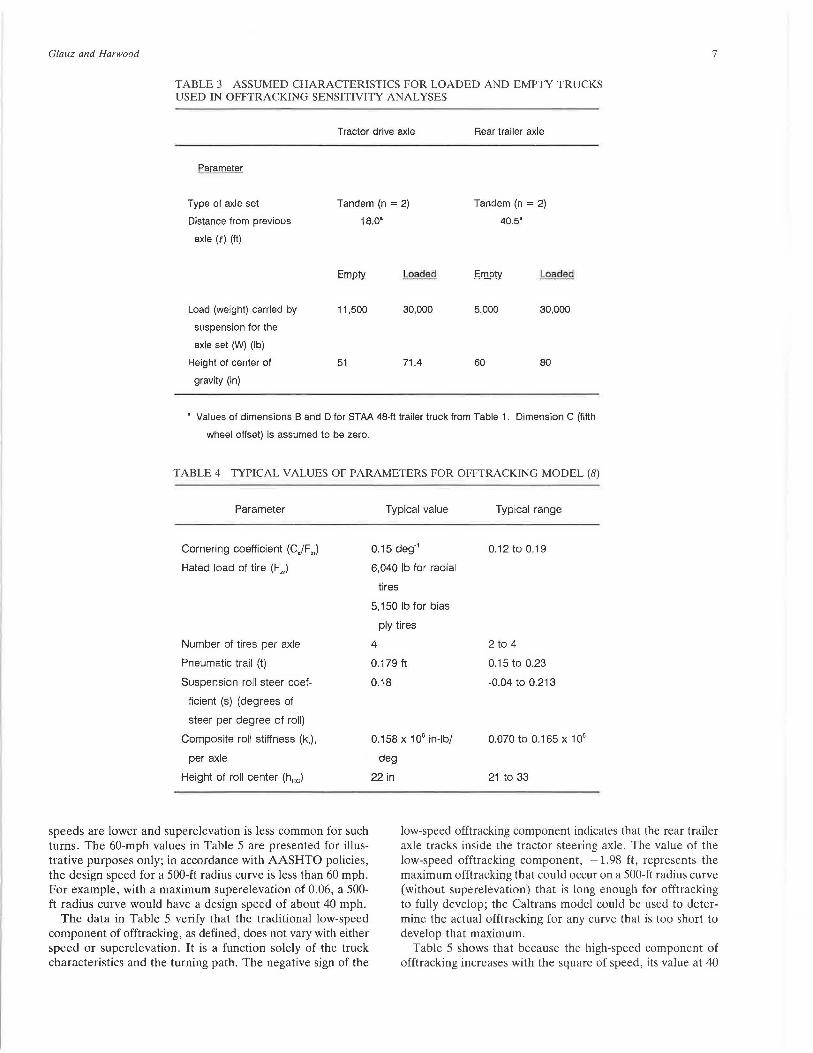
TABLE 3 ASSUMED CHARACTERISTICS FOR LOADED AND EMPTY TRUCKS USED IN OFFTRACKING SENSITIVITY ANALYSES
Tractor drive axle Rear trailer axle
Parameter
Type of axle set Tandem (n = 2) Tandem (n = 2)
Distance from previous 18.0" 40.5"
axle (e) (ft)
~ Loaded ~ Loaded
Load (weight) carried by 11,500 30,000 5,000 30,000
suspension for the
axle set (W) (lb)
Height of center of 51 71.4 60 80
gravity (in)
• Values of dimensions Band D for STAA 48-ft trailer truck from Table 1. Dimension C (fifth
wheel offset) is assumed to be zero.
TABLE 4 TYPICAL VALUES OF PARAMETERS FOR OFFTRACKING MODEL (8)
Parameter
Cornering coefficient (C./F,,)
Rated load of tire (F,,)
Number of tires per axle
Pneumatic trail (t)
Suspension roll steer coef-
ficient (s) (degrees of
steer per degree of roll)
Composite roll stiffness (k,),
per axle
Height of roll center (h"cl
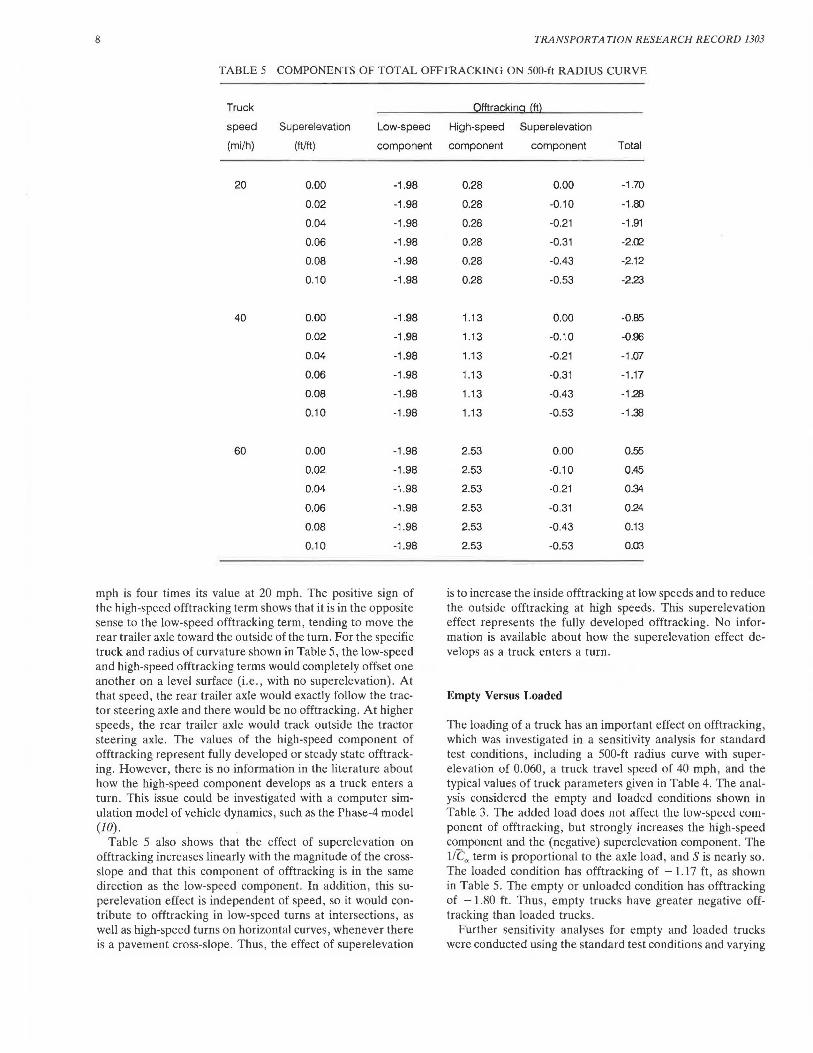
speeds are lower and superelevation is less common for such turns. The 60-mph values in Table 5 are presented for illustrative purposes only; in accordance with AASHTO policies, the design speed for a 500-ft radius curve is less than 60 mph. For example, with a maximum superelevation of 0.06, a 500-ft radius curve would have a design speed of about 40 mph.
The data in Table 5 verify that the traditional low-speed component of offtracking, as defined, does not vary with either speed or superelevation. It is a function solely of the truck characteristics and the turning path. The negative sign of the
Typical value
0.15 deg·'
6,040 lb for radial
tires
5, 150 lb for bias
ply tires
4
0.179 ft
0.18
0.158 x 10⁶ in-lb/
deg
22 in
Typical range
0.12 to 0.19
2 to 4
0.15 to 0.23
-0.04 to 0.213
0.070 to 0.165 x 10⁶
21 to 33
low-speed offtracking component indicates that the rear trailer axle tracks inside the tractor steering axle. The value of the low-speed offtracking component, -1.98 ft, represents the maximum offtracking that could occur on a 500-ft radius curve (without superelevation) that is long enough for offtracking to fully develop; the Caltrans model could be used to determine the actual offtracking for any curve that is too short to develop that maximum.
Table 5 shows that because the high-speed component of offtracking increases with the square of speed, its value at 40
8 TRANSPORTATION RESEARCH RECORD 1303
TABLE 5 COMPONENTS OF TOT AL OFFTRACKING ON 500-ft RADIUS CURVE
Truck
speed Superelevation Low-speed
(mi/h) (ft/ft) component
20 0.00 -1.98
0.02 -1 .98
0.04 -1.98
0.06 -1 .98
0.08 -1.98
0.10 -1.98
40 0.00 -1 .98
0.02 -1.98
0.04 -1 .98
0.06 -1.98
0.08 -1 .98
0.10 -1.98
60 0.00 -1.98
0.02 -1 .98
0.04 -1 .98
0.06 -1 .98
0.08 -1 .98
0.10 -1 .98
mph is four times its value at 20 mph. The positive sign of the high-speed offtrncking term shows that it is in the opposite sense to the low-speed offtracking term, tending to move the rear trailer axle toward the outside of the turn. For the specific truck and radius of curvature shown in Table 5, the low-speed and high-speed offtracking terms would completely offset one another on a level surface (i.e., with no superelevation). At that speed, the rear trailer axle would exactly follow the tractor steering axle and there would be no offtracking. At higher speeds , the rear trailer axle would track outside the tractor steering axle. The values of the high-speed component of offtracking represent fully developed or steady state offtracking. However, there is no information in the literature about how the high-speed component develops as a truck enters a turn. This issue could be investigated with a computer simulation model of vehicle dynamics, such as the Phase-4 model (10).
Table 5 also shows that the effect of superelevation on offtracking increases linearly with the magnitude of the crossslope and that this component of offtracking is in the same direction as the low-speed component. In addition , this superelevation effect is independent of speed, so it would contribute to offtracking in low-speed turns at intersections, as well as high-speed turns on horizontal curves, whenever there is a pavement cross-slope. Thus, the effect of superelevation
Offtracking (ft)
High-speed Superelevation
component component Total
0.28 0.00 -1.70
0.28 -0.10 -1.00
0.28 -0.21 -1.91
0.28 -0.31 -2.02
0.28 -0.43 -2.12
0.28 -0.53 -2.23
1.13 0.00 -0.85
1.13 -0.10 -0.96
1.13 -0.21 -1.07
1.13 -0.31 -1.17
1.13 -0.43 -1.28
1.13 -0.53 -1.38
2.53 0.00 0.55
2.53 -0.10 0.45
2.53 -0.21 0.34
2.53 -0.31 0.24
2.53 -0.43 0.13
2.53 -0.53 O.D3
is to increase the inside offtracking at low speeds and to reduce the outside offtracking at high speeds. This superelevation effect represents the fully developed offtracking. No information is available about how the superelevation effect develops as a truck enters a turn.
Empty Versus Loaded
The loading of a truck has an important effect on offtracking, which was investigated in a sensitivity analysis for standard test conditions, including a 500-ft radius curve with superelevation of 0.060, a truck travel speed of 40 mph, and the typical values of truck parameters given in Table 4. The analysis considered the empty and loaded conditions shown in Table 3. The added load does not affect the low-spt:t:U t:umponent of offtracking, but strongly increases the high-speed component and the (negative) superelevation component. The l/C,, term is proportional to the axle load, and Sis nearly so. The loaded condition has offtracking of -1.17 ft , as shown in Table 5. The empty or unloaded condition has offtracking of -1.80 ft. Thus , empty trucks have greater negative offtracking than loaded trucks .
Further sensitivity analyses for empty and loaded trucks were conducted using the standard test conditions and varying
G/auz and Harwood
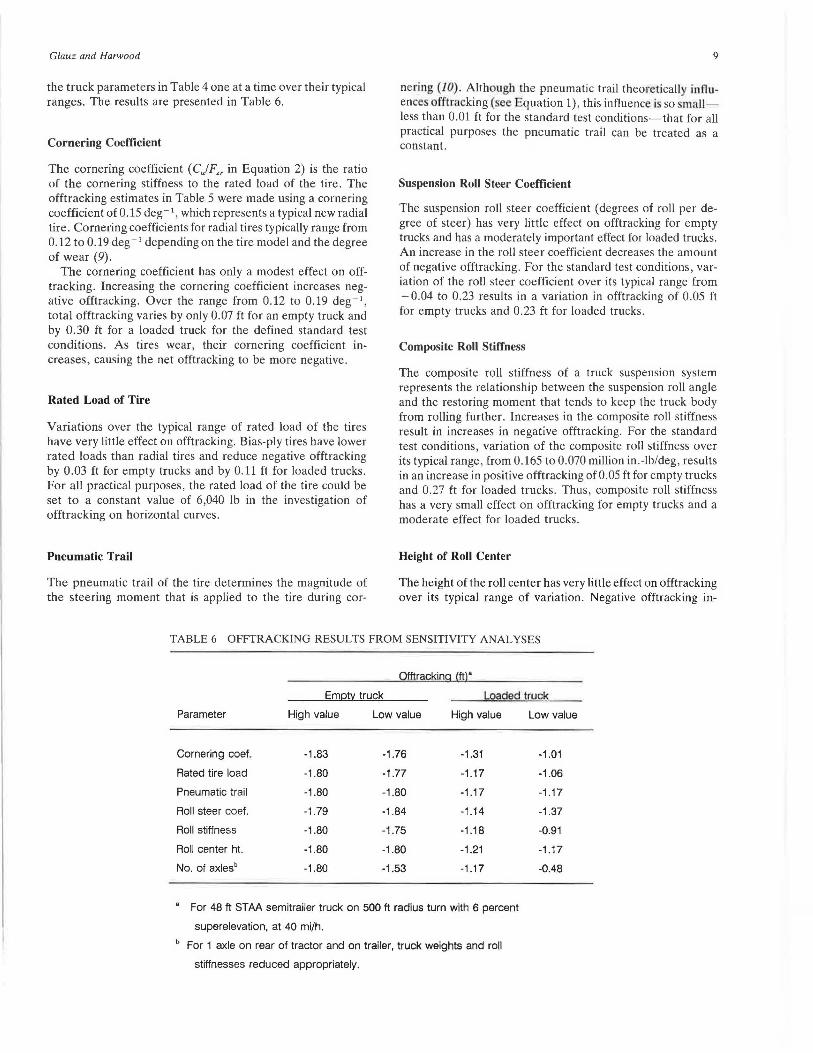
the truck parameters in Table 4 one at a time over their typical ranges. The results are presented in Table 6.
Cornering Coefficient
The cornering coefficient ( C) F,, in Equation 2) is the ratio of the cornering stiffness to the rated load of the tire . The offtracking estimates in Table 5 were made using a cornering coefficient of 0.15 deg- 1 , which represents a typical new radial tire. Cornering coefficients for radial tires typically range from 0.12 to 0.19 deg - 1 depending on the tire model and the degree of wear (9).
The cornering coefficient has only a modest effect on offtracking. Increasing the cornering coefficient increases negative offtracking. Over the range from 0.12 to 0.19 deg- 1,
total offtracking varies by only 0.07 ft for an empty truck and by 0.30 ft for a loaded truck for the defined standard test conditions. As tires wear, their cornering coefficient mcreases, causing the net offtracking to be more negative.
Rated Load of Tire
Variations over the typical range of rated load of the tires have very little effect on offtracking. Bias-ply tires have lower rated loads than radial tires and reduce negative offtracking by 0.03 ft for empty trucks and by 0.11 ft for loaded trucks. For all practical purposes, the rated load of the tire could be set to a constant value of 6,040 lb in the investigation of offtracking on horizontal curves.
Pneumatic Trail
The pneumatic trail of the tire determines the magnitude of the steering moment that is applied to the tire during cor-
9
nering (JO). Although the pneumatic trail theoretically influences offtracking ( ec Equation 1), this influence is so mallless than 0.01 ft for the standard test conditions-that for all practical purposes the pneumatic trail can be treated as a constant.
Suspension Roll Steer Coefficient
The suspension roll steer coefficient (degrees of roll per degree of steer) has very little effect on offtracking for empty trucks and has a moderately important effect for loaded trucks. An increase in the roll steer coefficient decreases the amount of negative offtracking. For the standard test conditions, variation of the roll steer coefficient over its typical range from - 0.04 to 0.23 results in a variation in offtracking of 0.05 ft for empty trucks and 0.23 ft for loaded trucks.
Composite Roll Stiffness
The composite roll stiffness of a truck suspension system represents the relationship between the suspension roll angle and the restoring moment that tends to keep the truck body from rolling further. Increases in the composite roll stiffness result in increases in negative offtracking. For the standard test conditions, variation of the composite roll stiffness over its typical range, from 0.165 to 0.070 million in .-lb/deg, results in an increase in positive offtracking of0.05 ft for empty trucks and 0.27 ft for loaded trucks. Thus, composite roll stiffness has a very small effect on offtracking for empty trucks and a moderate effect for loaded trucks .
Height of Roll Center
The height of the roll center has very little effect on offtracking over its typical range of variation. Negative offtracking in-
TABLE 6 OFFTRACKING RESULTS FROM SENSITIVITY ANALYSES
Offtracking (ft)"
Emgty truck Loaded truck
Parameter High value Low value High value
Cornering coef. -1.83 -1.76 -1.31
Rated tire load -1.80 -1.77 -1.17
Pneumatic trail -1.80 -1.80 -1 .17
Roll steer coef. -1.79 -1.84 -1.14
Roll stiffness -1.80 -1.75 -1.18
Roll center ht. -1.80 -1.80 -1.21
No. of axlesb -1.80 -1.53 -1.17
• For 48 ft STAA semitrailer truck on 500 ft radius turn with 6 percent
superelevation, at 40 mi/h.
b For 1 axle on rear of tractor and on trailer, truck weights and roll
stiffnesses reduced appropriately.
Low value
-1.01
-1.06
-1.17
-1.37
-0.91
-1.17
-0.48

10
creases as the roll center is raised. For the standard test conditions, variation in the height of the roll center from 21 to 33 in. changes offtracking by less than 0.01 ft for empty trucks and by 0.04 ft for loaded trucks. For all practical purposes , the height of the roll center can be set as a constant at its typical value of 22 in.
Number of Axles
The effect on offtracking of n, the number of axles, can be realistically addressed only by varying several related parameters. If the tractor and trailer have only one rear axle instead of two, the supported weight must be reduced in accordance with rated tire load and bridge-formula axle loads . The analysis used a maximum load of 20,000 lb on these axles. Also, the roll stiffness is generally much Jess for a single-axle suspension; 0.070 x 106 in.-lb/deg was used.
As shown in Table 6, the single-axle drive and trailer combination has significantly less negative offtracking than the tandem axle combination. This is primarily because the highspeed component is greater for the single-axle combination. This truck type will thus generate positive (outside) offtracking at lower speeds than tandem axle combinations.
CONCLUSIONS
The offtracking of vehicles, especially large trucks, is noticeably affected by the superelevation of the curve that the vehicle is traversing. This effect is proportional to the amount of superelevation and is independent of the vehicle speed.
At low speeds, the vehicle offtracking to the inside of the curve is made larger by the presence of superelevation. For a tractor with a 48-ft trailer, the low-speed offtracking on a 500-ft radius turn is increased by 20 percent with a superelevation of 8 percent. At high speed, where a truck might exhibit offtracking to the outside of the curve, the amount of offtracking is reduced or even canceled in the presence of superelevation.
The superelevation effect is dependent on the weight of the truck , the tire cornering coefficient, and the roll steer coefficient . Superelevation influences loaded trucks more than empty trucks; the effect is nearly proportional to the truck weight. The offtracking of trucks with worn tires, which have larger cornering coefficients, is Jess influenced by superelevation, especially at higher weights . Trucks with larger roll steer coefficients are more influenced by superelevation, although the effect is less than the opposite , high-speed effect, which is also a function of the roll steer coefficient.
A truck's suspension allows the truck body to roll toward the outside of the curve, relative to the axles. This body roll increases the high-speed offtracking. The amount of the increase depends on the stiffness of the suspension, being greater with softer suspensions, heavier loads, and larger roll steer coefficients. This body roll also increases (negatively) the
TRANSPORTATION RESEARCH RECORD 1303
amount of superelevation-related offtracking, although this effect is not as large as the high-speed effect. For a tractor with a 48-ft trailer traveling at 40 mph on a 500-ft radius turn with a 6 percent superelevation, the net effect on offtracking can be as much as + 0.27 ft for a realistically rigid suspension.
Finally, it was found that lighter tractor-semitrailers, with only a single drive axle and trailer axle, are more subject to high-speed offtracking than heavier trucks when both are loaded close to their capacities.
ACKNOWLEDGMENTS
The work reported in this paper was conducted under the sponsorship of FHWA. The authors gratefully acknowledge the assistance provided by the California Department of Transportation in applying their offtracking model to the design vehicles presented in this paper, and the review and comments provided by Andrew D . St. John .
REFERENCES
1. A Policy on Geometric Design for Highways and Streets. AASHTO, Washington, D.C., 1984.
2. A Policy on Geomelric Design for Highways and Streets. AASHTO, Washington, D.C., 1990.
3. M. Sayers. FHWA/UMTRI Vehicle Of/tracking Model and Computer Simula/ion-User's Guide, Version 1.00. University of Michigan Transportation Research Institute, Ann Arbor, June 1984.
4. Analysis Group, Inc. FHWA Vehicle Of/tracking Model-IBM PC Version 1.0: Program Documentation and User's Guide. FHWA, U.S . Department of Transportation, July 20, 1986.
5. Truck Off/racking Model, Program Documentation and User's Guide. Division of Transportation Planning, California Department of Transportation, Sacramento, 1985.
6. D. W. Harwood, J.M. Mason, W. D. Glauz, B. T. Kulakowski, and K. Fitzpatrick. Truck Characleristics for Use in Highway Design and Operation. Reports FHWA-RD-89-226 and -227, FHWA, U.S. Deparlmenl of Trauspurtation, Dec. 1989.
7. Of/tracking Characteristics of Trucks and Truck Combinations. Research Committee Report No. 3. Western Highway Institute, San Bruno , Calif., Feb. 1970.
8. J. E. Bernard and M. Vanderploeg. Static and Dynamic Off/racking of Articulated Vehicles. Paper 800151. SAE, Warrendale, Pa. , 1981.
9. P. S. Fancher, R. D. Ervin, C. B. Winkler, and T. D. Gillespie. A Factbook of the Mechanical Properties of the Components of Single Unit and Articulated Heavy Vehicles. Report DOT HS 807 125. NHTSA, U.S. Department of Transportation, Dec. 1986.
10. C. C. MacAdam, P. S. Fancher, G. T. Hu, and T. D. Gillespie. A Compulerized Dynamics Model of Trucks, Tractor SemiTrailers, Doubles, and Triples Combinations. Report UM-HSRI-80-58. Highway Safety Research Institute, University of Michigan, Ann Arbor, Sept. 1980.
The findings and conclusions in !he paper are those of the authors and do not necessarily represent the views of FHWA .
Publicalion of this paper sponsored by Commillee on Operational Effects of Geometrics.