Embed Size (px)
Citation preview

Supercritical CO2 Brayton cycles for solar-thermal energy
Brian D. Iverson a,b,!, Thomas M. Conboy b, James J. Pasch b, Alan M. Kruizenga b
a Brigham Young University, UT 84602, United Statesb Sandia National Laboratories, Albuquerque, NM 87185, United States
h i g h l i g h t s
! Modeling and experimental data are presented and compared.! Results include transient response of a sCO2 Brayton to reduced thermal input.! Benchmarking data for steady state operation is tabulated.! Areas of necessary research for successful implementation of sCO2 Brayton.
a r t i c l e i n f o
Article history:Received 6 March 2013Received in revised form 9 June 2013Accepted 11 June 2013
Keywords:Supercritical CO2
BraytonSolar-thermalConcentrating solar powerEnergy
a b s t r a c t
Of the mechanisms to improve efficiency for solar-thermal power plants, one of the most effective waysto improve overall efficiency is through power cycle improvements. As increases in operating tempera-ture continue to be pursued, supercritical CO2 Brayton cycles begin to look more attractive despite thedevelopment costs of this technology. Further, supercritical CO2 Brayton has application in many areasof power generation beyond that for solar energy alone.
One challenge particular to solar-thermal power generation is the transient nature of the solarresource. This work illustrates the behavior of developmental Brayton turbomachinery in response to afluctuating thermal input, much like the short-term transients experienced in solar environments. Ther-mal input to the cycle was cut by 50% and 100% for short durations while the system power and condi-tions were monitored. It has been shown that despite these fluctuations, the thermal mass in the systemeffectively enables the Brayton cycle to continue to run for short periods until the thermal input canrecover. For systems where significant thermal energy storage is included in the plant design, these tran-sients can be mitigated by storage; a comparison of short- and long-term storage approaches on systemefficiency is provided. Also, included in this work is a data set for stable supercritical CO2 Brayton cycleoperation that is used to benchmark computer modeling. With a benchmarked model, specific improve-ments to the cycle are interrogated to identify the resulting impact on cycle efficiency and loss mecha-nisms. Status of key issues remaining to be addressed for adoption of supercritical CO2 Brayton cyclesin solar-thermal systems is provided in an effort to expose areas of necessary research.
! 2013 Elsevier Ltd. All rights reserved.
1. Introduction
It is recognized that solar-thermal energy can play a useful rolein generating electrical power despite concerns regarding cost, asthe thermal source is accessible and ubiquitous. One platform toproduce power from a solar resource is using the point-focus,power-tower system in which the solar-thermal energy is concen-trated thereby elevating the working temperature and associatedefficiencies. Solar assisted power production to offset carbon emis-sions [1] and thermal storage for grid stability [2–4] remain strongmotives for utilizing this approach. Cost-reduction efforts havebeen implemented to improve solar-thermal power production[5] with more aggressive efforts being supported by the U.S.
Department of Energy [6]. High-efficiency power cycles is a criticalcomponent in achieving the cost reduction goals and may requiretemperatures that reach above 600 "C to obtain cycle efficienciesin the 50% range.
The supercritical carbon dioxide (sCO2) Brayton cycle hasemerged as a promising avenue for high-efficiency power produc-tion. With growing interest in renewable energy sources, cycleswith high efficiency are critical to achieving cost-parity withnon-renewable sources. Convergence on sCO2 Brayton isoccurring from the nuclear [7–9] and geothermal [10] fronts, inaddition to solar-thermal [11–13]. Turbomachinery for sCO2
Brayton is in the development phase [14–19] and is gainingmomentum as interest grows and technical risks are reduced.However, adaptation of the cycle to interface with various heatsources will be imperative for its adoption as an industry-manufactured technology.
0306-2619/$ - see front matter ! 2013 Elsevier Ltd. All rights reserved.http://dx.doi.org/10.1016/j.apenergy.2013.06.020
! Corresponding author at: Brigham Young University, UT 84602, United States.E-mail address: [email protected] (B.D. Iverson).
Applied Energy 111 (2013) 957–970
Contents lists available at SciVerse ScienceDirect
Applied Energy
journal homepage: www.elsevier .com/locate /apenergy
Over the past decade, there has been a significant amount of re-search on sCO2 power cycles and heat transfer. Turbine and com-pressor performance characterization and prototype systemtesting has been a primary focus at Sandia National Laboratories(SNL) within the Advanced Nuclear Concepts group [17–23]. Sys-tem control and transient analysis on sCO2 has been a large focusat Argonne National Laboratory (ANL), specifically for Lead FastReactors (LFRs) and sodium-cooled reactors [24–29]. Various cycleconfigurations have been investigated for specific reactor designs[8,9,30–33]. Echogen has considered sCO2 cycles for waste heatrecovery, utilizing smaller power systems [34] and views sCO2 asa valid competitor to steam technology [35]. While some workhas been done pertaining specifically to solar applications, theliterature for sCO2 is introductory by comparison [11,36]. TheSouthwest Research Institute is also active in enabling sCO2 for so-lar energy and is pursuing turbo-expander and heat exchangerdevelopment for this purpose [37].
Interfacing the solar resource with a sCO2 Brayton cycle re-quires a receiver to absorb the solar-thermal energy from the inci-dent concentrated flux and transfer the energy to a transportmedia. The transport media in the receiver can either be the sameas the power cycle working fluid (direct receiver) or employ asecondary media, either fluid or solid, that would experience heatexchange with the power cycle working fluid (indirect receiver).A direct receiver approach can leave the power cycle exposed topotential issues with a transient heat source whereas an indirectapproach provides a buffer from transients.
This paper demonstrates the response of a prototype sCO2 Bray-ton cycle under transient operating conditions similar to that expe-rienced in a typical solar plant with a direct receiver. While theoperating conditions of temperature and pressure for the experi-ments are lower than that desired for high-efficiency operation,this data serves to validate modeling efforts that can be used toevaluate higher-temperature systems. A discussion of primarymechanical and thermal losses is provided as well as areas ofadvancement required for adoption of sCO2 Brayton turbomachin-ery for solar applications.
2. Experimental loop
2.1. Layout
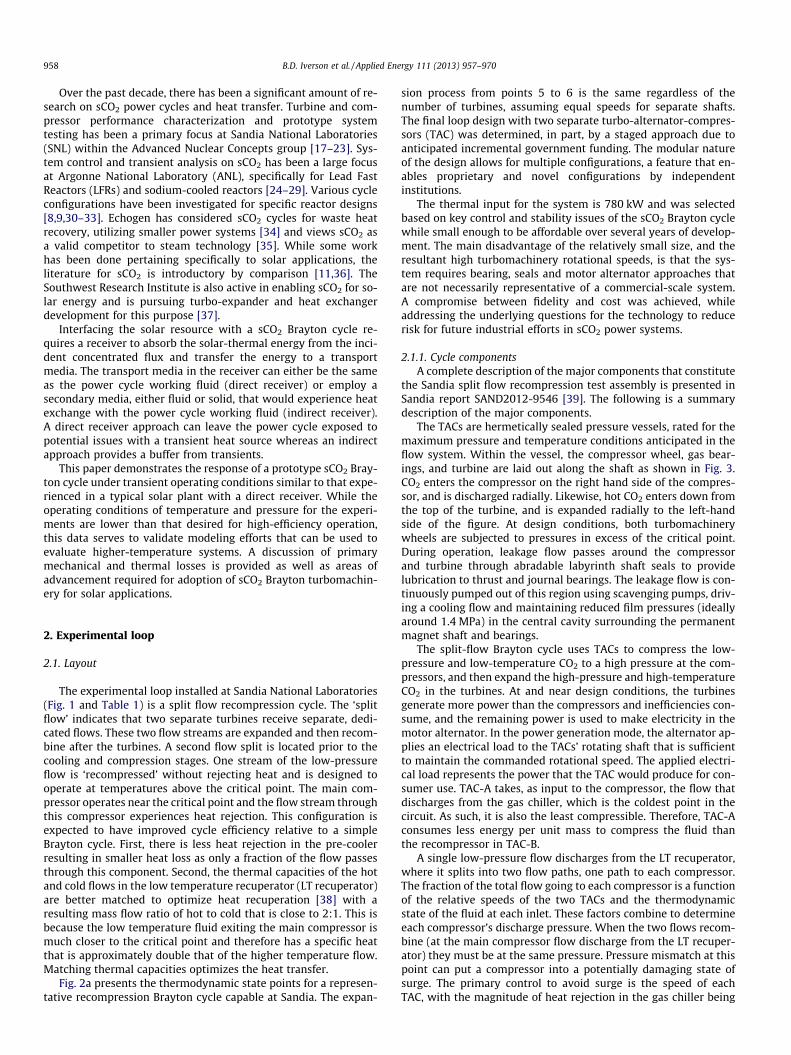
The experimental loop installed at Sandia National Laboratories(Fig. 1 and Table 1) is a split flow recompression cycle. The ‘splitflow’ indicates that two separate turbines receive separate, dedi-cated flows. These two flow streams are expanded and then recom-bine after the turbines. A second flow split is located prior to thecooling and compression stages. One stream of the low-pressureflow is ‘recompressed’ without rejecting heat and is designed tooperate at temperatures above the critical point. The main com-pressor operates near the critical point and the flow stream throughthis compressor experiences heat rejection. This configuration isexpected to have improved cycle efficiency relative to a simpleBrayton cycle. First, there is less heat rejection in the pre-coolerresulting in smaller heat loss as only a fraction of the flow passesthrough this component. Second, the thermal capacities of the hotand cold flows in the low temperature recuperator (LT recuperator)are better matched to optimize heat recuperation [38] with aresulting mass flow ratio of hot to cold that is close to 2:1. This isbecause the low temperature fluid exiting the main compressor ismuch closer to the critical point and therefore has a specific heatthat is approximately double that of the higher temperature flow.Matching thermal capacities optimizes the heat transfer.
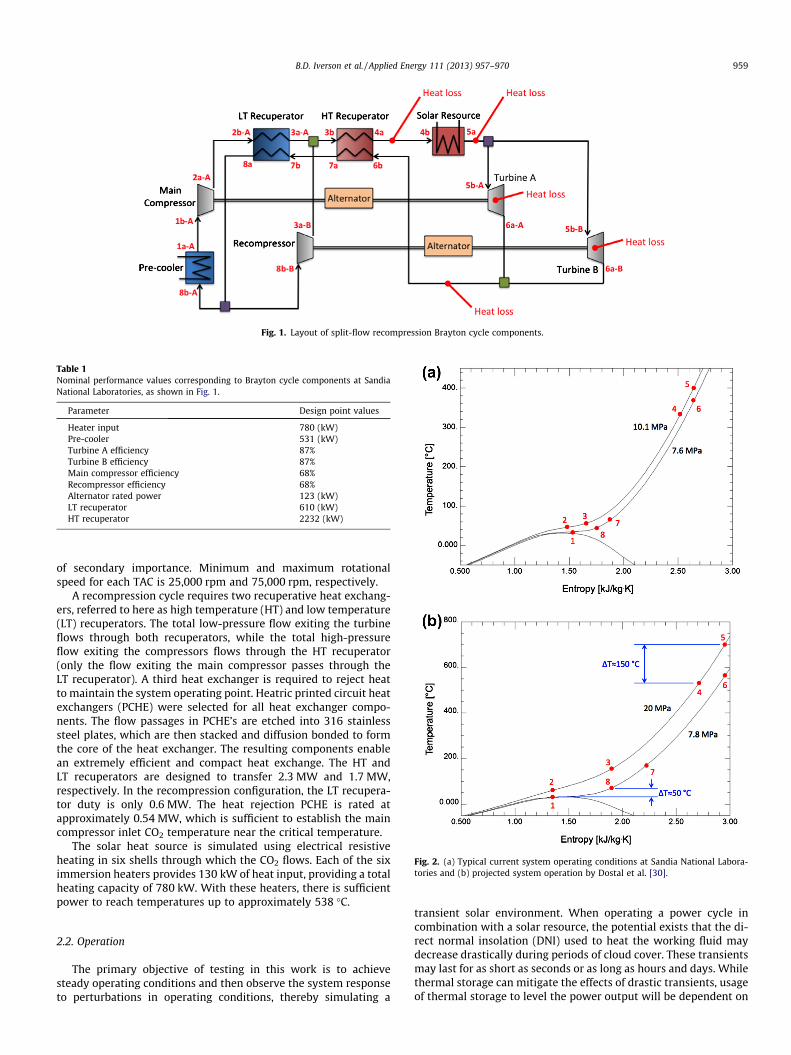
Fig. 2a presents the thermodynamic state points for a represen-tative recompression Brayton cycle capable at Sandia. The expan-
sion process from points 5 to 6 is the same regardless of thenumber of turbines, assuming equal speeds for separate shafts.The final loop design with two separate turbo-alternator-compres-sors (TAC) was determined, in part, by a staged approach due toanticipated incremental government funding. The modular natureof the design allows for multiple configurations, a feature that en-ables proprietary and novel configurations by independentinstitutions.
The thermal input for the system is 780 kW and was selectedbased on key control and stability issues of the sCO2 Brayton cyclewhile small enough to be affordable over several years of develop-ment. The main disadvantage of the relatively small size, and theresultant high turbomachinery rotational speeds, is that the sys-tem requires bearing, seals and motor alternator approaches thatare not necessarily representative of a commercial-scale system.A compromise between fidelity and cost was achieved, whileaddressing the underlying questions for the technology to reducerisk for future industrial efforts in sCO2 power systems.
2.1.1. Cycle componentsA complete description of the major components that constitute
the Sandia split flow recompression test assembly is presented inSandia report SAND2012-9546 [39]. The following is a summarydescription of the major components.
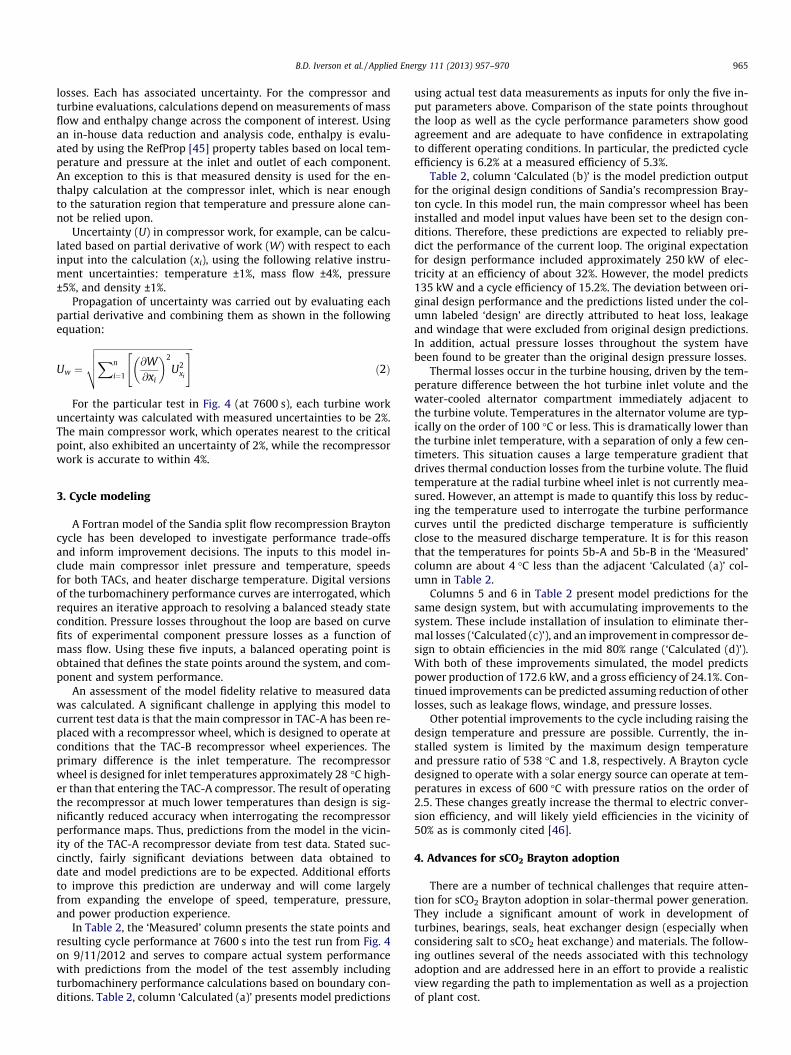
The TACs are hermetically sealed pressure vessels, rated for themaximum pressure and temperature conditions anticipated in theflow system. Within the vessel, the compressor wheel, gas bear-ings, and turbine are laid out along the shaft as shown in Fig. 3.CO2 enters the compressor on the right hand side of the compres-sor, and is discharged radially. Likewise, hot CO2 enters down fromthe top of the turbine, and is expanded radially to the left-handside of the figure. At design conditions, both turbomachinerywheels are subjected to pressures in excess of the critical point.During operation, leakage flow passes around the compressorand turbine through abradable labyrinth shaft seals to providelubrication to thrust and journal bearings. The leakage flow is con-tinuously pumped out of this region using scavenging pumps, driv-ing a cooling flow and maintaining reduced film pressures (ideallyaround 1.4 MPa) in the central cavity surrounding the permanentmagnet shaft and bearings.
The split-flow Brayton cycle uses TACs to compress the low-pressure and low-temperature CO2 to a high pressure at the com-pressors, and then expand the high-pressure and high-temperatureCO2 in the turbines. At and near design conditions, the turbinesgenerate more power than the compressors and inefficiencies con-sume, and the remaining power is used to make electricity in themotor alternator. In the power generation mode, the alternator ap-plies an electrical load to the TACs’ rotating shaft that is sufficientto maintain the commanded rotational speed. The applied electri-cal load represents the power that the TAC would produce for con-sumer use. TAC-A takes, as input to the compressor, the flow thatdischarges from the gas chiller, which is the coldest point in thecircuit. As such, it is also the least compressible. Therefore, TAC-Aconsumes less energy per unit mass to compress the fluid thanthe recompressor in TAC-B.
A single low-pressure flow discharges from the LT recuperator,where it splits into two flow paths, one path to each compressor.The fraction of the total flow going to each compressor is a functionof the relative speeds of the two TACs and the thermodynamicstate of the fluid at each inlet. These factors combine to determineeach compressor’s discharge pressure. When the two flows recom-bine (at the main compressor flow discharge from the LT recuper-ator) they must be at the same pressure. Pressure mismatch at thispoint can put a compressor into a potentially damaging state ofsurge. The primary control to avoid surge is the speed of eachTAC, with the magnitude of heat rejection in the gas chiller being
958 B.D. Iverson et al. / Applied Energy 111 (2013) 957–970
of secondary importance. Minimum and maximum rotationalspeed for each TAC is 25,000 rpm and 75,000 rpm, respectively.
A recompression cycle requires two recuperative heat exchang-ers, referred to here as high temperature (HT) and low temperature(LT) recuperators. The total low-pressure flow exiting the turbineflows through both recuperators, while the total high-pressureflow exiting the compressors flows through the HT recuperator(only the flow exiting the main compressor passes through theLT recuperator). A third heat exchanger is required to reject heatto maintain the system operating point. Heatric printed circuit heatexchangers (PCHE) were selected for all heat exchanger compo-nents. The flow passages in PCHE’s are etched into 316 stainlesssteel plates, which are then stacked and diffusion bonded to formthe core of the heat exchanger. The resulting components enablean extremely efficient and compact heat exchange. The HT andLT recuperators are designed to transfer 2.3 MW and 1.7 MW,respectively. In the recompression configuration, the LT recupera-tor duty is only 0.6 MW. The heat rejection PCHE is rated atapproximately 0.54 MW, which is sufficient to establish the maincompressor inlet CO2 temperature near the critical temperature.
The solar heat source is simulated using electrical resistiveheating in six shells through which the CO2 flows. Each of the siximmersion heaters provides 130 kW of heat input, providing a totalheating capacity of 780 kW. With these heaters, there is sufficientpower to reach temperatures up to approximately 538 "C.
2.2. Operation
The primary objective of testing in this work is to achievesteady operating conditions and then observe the system responseto perturbations in operating conditions, thereby simulating a
transient solar environment. When operating a power cycle incombination with a solar resource, the potential exists that the di-rect normal insolation (DNI) used to heat the working fluid maydecrease drastically during periods of cloud cover. These transientsmay last for as short as seconds or as long as hours and days. Whilethermal storage can mitigate the effects of drastic transients, usageof thermal storage to level the power output will be dependent on
Fig. 1. Layout of split-flow recompression Brayton cycle components.
Table 1Nominal performance values corresponding to Brayton cycle components at SandiaNational Laboratories, as shown in Fig. 1.
Parameter Design point values
Heater input 780 (kW)Pre-cooler 531 (kW)Turbine A efficiency 87%Turbine B efficiency 87%Main compressor efficiency 68%Recompressor efficiency 68%Alternator rated power 123 (kW)LT recuperator 610 (kW)HT recuperator 2232 (kW)
Fig. 2. (a) Typical current system operating conditions at Sandia National Labora-tories and (b) projected system operation by Dostal et al. [30].
B.D. Iverson et al. / Applied Energy 111 (2013) 957–970 959

market conditions that drive power plant operation, availability ofstorage and the short-term forecasting of the cloud transient. Dueto diurnal cycling, even without cloud transients, power cycles dri-ven by a solar resource are inherently transient. Stability may beimproved through usage of other power sources such as nuclear,geothermal, etc. However, characterization of transient responsesis still required for off-normal operation especially as one considersthe fluctuations around the CO2 critical point.
Test runs of the recompression Brayton cycle are time-inten-sive. Test preparation includes evacuating the system over nightto near-zero pressure followed by filling with CO2 to the desiredmass loading, and then elevating the system temperature from acold state to the selected steady state operation. The current max-imum thermal ramp-up rate is approximately 5 "C per minute. Atthis rate, increasing the operating temperature from 17 "C to477 "C requires approximately 2 h. This ramp rate is derived fromexperience and by piping stress limitations; alternate heating ratesand associated designs can be optimized for particular systemneeds.
In order to simulate the system response to a fluctuating heatsource, several test runs were conducted where the heater powersettings were reduced by 50% and 100%. The time periods for50% reduced power setting (Fig. 4) are from 7012 to 7073 s, andfrom 7349 to 7529 s (61 s and 170 s, respectively). The time peri-ods for 100% reduced power setting (Fig. 5) are from 4082 to4148 s, and from 5332 to 5465 s (66 s and 134 s, respectively). Be-fore adjustment of the power setting, the nominal heating powerinputs for the 50% and 100% cases are 280 kW and 160 kW, respec-tively. It is difficult to maintain a perfectly steady state conditionprior to transient excursions due to variations in TAC speeds andsystem cooling, among other perturbations. A best effort was madeto establish conditions prior to an excursion that would produceaccurate indications of a true system response to simulated solarresource transients.
System response is characterized in four separate plots for eachheater power setting reduction, namely: pressure response in thelow-pressure and high-pressure legs, temperatures at the heaterinlet and discharge, and the system net power generation re-sponse. Negative power indicates power production by the system.The large change in net power generation indicated at 4870 s inFig. 5d are due to a controlled reduction in cooling water
temperature, which caused the compressor inlet flow to becomemore dense, less compressible, and therefore requiring less com-pressor work. The main compressor experienced an increase inmass flow, at the expense of the recompressor, but at a higher den-sity. The greater mass flow at lower compressibility resulted in aroughly net-zero change in power for the main compressor. How-ever, the reduced mass flow to the recompressor resulted in asharp decline in required compressor power.
The mass associated with the heat input system results in athermal capacitance effect. Despite changing the heater power set-ting by a 50% or 100% reduction in power, the thermal input to thecycle fluid does not necessarily reduce by 50% or 100%. Instead, forthe 50% reduction, the thermal input (due in part to thermal capac-itance of the piping and heater array) declined to minimum valuesof 210 kW in the first excursion, and 200 kW in the second. Thisthermal input was determined by using the enthalpy change inthe fluid across the heaters and the mass flow rate. For the 100%power reduction, the thermal input (all due to thermal capaci-tance) declined to minimum values of 60 kW and 56 kW in the firstand second excursions, respectively.
From plots (a) and (b) in Figs. 4 and 5, it is apparent that systempressures decline in response to the loss of thermal input. Aninherent characteristic of a closed Brayton system is that as theheated cycle fluid increases in temperature and decreases in den-sity during startup, it pushes fluid to the colder components, effec-tively increasing the whole system pressure. Thus, when the hotside declines in temperature, so too will the system pressure.
The low-pressure leg response to thermal power input reduc-tion is a modest decline, approximately 50 kPa or less. The high-pressure leg response (plot b, Figs. 4 and 5) is greater, with a max-imum reduction approaching 100 kPa. Thus, the high-pressure legresponds to thermal input changes with greater fidelity.
The cycle fluid temperature response is presented in plot (c) ofFigs. 4 and 5. These plots for the 50% and 100% reductions show thetemperatures immediately downstream of the power perturbation(heater discharge), and immediately upstream (heater inlet). Asone would expect, the temperature immediately downstreamshows a much more dramatic and immediate change than the up-stream temperature. Downstream and upstream temperaturereductions for the 50% power reductions are 20 "C and 10 "C forthe first transient, and 35 "C and 15 "C for the second transient.
Turbine Inlet Flow
Radial InflowTurbine
PermanentMagnet Motor
Suction viaScavenging
Pump
JournalBearing
CentrifugalCompressor
Thrust Bearing
CompressorInlet Flow
Shaft Seals
Fig. 3. Schematic of the internals for the Sandia sCO2 turbo-alternator-compressor.
960 B.D. Iverson et al. / Applied Energy 111 (2013) 957–970

7000 7200 7400 76007.5
7.6
7.7
7.8
7.9
8
Time [s]
Pres
sure
[MPa
]Turbine discharge, 6a-ACompressor inlet, 1b-A
7000 7200 7400 76009.3
9.4
9.5
9.6
9.7
9.8
Time [s]
Pres
sure
[MPa
] Compressor discharge, 2a-ATurbine inlet, 5b-A
7000 7200 7400 7600320
340
360
380
400
420
440
460
Time [s]
Tem
pera
ture
[C]
Heater discharge, 5a Heater inlet, 4b
7000 7200 7400 7600-10
-8
-6
-4
-2
0
Pow
er [k
W]
TAC ATAC B
Time [s]
(a) (b)
(c) (d)
Fig. 4. System response to 50% reduction in power setting lasting approximately 1 min and two and a half minutes. (a) Low pressure response, (b) high pressure response, (c)transient source boundary temperatures, and (d) system net power generation response (negative power indicates power production from the system).
4000 4500 5000 5500 60007.2
7.3
7.4
7.5
7.6
7.7
Pres
sure
[MPa
]
Turbine discharge, 6a-A Compressor inlet, 1b-A
4000 4500 5000 5500 60008.2
8.3
8.4
8.5
8.6
8.7
Time [s]
Pres
sure
[MPa
]
Compressor discharge, 2a-A Turbine inlet, 5b-A
4000 4500 5000 5500 6000240
260
280
300
320
340
Tem
pera
ture
[C] Heater discharge, 5a Heater inlet, 4b
4000 4500 5000 5500 6000-3
-2
-1
0
1
2
3
Time [s]
Pow
er [k
W]
TAC ATAC B
(a) (b)
(c) (d)
Time [s]
Time [s]
Fig. 5. System response to 100% reduction in power setting lasting approximately 1 min and 2 min. (a) Low pressure response, (b) high pressure response, (c) transient sourceboundary temperatures and, (d) system net power generation response (negative power indicates power production from the system).
B.D. Iverson et al. / Applied Energy 111 (2013) 957–970 961

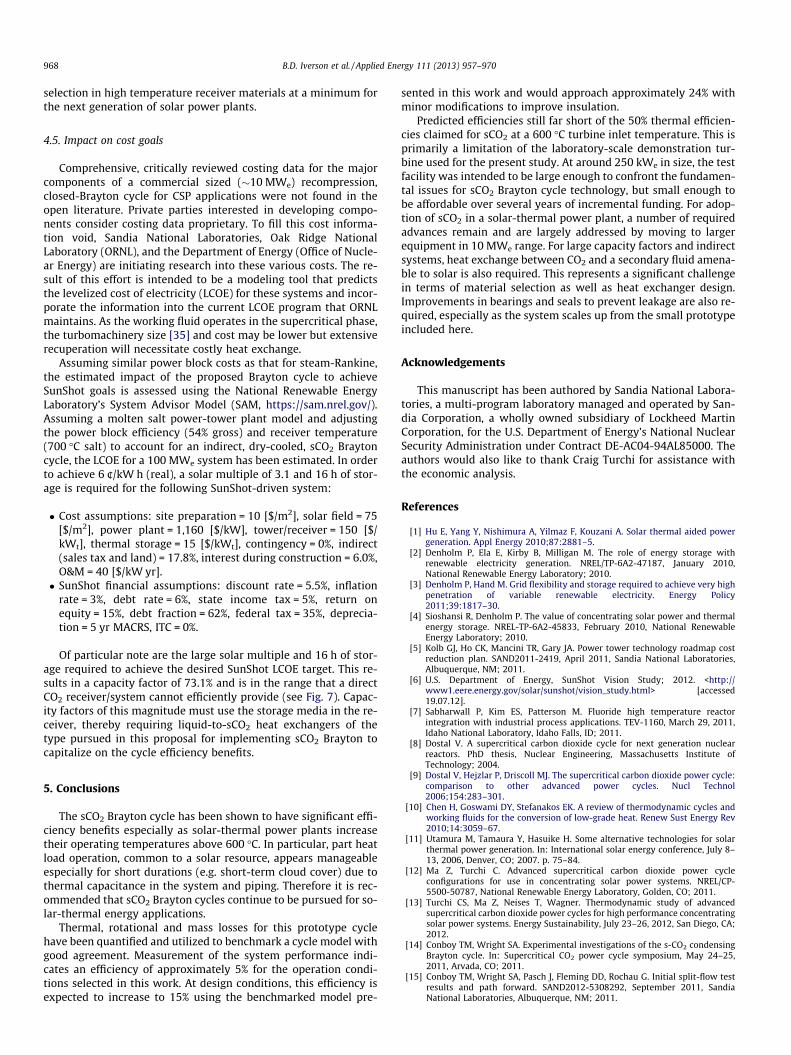
Table 2State points and operational parameters measured at steady operation. Calculated columns include (a) model benchmarking, (b) cycle operation at design conditions, (c)insulation improvements to reduce heat loss, and (d) compressor design improvements to reach 80% efficiency.
Location Measured(Fig. 4, 7600 s)
Calculated (a)benchmark
Calculated (b)design conditions
Calculated (c)insulated
Calculated (d)efficient compressor
Temperature ("C)1a-A 32.3 31.9 32.4 32.4 32.41b-Ad 31.8 31.9 32.4 32.4 32.42a-A 46.8 47.6 52.6 52.5 51.62b-A 45.7 47.6 52.6 52.5 51.63a-A 55.8 52.7 119.6 120.8 116.33a-B 69.5 71 115.5 116.4 110.23b 58.7 55.8 117.7 118.8 113.54a 331.7 316.7 422.7 435 432.94b 316.1 301.1 407.1 435 432.95a 400.4 400.4 538 538 5385b-A 390 394.1 531.7 538 5385b-B 390.6 394.6 532.2 538 5386a-A 368.9 368.5 473.7 484.6 484.56a-B 368.9 367.7 473.8 484.1 4846b 366.3 365.5 471.1 484.3 484.27a 67 61 135.8 137.8 132.27b 67 61 135.8 137.8 132.28a 45.9 47.7 64.3 64.2 638b-A 44.6 47.7 64.3 64.2 638b-B 45.1 46.9 63.5 64.2 63
Pressure (kPa)1a-A 7530.7 7485 7688 7688 76881b-Ad 7485.1 7485 7688 7688 76882a-A 10296.9 10218.6 14091.3 14078.3 14099.72b-A 10156.8 10218.6 14091.3 14078.3 14099.73a-A 10067.4 10136.8 13978.5 13965.6 13986.93a-B 10020.4 10126.1 13963.1 13967.1 13980.23b 10017.3 10126.1 13963.1 13967.1 13980.24a 10117.1 10045.1 13851.4 13855.4 13868.34b 10045.3 10045.1 13851.4 13855.4 13868.35ad 9898.5 9797.8 13472.3 13477.4 13489.75b-A 9893.7 9797.8 13472.3 13477.4 13489.75b-B 9852.6 9797.8 13472.3 13477.4 13489.76a-A 7938.4 7933.7 8416.4 8413.6 8415.36a-B 7962.5 7933.7 8416.4 8413.6 8415.36b 7983.2 7933.7 8416.4 8413.6 8415.37a 7844.5 7808.8 8283.8 8281.1 8282.77b 7922.2 7808.8 8283.8 8281.1 8282.78a 7783 7685.8 8153.4 8150.7 8152.38b-A 7553.1 7685.8 8153.4 8150.7 8152.38b-B 7573.5 7685.8 8153.4 8150.7 8152.3
Mass flow (kg/s)2a-A 2.506 2.767 3.098 3.134 3.0713a-B 0.977 0.888 2.534 2.481 2.5544b 3.483 3.655 5.632 5.615 5.6255b-A 1.741 1.803 2.626 2.619 2.6235b-B 1.741 1.854 3.007 2.996 3.0016a-A 1.712 1.774 2.597 2.589 2.5936a-B 1.716 1.829 2.982 2.972 2.9778b-A 2.535 2.797 3.127 3.164 3.1018b-B 1.002 0.912 2.559 2.506 2.578
TAC ARPMd 36550 36550 75000 75000 75000Windagea (kW) N/Ae 4.9 25.8 25.8 25.8Turbine heat lossb (kW) 8.1 10.5 16.0 0.0 0.0Turbine power (gross) (kW) 36.4 36.9 151.8 153.7 154.2Turbine efficiency (%) 79.1 80.8 84.6 84.6 84.6Compressor pressure ratio 1.376 1.365 1.833 1.831 1.834Compressor power (kW) 39.2 25.5 47.5 47.9 36.4Compressor efficiency (%) 36.3 67.8 67.1 67.3 87.1TAC A net power (kW) 10.9 6.5 78.5 80.0 92.0
TAC BRPMd 46025 46025 75000 75000 75000Windagea (kW) N/Ae 10.1 25.8 25.8 25.8Turbine heat lossb (kW) 8.1 10.8 18.3 0.0 0.0Turbine power (gross) (kW) 37.8 40.8 176.0 178.0 178.6Turbine efficiency (%) 84.6 86.5 85.4 85.3 85.3Compressor pressure ratio 1.323 1.318 1.713 1.714 1.715Compressor power (kW) 16.7 14.9 93.2 91.6 72.2Compressor efficiency (%) 61.9 63.4 68.3 68.7 88.6
962 B.D. Iverson et al. / Applied Energy 111 (2013) 957–970

The corresponding upstream and downstream temperature reduc-tions for the 100% power reductions are 40 "C and 10 "C for the firsttransient, and 50 "C and 15 "C for the second transient. The up-stream response is muted and delayed for several reasons. First,there is a finite period of time required for the fluid to transit theloop. The fluid that is immediately affected in the heater requiresthat transit period to return to the heater inlet. Second, the recu-perators inherent in the design of a recompression system act tomitigate the sharpness and magnitude of thermal changes in thecycle. Finally, the thermal capacity of all piping and componentsacts to delay the magnitude of a thermal transient.
In general, the various responses in the pressure, temperatureand power output to the reduction in thermal power input exhibitan exponential decay, indicative of what is expected from storedthermal energy in a thermal capacitor. System response after theheating power is restored exhibits a complementary logarithmicrise. These trends are best displayed in the temperature historiesin plot (c). When solar transients do occur, short perturbations ofthis type can easily be managed by thermal capacitance in the sys-tem with the extent of the exponential decay in system variablesdependent on the total thermal mass and heat losses inherent inthe heating system.
2.3. Measurement uncertainty
A particular test case and operating conditions was selected forconsideration of system losses and measurement uncertainty. Adata point 7600 s into the test was selected from Fig. 4 and ana-lyzed at a time of steady power generation (see also Table 2).
2.3.1. Thermal lossThermal losses between two separate locations in the cycle can
be assessed by examination of temperature change across lengthsof piping that are not directly heated or cooled as part of a cycleprocess. This is most significant along the high-temperature legsof the system. These segments are larger in diameter and are ofconsiderable length to accommodate thermal expansion. The loopstructure continues to be developed and is largely not insulated.This is responsible for a significant amount of the poor systemperformance from the standpoint of total system efficiency,providing context to discrepancies between theoretical and exper-imentally observed cycle characteristics.
Fig. 1 indicates the locations of significant heat loss. Heat lossesare estimated in these regions by a product of mass flow, heatcapacity, and temperature change. For the selected test conditionat 7600 s (Table 2), 62.3 kW of heat is lost from the HT recuperatorto the heater inlet, 40.9 kW is lost upstream of the turbines, and
10.5 kW is lost from the turbine outlet legs to the HT recuperatorinlet. Losses at the turbine volute are also noted to be 8.8 kWand 7.5 kW for turbines A and B, respectively. Volute thermallosses are estimated from known conditions at the inlet and outletof the turbine, and turbine performance maps for a given set ofconditions [40]. The discrepancy between measured turbine outletconditions, and outlet conditions predicted by the performancemap is attributed to a cooling mechanism at the back of the turbinevolute due to rapid expansion of high pressure CO2 across therotating seal, into the low-pressure alternator housing. In totalfor this test case, 130 kW is lost to various thermal mechanismsfor a heater input of 342 kW (38%).
2.3.2. Losses to rotating frictionRotating loss, or windage, is also a significant contributor to
conversion inefficiencies for the current test assembly. The high-speed environment, along with high density and low viscosity,generate a highly turbulent environment at the shaft and withintight clearances of the gas foil thrust and journal bearings. Thepresence of turbulence causes a sharp increase in the dependencyof frictional loss and load capacity to environmental conditions,namely a heightened sensitivity to lubricant gas pressure and run-ner speed. This phenomenon was first observed in testing of jour-nal bearings at NASA’s Glenn Research Center [41]. Intensive
Table 2 (continued)
Location Measured(Fig. 4, 7600 s)
Calculated (a)benchmark
Calculated (b)design conditions
Calculated (c)insulated
Calculated (d)efficient compressor
TAC B net power (kW) 5.7 15.8 57.0 60.6 80.6
System parametersHeater input (kW) 341.7 422.6 891.0 700.9 716.5Pre-cooler (kW) 239.2 240.2 476.4 481.3 464.8LT recuperator UA (kW/K) 67.6 67.6 70.0 70.0 70.0HT recuperator UA (kW/K) 55.2 55.2 40.0 40.0 40.0Mass loading (kg) 101.2 101.8 104.0 103.3 104.2Heat lossc 4a to 4b (kW) 62.3 65.8 104.9 0.0 0.0Heat lossc 5a to 5b (kW) 40.9 25.8 41.5 0.0 0.0Heat lossc 6a to 6b (kW) 10.5 10.8 17.2 0.1 0.1Net electricity (kW) 16.6 22.3 135.5 140.6 172.6Cycle efficiency (%) 4.9 5.3 15.2 20.0 24.1
a Obtained using data presented in Fig. 6.b Obtained following Section 3.c Obtained following the approach in Section 2.3.1.d Input parameter for model.e Not directly measured.
0
6
12
18
24
20 30 40 50 60 70 80
Journal Bearing 1Journal Bearing 2ShaftThrust BearingSum (turbulent correlations)
Pow
er L
oss
[kW
]
Speed [krpm]
Fig. 6. Breakdown of alternator windage losses for CO2 at 27 "C and 1.4 MPa. Eachdata set was determined by using turbulent correlations and then summed toillustrate the relative contribution of the components.
B.D. Iverson et al. / Applied Energy 111 (2013) 957–970 963

frictional losses not only serve as a parasitic load, but also cancause extreme local heating of bearings and other turbomachineryinternals, causing turbine malfunction.
Modeling TAC windage has revealed that the major loss is dueto the shaft itself and the thrust bearing assembly; these combinefor upwards of 85% of frictional loss [38]. The two radial journalbearings account for the remainder. These estimates are based onconsideration of the turbomachinery assembly as a simplified ser-ies of tightly-housed concentric cylinders and disks and applyingfriction relations for turbulent boundary layers by Schlichtingand Gersten [43] and Vrancik [44]. Fig. 6 illustrates the relativecontribution of windage loss (based on these turbulent correla-tions) for the journal bearings, thrust bearing and rotating shaft.The sum of these power losses is also provided in the figure. Ongo-ing work seeks to optimize the thrust bearing assembly for reducedfriction and resistance at higher temperatures without compromis-ing load capacity. This is the primary challenge in attaining highspeeds approaching 75 krpm for the current test assembly.
To isolate and quantify empirical rotating losses for the presenttest assembly, a series of tests was conducted to identify the netcontribution of the windage losses (illustrated in Fig. 6) plus thatdue to seals. This total rotating loss was measured by removingthe turbine and compressor wheels from the shaft, and recordingthe resultant power consumption required to spin the bare shaftalone at high speeds within prototypic CO2 environments. Sensitiv-ity to CO2 properties, shaft speed, and thrust loads were evaluateddirectly [42]. CFD modeling of the sCO2 lubrication layer was alsoundertaken to confirm that observed losses were consistent withturbulent theory. The resulting correlation for power loss thatscales with angular velocity (x) and fluid properties (density qand viscosity l) is as follows:
Pturb " 0:155x2:8 q21:1 #kg=m3$
! "0:8 l14:9 #lPa s$
! "0:2
%1&
Eq. (1) can be used for estimating windage losses in test datawithin ±5% for speeds less than 50 krpm. This correlation runsapproximately 20% higher than that predicted by turbulent theory(as in Fig. 6) for rotating disks and cylinders alone [42]. This can beattributed to the simplified modeling approach and neglect of shaftseals. Empirical testing results yielding Eq. (1) indicates an esti-mated 4.9 kW loss for turbine A, and 10.1 kW loss for turbine B.The difference between A and B in this case is due to their speeddifferential at 7600 s and fluid properties in the rotor housing.Here, CO2 properties of density and viscosity are taken withinthe turbine housing, where the shaft and gas bearings operate.Typical temperatures and pressures in the rotor housing are150 "C and 1.4 MPa.
2.3.3. Leakage flowsAt each turbine and compressor wheel, leakage flow bypasses
the rotating element in the housing through abradable labyrinthshaft seals and into the turbine housing where the gas bearingsand alternator spin in a reduced pressure environment (Fig. 3).The leakage flow critically provides bearings with a hydrodynamicfilm for load support and transfers frictional heating. A gas scaveng-ing system pulls CO2 from the housing to prevent buildup of pres-sure, driving a cooling flow through the turbine, and pumps itback into the high pressure loop to complete the closed cycle. A sup-plementary bypass line connects from the compressor inlet at eachTAC unit and penetrates into the turbine housing in the vicinity ofthe high temperature turbine-end radial bearing. This additionalcooling is metered by a manual needle valve along the flow path.
The combination of leakage flow in the seals and bypass flow forcooling bearings is considered the total system leakage flow. The
mass flow, temperature and pressure of this flow is measuredand considered in the data reduction process as follows. Duringthe compression stage, leakage flow in the seals is included inthe compressor work calculation, since it is judged that the flowcannot reach the seals without first passing the through the cen-trifugal wheel. During expansion, leakage flow is not included inthe turbine work calculation, since the leakage flow largely by-passes the turbine wheel.
The current approach for seals limits leakage flow to less than5%. Consequently, the impact to compressor and turbine work cal-culations is minimal, but can still represent up to 5% of unrecover-able loss. Given the nature of abradable seals and the small-scalegeometry of the present rotating hardware, this flow rate maychange somewhat over time for a fixed set of CO2 conditions up-stream of the seal, as the labyrinth seal experiences wear. For thistest on 9/11/2012 near 7600 s, the total mass flow topped 3.5 kg/swhile leakage flow was 0.1 kg/s in total, or 2.8%.
2.3.4. Uncertainty analysisAnalysis of net power generation requires knowledge of com-
pressor and turbine work (as measured by enthalpy change acrosseach active component), and estimated thermal and frictional
0.75
0.8
0.85
0.9
0.95
1
0.75 0.8 0.85 0.9 0.95 1
Direct Receiver, 16 hrsDirect Receiver, 8 hrsDirect Receiver, 6 hrsDirect Receiver, 4 hrsIndirect Receiver
Effic
ienc
y [-]
Heat Exchanger Effectiveness [-]
0.97
0.975
0.98
0.985
0.99
0.995
1
0 10 20 30 40 50
Direct Receiver, 16 hrsDirect Receiver, 8 hrsDirect Receiver, 6 hrsDirect Receiver, 4 hrsIndirect Receiver
Exer
getic
Effi
cien
cy [-
]
Heat Exchanger Temperature Difference [°C]
(a)
(b)
Fig. 7. (a) First law efficiency as a function of heat exchanger (HX) effectiveness and(b) exergetic efficiency as a function of heat exchanger DT for direct (e.g. sCO2 inreceiver) and indirect (e.g. salt or secondary media in receiver) approaches forseveral storage capacities at 700 "C, assuming a 98% storage efficiency and 8 h ofdaylight operation.
964 B.D. Iverson et al. / Applied Energy 111 (2013) 957–970
losses. Each has associated uncertainty. For the compressor andturbine evaluations, calculations depend on measurements of massflow and enthalpy change across the component of interest. Usingan in-house data reduction and analysis code, enthalpy is evalu-ated by using the RefProp [45] property tables based on local tem-perature and pressure at the inlet and outlet of each component.An exception to this is that measured density is used for the en-thalpy calculation at the compressor inlet, which is near enoughto the saturation region that temperature and pressure alone can-not be relied upon.
Uncertainty (U) in compressor work, for example, can be calcu-lated based on partial derivative of work (W) with respect to eachinput into the calculation (xi), using the following relative instru-ment uncertainties: temperature ±1%, mass flow ±4%, pressure±5%, and density ±1%.
Propagation of uncertainty was carried out by evaluating eachpartial derivative and combining them as shown in the followingequation:
Uw "
##########################################Xn
i"1
@W@xi
! "2
U2xi
" #vuut %2&
For the particular test in Fig. 4 (at 7600 s), each turbine workuncertainty was calculated with measured uncertainties to be 2%.The main compressor work, which operates nearest to the criticalpoint, also exhibited an uncertainty of 2%, while the recompressorwork is accurate to within 4%.
3. Cycle modeling
A Fortran model of the Sandia split flow recompression Braytoncycle has been developed to investigate performance trade-offsand inform improvement decisions. The inputs to this model in-clude main compressor inlet pressure and temperature, speedsfor both TACs, and heater discharge temperature. Digital versionsof the turbomachinery performance curves are interrogated, whichrequires an iterative approach to resolving a balanced steady statecondition. Pressure losses throughout the loop are based on curvefits of experimental component pressure losses as a function ofmass flow. Using these five inputs, a balanced operating point isobtained that defines the state points around the system, and com-ponent and system performance.
An assessment of the model fidelity relative to measured datawas calculated. A significant challenge in applying this model tocurrent test data is that the main compressor in TAC-A has been re-placed with a recompressor wheel, which is designed to operate atconditions that the TAC-B recompressor wheel experiences. Theprimary difference is the inlet temperature. The recompressorwheel is designed for inlet temperatures approximately 28 "C high-er than that entering the TAC-A compressor. The result of operatingthe recompressor at much lower temperatures than design is sig-nificantly reduced accuracy when interrogating the recompressorperformance maps. Thus, predictions from the model in the vicin-ity of the TAC-A recompressor deviate from test data. Stated suc-cinctly, fairly significant deviations between data obtained todate and model predictions are to be expected. Additional effortsto improve this prediction are underway and will come largelyfrom expanding the envelope of speed, temperature, pressure,and power production experience.
In Table 2, the ‘Measured’ column presents the state points andresulting cycle performance at 7600 s into the test run from Fig. 4on 9/11/2012 and serves to compare actual system performancewith predictions from the model of the test assembly includingturbomachinery performance calculations based on boundary con-ditions. Table 2, column ‘Calculated (a)’ presents model predictions
using actual test data measurements as inputs for only the five in-put parameters above. Comparison of the state points throughoutthe loop as well as the cycle performance parameters show goodagreement and are adequate to have confidence in extrapolatingto different operating conditions. In particular, the predicted cycleefficiency is 6.2% at a measured efficiency of 5.3%.
Table 2, column ‘Calculated (b)’ is the model prediction outputfor the original design conditions of Sandia’s recompression Bray-ton cycle. In this model run, the main compressor wheel has beeninstalled and model input values have been set to the design con-ditions. Therefore, these predictions are expected to reliably pre-dict the performance of the current loop. The original expectationfor design performance included approximately 250 kW of elec-tricity at an efficiency of about 32%. However, the model predicts135 kW and a cycle efficiency of 15.2%. The deviation between ori-ginal design performance and the predictions listed under the col-umn labeled ‘design’ are directly attributed to heat loss, leakageand windage that were excluded from original design predictions.In addition, actual pressure losses throughout the system havebeen found to be greater than the original design pressure losses.
Thermal losses occur in the turbine housing, driven by the tem-perature difference between the hot turbine inlet volute and thewater-cooled alternator compartment immediately adjacent tothe turbine volute. Temperatures in the alternator volume are typ-ically on the order of 100 "C or less. This is dramatically lower thanthe turbine inlet temperature, with a separation of only a few cen-timeters. This situation causes a large temperature gradient thatdrives thermal conduction losses from the turbine volute. The fluidtemperature at the radial turbine wheel inlet is not currently mea-sured. However, an attempt is made to quantify this loss by reduc-ing the temperature used to interrogate the turbine performancecurves until the predicted discharge temperature is sufficientlyclose to the measured discharge temperature. It is for this reasonthat the temperatures for points 5b-A and 5b-B in the ‘Measured’column are about 4 "C less than the adjacent ‘Calculated (a)’ col-umn in Table 2.
Columns 5 and 6 in Table 2 present model predictions for thesame design system, but with accumulating improvements to thesystem. These include installation of insulation to eliminate ther-mal losses (‘Calculated (c)’), and an improvement in compressor de-sign to obtain efficiencies in the mid 80% range (‘Calculated (d)’).With both of these improvements simulated, the model predictspower production of 172.6 kW, and a gross efficiency of 24.1%. Con-tinued improvements can be predicted assuming reduction of otherlosses, such as leakage flows, windage, and pressure losses.
Other potential improvements to the cycle including raising thedesign temperature and pressure are possible. Currently, the in-stalled system is limited by the maximum design temperatureand pressure ratio of 538 "C and 1.8, respectively. A Brayton cycledesigned to operate with a solar energy source can operate at tem-peratures in excess of 600 "C with pressure ratios on the order of2.5. These changes greatly increase the thermal to electric conver-sion efficiency, and will likely yield efficiencies in the vicinity of50% as is commonly cited [46].
4. Advances for sCO2 Brayton adoption
There are a number of technical challenges that require atten-tion for sCO2 Brayton adoption in solar-thermal power generation.They include a significant amount of work in development ofturbines, bearings, seals, heat exchanger design (especially whenconsidering salt to sCO2 heat exchange) and materials. The follow-ing outlines several of the needs associated with this technologyadoption and are addressed here in an effort to provide a realisticview regarding the path to implementation as well as a projectionof plant cost.
B.D. Iverson et al. / Applied Energy 111 (2013) 957–970 965

4.1. Turbine development
Several improvements in the Brayton turbomachinery couldsignificantly improve the efficiency by reducing losses. A 10 MWe
system size has been identified as the minimum needed for dem-onstration of commercial-scale turbomachinery technology forsCO2 [47]. Whereas the present test assembly uses radial compres-sors and turbines, a >10 MWe sCO2 power system would be a mul-ti-stage axial machine much like present-day industrial gasturbines. The 10 MWe size would also allow for high efficiency atrotational speeds on the order of 24,000 rpm, in comparison tothe current 75,000 rpm system. This reduction in design speed to24,000 rpm would allow the turbine to be mated with gear reduc-tion to 3600 rpm (60 Hz) using a commercially-available gearboxand allow for synchronous operation similar to commercial-scalepower systems.
A significant drawback of the current design is that a simulta-neous high-speed and high-pressure environment at the rotor cancause disproportionately large frictional losses. Also for this small-scale hardware, mere inches separate the high temperature turbineinlet (potentially up to 540 "C) from the motor/generator coolingwater flow at room temperature, resulting in thermal losses. Leak-age flow bypasses the turbomachinery wheels to lubricate the gasbearings, reducing productive work as well. To manage leakageflows, the turbine itself and other turbomachinery internals mustbe designed and built to tolerances on the order of thousandths ofan inch. All loss mechanisms would be eliminated or greatly re-duced for a commercial-scale (multi-MWe) Brayton system [47].
Additional objectives include demonstration of high conversionefficiency and control concepts of the sCO2 closed Brayton cycle.The current split flow recompression turbomachinery will be usedto investigate system control algorithms for a recompression cycle.Variables of particular interest include responding to heat inputvariations, changes in load demand, and responding to emergencyevents. Primary control features will include turbomachineryspeed, heat rejection, and possibly circuit mass loading. Developingcontrol algorithms is necessary to maintain a recompression cycleat optimum performance with automatic controls to respond tovarious transients such as load demand and heat input. The currentresearch and development system requires continual oversight tomaintain the system in a stable condition.
4.2. Heat exchangers
When targeting high-capacity factors, a secondary thermaltransport media for use in the receiver and storage system (indirectsystem) is a likely approach given the high pressures associatedwith supercritical working fluids and low specific heat values forgases. In this indirect system, the primary fluid is defined as thatemployed by the power cycle and the secondary fluid as that usedfor collection and/or storage. An indirect approach with differentreceiver and power cycle fluids allows the media used in each sub-system to be optimized for their specific function in the cycle com-ponents. This approach has an additional benefit of beingapplicable to a variety of power cycles, as the collection and powercycle media are decoupled. However, this requires a heat exchan-ger at the interface of these subsystems.
An important consideration relative to indirect systems is theability to incorporate significant energy storage. In instances wherecapacity factors are relatively low (25–50%), a direct receiver ap-proach, which incorporates heat exchange to a storage media,can be beneficial because the majority of annual energy generationoccurs with the heat-transfer media being sent directly to thepower block without the incurred losses in a heat exchanger. Forlarger-capacity factors, where a significant fraction of the collectedenergy is sent to storage, it is more efficient to match the storage
and receiver media, thus, requiring only a single heat exchangerto interface with a separate power block working fluid (seeFig. 7). For the calculations in Fig. 7 based on a turbine inlet tem-perature of 700 "C and a 98% storage efficiency, the first-law effi-ciency for an indirect liquid receiver is higher than the directapproach, above approximately 10 h. The crossover in second-law efficiency occurs at a lower storage capacity of approximately7 h. While this amount of storage capacity may appear to be higherthan desired in some energy markets, the cost and feasibility ofstoring supercritical fluids that reach goals applicable to SunShotwould prove cost-prohibitive for both large- and small-capacityfactors [48]. Further, the effects of thick-walled piping and a poten-tial slower start-up due to a larger thermal capacitance in systemcomponents has been neglected for the direct CO2 approach, fur-ther justifying an indirect approach, especially for large capacityfactors.
In order to successfully implement an indirect system for solar,a heat exchanger to transfer heat between the dissimilar fluids isnecessary. Of the heat exchanger designs to consider, a diffusionbonded heat exchanger (such as a PCHE or hybrid-PCHE [49,50])is a possible candidate as the diffusion bonding process is capableof producing small channel sizes that enables containment of thehigh pressures required for the supercritical phase [51,52]. Areduction in the channel hydraulic diameter also enables an in-crease in the heat transfer coefficient, as they are inversely related(h ' 1/Dh). Thus, the small channel size accommodates the twomajor requirements for heat exchange with sCO2.
On the salt side of the heat exchange, the same channel dimen-sions used for sCO2 are not optimal due to the concern for pluggingof solidified salt. Therefore a hybrid construction using techniquesother than printed circuit methods may be required for salt appli-cations [53]. When selecting salts that have higher operating tem-peratures, typically this also involves a corresponding increase inthe melt temperature, making solidification problematic at tem-peratures well above ambient. Similar concerns exist for sodiumin PCHEs, with initial investigations recently appearing[33,54,55]. One mitigation strategy is simply to utilize the salt onlyin a thermal environment where the temperatures never reachsolidification temperatures. This is possible for recuperated Bray-ton cycles where the heat addition from an external source is ex-pected to raise the temperature from 531 to 700 "C [30].Common chloride-based salts (e.g., KCl–LiCl–NaCl ternary eutecticmelts at 346 "C [56]) or carbonates typically have melting temper-atures well below this range. Start-up procedures, however, mayneed to involve external thermal input for preheating before saltintroduction.
The sCO2 Brayton cycle is known to be highly recuperative, withprojected capital costs of heat exchangers representing 80% of thetotal cost of the cycle [31,57]. Highly compact, efficient heatexchangers are, therefore, necessary for power block cost reductionwith numerous design and characterization studies in the litera-ture [58–71]. However, there is very little information on heat ex-changer design when considering exchange with a secondary hotworking fluid, such as liquid metals or molten salts [54,68]. Whenconsidering liquid sodium on the hot side, initial studies have onlybegun to understand conditions under which freezing conditionsmay occur [54]. The implementation of a salt-to-sCO2 heat transferinterface must address the differential pressure between the hotand cold fluid which may be as high as 20–25 MPa at temperaturesof 600–800 "C; not a trivial matter. Idaho National Laboratory (INL)has initiated work relative to using salt-service heat exchangers tolink a sCO2 Brayton cycle to a nuclear reactor. Preliminary studiesfor fluoride salts indicate that shell-and-tube (helical coil) andPCHE heat exchangers are the most likely to achieve the desired re-sults for their advanced high-temperature reactors [51,52], withthe PCHE option preferred for its thermal and structural perfor-
966 B.D. Iverson et al. / Applied Energy 111 (2013) 957–970

mance. Further, they demonstrated diffusion bonding for nickel-based alloys Haynes N and 242, despite the high chromium contentin these materials resulting in protective oxide layers [49]. Ar-gonne National Laboratory has initiated sodium-to-sCO2 heat ex-changer studies with plans to test fill and drain operations toavoid channel blockage [53].
In solar plants where molten salt is the industry standard, it hasbeen long known that molten salts (nitrates and halides) tend topreferentially dissolve and deposit active alloying elements, (e.g.chromium or molybdenum [72–76]), which would need to be ad-dressed for smaller channels where plugging could be an issue[75]. By forcing the salt toward a reducing condition, corrosion be-comes extremely slow and may sufficiently inhibit this behavior[77]. sCO2 corrosion of metals is currently being investigated byseveral institutions with stable oxides (chrome and nickel oxides,and alumina) as protective barriers [78]. It has been found thathigh concentrations of chromium and nickel significantly increasethe corrosion resistance of steel alloys in CO2 [79]. Current studiesinclude investigations of protective layers exposed to impuritiesand developing protective barriers [80].
4.3. Bearings/seals
To date, the approach to gas bearings and seals for this systemhas demanded a disproportionate amount of the total research ef-fort. The closed cycle, small-scale turbo-alternator-compressorsdeveloped for the present demonstration loop are a result of cus-tom fabrication, and an iterative design and testing process. Thishas resulted in a system capable of supporting the necessary thrustloads, on the order of 400 N, at high speeds, within minimal irre-versible losses. However, there is still considerable room forimprovement. Modeling results indicate that a bearing with smal-ler diameter and fewer thrust pads could maintain thrust loadcapacity with reduced frictional losses. In addition, incorporationof geometric features (e.g. chevrons) at the trailing edge of eachthrust pad to expel hot fluid would likely increase load capacityby enhancing the thermal wedge effect, while improving thermalmanagement [81]. Experimental work has also demonstrated thatusing a stamped manufacturing approach rather than assemblingthe thrust bearing manually from many small pieces can attaintighter engineering tolerances. Smaller engineering tolerances al-low for operation at reduced film thicknesses, increasing loadcapacity.
Finally, it is recommended that shaft and thrust runner of nextgeneration CO2 gas bearings be plasma sprayed with a solid lubri-cant while using bare pads. This improvement is directed atincreasing the temperature resistance of the current model, whichcannot be heated beyond the dissociation temperature of Teflon.
Commercial-scale systems would apply a different approach tobearings and seals. These systems would almost certainly be largeenough to operate efficiently at 3600 rpm (60 Hz), eliminating thefeasibility of high-speed gas bearings. A commercial generatorwould be located outside of the high pressure CO2 region, likelyby using dry liftoff seals to separate the rotor from ambient condi-tions. Industrial dry liftoff seals use several stages and a buffer orpurge gas to isolate the working fluid from the environment,resulting in reduced friction from the present assembly, and useof standard oil-lubricated industrial bearings types.
4.4. Materials
Material requirements for thermal solar power applicationsvary widely depending on the heat transfer fluids under consider-ation and operating conditions imposed. Focus here will briefly dis-cuss the material requirements of CO2, oxoanion salts (nitrate/nitrite and carbonate), and halide anion salts (fluorides and chlo-
rides) that could be used as primary or secondary heat transfer flu-ids depending on the receiver, power cycle and thermal storagesubsystem configurations. Nitrate/nitrite salts are currently usedin commercial solar applications, but there is concern with thethermal stability above 600 "C, thus other fluids must be consid-ered for higher temperatures. Carbonates and halides have alsobeen selected for consideration based on their high temperaturestability and cost.
Materials with the ability to form passivated oxide layers, suchas a chrome oxide or alumina, have been found to perform wellwith CO2 [78,82]. Quantification of the presence of impurities(e.g. moisture) and their role in exacerbating corrosion is necessaryfor long-term power plant operation [82]. While it is understoodthat an aggressive attack on containment materials will occur inthe presence of impurities there are no well-defined limits thatcurrently exist.
Oxoanion salts, specifically molten nitrate/nitrites and carbon-ates, have different material considerations than that of CO2. Ithas been observed that nitrate/nitrite salts and carbonate saltsare able to form and maintain passive oxide barriers that are ther-modynamically stable in the melt, which as act as diffusion barri-ers that form following typical parabolic growth rates [83,84]. Incontrast to CO2, active alloying elements, such as chromium, aresoluble in the melt. Corrosion enhancing impurities typically takethe form of chlorides, which act to disrupt passive layers and actas a catalyst for corrosion and must be considered from a systemsengineering standpoint [85–87]. Thermal decomposition of oxoan-ion salts into oxides will increase the basicity which, in turn,changes the thermodynamic state of the melt. This decompositionis reflected in potential-oxide (E-pO2-) diagrams (which parallelPourbaix diagrams for aqueous solutions) and indicates potentiallystable phases within the melt, useful in predicting phases that maybe used as a protective oxide layer [88]. Questions related toevolved oxide content over time (i.e. thermal decomposition of agiven salt) for the long-term stability of the salt need to be ad-dressed, in addition to techniques of online monitoring of saltchemistry.
Halide salts differ significantly from oxoanions in that they donot form passive oxide layers, as is the case with chlorides [89]and fluorides [90–93]. In the case of fluorides, a metal fluoride ismore stable than the metal oxides. Alloy protection with fluoridesmust rely on thermodynamic equilibrium between alloys [94] andthis approach has largely been used with chloride melts. Due to thelack of a diffusion barrier, corrosion-enhancing impurities in ha-lides take the form of oxygen or oxygen containing molecules, suchas water or air [95,96]. Systems’ where initial salt purity and ullagegasses are not controlled experience severe corrosion [77,97]. Sys-tems’ using these salts requires monitoring and purification sys-tems in order to control corrosion of containment vessels.Questions are still outstanding related to chloride systems as tothe practical development of thermodynamically and kineticallyfavorable oxide barriers that might lessen requirements of salt pur-ity, which may preclude the need for a pressure vessel in potentialsystem designs. Information on corrosion rates are incomplete andpoorly controlled in many studies, this lack of information on thekinetics of corrosion will be required from a systems standpoint.
Diurnal cycling within a CSP plant places an increased emphasison materials resistance to cycle fatigue failure. Studies on heatexchangers, for nuclear applications, have focused on the overallstrength making alloy 617 a logical choice [98,99]. The introduc-tion of thermomechanical stress in a CSP facility motivates evalu-ation of low cycle fatigue (LCF) properties. Haynes 230, a nickelalloy with high tungsten content, has excellent fatigue life charac-teristics. As a comparison, Haynes 230 has been observed to failaround 50,000 cycles at 760 "C, while 617 fails around 15,000 cy-cles [100]. This is a dramatic difference and will be important for
B.D. Iverson et al. / Applied Energy 111 (2013) 957–970 967
selection in high temperature receiver materials at a minimum forthe next generation of solar power plants.
4.5. Impact on cost goals
Comprehensive, critically reviewed costing data for the majorcomponents of a commercial sized ('10 MWe) recompression,closed-Brayton cycle for CSP applications were not found in theopen literature. Private parties interested in developing compo-nents consider costing data proprietary. To fill this cost informa-tion void, Sandia National Laboratories, Oak Ridge NationalLaboratory (ORNL), and the Department of Energy (Office of Nucle-ar Energy) are initiating research into these various costs. The re-sult of this effort is intended to be a modeling tool that predictsthe levelized cost of electricity (LCOE) for these systems and incor-porate the information into the current LCOE program that ORNLmaintains. As the working fluid operates in the supercritical phase,the turbomachinery size [35] and cost may be lower but extensiverecuperation will necessitate costly heat exchange.
Assuming similar power block costs as that for steam-Rankine,the estimated impact of the proposed Brayton cycle to achieveSunShot goals is assessed using the National Renewable EnergyLaboratory’s System Advisor Model (SAM, https://sam.nrel.gov/).Assuming a molten salt power-tower plant model and adjustingthe power block efficiency (54% gross) and receiver temperature(700 "C salt) to account for an indirect, dry-cooled, sCO2 Braytoncycle, the LCOE for a 100 MWe system has been estimated. In orderto achieve 6 ¢/kW h (real), a solar multiple of 3.1 and 16 h of stor-age is required for the following SunShot-driven system:
! Cost assumptions: site preparation = 10 [$/m2], solar field = 75[$/m2], power plant = 1,160 [$/kW], tower/receiver = 150 [$/kWt], thermal storage = 15 [$/kWt], contingency = 0%, indirect(sales tax and land) = 17.8%, interest during construction = 6.0%,O&M = 40 [$/kW yr].! SunShot financial assumptions: discount rate = 5.5%, inflation
rate = 3%, debt rate = 6%, state income tax = 5%, return onequity = 15%, debt fraction = 62%, federal tax = 35%, deprecia-tion = 5 yr MACRS, ITC = 0%.
Of particular note are the large solar multiple and 16 h of stor-age required to achieve the desired SunShot LCOE target. This re-sults in a capacity factor of 73.1% and is in the range that a directCO2 receiver/system cannot efficiently provide (see Fig. 7). Capac-ity factors of this magnitude must use the storage media in the re-ceiver, thereby requiring liquid-to-sCO2 heat exchangers of thetype pursued in this proposal for implementing sCO2 Brayton tocapitalize on the cycle efficiency benefits.
5. Conclusions
The sCO2 Brayton cycle has been shown to have significant effi-ciency benefits especially as solar-thermal power plants increasetheir operating temperatures above 600 "C. In particular, part heatload operation, common to a solar resource, appears manageableespecially for short durations (e.g. short-term cloud cover) due tothermal capacitance in the system and piping. Therefore it is rec-ommended that sCO2 Brayton cycles continue to be pursued for so-lar-thermal energy applications.
Thermal, rotational and mass losses for this prototype cyclehave been quantified and utilized to benchmark a cycle model withgood agreement. Measurement of the system performance indi-cates an efficiency of approximately 5% for the operation condi-tions selected in this work. At design conditions, this efficiency isexpected to increase to 15% using the benchmarked model pre-
sented in this work and would approach approximately 24% withminor modifications to improve insulation.
Predicted efficiencies still far short of the 50% thermal efficien-cies claimed for sCO2 at a 600 "C turbine inlet temperature. This isprimarily a limitation of the laboratory-scale demonstration tur-bine used for the present study. At around 250 kWe in size, the testfacility was intended to be large enough to confront the fundamen-tal issues for sCO2 Brayton cycle technology, but small enough tobe affordable over several years of incremental funding. For adop-tion of sCO2 in a solar-thermal power plant, a number of requiredadvances remain and are largely addressed by moving to largerequipment in 10 MWe range. For large capacity factors and indirectsystems, heat exchange between CO2 and a secondary fluid amena-ble to solar is also required. This represents a significant challengein terms of material selection as well as heat exchanger design.Improvements in bearings and seals to prevent leakage are also re-quired, especially as the system scales up from the small prototypeincluded here.
Acknowledgements
This manuscript has been authored by Sandia National Labora-tories, a multi-program laboratory managed and operated by San-dia Corporation, a wholly owned subsidiary of Lockheed MartinCorporation, for the U.S. Department of Energy’s National NuclearSecurity Administration under Contract DE-AC04-94AL85000. Theauthors would also like to thank Craig Turchi for assistance withthe economic analysis.
References
[1] Hu E, Yang Y, Nishimura A, Yilmaz F, Kouzani A. Solar thermal aided powergeneration. Appl Energy 2010;87:2881–5.
[2] Denholm P, Ela E, Kirby B, Milligan M. The role of energy storage withrenewable electricity generation. NREL/TP-6A2-47187, January 2010,National Renewable Energy Laboratory; 2010.
[3] Denholm P, Hand M. Grid flexibility and storage required to achieve very highpenetration of variable renewable electricity. Energy Policy2011;39:1817–30.
[4] Sioshansi R, Denholm P. The value of concentrating solar power and thermalenergy storage. NREL-TP-6A2-45833, February 2010, National RenewableEnergy Laboratory; 2010.
[5] Kolb GJ, Ho CK, Mancini TR, Gary JA. Power tower technology roadmap costreduction plan. SAND2011-2419, April 2011, Sandia National Laboratories,Albuquerque, NM; 2011.
[6] U.S. Department of Energy, SunShot Vision Study; 2012. <http://www1.eere.energy.gov/solar/sunshot/vision_study.html> [accessed19.07.12].
[7] Sabharwall P, Kim ES, Patterson M. Fluoride high temperature reactorintegration with industrial process applications. TEV-1160, March 29, 2011,Idaho National Laboratory, Idaho Falls, ID; 2011.
[8] Dostal V. A supercritical carbon dioxide cycle for next generation nuclearreactors. PhD thesis, Nuclear Engineering, Massachusetts Institute ofTechnology; 2004.
[9] Dostal V, Hejzlar P, Driscoll MJ. The supercritical carbon dioxide power cycle:comparison to other advanced power cycles. Nucl Technol2006;154:283–301.
[10] Chen H, Goswami DY, Stefanakos EK. A review of thermodynamic cycles andworking fluids for the conversion of low-grade heat. Renew Sust Energy Rev2010;14:3059–67.
[11] Utamura M, Tamaura Y, Hasuike H. Some alternative technologies for solarthermal power generation. In: International solar energy conference, July 8–13, 2006, Denver, CO; 2007. p. 75–84.
[12] Ma Z, Turchi C. Advanced supercritical carbon dioxide power cycleconfigurations for use in concentrating solar power systems. NREL/CP-5500-50787, National Renewable Energy Laboratory, Golden, CO; 2011.
[13] Turchi CS, Ma Z, Neises T, Wagner. Thermodynamic study of advancedsupercritical carbon dioxide power cycles for high performance concentratingsolar power systems. Energy Sustainability, July 23–26, 2012, San Diego, CA;2012.
[14] Conboy TM, Wright SA. Experimental investigations of the s-CO2 condensingBrayton cycle. In: Supercritical CO2 power cycle symposium, May 24–25,2011, Arvada, CO; 2011.
[15] Conboy TM, Wright SA, Pasch J, Fleming DD, Rochau G. Initial split-flow testresults and path forward. SAND2012-5308292, September 2011, SandiaNational Laboratories, Albuquerque, NM; 2011.
968 B.D. Iverson et al. / Applied Energy 111 (2013) 957–970

[16] Wright SA, Conboy TM, Carlson MD, Rochau G. High temperature split-flowre-compression Brayton cycle initial test results. SAND2012-5308349, July2011, Sandia National Laboratories, Albuquerque, NM; 2011.
[17] Wright SA, Fuller R, Pickard PS, Vernon ME. Initial status and test results froma supercritical CO2 Brayton cycle test loop. In: International conference onadvances in nuclear power plants, June 8–12, 2008, Anaheim, CA; 2008. p.768–5.
[18] Wright SA, Pickard PS, Fuller R, Radel RF, Vernon ME. Supercritical CO2
Brayton cycle power generation development program and initial results. In:ASME power conference, July 21–23, 2009, Albuquerque, NM; 2009.
[19] Wright SA, Radel RF, Vernon ME, Rochau GE, Pickard PS. Operation andanalysis of a supercritical CO2 Brayton Cycle. SAND2010-0171, SandiaNational Laboratories, Albuquerque, NM; 2010.
[20] Wright SA, Conboy TM, Parma EJ, Lewis TG, Rochau GA, Suo-Anttila AJ.Summary of the Sandia supercritical CO2 development program. In:Supercritical CO2 power cycle symposium, Boulder, CO; 2011.
[21] Wright SA, Fuller R, Noall J, Radel R, Vernon ME, Pickard PS. Supercritical CO2
Brayton cycle compression and control near the critical point. In:International conference on advances in nuclear power plants, June 8–12,2008, Anaheim, CA; 2008. p. 810–9.
[22] Wright SA, Pickard PS, Vernon ME, Radel RF, Fuller R. Description and testresults from a supercritical CO2 Brayton cycle development program. In: 7thInternational energy conversion engineering conference, August 2–5, 2009,Denver, CO; 2009.
[23] Wright SA, Vernon ME, Radel RF, Fuller RL. Supercritical CO2 main compressorperformance measurements. American Nuclear Society Annual Meeting andEmbedded Topical Meeting: Nuclear and Emerging Technologies for Space,June 14–18, 2009, Atlanta, GA; 2009. p. 499–500.
[24] Moisseytsev A, Sienicki JJ. Control of supercritical CO2 Brayton cycle for LFRautonomous load following. American Nuclear Society Winter Meeting,November 13–17, 2005, Washington (DC); 2005. p. 342–4.
[25] Moisseytsev A, Sienicki JJ. Automatic control strategy development for thesupercritical CO2 Brayton cycle for LFR autonomous load following. In:International congress on advances in nuclear power plants, June 4–8, 2006,Reno, NV; 2006. p. 732–41.
[26] Moisseytsev A, Sienicki JJ. Transient accident analysis of a supercriticalcarbon dioxide Brayton cycle energy converter coupled to an autonomouslead-cooled fast reactor. In: 14th International conference on nuclearengineering, ICONE 14, July 17–20, 2006, Miami, FL; 2006.
[27] Moisseytsev A, Sienicki JJ. Controllability of the supercritical carbon dioxideBrayton cycle near the critical point. In: International conference on advancesin nuclear power plants, June 8–12, 2008, Anaheim, CA; 2008. p. 799–809.
[28] Moisseytsev A, Sienicki JJ. Transient accident analysis of a supercriticalcarbon dioxide Brayton cycle energy converter coupled to an autonomouslead-cooled fast reactor. Nucl Eng Des 2008;238:2094–105.
[29] Vilim RB, Moisseytsev A. Comparative analysis of supercritical CO2 powerconversion system control schemes. In: International conference on advancesin nuclear power plants, June 8–12, 2008, Anaheim, CA; 2008. p. 820–30.
[30] Dostal V, Hejzlar P, Driscoll MJ. High-performance supercritical carbondioxide cycle for next-generation nuclear reactors. Nucl Technol2006;154:265–82.
[31] Dostal V, Hejzlar P, Todreas NE, Buongiorno J. Medium-power lead-alloy fastreactor balance-of-plant options. Nucl Technol 2004;147:388–405.
[32] Moisseytsev A, Sienicki JJ. Investigation of alternative layouts for thesupercritical carbon dioxide Brayton cycle for a sodium-cooled fast reactor.Nucl Eng Des 2009;239:1362–71.
[33] Sienicki JJ, Moisseytsev A, Cho DH, Momozaki Y, Kilsdonk DJ, Haglund RC,et al. Supercritical carbon dioxide Brayton cycle energy conversion forsodium-cooled fast reactors/advanced burner reactors. GLOBAL 2007:Advanced Nuclear Fuel Cycles and Systems, September 9–13, 2007, Boise,ID; 2007. p. 1298–307.
[34] Persichilli M, Held T, Hostler S, Zdankiewicz E, Klapp D. Transforming wasteheat to power through development of a CO2-based power cycle. ElectricPower Expo, May 10–12, 2011, Rosemount, IL; 2011.
[35] Persichilli M, Kacludis A, Zdankiewicz E, Held T. Supercritical CO2 power cycledevelopments and commercialization: why sCO2 can displace steam. Power-Gen India and Central Asia, April 19–21, 2012, Pragati Maidan, New Delhi,India; 2012.
[36] Chacartegui R, Muñoz de Escalona JM, Sánchez D, Monje B, Sánchez T.Alternative cycles based on carbon dioxide for central receiver solar powerplants. Appl Therm Eng 2011;31:872–9.
[37] Southwest Research Institute, Department of Energy, Sunshot Initiative, 2012,Supercritical carbon dioxide turbo-expander and heat exchangers. <http://www1.eere.energy.gov/solar/sunshot/csp_sunshotrnd_swri_exchangers.html> [accessed 30.05.13].
[38] Angelino G. Carbon dioxide condensation cycles for power production. J EngPower 1968;90:287–96.
[39] Pasch J, Conboy TM, Fleming DD, Rochau G. Supercritical CO2 recompressionBrayton cycle: completed assembly description. SAND2012-9546, October2012, Sandia National Laboratories, Albuquerque, NM; 2012.
[40] Wright SA, Conboy TM, Rochau G. Break-even power transients for twosimple recuperated S-CO2 Brayton cycle test configurations. In: S-CO2 powercycle symposium, May 24–24, 2011, Boulder, CO; 2011.
[41] Bruckner RJ. Windage power loss in gas foil bearings and the rotor-statorclearance of high speed generators operating in high pressure environments.
NASA/TM-2009-215826 November 2009, NASA, Glenn Research Center,Cleveland, OH; 2009.
[42] Conboy TM. Gas bearings and seals development for supercritical CO2
turbomachinery. SAND2012-8895, Sandia National Laboratories,Albuquerque, NM; 2012.
[43] Schlichting H, Gersten K. Boundary-layer theory. 8th ed. New York: Springer;2000.
[44] Vrancik JE. Prediction of windage power loss in alternators. NASA TN D-4849,October 1968, NASA Technical Note, Lewis Research Center, Cleveland, OH;1968.
[45] Lemmon EW, Huber ML, McLinden MO. NIST reference fluid thermodynamicand transport properties – REFPROP v9.0. User’s Guide, NIST StandardReference; Database 23, 2010.
[46] Angelino G. Real gas effects in carbon dioxide cycles. ASME In: Internationalgas tourbine conference and products show GT-102, March 10–13, 1969,Cleveland, OH; 1969.
[47] Sienicki JJ, Moisseytsev A, Fuller RL, Wright SA, Pickard PS. Scaledependencies of supercritical carbon dioxide Brayton cycle technologiesand the optimal size for a next-step supercritical CO2 cycle demonstration. In:SCO2 power cycle symposium, May 24–25, 2011, Boulder, CO; 2011.
[48] Kelly B. Advanced thermal storage for central receivers with supercriticalcoolants. Grant DE-FG36-08GO18149, Abengoa Solar; 2010.
[49] Clark DE, Mizia RE. Diffusion welding of alloys for molten salt service – statusreport. INL/EXT-12-24589, May 2012, Idaho National Laboratory, Idaho Falls,ID; 2012.
[50] Heatric, Heat Exchangers. <http://www.heatric.com/> [accessed 06.02.12].[51] Sabharwall P, Kim ES, McKellar M, Anderson N, Patterson M. Process heat
exchanger options for the advanced high temperature reactor. INL/EXT-11-21584, June 2011, Idaho National Laboratory, Idaho Falls, ID; 2011.
[52] Sabharwall P, Kim ES, Siahpush A, Anderson N, Glazoff M, Phoenix B, et al.Feasibility study of secondary heat exchanger concepts for the advanced hightemperature reactor. INL/EXT-11-23076, September 2011, Idaho NationalLaboratory, Idaho Falls, ID; 2011.
[53] Reed CB, Momozaki Y, Chojnowski DB, Sienicki JJ. Progress report on small-scale experiment designs for the investigation of fundamental phenomena incompact sodium heat exchangers. ANL-ARC-210, September 30, 2011,Argonne National Laboratory; 2011.
[54] Momozaki Y, Cho DH, Sienicki JJ, Moisseytsev A. Experimental investigationson sodium plugging in narrow flow channels. Nucl Technol2010;171:153–60.
[55] Sienicki J, Moisseytsev A, Cho D, Thomas M, Vilim R, Momozaki Y, et al. Recentresearch and development on the supercritical carbon dioxide Brayton cycleat Argonne National Laboratory – Presentation. In: Supercritical CO2 powercycle symposium, Rensselaer Polytechnic Institute, Troy, NY; 2009.
[56] Janz GJ, Allen CB, Downey JR, Tomkins RPT. Physical properties datacompilations relevant to energy storage. I. Molten salts: eutectic data.NSRDS-NBS 61-I, National Standard Reference Data System, National Bureauof Standards; 1978.
[57] Rochau G. Estimated percentage cost of heat exchangers for sCO2 Braytonpower cycle. Personal Communication ed; 2012.
[58] Carlson MD, Kruizenga A, Anderson MH, Corradini M. Measurements of heattransfer and pressure drop characteristics of supercritical carbon dioxideflowing in zig-zag printed circuit heat exchanger channels. In: SupercriticalCO2 Power Cycle Symposium, May 24–25, 2011, Boulder, CO; 2011.
[59] Carlson MD, Kruizenga AM, Anderson MH, Corradini ML. Heat transfer andpressure drop of supercritical carbon dioxide flowing in several printedcircuit heat exchanger channel patterns. In: International congress onadvances in nuclear power plants, June 24–28, 2012, Chicago, IL; 2012.
[60] Fatima R, Kruizenga A, Anderson M, Ranjan D. Numerical investigation ofthermal hydraulic behavior of supercritical carbon dioxide in compact heatexchangers. In: Supercritical CO2 power cycle symposium, May 24–25, 2011,Boulder, CO; 2011.
[61] Ishizuka T, Kato Y, Muto Y, Nikitin K, Tri Lam N. Thermal-hydrauliccharacteristics of a printed circuit heat exchanger in a supercritical CO2
loop. Bull Res Lab Nucl React 2006;30:109–16.[62] Kim DE, Kim MH, Cha JE, Kim SO. Numerical investigation on thermal–
hydraulic performance of new printed circuit heat exchanger model. Nucl EngDes 2008;238:3269–76.
[63] Kim IH, No HC, Lee JI, Jeon BG. Thermal hydraulic performance analysis of theprinted circuit heat exchanger using a helium test facility and CFDsimulations. Nucl Eng Des 2009;239:2399–408.
[64] Kruizenga AM, Anderson M, Corradini M. Mini-channel supercritical CO2 heattransfer measurements for Brayton cycle regenerators. In: 17th Internationalconference on nuclear engineering, ICONE17 July 12–16, 2009, Brussels,Belgium; 2009. p. 787–92.
[65] Kruizenga AM, Anderson M, Fatima R, Corradini M, Towne A, Ranjan D, et al.Heat transfer of supercritical carbon dioxide in printed circuit heat exchangergeometries. J Therm Sci Eng Appl 2011:3.
[66] Li H, Kruizenga A, Anderson M, Corradini M, Luo Y, Wang H, et al.Development of a new forced convection heat transfer correlation for CO2
in both heating and cooling modes at supercritical pressures. Int J Therm Sci2011;50:2430–42.
[67] Ngo TL, Kato Y, Nikitin K, Ishizuka T. Heat transfer and pressure dropcorrelations of microchannel heat exchangers with S-shaped and zigzag finsfor carbon dioxide cycles. Exp Therm Fluid Sci 2007;32:560–70.
B.D. Iverson et al. / Applied Energy 111 (2013) 957–970 969

[68] Ngo TL, Kato Y, Nikitin K, Tsuzuki N. New printed circuit heat exchanger withS-shaped fins for hot water supplier. Exp Therm Fluid Sci 2006;30:811–9.
[69] Nikitin K, Kato Y, Ngo L. Printed circuit heat exchanger thermal–hydraulicperformance in supercritical CO2 experimental loop. Int J Refrige2006;29:807–14.
[70] Tsuzuki N, Kato Y, Ishisuka T. High performance printed circuit heatexchanger. Appl Therm Eng 2007;27:1702–7.
[71] Tsuzuki N, Kato Y, Nikitin K, Ishizuka T. Advanced microchannel heatexchanger with S-shaped fins. J Nucl Sci Technol 2009;46:403–12.
[72] Abramov AV, Polovov IB, Volkovich VA, Rebrin OI, Griffiths TR, May I, et al.Spectroelectrochemical study of stainless steel corrosion in NaCl–KCl melt.In: 17th International symposium on molten salts and ionic liquids – 218thECS Meeting, October 10–15, 2010, Las Vegas, NV; 2010. p. 277–85.
[73] Bradshaw RW. Corrosion of 304SS by molten NaNO3–KNO3 in a thermalconvection loop. SAND80-8856, Sandia National Laboratories; 1980.p. 40.
[74] Bradshaw RW, Goods SH. Accelerated corrosion testing of a nickel-base alloyin a molten salt. SAND2001-8758, Sandia National Laboratories, Albuquerque,NM; 2001.
[75] Susskind H, Hill FB, Green L, Kalish S, Kukacka LE, McNulty WE, et al.Corrosion studies for a fused salt–liquid metal extraction process for theliquid metal fuel reactor. BNL 585, Brookhaven National Laboratory; 1960.
[76] Williams DF, Wilson DF, Toth LM, Caja J, Keiser JR. Research on moltenfluorides as high temperature heat transfer agents. GLOBAL 2003, November20, 2003, New Orleans, Louisiana; 2003.
[77] Indacochea JE, Smith JL, Litko KR, Karell EJ. Corrosion performance of ferrousand refractory metals in molten salts under reducing conditions. J Mater Res1999;14:1990–5.
[78] Cao G, Firouzdor V, Sridharan K, Anderson M, Allen TR. Corrosion of austeniticalloys in high temperature supercritical carbon dioxide. Corros Sci2012;60:246–55.
[79] Moore R, Conboy TM. Metal corrosion in a supercritical CO2/liquid sodiumpower cycle. SAND2012-0184, Sandia National Laboratories, Albuquerque,NM; 2012.
[80] Gomez JC. Degradation mechanisms and development of protective coatingsfor TES and HTF containment materials. SunShot Lab Proposal DevelopmentProcess, National Renewable Energy Laboratory; 2012.
[81] Personal communication with Robert Bruckner and Chris DellaCorte, NASAGlenn Research Center; 2012.
[82] Moore RC, Conboy TM. Metal corrosion in a supercritical carbon dioxide –liquid sodium power cycle. SAND2012-0184, Sandia National Laboratories,Albuquerque, NM; 2012.
[83] Bradshaw RW. Oxidation and chromium depletion of alloy 800 and 316 SS bymolten NaNO3–KNO3 at temperatures above 600 degrees centigrade.SAND86-9009, Sandia National Laboratories, Livermore CA; 1987.
[84] Frangini S. Corrosion of metallic stack components in molten carbonates:critical issues and recent findings. J Power Sour 2008;182:462–8.
[85] Grabke HJ, Reese E, Spiegel M. The effects of chlorides, hydrogen chloride, andsulfur dioxide in the oxidation of steels below deposits. Corros Sci1995;37:1023–43.
[86] Goods SH, Bradshaw RW, Clift MJ, Boehme DR. The effect of silicon on thecorrosion characteristics of 2–1/4Cr–1Mo Steel in molten nitrate salt.SAND97-8269, Sandia National Laboratories, Livermore, CA; 1997.
[87] Zeng CL, Liu Y. A comparative study of the corrosion behavior of threestainless steels in an eutectic (Li, Na, K)2CO3 melt with and without (Na, K)Cladditives at 973 K in air. High Temp Mater Process 2011;30:161–9.
[88] Nishikata A, Numata H, Tsuru T. Electrochemistry of molten salt corrosion.Mater Sci Eng A 1991;A146:15–31.
[89] Littlewood R, Argent EJ. Electrochemical studies of the behaviour of metals infused chlorides. Electrochim Acta 1961;4:155–69.
[90] Williams DF. Assessment of candidate molten salt coolants for the NGNP/NHIheat-transfer loop. ORNL/TM-2006/69, Oak Ridge National Laboratory; 2006.
[91] Williams DF, Toth LM, Clarno KT. Assessment of candidate molten saltcoolants for the advanced high-temperature reactor (AHTR). ORNL/TM-2006/12, Oak Ridge National Laboratories; 2006.
[92] Olson L. Materials corrosion in molten LiF-NaF-KF eutectic salt, Doctor ofPhilosophy Thesis, Nuclear Engineering, University of Wisconsin-Madison,Madison, Wisconsin; 2009.
[93] Ambrosek J. Molten chloride salts for heat transfer in nuclear systems. Doctorof Philosophy thesis, Nuclear Engineering and Engineering Physics, Universityof Wisconsin-Madison, Madison, WI; 2011.
[94] DeVan JH, Evans RB. Corrosion behavior of reactor materials in fluoride saltmixtures. ORNL-TM-328, Oak Ridge National Laboratory, Oak Ridge, TN;1962.
[95] Coyle RT, Thomas TM, Lai GY. Exploratory corrosion tests on alloys in moltensalts at 900 degrees C. J Mater Energy Syst 1986;7:345–52.
[96] Kruizenga A. Corrosion mechanisms in chloride and carbonate salts.SAN2012-7594, September 2012, Sandia National Laboratories, LivermoreCA; 2012.
[97] Indacochea JE, Smith JL, Litko KR, Karell EJ, Raraz AG. High-temperatureoxidation and corrosion of structural materials in molten chlorides. Oxid Met2001;55:1–16.
[98] Li X, Le Pierres R, Dewson SJ. Heat exchangers for the next generation ofnuclear reactors. In: International congress on advances in nuclear powerplants, ICAPP, June 4–8, 2006, Reno, NV, United States; 2006. p. 201–9.
[99] Li X, Kininmont D, Le Pierces R, Dewson SJ. Alloy 617 for the high temperaturediffusion-bonded compact heat exchangers. In: International conference onadvances in nuclear power plants, ICAPP, June 8–12, 2008, Anaheim, CA;2008. p. 282–8.
[100] Haynes International, Haynes 230 Alloy; 2007.
970 B.D. Iverson et al. / Applied Energy 111 (2013) 957–970