Embed Size (px)
Citation preview

ANL-ARC-223
Extension of the Supercritical Carbon Dioxide Brayton Cycle to Low Reactor Power Operation: Investigations using the Coupled ANL Plant Dynamics Code-SAS4A/SASSYS-1 Liquid Metal Reactor Code System
Nuclear Engineering Division

About Argonne National Laboratory Argonne is a U.S. Department of Energy laboratory managed by UChicago Argonne, LLC under contract DE-AC02-06CH11357. The Laboratory’s main facility is outside Chicago, at 9700 South Cass Avenue, Argonne, Illinois 60439. For information about Argonne, see http://www.anl.gov.
Availability of This Report This report is available, at no cost, at http://www.osti.gov/bridge. It is also available on paper to the U.S. Department of Energy and its contractors, for a processing fee, from: U.S. Department of Energy Office of Scientific and Technical Information P.O. Box 62 Oak Ridge, TN 37831-0062 phone (865) 576-8401 fax (865) 576-5728 [email protected]
Disclaimer This report was prepared as an account of work sponsored by an agency of the United States Government. Neither the United States Government nor any agency thereof, nor UChicago Argonne, LLC, nor any of their employees or officers, makes any warranty, express or implied, or assumes any legal liability or responsibility for the accuracy, completeness, or usefulness of any information, apparatus, product, or process disclosed, or represents that its use would not infringe privately owned rights. Reference herein to any specific commercial product, process, or service by trade name, trademark, manufacturer, or otherwise, does not necessarily constitute or imply its endorsement, recommendation, or favoring by the United States Government or any agency thereof. The views and opinions of document authors expressed herein do not necessarily state or reflect those of the United States Government or any agency thereof, Argonne National Laboratory, or UChicago Argonne, LLC.

ANL-ARC-223
Extension of the Supercritical Carbon Dioxide Brayton Cycle to Low Reactor Power Operation: Investigations using the Coupled ANL Plant Dynamics Code-SAS4A/SASSYS-1 Liquid Metal Reactor Code System
Anton Moisseytsev and James J. Sienicki Nuclear Engineering Division Argonne National Laboratory April 30, 2012


Extension of the Supercritical Carbon Dioxide Brayton Cycle to Low Reactor Power Operation: Investigations using the Coupled ANL Plant Dynamics Code-SAS4A/SASSYS-1 Liquid Metal Reactor Code System April 30, 2012
ANL-ARC-223 i
ABSTRACT
Significant progress has been made on the development of a control strategy for the supercritical carbon dioxide (S-CO2) Brayton cycle enabling removal of power from an autonomous load following Sodium-Cooled Fast Reactor (SFR) down to decay heat levels such that the S-CO2 cycle can be used to cool the reactor until decay heat can be removed by the normal shutdown heat removal system or a passive decay heat removal system such as Direct Reactor Auxiliary Cooling System (DRACS) loops with DRACS in-vessel heat exchangers. This capability of the new control strategy eliminates the need for use of a separate shutdown heat removal system which might also use supercritical CO2. It has been found that this capability can be achieved by introducing a new control mechanism involving shaft speed control for the common shaft joining the turbine and two compressors following reduction of the load demand from the electrical grid to zero. Following disconnection of the generator from the electrical grid, heat is removed from the intermediate sodium circuit through the sodium-to-CO2 heat exchanger, the turbine solely drives the two compressors, and heat is rejected from the cycle through the CO2-to-water cooler. To investigate the effectiveness of shaft speed control, calculations are carried out using the coupled Plant Dynamics Code-SAS4A/SASSYS-1 code for a linear load reduction transient for a 1000 MWt metallic-fueled SFR with autonomous load following. No deliberate motion of control rods or adjustment of sodium pump speeds is assumed to take place. It is assumed that the S-CO2 turbomachinery shaft speed linearly decreases from 100 to 20% nominal following reduction of grid load to zero. The reactor power is calculated to autonomously decrease down to 3% nominal providing a lengthy window in time for the switchover to the normal shutdown heat removal system or for a passive decay heat removal system to become effective. However, the calculations reveal that the compressor conditions are calculated to approach surge such that the need for a surge control system for each compressor is identified. Thus, it is demonstrated that the S-CO2 cycle can operate in the initial decay heat removal mode even with autonomous reactor control. Because external power is not needed to drive the compressors, the results show that the S-CO2 cycle can be used for initial decay heat removal for a lengthy interval in time in the absence of any off-site electrical power. The turbine provides sufficient power to drive the compressors. Combined with autonomous reactor control, this represents a significant safety advantage of the S-CO2 cycle by maintaining removal of the reactor power until the core decay heat falls to levels well below those for which the passive decay heat removal system is designed. The new control strategy is an alternative to a split-shaft layout involving separate power and compressor turbines which had previously been identified as a promising approach enabling heat removal from a SFR at low power levels. The current results indicate that the split-shaft configuration does not provide any significant benefits for the S-CO2 cycle over the current single-shaft layout with shaft speed control. It has been demonstrated that when connected to the grid the single-shaft cycle can effectively follow the load over

Extension of the Supercritical Carbon Dioxide Brayton Cycle to Low Reactor Power Operation: Investigations using the Coupled ANL Plant Dynamics Code-SAS4A/SASSYS-1 Liquid Metal Reactor Code
System April 30, 2012
ii ANL-ARC-223
the entire range. No compressor speed variation is needed while power is delivered to the grid. When the system is disconnected from the grid, the shaft speed can be changed as effectively as it would be with the split-shaft arrangement. In the split-shaft configuration, zero generator power means disconnection of the power turbine, such that the resulting system will be almost identical to the single-shaft arrangement. Without this advantage of the split-shaft configuration, the economic benefits of the single-shaft arrangement, provided by just one turbine and lower losses at the design point, are more important to the overall cycle performance. Therefore, the single-shaft configuration shall be retained as the reference arrangement for S-CO2 cycle power converter preconceptual designs. Improvements to the ANL Plant Dynamics Code have been carried out. The major code improvement is the introduction of a restart capability which simplifies investigation of control strategies for very long transients. Another code modification is transfer of the entire code to a new Intel Fortran complier; the execution of the code using the new compiler was verified by demonstrating that the same results are obtained as when the previous Compaq Visual Fortran compiler was used.

Extension of the Supercritical Carbon Dioxide Brayton Cycle to Low Reactor Power Operation: Investigations using the Coupled ANL Plant Dynamics Code-SAS4A/SASSYS-1 Liquid Metal Reactor Code System April 30, 2012
ANL-ARC-223 iii
Table of Contents ABSTRACT ......................................................................................................................... i
List of Figures .................................................................................................................... iv
List of Tables ..................................................................................................................... iv
1 Introduction .....................................................................................................................1
2 ANL Plant Dynamics Code Improvements .....................................................................3
2.1 Restart Capability.....................................................................................................3 2.2 Transition to Intel Fortran Compiler ........................................................................6
3 Dynamics Studies of the S-CO2 Cycle with the Plant Dynamics Code: Operation of a S-CO2 Cycle in a Reactor Decay Heat Removal Mode ........................................8
3.1 Simulation and First Results ....................................................................................8 3.2 Discussion of Results .............................................................................................17 3.3 Calculations with the Detailed Maps .....................................................................20
4 Discussion of Split-Shaft Configuration .......................................................................31
5 Summary and the Importance of the Results .................................................................34
Acknowledgements ............................................................................................................36
References ..........................................................................................................................37

Extension of the Supercritical Carbon Dioxide Brayton Cycle to Low Reactor Power Operation: Investigations using the Coupled ANL Plant Dynamics Code-SAS4A/SASSYS-1 Liquid Metal Reactor Code
System April 30, 2012
iv ANL-ARC-223
LIST OF FIGURES
Figure 2-1. Comparison of the Transient Results from the Two Compilers. ......................7 Figure 3-1. Transient Results with Turbomachinery Speed Reduction. ............................11 Figure 3-2. Extrapolated Flow Rate from the Turbomachinery Maps. ..............................18 Figure 3-3. Turbomachinery Speed Reduction Transient Results with Detailed Maps. ...25 Figure 4-1. Single-Shaft (Top) and Split-Shaft (Bottom) Turbomachinery
Arrangements. .....................................................................................................32
LIST OF TABLES
Table 3-1. Comparison of General and Detailed Maps .....................................................22

Extension of the Supercritical Carbon Dioxide Brayton Cycle to Low Reactor Power Operation: Investigations using the Coupled ANL Plant Dynamics Code-SAS4A/SASSYS-1 Liquid Metal Reactor Code System April 30, 2012
ANL-ARC-223 1
1 Introduction In FY 2011, an analysis was initiated on investigation of the possibility of operation of a supercritical carbon dioxide (S-CO2) Brayton cycle under low reactor power conditions [1]. The analysis was carried out using the ANL Plant Dynamics Code (PDC) coupled to SAS4A/SASSYS-1 code. The system investigated included a S-CO2 cycle power converter coupled to a ABR-1000 SFR reactor. The ultimate goal of that study was to find control conditions for the S-CO2 cycle which would allow cycle operation at reactor power levels characteristic of the decay heat generation rate, i.e., around 6% nominal power and lower. It has been shown that using the cycle control strategy designed for load following together with autonomous reactor operation, the reactor power could be reduced to approximately 28% of the full power level. Further control studies demonstrated that if the usual cycle control mechanisms would be used beyond the range necessary for load following, the reactor power could indeed be reduced to approximately the 6% level. However, that cycle operation mode was so ineffective that in order to maintain the operation of the S-CO2 compressors to keep CO2 circulating in the cycle, a net power input of about 20% of the nominal plant capacity (i.e., about 80 MWe for a 400 MWe ABR-1000 plant) would be needed to ensure coolability of the reactor in the decay heat mode. Clearly, it would be too expensive to operate a plant in that regime and an alternative approach needed to be identified. One such approach that appeared promising was the incorporation of a split shaft variation of the S-CO2 cycle involving a power turbine driving the generator on one shaft and a second separate compressor turbine driving the two compressors on an independent second shaft. It was also stated in the concluding remarks to the FY2011 study that the decay heat removal operation was started from the conditions of zero net power output to the electrical grid (as would be the case in a real plant which will be disconnected from the grid prior to non-emergency shutting down of the reactor). However, the control study in FY2011 was carried out with a control strategy assuming that the rotational speed of the turbomachinery (turbine and compressors) would still be maintained at the normal grid frequency. It was noted that it was just an assumption to simplify the calculation by using the synchronous (i.e., fixed speed) turbomachinery maps; in reality, that assumption would not be required once the plant is disconnected from the grid and the generator speed is no longer dictated by the grid. Study of S-CO2 cycle operation under low power/decay heat level reactor conditions has been continued in FY2012 to investigate the effect of the turbomachinery rotational speed on cycle operation and performance. The objective is to determine if changing the turbomachinery rotational speed can facilitate heat removal from an autonomous load following SFR down to decay heat levels. While the generator is connected to the grid, the rotational speed of the turbomachinery is effectively locked to that required to maintain synchronicity of the electric current generated with the frequency on the grid. The turbine throttle valve upstream of the turbine can be operated to change the turbine

Extension of the Supercritical Carbon Dioxide Brayton Cycle to Low Reactor Power Operation: Investigations using the Coupled ANL Plant Dynamics Code-SAS4A/SASSYS-1 Liquid Metal Reactor Code
System April 30, 2012
2 ANL-ARC-223
inlet pressure while the rotational speed remains fixed. Following disconnection from the grid, the turbomachinery rotational speed is no longer constrained by the grid frequency. Operating the turbine throttle valve serves to change both the rotational frequency of the turbomachinery on the shaft as well as the turbine inlet pressure. During the course of conducting the investigations, some modifications were introduced into the PDC. Those developments are described first in the next section followed by the results of the transient analysis utilizing the PDC coupled to the SAS4A/SASSYS-1 Liquid Metal Reactor Code System.

Extension of the Supercritical Carbon Dioxide Brayton Cycle to Low Reactor Power Operation: Investigations using the Coupled ANL Plant Dynamics Code-SAS4A/SASSYS-1 Liquid Metal Reactor Code System April 30, 2012
ANL-ARC-223 3
2 ANL Plant Dynamics Code Improvements In FY2012, Plant Dynamics Code development has continued. However, the improvements to the code are minor and are related to the code project organization and improved user convenience. None of the code modifications introduced in FY2012 affected the computational part of the code. Therefore, the results obtained earlier with the PDC are still valid after the FY12 improvements. Two major developments to the PDC in FY12 are: introduction of a restart capability and transition to Intel Fortran Compiler. Those two developments are discussed below.
2.1 Restart Capability
A restart capability has been incorporated into the Plant Dynamics Code. That capability saves all the variables used in dynamics calculations to a binary file. This file can later be read by the code and the calculations can be continued (“restarted”) from the time at which the restart file was created. This capability is very similar to the restart capability of SAS4A/SASSYS-1 code. The restart files can be created at several time points during a transient run. A user input is introduced to specify at what times the restart files are created. The files are saved in a “Dynamic\Data\Output\” folder and their names include the time at which the files were created. For example, restart files “Restart_r1_t1200.bin” and “Restart_r1_t1500.bin” are created at 1,200 s and 1,500 s into a transient, respectively. A user can choose to start the dynamics calculations from any of those points in time. To do that, a user needs to copy the restart file into the “Dynamic\Data\Input\” directory and provide the restart file name in the “Dynamic_dat.txt” input file. Two directories where the restart files are created and are read from (Output and Input) are intentionally selected to be different to preclude accidental rewriting of a restart file by the code. When the PDC code is run in coupled mode with the SAS4A/SASSYS-1 code, a restart file from SAS4A/SASSYS-1 is also saved along with the PDC restart file. The SAS4A/SASSYS-1 restart file is created automatically after each run; i.e., after each time step when SAS4A/SASSYS-1’s execution is called from the PDC in transient calculations. That SAS4A/SASSYS-1 restart file is now automatically copied into the same directory as the PDC restart file and is distinguished by the addition of “_SAS” at the end of its name. That file should also be copied by a user into the “Input” folder to be read for restart. Since the previously developed PDC-SAS4A/SASSYS-1 coupling scheme relies on the SAS4A/SASSYS-1 restart file to do step-by-step calculations, no other special provisions were necessary to restart SAS4A/SASSYS-1 calculations from the specified time, as long as the correct restart file is read.

Extension of the Supercritical Carbon Dioxide Brayton Cycle to Low Reactor Power Operation: Investigations using the Coupled ANL Plant Dynamics Code-SAS4A/SASSYS-1 Liquid Metal Reactor Code
System April 30, 2012
4 ANL-ARC-223
Below is listed the beginning portion of the “Dynamic_dat.txt” file with the modification highlighted to enable use of the restart capability. Two lines of input parameters were added to the input file. The first line specifies if the restart capability should be used. If “0” is entered, the rest of the restart input in this line is ignored, and the calculations proceed as before; i.e., starting from steady-state calculations followed by the full transient calculations. If “1” is entered here, then the restart capability is used. In this case, the names of the restart files, for the PDC and SAS4A/SASSYS-1, respectively, separated by “ \ ” in sequence, should be provided. The other line added to the input file (highlighted at the end of the listing below) specifies at which times the restart files are created during the transient run. A user can specify currently up to 20 times; the restart files will be created with names containing “_t####”, where “####” is replaced with the time into the transient when the files are created. In addition, a restart file is automatically created at the end of the transient calculations. Note that this input is used regardless of the restart input in Line 1. In other words, the restart files will be saved at the specified times even if the calculations are not proceeded from the restart.
In the current code arrangement, the restart files can theoretically be saved after each and every time step. However, the file name will only include the transient time rounded up to a nearest integer. Because of that, the saved times should be at least 1 s apart; for example restart at 10.3 s, created as the “…_t10” file, would overwrite the file created at 9.8 s. That limitation only arises because of the selected restart file name convention; it can be relaxed in future, if writing files more frequently becomes important. The restart capability in the PDC was created to allow more effective investigation of transient cycle behavior. One of the possible examples where the restart capability would help is an optimization of a control strategy towards the end of a fairly long transient, such as during operation at decay heat levels discussed below in this report. With the restart, the effect of the variation in the control system parameters can be calculated at any time in the transient without the need to repeat the entire transient history (provided that the change does not affect earlier results). For example, in the current control logic, the turbine throttling control is not activated until the electrical grid load falls below 50%. So, in a load reduction transient, a restart file can be created just before the load reaches
************* Input data for dynamic calculations ******************* Use (=1) restart file? and restart file names (PDC \ SAS), if used 1 Restart_r1_t1200.bin \ Restart_r1_t1200_SAS.bin Simulation time, s 1600 3000 Time to obtain SS (not included into simulation time), s 200 Time step (initial), s 0.001 Report every N calculations 500 Minimum time change between reported points 1 Times to save restart file (up to 20) (end time is always saved) 0 1200 2100 2200 2400 2600 2800 3000

Extension of the Supercritical Carbon Dioxide Brayton Cycle to Low Reactor Power Operation: Investigations using the Coupled ANL Plant Dynamics Code-SAS4A/SASSYS-1 Liquid Metal Reactor Code System April 30, 2012
ANL-ARC-223 5
50%, and this restart file can be used to begin further calculations form this time to optimize the response of the turbine throttling control. In this example, repeating calculations before reaching 50% load, including the steady-state initialization, would not be needed saving significant time in control optimization. In order to provide the capability to change input parameters after a restart, the input files for the dynamic calculations, including the Brayton cycle control parameters, are read after the restart files are read. Therefore, the input parameters are naturally replaced with those provided in the input files. For example, to investigate the effect of various PID control coefficients on the transient behavior of the system, a user will change those coefficients in the input file before resuming the calculations using the restart option. In addition, similar modifications can be made in the SAS4A/SASSYS-1 input file, if changes in the reactor-side conditions are needed. Similar to the input files, the turbomachinery maps are also read after the restart files (the turbomachinery maps data is not saved in the restart file). This approach, in theory, allows using different maps for various parts of a transient. However, that option should be used with caution to make sure that switching between the maps does not affect, at least to a significant degree, the transient results prior to the restart time. In addition to more effective transient simulation, using the restart capability eliminates the need to repeat steady-state calculations every time for each transient. If the restart file is saved at time = 0, the full transient can still be run without any limitations on the transient itself. It is noted however, that the restart capability cannot be used to investigate the effect of the design modifications (e.g., number of high temperature recuperator (HTR) modules), since those changes would alter the results of the steady-state calculations. For this reason, the input files for the steady-state part of the code are not re-read after the restart. The restart capability was created with help from J. Floyd from CEA who previously created a similar capability in the PDC. However, Floyd’s version only saved the steady-state variables to avoid repeating the steady-state calculations. The current development extended that capability to allow restart at any point in transient, including at time zero which would effectively simulate Floyd’s version. The restart capability was tested in a single transient, for which a restart file was created in a middle of the run and calculations were continued. On the next run, the calculations were restarted from the saved time, and the results were compared against those obtained in the full transient run. Those results were identical, up to all significant digits printed in the output files. This identity is achieved by using unformatted binary files for restart, such that all the variables are saved exactly as they are stored in the memory; i.e. without any loss in accuracy.

Extension of the Supercritical Carbon Dioxide Brayton Cycle to Low Reactor Power Operation: Investigations using the Coupled ANL Plant Dynamics Code-SAS4A/SASSYS-1 Liquid Metal Reactor Code
System April 30, 2012
6 ANL-ARC-223
2.2 Transition to Intel Fortran Compiler
The PDC was originally developed in the Compaq Visual Fortran environment. However, a license for this software is being phased out by the ANL Nuclear Engineering (NE) Division. Consequently, a switch to Intel Fortran software is being gradually made within ANL/NE. The PDC project had to be recreated in the Intel compiler since it couldn’t read Compaq project files. In addition, some modifications were needed in the coding itself for the differences between the two compilers. Those code modifications are minor and are mostly limited to formatting, such as use of parentheses in “print” statements. The transition to Intel Compiler was verified by running the transient which was last run in the Compaq Compiler. Figure 2-1 compares the results, obtained with the two compilers, for a few calculated parameters, both on the S-CO2 and reactor sides.1 Figure 2-1 shows that the results obtained with the two compilers are virtually identical.t is observed that the PDC code runs a little faster with the Intel compiler, but reading/writing files takes a little more time than before,2 so the overall time is about the same for the PDC code.
1 Note that reactor side is calculated with a SAS4A/SASSYS-1 executable file, so changing the compiler only affected the PDC subroutines. 2 Change in file operation speed can be caused by switching to Windows 7 (from Windows XP) which was done at the same time as switching to Intel Compiler.

Extension of the Supercritical Carbon Dioxide Brayton Cycle to Low Reactor Power Operation: Investigations using the Coupled ANL Plant Dynamics Code-SAS4A/SASSYS-1 Liquid Metal Reactor Code System April 30, 2012
ANL-ARC-223 7
Compaq Compiler Intel Compiler
Figure 2-1. Comparison of the Transient Results from the Two Compilers.
0
0.2
0.4
0.6
0.8
1
1.2
0 200 400 600 800 1000 1200 1400 1600 1800 2000 2200 2400POW
ER,
FRA
CTIO
N O
F FU
LL R
EACT
OR
POW
ER
TIME, s
HEAT BALANCE IN RHX
Q_RHX_Rx
Q_RHX_CO2
0
0.2
0.4
0.6
0.8
1
1.2
0 200 400 600 800 1000 1200 1400 1600 1800 2000 2200 2400POW
ER,
FRA
CTIO
N O
F FU
LL R
EACT
OR
POW
ER
TIME, s
HEAT BALANCE IN RHX
Q_RHX_Rx
Q_RHX_CO2
30.9
31.4
31.9
32.4
32.9
33.4
33.9
34.4
34.9
35.4
0 200 400 600 800 1000 1200 1400 1600 1800 2000 2200 2400
TEM
PERA
TURE
, o C
TIME, s
COMPRESSOR #1 INLET TEMPERATURE
T_c_i
T_crit
30.9
31.4
31.9
32.4
32.9
33.4
33.9
34.4
34.9
35.4
0 200 400 600 800 1000 1200 1400 1600 1800 2000 2200 2400
TEM
PERA
TURE
, o C
TIME, s
COMPRESSOR #1 INLET TEMPERATURE
T_c_i
T_crit
-0.15
-0.10
-0.05
0.00
0.05
0.10
0.15
0 200 400 600 800 1000 1200 1400 1600 1800 2000 2200 2400
REA
CTIV
ITY,
$
TIME, s
CORE REACTIVITY
NET EXTERNAL DOPPLER AX. EXP.
RAD. EXP. CRDL EXP. COOLANT
-0.15
-0.10
-0.05
0.00
0.05
0.10
0.15
0 200 400 600 800 1000 1200 1400 1600 1800 2000 2200 2400
REA
CTIV
ITY,
$
TIME, s
CORE REACTIVITY
NET EXTERNAL DOPPLER AX. EXP.
RAD. EXP. CRDL EXP. COOLANT

Extension of the Supercritical Carbon Dioxide Brayton Cycle to Low Reactor Power Operation: Investigations using the Coupled ANL Plant Dynamics Code-SAS4A/SASSYS-1 Liquid Metal Reactor Code
System April 30, 2012
8 ANL-ARC-223
3 Dynamics Studies of the S-CO2 Cycle with the Plant Dynamics Code: Operation of a S-CO2 Cycle in a Reactor Decay Heat Removal Mode
To continue the study of S-CO2 cycle operation and performance under conditions of low heat removal from the reactor, a study was carried out to investigate the effect of the turbomachinery rotational speed on the cycle operation and performance. The effect of the turbomachinery speed reduction on the cycle control is somewhat similar to the action of inventory control. When the compressor speed is reduced, the flow rate of the CO2 in the cycle will be lower (hence the similarity to inventory control). Therefore, the heat removal in the reactor heat exchanger will be reduced leading, through the core reactivity feedbacks, to a reduction in the reactor power. The question to be answered is whether the reduction in the turbomachinery speed is more effective in terms of net generator output than the combination of the inventory control and turbine throttling assumed in the previous analysis [1]. If it turns out to be more effective, than a smaller power input would be required to maintain CO2 circulation at low power levels; ideally, zero net power input would be needed and the compressors could be operated by the reserve capacity in turbine power. To facilitate calculations with reduction in the turbomachinery speed, asynchronous (i.e., various speed) maps were generated in the PDC. To conserve the overall size of the maps, introduction of additional points for varying shaft speed necessarily reduced the accuracy (i.e., number of map points) for other input parameters, such as inlet pressure and temperature. That reduction is especially important for the compressor operating close to the critical point where the CO2 property variations are significant. For example, the number of map points for the inlet pressure was reduced from 60 to 20 in order to accommodate space for an additional 25 shaft speed points (instead of 1 point for the synchronous maps). Similar reductions are needed for inlet temperature and outlet pressure. However, as the results below demonstrate, that reduction in map accuracy does not significantly affect the results during normal operation. At the same time, insufficient map accuracy becomes important during the speed reduction process, as will be demonstrated by the results below.
3.1 Simulation and First Results The initial conditions for the shaft speed control action are exactly the same as in the FY2011 work [1]. It is assumed that the plant electrical output is reduced from the 100% level to zero at a 5%/min rate over the first 1,200 s of the transient. An assumption of autonomous reactor control [2] is maintained throughout the entire simulation, meaning that no control rod action is implemented in the core and the reactor power responds to temperature changes by means of the reactivity feedbacks. The shaft speed reduction is assumed to start at 1,200 s; i.e. immediately after the net generator output reaches zero and the plant can be disconnected from the grid. A linear reduction of the shaft speed is

Extension of the Supercritical Carbon Dioxide Brayton Cycle to Low Reactor Power Operation: Investigations using the Coupled ANL Plant Dynamics Code-SAS4A/SASSYS-1 Liquid Metal Reactor Code System April 30, 2012
ANL-ARC-223 9
simulated with an arbitrary assumed rate of 50% reduction in 400 s (i.e., 10% reduction every 80 s). The reduction in speed is continued until a level of about 6% power input in the reactor heat exchanger (RHX) is reached. A linear shaft speed reduction is assumed for simplicity and is simulated by using the direct shaft speed input option provided in the PDC. In reality, when the generator is disconnected from the grid and the shaft speed is no longer dictated by the grid frequency, the turbomachinery speed is defined by the balance between the power provided by the turbine and all the resistances on the shaft, including the power requirements for the compressors. In order to maintain the desired speed, a control action should be implemented to, for example, vary the turbine power. Examples of such control options would be throttling or bypassing the turbine. So, in reality, when the generator is disconnected from the grid, the control system would apply action on the turbine throttling or bypass valves (in this example) in order to maintain the desired shaft speed. In this case, the shaft power balance equation should be solved. This equation is modeled in the PDC. However, for simplicity and to decouple the shaft reduction action from the required optimization of the shaft speed control, an option of a user-specified shaft speed is used in the simulations below. In this case, the shaft power balance equation is bypassed in the calculations since the shaft speed is already given. Any imbalance in the shaft power will be shown as a net positive or negative power available from the generator at any particular time. However, since the S-CO2 cycle control system is designed to match the required generator load, which is zero after the disconnection from the grid, the net generator output will be maintained close to zero anyway, thus still providing almost perfect balance on the shaft. In other words, the control action, developed to maintain zero generator output with a given shaft speed will be at least close to that required to maintain the given shaft speed with zero generator load. The selected approach simply eliminates the additional variable for the shaft speed and, most importantly, its effect on the system performance by assuming that non-zero instantaneous generator output will somehow be consumed by the system. Again, this is done to decouple the effect of the shaft speed variation from the shaft speed control optimization in order to focus the current study on the former rather than the latter. The transient results of the calculations of S-CO2 cycle operation and performance under the above conditions obtained from the coupled PDC and SAS4A/SASSYS-1 codes are shown in Figure 3-1. For the first 1,200 seconds, the results are very close to those obtained in FY2011 (no noticeable differences were identified), demonstrating that general turbomachinery maps provide basically the same performance at the nominal speed. The net generator output, controlled by inventory, turbine throttling, and turbine bypass controls, follows the load all the way to the zero level. The heat removal rate by the cycle in the RHX at 1,200 seconds is about 30% which agrees with the previous results. 1
1 The 28% level mentioned above for the FY2011 results corresponds to the final level at the end of the simulation. Immediately after zero load was reached, the RHX power level was also about 30% in the FY2011 results.
Extension of the Supercritical Carbon Dioxide Brayton Cycle to Low Reactor Power Operation: Investigations using the Coupled ANL Plant Dynamics Code-SAS4A/SASSYS-1 Liquid Metal Reactor Code
System April 30, 2012
10 ANL-ARC-223
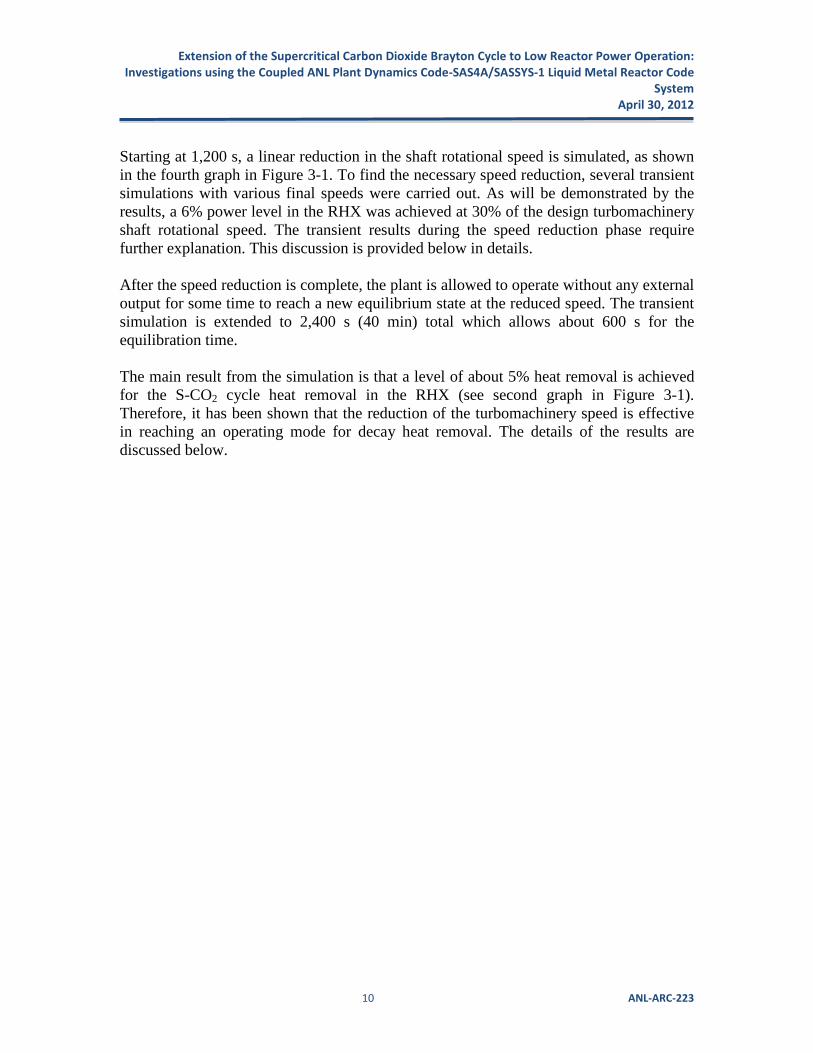
Starting at 1,200 s, a linear reduction in the shaft rotational speed is simulated, as shown in the fourth graph in Figure 3-1. To find the necessary speed reduction, several transient simulations with various final speeds were carried out. As will be demonstrated by the results, a 6% power level in the RHX was achieved at 30% of the design turbomachinery shaft rotational speed. The transient results during the speed reduction phase require further explanation. This discussion is provided below in details. After the speed reduction is complete, the plant is allowed to operate without any external output for some time to reach a new equilibrium state at the reduced speed. The transient simulation is extended to 2,400 s (40 min) total which allows about 600 s for the equilibration time. The main result from the simulation is that a level of about 5% heat removal is achieved for the S-CO2 cycle heat removal in the RHX (see second graph in Figure 3-1). Therefore, it has been shown that the reduction of the turbomachinery speed is effective in reaching an operating mode for decay heat removal. The details of the results are discussed below.

Extension of the Supercritical Carbon Dioxide Brayton Cycle to Low Reactor Power Operation: Investigations using the Coupled ANL Plant Dynamics Code-SAS4A/SASSYS-1 Liquid Metal Reactor Code System April 30, 2012
ANL-ARC-223 11
Figure 3-1. Transient Results with Turbomachinery Speed Reduction.
0
0.2
0.4
0.6
0.8
1
1.2
0 200 400 600 800 1000 1200 1400 1600 1800 2000 2200 2400POW
ER,
FRA
CTIO
N O
F FU
LL R
EACT
OR
POW
ER
TIME, s
HEAT BALANCE IN RHX
Q_RHX_Rx
Q_RHX_CO2
0%
2%
4%
6%
8%
10%
12%
14%
16%
18%
20%
1400 1600 1800 2000 2200 2400
POW
ER,
FRA
CTIO
N O
F FU
LL R
EACT
OR
POW
ER
TIME, s
HEAT BALANCE IN RHX
Q_RHX_Rx
Q_RHX_CO2
-0.2
0
0.2
0.4
0.6
0.8
1
1.2
1.4
1.6
1.8
0 200 400 600 800 1000 1200 1400 1600 1800 2000 2200 2400W,
FRA
CTIO
N O
F N
OM
INA
L G
ENER
ATO
R PO
WER
TIME, s
TURBINE AND COMPRESSORS WORK AND GENERATOR OUTPUT
W_TurbW_Comp1W_Comp2W_genW_grid
0
20
40
60
80
100
120
0 200 400 600 800 1000 1200 1400 1600 1800 2000 2200 2400
SHA
FT R
OTA
TIO
NA
L SP
EED
, %
nom
inal
TIME, s
SHAFT SPEED
N_r

Extension of the Supercritical Carbon Dioxide Brayton Cycle to Low Reactor Power Operation: Investigations using the Coupled ANL Plant Dynamics Code-SAS4A/SASSYS-1 Liquid Metal Reactor Code System
April 30, 2012
12 ANL-ARC-223
Figure 3-1. Transient Results with Turbomachinery Speed Reduction. (Continued)
0%
10%
20%
30%
40%
50%
60%
70%
80%
0 200 400 600 800 1000 1200 1400 1600 1800 2000 2200 2400
STA
LL M
ARG
IN
TIME, s
COMPRESSORS STALL MARGIN
Comp1
Comp2
0%
10%
20%
30%
40%
50%
60%
70%
0 200 400 600 800 1000 1200 1400 1600 1800 2000 2200 2400
CHO
KE M
ARG
IN
TIME, s
TURBINE AND COMPRESSORS CHOKE MARGIN
Comp1
Comp2
Turb
30.9
31.4
31.9
32.4
32.9
33.4
33.9
34.4
34.9
35.4
0 200 400 600 800 1000 1200 1400 1600 1800 2000 2200 2400
TEM
PERA
TURE
, o C
TIME, s
COMPRESSOR #1 INLET TEMPERATURE
T_c_i
T_crit
6.8
7
7.2
7.4
7.6
7.8
8
8.2
0 200 400 600 800 1000 1200 1400 1600 1800 2000 2200 2400
PRES
SURE
, M
Pa
TIME, s
COMPRESSOR #1 INLET PRESSURE
p_c_i
p_crit

Extension of the Supercritical Carbon Dioxide Brayton Cycle to Low Reactor Power Operation: Investigations using the Coupled ANL Plant Dynamics Code-SAS4A/SASSYS-1 Liquid Metal Reactor Code System April 30, 2012
ANL-ARC-223 13
Figure 3-1. Transient Results with Turbomachinery Speed Reduction. (Continued)
0
10
20
30
40
50
60
70
80
90
100
0 200 400 600 800 1000 1200 1400 1600 1800 2000 2200 2400
VALV
E O
PEN
FLO
W A
REA
, %
TIME, s
VALVES CONTROL ACTION
f_TBPv
f_INViv
f_INVov
f_TINv f
C2Ov
0
0.2
0.4
0.6
0.8
1
1.2
1.4
0 200 400 600 800 1000 1200 1400 1600 1800 2000 2200 2400
FLO
W R
ATE,
FRA
CTIO
N O
F N
OM
INA
L
TIME, s
COOLING WATER FLOW RATE
m_w
34
35
36
37
38
39
40
41
0 200 400 600 800 1000 1200 1400 1600 1800 2000 2200 2400
VALV
E O
PEN
ARE
A FR
ACT
ION
, %
TIME, s
COOLER BYPASS VALVE ACTION
f_CBPv
-0.2
0
0.2
0.4
0.6
0.8
1
1.2
0 200 400 600 800 1000 1200 1400 1600 1800 2000 2200 2400
EFFI
CIEN
CY,
FRA
CTIO
N O
F N
OM
INA
L
TIME, s
INSTANTANEOUS CYCLE EFFICIENCY
Cycle

Extension of the Supercritical Carbon Dioxide Brayton Cycle to Low Reactor Power Operation: Investigations using the Coupled ANL Plant Dynamics Code-SAS4A/SASSYS-1 Liquid Metal Reactor Code System
April 30, 2012
14 ANL-ARC-223
Figure 3-1. Transient Results with Turbomachinery Speed Reduction. (Continued)
0
0.2
0.4
0.6
0.8
1
1.2
0 200 400 600 800 1000 1200 1400 1600 1800 2000 2200 2400
m,
RELA
TIVE
TO
NO
MIN
AL
TURB
INE
TIME, s
BRAYTON CYCLE FLOW RATES: TURBOMACHINERY Turb
Comp1
Comp2
0
100
200
300
400
500
600
0 200 400 600 800 1000 1200 1400 1600 1800 2000 2200 2400
TEM
PERA
TURE
, o C
TIME, s
BRAYTON CYCLE TEMPERATURES: TURBOMACHINERY
TiToC1iC1oC2iC2o
150
200
250
300
350
400
450
500
0 200 400 600 800 1000 1200 1400 1600 1800 2000 2200 2400
TEM
PERA
TURE
, o C
TIME, s
BRAYTON CYCLE TEMPERATURES: HTR
Hot_iHot_oCold_iCold_o
60
80
100
120
140
160
180
200
220
240
0 200 400 600 800 1000 1200 1400 1600 1800 2000 2200 2400
TEM
PERA
TURE
, o C
TIME, s
BRAYTON CYCLE TEMPERATURES: LTR
Hot_iHot_oCold_iCold_o

Extension of the Supercritical Carbon Dioxide Brayton Cycle to Low Reactor Power Operation: Investigations using the Coupled ANL Plant Dynamics Code-SAS4A/SASSYS-1 Liquid Metal Reactor Code System April 30, 2012
ANL-ARC-223 15
Figure 3-1. Transient Results with Turbomachinery Speed Reduction. (Continued)
30
40
50
60
70
80
90
100
110
120
0 200 400 600 800 1000 1200 1400 1600 1800 2000 2200 2400
TEM
PERA
TURE
, o C
TIME, s
BRAYTON CYCLE TEMPERATURES: COOLER
Inlet
Outlet
-0.02
0
0.02
0.04
0.06
0.08
0.1
0.12
0.14
0 200 400 600 800 1000 1200 1400 1600 1800 2000 2200 2400
m,
RELA
TIVE
TO
NO
MIN
AL
TURB
INE
TIME, s
BRAYTON CYCLE FLOW RATES: SURGE CONTROL
Comp1
Comp2
56789
101112131415161718192021
0 200 400 600 800 1000 1200 1400 1600 1800 2000 2200 2400
PRES
SURE
, M
Pa
TIME, s
BRAYTON CYCLE PRESSURES: TURBOMACHINERY
TiToC1iC1oC2iC2o
0
5
10
15
20
25
0 200 400 600 800 1000 1200 1400 1600 1800 2000 2200 2400
PRES
SURE
, M
Pa
TIME, s
BRAYTON CYCLE PRESSURES: INVENTORY CONTROL Inlet
Oulet
Tank

Extension of the Supercritical Carbon Dioxide Brayton Cycle to Low Reactor Power Operation: Investigations using the Coupled ANL Plant Dynamics Code-SAS4A/SASSYS-1 Liquid Metal Reactor Code System
April 30, 2012
16 ANL-ARC-223
Figure 3-1. Transient Results with Turbomachinery Speed Reduction. (Finished)
300
350
400
450
500
550
0 200 400 600 800 1000 1200 1400 1600 1800 2000 2200 2400
TEM
PERA
TURE
, o C
TIME, s
BRAYTON CYCLE TEMPERATURES: RHX
Hot_i
Hot_o
Cold_i
Cold_o0.0
0.2
0.4
0.6
0.8
1.0
1.2
0 200 400 600 800 1000 1200 1400 1600 1800 2000 2200 2400
NO
RMA
LIZE
D P
OW
ER O
R FL
OW
TIME, s
CORE POWER AND FLOW
POWER DECAY POWER PEAK CHANNEL FLOW
-0.15
-0.10
-0.05
0.00
0.05
0.10
0.15
0 200 400 600 800 1000 1200 1400 1600 1800 2000 2200 2400
REA
CTIV
ITY,
$
TIME, s
CORE REACTIVITY
NET EXTERNAL DOPPLER AX. EXP.
RAD. EXP. CRDL EXP. COOLANT
300
350
400
450
500
550
600
650
700
750
0 200 400 600 800 1000 1200 1400 1600 1800 2000 2200 2400
TEM
PERA
TURE
, o C
TIME, s
PEAK CORE TEMPERATURES
PEAK FUEL PEAK CLAD
PEAK COOLANT INLET

Extension of the Supercritical Carbon Dioxide Brayton Cycle to Low Reactor Power Operation: Investigations using the Coupled ANL Plant Dynamics Code-SAS4A/SASSYS-1 Liquid Metal Reactor Code System April 30, 2012
ANL-ARC-223 17
3.2 Discussion of Results As mentioned above, the results for the earlier stage of the transient, i.e., for the grid load following phase, are very close to those obtained in FY2011. Those results are discussed in the FY2011 report in detail and the discussion will not be repeated here. The transient results for the shaft speed reduction region (1,200-1,760 s) show significant oscillations in many calculated parameters. Further investigation into the cause of those oscillations demonstrated that they are a result of extrapolation between the turbomachinery map speed lines. As schematically demonstrated in Figure 3-2, the code uses the turbomachinery maps to calculate the flow rate through a compressor (or turbine) based on the current value of pressure (or pressure ratio). In order to estimate the flow rate at a current (or “Actual”) rotational speed, two neighboring speeds, for which the maps were calculated (Ni and Ni+1 in Figure 3-2), should be used. Then, the resulting flow rate is calculated by linear interpolation between these two values with respect to the rotational speed. However, as demonstrated by the example in Figure 3-2, the results of application of current pressure conditions to the neighboring speed lines may not be physical, even though the flow rate from the actual speed line is. This is especially a concern close to surge conditions. The example in Figure 3-2 shows that in the proximity to surge flow, a solution to one of the speed lines may not even exist for the actual pressure. In this case, the code would simply extrapolate the data from the existing speed line. In extreme cases (which were actually observed during the code debugging), such extrapolation may yield negative flow. When that extrapolated value is used to calculate the flow rate based on the current speed, the resulting flow rate may not represent the actual physical value for the flow rate at this speed. For example in Figure 3-2, assuming that the actual speed is in the middle between the two lines, the flow rate would also be in the middle between the two flow rates calculated from these lines. In reality though, the actual flow rate would be much closer to the line for which extrapolation was not necessary. This observation is partially confirmed by the fact that the “peaks” in the calculated parameters in Figure 3-1 occur very close to the times corresponding to 40%, 50%, 60%, etc. speeds in the turbomachinery; i.e. they coincide with the transition through the speed lines in the turbomachinery maps. When such transition occurs, the pair of speed lines used for interpolation changes. For example, the rotational speed reaches 50% at 1,600 seconds. Immediately before that time, the speed is higher than 50%, such that the 50% and 60% lines would be used. Immediately after that time, the 40% and 50% lines are utilized for interpolation for the flow rate. The solution in both cases would approach the 50% line value, such that the results are continuous. However, interpolation from the 50% and 60% lines may yield different answer from interpolation between the 40% and 50% lines. Because of that, the change in the slope of the curves is observed.

Extension of the Supercritical Carbon Dioxide Brayton Cycle to Low Reactor Power Operation: Investigations using the Coupled ANL Plant Dynamics Code-SAS4A/SASSYS-1 Liquid Metal Reactor Code
System April 30, 2012
18 ANL-ARC-223
Figure 3-2. Extrapolated Flow Rate from the Turbomachinery Maps.
The above example shows how the flow rate is affected by interpolation. Similar results would be obtained for all other parameters derived from the turbomachinery maps in the code, including the outlet temperature. It is noted however, that the observed oscillating behavior is a result of using turbomachinery maps with a limited number of speed lines. Therefore, it is a computational artifact, rather than a real physical result. Because of the calculated oscillating behavior of some parameters, the control system, optimized for normal operation, cannot be used as effectively as before. For example, cooler bypass, which is used for minimum temperature control, among other parameters, uses the derivative of the compressor first stage inlet temperature which is also derived from the compressor maps. As discussed above, that derivative could experience a sudden change at the transition through the compressor map speed lines. This sudden change could (and does) result in an unstable behavior of some control mechanisms. To avoid this computational problem, it was decided to halt minimum temperature control action once the turbomachinery speed starts changing. The results in Figure 3-1 show that the minimum cycle temperature, which is not controlled after 1,200 s, starts to increase above the 31.25 °C steady-state design value. Since it is not a goal to achieve the most efficient operation under the turbomachinery spin-down conditions and since the temperature remains above the critical, it was decided that precise minimum temperature control is not particularly important under those conditions. The results also show that by
Ni
Ni+1 Actual N
Surge Line
Pressure Ratio
Flow Rate
Speed Lines
Actual Flow
Actual Pressure
Speed Line Extrapolation
m(Ni) m(Ni+1) m(N, Ni, Ni+1)

Extension of the Supercritical Carbon Dioxide Brayton Cycle to Low Reactor Power Operation: Investigations using the Coupled ANL Plant Dynamics Code-SAS4A/SASSYS-1 Liquid Metal Reactor Code System April 30, 2012
ANL-ARC-223 19
the end of this transition region, the temperature returns to a value that is close to the original control set point.1 For similar reasons, turbine throttling is not used during the shaft speed reduction phase to achieve the most effective operation during this period; the generator power control is left to turbine bypass alone.2 In addition, inventory control could not be used during this period, since the maximum cycle pressure quickly drops below the inventory control vessel/tank pressure as the compressor pressure ratio starts to decrease. Therefore, the only active control used during the speed reduction phase is the turbine bypass action which is automatically used in the code to maintain the shaft power balance. The results show that as the shaft speed decreases, the turbine bypass flow fraction increases. As discussed above, in this particular simulation, the rotational speed is given as an external parameter as a function of time. The turbine bypass control is used to maintain the net generator output at zero corresponding to a net zero balance in the shaft power. Alternatively, the results mean that in order to reduce the turbomachinery speed in the absence of the grid connection, the turbine bypass valve should keep opening. Since the turbine bypass is the least efficient control mechanism, the turbine throttling action is resumed after the change in the rotational speed is completed; i.e. between 1,760 and 2,000 seconds to increase the overall system efficiency. During this period, the turbine bypass valve is gradually closed with the goal of reducing the turbine bypass valve open fraction to the usual 10% level. Since turbine throttling is more effective than turbine bypass, the heat removal rate by the S-CO2 cycle in the RHX continues to decrease during this period (from ~10% to ~5%) even though the net generator output is kept at zero and the rotational speed is constant. After 2,000 seconds, the simulation is continued without any external input. Stable system operation is confirmed by continuing the simulation to 2,400 s. Aside from the oscillations (which are shown to be computational in nature), the calculated cycle behavior during the turbomachinery speed reduction agrees with the expectations. As the compressors slow down, the flow rate in the system is reduced. As a result, the heat removal rate in the RHX is reduced from ~30% full power to about 5% full power; i.e., even below the goal of 6% nominal power decay heat.. Also, the spinning down compressor produces a lower pressure ratio (which is also schematically demonstrated in Figure 3-2). Since no CO2 inventory is removed from the cycle, the “average” CO2 pressure should remain the same. Therefore, it would be expected with
1 After that, the control could theoretically be resumed. However, that option is not pursued in the current simulation because it would require special treatment for the control logic. Otherwise, the integral control error, accumulated by that time, would trigger a very sharp action on the control. 2 The most effective operation would correspond to the minimum turbine bypass action, since it is the least effective control.

Extension of the Supercritical Carbon Dioxide Brayton Cycle to Low Reactor Power Operation: Investigations using the Coupled ANL Plant Dynamics Code-SAS4A/SASSYS-1 Liquid Metal Reactor Code
System April 30, 2012
20 ANL-ARC-223
the decreasing pressure ratio and constant average pressure, the system pressures would be converging at this “average” pressure (the pressure in the system without any flow). Indeed, the results in Figure 3-1 show that the high pressure is decreasing while the low pressure is increasing. In fact, the compressor inlet pressure, once reduced below the critical value by the inventory control action, increases again above the critical value by the end of the simulation. The other expected result is the reduced operating range in both compressors with lower speed. The results in Figure 3-1 demonstrate that both margins, to choke and to surge, are reduced in both compressors. Also, some surge prevention action was calculated to be necessary as shown by some surge control flow. The reactor power is calculated to be very close to the decay heat level by the end of the simulation. The total reactor power is calculated to be around 5% nominal. However, by the end of the simulation time, the decay power is reduced to about 3%. Still, the net reactivity is slightly negative at the end of the simulation such that the reactor power is expected to continue decreasing, further approaching the decay heat level. In any case, the power level is very close to that for which the passive decay heat removal system (such as a DRACS or a Reactor Vessel Auxiliary Cooling System (RVACS)) are usually designed.
3.3 Calculations with the Detailed Maps As discussed above, the results obtained above exhibit an oscillating behavior during the turbomachinery speed reduction stage. That behavior is believed to be caused by insufficient accuracy of the turbomachinery maps. To verify this hypothesis, new, more detailed, maps were generated. The new maps were specifically created for this particular transient in order to obtain greater accuracy where it is important, compared to the previous maps which were more general since they covered a wide range of parameters. For example, the previous general maps cover rotational speeds from 10% up to 150% of the nominal speed. At the same time, the transient considered in this analysis only deals with nominal or reduced speeds. Therefore, the new maps only need to include speeds at or below 100%. Because of that narrow range in speed, the accuracy of the maps could be increased. Similarly, based on the analysis of the results in Figure 3-1, the actual ranges of the inlet and outlet pressures and temperatures, obtained in this particular simulation, were determined and the new maps were generated to provide better accuracy in those particular ranges. For example, it was noticed that the turbine inlet temperature changes very little during the transient. Thus, the inlet temperature range is reduced to 0.95-1.1 of steady-state value. Compared to a 0.5-1.25 range in general maps, such a range reduction provides factor of five increase in map accuracy on the inlet temperature alone. In addition, the number of points for some input parameters was increased in order to further increase the accuracy of the maps. Because of that, the size of the maps (and file

Extension of the Supercritical Carbon Dioxide Brayton Cycle to Low Reactor Power Operation: Investigations using the Coupled ANL Plant Dynamics Code-SAS4A/SASSYS-1 Liquid Metal Reactor Code System April 30, 2012
ANL-ARC-223 21
loading time) was increased to about twice that of the maps used to obtain the results in Figure 3-1. Table 3-1 compares the characteristics of the previous general and new detailed maps. The table shows how the accuracy of the maps is increased either by selecting more map points, improving (reducing) the range, or both. Because of the increased number of points, the map file sizes increases two to three times. However, the increase in accuracy is much more significant as shown in the parameter “Accuracy increase per MB” in Table 3-1. Note that the accuracy increase per MB cannot be attributed to a larger number of points; it is only a function of reduced ranges in the map parameters. As discussed above, these ranges are specifically selected for a particular transient and may not be applicable to other transients.

Extension of the Supercritical Carbon Dioxide Brayton Cycle to Low Reactor Power Operation: Investigations using the Coupled ANL Plant Dynamics Code-SAS4A/SASSYS-1 Liquid Metal Reactor Code
System April 30, 2012
22 ANL-ARC-223
Table 3-1. Comparison of General and Detailed Maps
In each cell, the following input is entered: 𝐺𝑒𝑛𝑒𝑟𝑎𝑙/𝐷𝑒𝑡𝑎𝑖𝑙𝑒𝑑 = 𝑓, where General and Detailed refer to characteristics of the general and detailed maps, respectively, and f is
the ratio, where such a ratio can be meaningfully calculated.
Notes: *1 In general maps, a non-uniform grid for rotational speed is used with higher accuracy around 1.0. For this table, a step below N=0.9, i.e., where map accuracy becomes important for the results in Figure 3-1, is displayed in this table. *2 Because of the proximity to the critical point, Compressor #1 maps for inlet temperature use a non-uniform grid with greater detail around 1.0. That grid wasn’t changed in the detailed maps. *3 The range for outlet pressure is not defined by the user, rather it is calculated by the code as a range of outlet pressures between the stall and choke flows for each set of inlet conditions. The only user input for the outlet pressure is the number of points. For comparison reasons in this table only, the step in outlet pressure is calculated as 1/<number of points>. *4 Total line is calculated as the multiplication product of all the parameters above. For Step, the Total is calculated as the product of f factors in the table. It is meant to represent the overall increase in accuracy of the detailed maps compared to general maps. *5 Accuracy increase per MB is calculated as the ratio of Total Step-to-f factor for file size.
Map parameter
Table entry Turbine Compressor #1 Compressor #2
Relative rotational speed
Range 0.1-1.5 / 0.15-1.05 0.1-1.3 / 0.15-1.05 0.1-1.5 / 0.15-1.05 # of points 25 / 37 23 / 37 25 / 37
Step*1 0.1 / 0.025 = 4 0.1 / 0.025 = 4 0.1 / 0.025 = 4
Relative inlet temperature
Range 0.5-1.25 / 0.95-1.1 0.992-1.02*2 0.86-1.26/0.85-1.15 # of points 31 / 31 22 / 22 21 / 31
Step 0.025 / 0.005 = 5 1 0.02 / 0.01 = 2
Relative inlet pressure
Range 0.5-1.25 / 0.3-1.1 0.5-1.5 / 0.85-1.15 0.5-1.5 / 0.85-1.15 # of points 40 / 65 61 / 61 40 / 40
Step 0.02 / 0.0125=1.6 0.0167/0.005=3.3 0.025/0.0077=3.3
Relative outlet pressure
Range*3 N/A N/A N/A # of points 40 / 60 60 / 60 40 / 60
Step*3 60 / 40 = 1.5 1 60 / 40 = 1.5
Total*4 # of points 1.2M / 4.5M 1.9M / 3.0M 0.84M / 2.8M
Step 48 13.2 39.6 Map file size, MB 169 / 603 365 / 580 165 / 536 Accuracy increase per MB*5 13.5 8.3 12.1

Extension of the Supercritical Carbon Dioxide Brayton Cycle to Low Reactor Power Operation: Investigations using the Coupled ANL Plant Dynamics Code-SAS4A/SASSYS-1 Liquid Metal Reactor Code System April 30, 2012
ANL-ARC-223 23
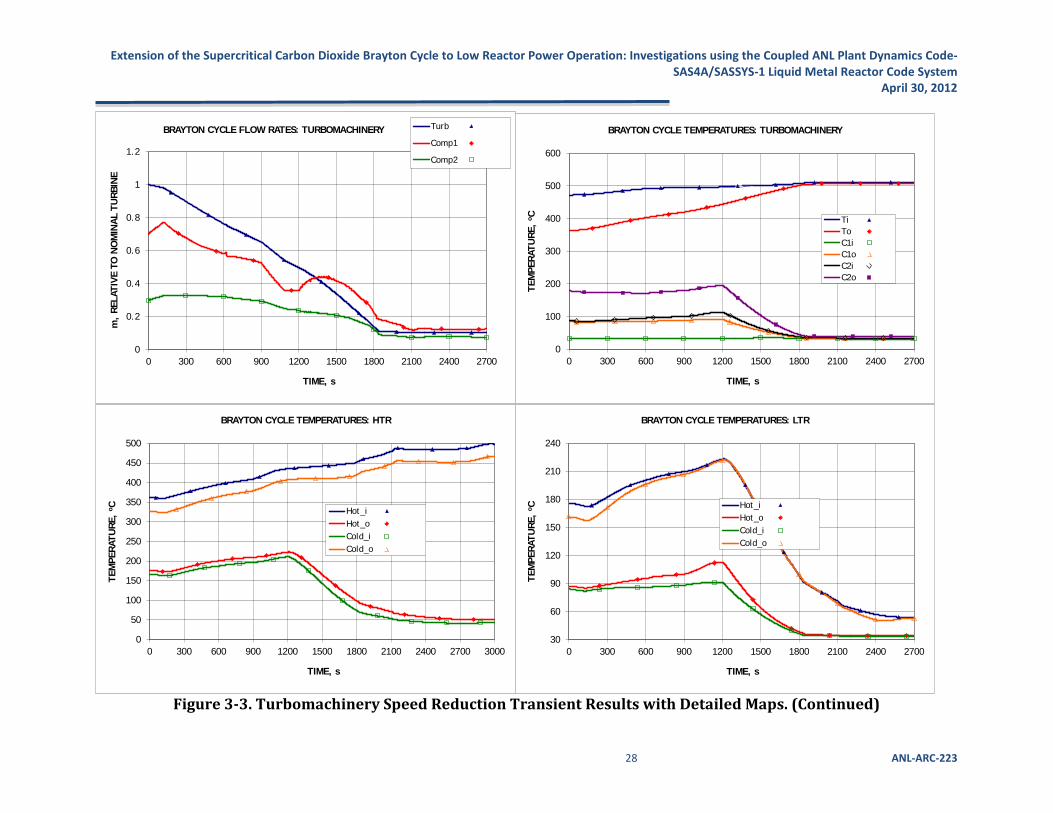
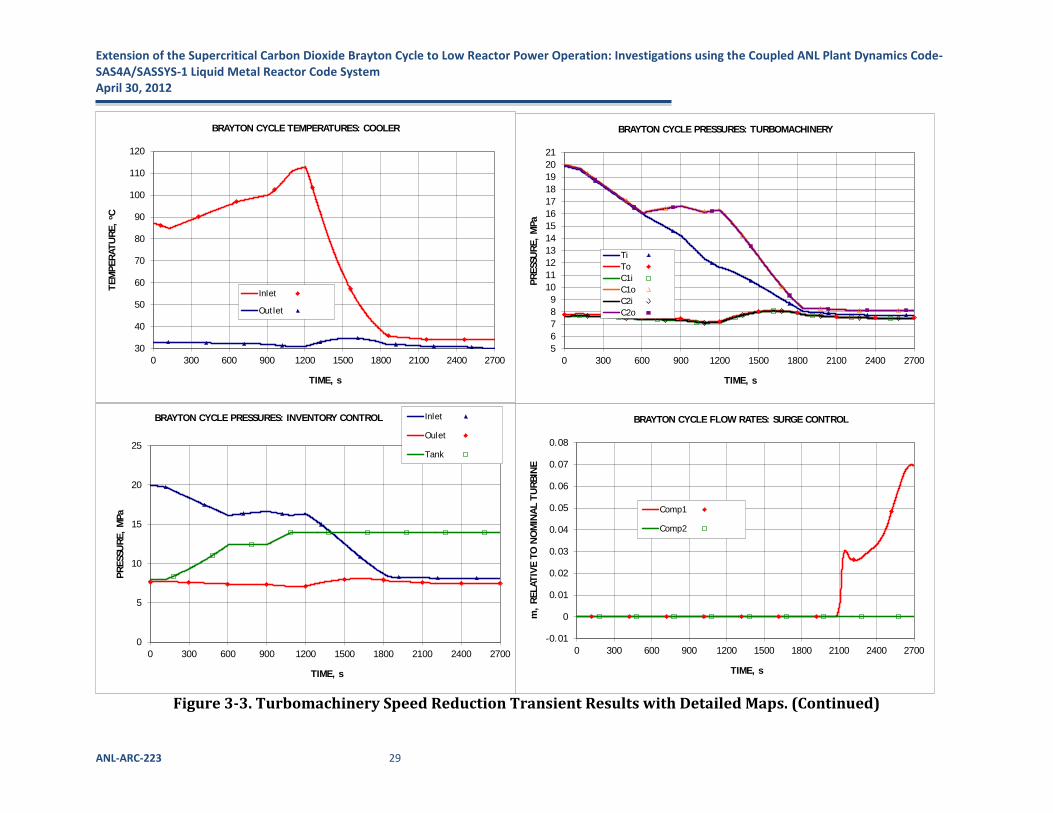
Use of the detailed maps significantly reduces the oscillations during the speed reduction phase, as demonstrated in Figure 3-3. The oscillations can now be noticed only on the compressor surge and choke margin plots. These improvements in the results confirm that the oscillating behavior observed in Figure 3-1 was indeed a computational problem due to insufficient accuracy in the calculations and does reflect the physical phenomena. As discussed above, the initial goal of the simulation was to achieve about a 6% power level for decay heat removal. However, the results in Figure 3-1 indicate that by the end of the transient the decay heat is reduced to about 3% nominal. In order to further reduce the power level, the turbomachinery speed reduction is extended to the 20 % level in Figure 3-3 (compared to 30 % in Figure 3-1), which allows reaching a 3% power level by the end of the transient. As a result, the reactor power is basically equal to the decay heat power by the end of the transient as also shown in Figure 3-3. The transient simulation time is extended to 2,700 seconds (45 min) to account for the longer speed reduction phase. In addition to further speed reduction, the more stable transient behavior obtained with the detailed maps allows restart of the minimum temperature control after the speed reduction period is complete. In the simulation in Figure 3-3, the cooler bypass action is initiated again at 2,200 s. As a result, the compressor-inlet temperature is maintained above the critical value at the end of the transient. It is also noticed that due to lower compressor speeds, the inlet pressure increases to values above the critical pressure. Therefore, it turns out that the conditions at the compressor inlet at the end of the transient are very similar to the steady-state conditions; i.e., the entire cycle operates at supercritical temperatures and pressures. Another important result of the simulation is that in this case no external power is needed for the CO2 compressors. The power produced by the turbine is still sufficient to operate the compressors, despite some recirculation flow from the surge control. The generator power, and the cycle efficiency, is maintained at zero throughout the entire transient after disconnection from the grid. This is a significant improvement from the FY2011 results where as much as 20% of full power would be needed to operate the compressors. Even some reserve in power exists at the end of the simulation in the form of slight turbine bypass flow. This reserve can be used to further reduce the power to compensate for reducing the decay heat generation rate, for example. In addition, shaft speed reduction below the current 20% level could be used for this purpose, provided that the compressor surge control flow would not be excessive. Overall, the results in Figure 3-3 show that the objective of the low-power operation of the S-CO2 cycle is achieved. The cycle control system maintains the required and stable operation during the entire transient. During the load reduction phase, the generator power follows the load very closely all the way from 100% to 0%. After reaching zero grid power and disconnecting from the grid, the cycle control system manages to maintain net zero generator power. The turbomachinery speed reduction approach has been shown to be effective in improving cycle efficiency at low loads. Compared to the

Extension of the Supercritical Carbon Dioxide Brayton Cycle to Low Reactor Power Operation: Investigations using the Coupled ANL Plant Dynamics Code-SAS4A/SASSYS-1 Liquid Metal Reactor Code
System April 30, 2012
24 ANL-ARC-223
previous control approach, reaching decay heat levels on the reactor side does not require an additional power supply to drive the CO2 compressors. With the new control approach, the reactor power can be reduced to at least 3% of full power even in the absence of active control on the reactor power and sodium pumps. This result also demonstrates that the autonomous operation of a SFR with favorable reactivity feedbacks is feasible all the way from full power down to decay heat levels.

Extension of the Supercritical Carbon Dioxide Brayton Cycle to Low Reactor Power Operation: Investigations using the Coupled ANL Plant Dynamics Code-SAS4A/SASSYS-1 Liquid Metal Reactor Code System April 30, 2012
ANL-ARC-223 25
Figure 3-3. Turbomachinery Speed Reduction Transient Results with Detailed Maps.
0
0.2
0.4
0.6
0.8
1
1.2
0 300 600 900 1200 1500 1800 2100 2400 2700POW
ER,
FRA
CTIO
N O
F FU
LL R
EACT
OR
POW
ER
TIME, s
HEAT BALANCE IN RHX
Q_RHX_Rx
Q_RHX_CO2
0%
1%
2%
3%
4%
5%
6%
7%
8%
9%
10%
1500 1800 2100 2400 2700
POW
ER,
FRA
CTIO
N O
F FU
LL R
EACT
OR
POW
ER
TIME, s
HEAT BALANCE IN RHX
Q_RHX_Rx
Q_RHX_CO2
-0.2
0
0.2
0.4
0.6
0.8
1
1.2
1.4
1.6
1.8
0 300 600 900 1200 1500 1800 2100 2400 2700W,
FRA
CTIO
N O
F N
OM
INA
L G
ENER
ATO
R PO
WER
TIME, s
TURBINE AND COMPRESSORS WORK AND GENERATOR OUTPUT
W_TurbW_Comp1W_Comp2W_genW_grid
0
20
40
60
80
100
120
0 300 600 900 1200 1500 1800 2100 2400 2700
SHA
FT R
OTA
TIO
NA
L SP
EED
, %
nom
inal
TIME, s
SHAFT SPEED
N_r

Extension of the Supercritical Carbon Dioxide Brayton Cycle to Low Reactor Power Operation: Investigations using the Coupled ANL Plant Dynamics Code-SAS4A/SASSYS-1 Liquid Metal Reactor Code System
April 30, 2012
26 ANL-ARC-223
Figure 3-3. Turbomachinery Speed Reduction Transient Results with Detailed Maps. (Continued)
0%
10%
20%
30%
40%
50%
60%
70%
80%
0 300 600 900 1200 1500 1800 2100 2400 2700
STA
LL M
ARG
IN
TIME, s
COMPRESSORS STALL MARGIN
Comp1
Comp2
0%
10%
20%
30%
40%
50%
60%
0 300 600 900 1200 1500 1800 2100 2400 2700
CHO
KE M
ARG
IN
TIME, s
TURBINE AND COMPRESSORS CHOKE MARGIN
Comp1
Comp2
30.9
31.4
31.9
32.4
32.9
33.4
33.9
34.4
34.9
0 300 600 900 1200 1500 1800 2100 2400 2700
TEM
PERA
TURE
, o C
TIME, s
COMPRESSOR #1 INLET TEMPERATURE
T_c_i
T_crit
6.8
7
7.2
7.4
7.6
7.8
8
8.2
0 300 600 900 1200 1500 1800 2100 2400 2700
PRES
SURE
, M
Pa
TIME, s
COMPRESSOR #1 INLET PRESSURE
p_c_i
p_crit

Extension of the Supercritical Carbon Dioxide Brayton Cycle to Low Reactor Power Operation: Investigations using the Coupled ANL Plant Dynamics Code-SAS4A/SASSYS-1 Liquid Metal Reactor Code System April 30, 2012
ANL-ARC-223 27
Figure 3-3. Turbomachinery Speed Reduction Transient Results with Detailed Maps. (Continued)
0
10
20
30
40
50
60
70
80
90
100
0 300 600 900 1200 1500 1800 2100 2400 2700
VALV
E O
PEN
FLO
W A
REA
, %
TIME, s
VALVES CONTROL ACTION
f_TBPv
f_INViv
f_INVov
f_TINv
f_C2Ov
0
0.2
0.4
0.6
0.8
1
1.2
1.4
0 300 600 900 1200 1500 1800 2100 2400 2700
FLO
W R
ATE,
FRA
CTIO
N O
F N
OM
INA
L
TIME, s
COOLING WATER FLOW RATE
m_w
0
10
20
30
40
50
60
70
0 300 600 900 1200 1500 1800 2100 2400 2700
VALV
E O
PEN
ARE
A FR
ACT
ION
, %
TIME, s
COOLER BYPASS VALVE ACTION
f_CBPv
-0.2
0
0.2
0.4
0.6
0.8
1
1.2
0 300 600 900 1200 1500 1800 2100 2400 2700
EFFI
CIEN
CY,
FRA
CTIO
N O
F N
OM
INA
L
TIME, s
INSTANTANEOUS CYCLE EFFICIENCY
Cycle
Extension of the Supercritical Carbon Dioxide Brayton Cycle to Low Reactor Power Operation: Investigations using the Coupled ANL Plant Dynamics Code-SAS4A/SASSYS-1 Liquid Metal Reactor Code System
April 30, 2012
28 ANL-ARC-223
Figure 3-3. Turbomachinery Speed Reduction Transient Results with Detailed Maps. (Continued)
0
0.2
0.4
0.6
0.8
1
1.2
0 300 600 900 1200 1500 1800 2100 2400 2700
m,
RELA
TIVE
TO
NO
MIN
AL
TURB
INE
TIME, s
BRAYTON CYCLE FLOW RATES: TURBOMACHINERY Turb
Comp1
Comp2
0
100
200
300
400
500
600
0 300 600 900 1200 1500 1800 2100 2400 2700
TEM
PERA
TURE
, o C
TIME, s
BRAYTON CYCLE TEMPERATURES: TURBOMACHINERY
TiToC1iC1oC2iC2o
0
50
100
150
200
250
300
350
400
450
500
0 300 600 900 1200 1500 1800 2100 2400 2700 3000
TEM
PERA
TURE
, o C
TIME, s
BRAYTON CYCLE TEMPERATURES: HTR
Hot_iHot_oCold_iCold_o
30
60
90
120
150
180
210
240
0 300 600 900 1200 1500 1800 2100 2400 2700
TEM
PERA
TURE
, o C
TIME, s
BRAYTON CYCLE TEMPERATURES: LTR
Hot_iHot_oCold_iCold_o
Extension of the Supercritical Carbon Dioxide Brayton Cycle to Low Reactor Power Operation: Investigations using the Coupled ANL Plant Dynamics Code-SAS4A/SASSYS-1 Liquid Metal Reactor Code System April 30, 2012
ANL-ARC-223 29
Figure 3-3. Turbomachinery Speed Reduction Transient Results with Detailed Maps. (Continued)
30
40
50
60
70
80
90
100
110
120
0 300 600 900 1200 1500 1800 2100 2400 2700
TEM
PERA
TURE
, o C
TIME, s
BRAYTON CYCLE TEMPERATURES: COOLER
Inlet
Outlet
56789
101112131415161718192021
0 300 600 900 1200 1500 1800 2100 2400 2700
PRES
SURE
, M
Pa
TIME, s
BRAYTON CYCLE PRESSURES: TURBOMACHINERY
TiToC1iC1oC2iC2o
0
5
10
15
20
25
0 300 600 900 1200 1500 1800 2100 2400 2700
PRES
SURE
, M
Pa
TIME, s
BRAYTON CYCLE PRESSURES: INVENTORY CONTROL Inlet
Oulet
Tank
-0.01
0
0.01
0.02
0.03
0.04
0.05
0.06
0.07
0.08
0 300 600 900 1200 1500 1800 2100 2400 2700
m,
RELA
TIVE
TO
NO
MIN
AL
TURB
INE
TIME, s
BRAYTON CYCLE FLOW RATES: SURGE CONTROL
Comp1
Comp2

Extension of the Supercritical Carbon Dioxide Brayton Cycle to Low Reactor Power Operation: Investigations using the Coupled ANL Plant Dynamics Code-SAS4A/SASSYS-1 Liquid Metal Reactor Code System
April 30, 2012
30 ANL-ARC-223
Figure 3-3. Turbomachinery Speed Reduction Transient Results with Detailed Maps. (Finished)
300
350
400
450
500
550
0 300 600 900 1200 1500 1800 2100 2400 2700
TEM
PERA
TURE
, o C
TIME, s
BRAYTON CYCLE TEMPERATURES: RHX
Hot_i
Hot_o
Cold_i
Cold_o0.0
0.2
0.4
0.6
0.8
1.0
1.2
0 300 600 900 1200 1500 1800 2100 2400 2700
NO
RMA
LIZE
D P
OW
ER O
R FL
OW
TIME, s
CORE POWER AND FLOW
POWER DECAY POWER PEAK CHANNEL FLOW
-0.15
-0.10
-0.05
0.00
0.05
0.10
0.15
0 300 600 900 1200 1500 1800 2100 2400 2700
REA
CTIV
ITY,
$
TIME, s
CORE REACTIVITY
NET EXTERNAL DOPPLER AX. EXP.
RAD. EXP. CRDL EXP. COOLANT
300
350
400
450
500
550
600
650
700
750
0 300 600 900 1200 1500 1800 2100 2400 2700
TEM
PERA
TURE
, o C
TIME, s
PEAK CORE TEMPERATURES
PEAK FUEL PEAK CLAD
PEAK COOLANT INLET

Extension of the Supercritical Carbon Dioxide Brayton Cycle to Low Reactor Power Operation: Investigations using the Coupled ANL Plant Dynamics Code-SAS4A/SASSYS-1 Liquid Metal Reactor Code System April 30, 2012
ANL-ARC-223 31
4 Discussion of Split-Shaft Configuration The transient analyses of the S-CO2 cycle carried out with the PDC so far, including those described above in this report, assume that all compressors, a turbine, and a generator are connected by a common shaft. This turbomachinery configuration is often called a “single-shaft” configuration and is schematically illustrated in the top portion of Figure 4-1. For this configuration, one shaft speed equation is solved [3] such that the rotational speeds of all turbomachinery components, including the generator, are the same. Recently, an alternative configuration, called “split-shaft”, was proposed by Pratt & Whitney Rocketdyne [4]. In this configuration, schematically illustrated in Figure 4-1 (bottom section), the compressors and the generator are mounted on separate shafts. Each shaft has its own turbine such that one turbine is driving the generator and the other turbine is driving the compressors. A variation of the split-shaft arrangement could be a three-shaft configuration where, in addition to the power turbine driving the generator, each compressor is driven by its own turbine. The split-shaft configuration is not new and it was, at least briefly, considered for the S-CO2 cycle in its early stages of investigation as well as for other cycles, such as for the helium gas Brayton cycle. The main advantage of the single-shaft configuration is that only one turbine is needed (compared to two, although smaller, turbines in the split-shaft arrangement, as demonstrated in Figure 4-1). Since the total power requirement for the turbines is equal to the total power consumed by the compressors plus that delivered to the generator, the total turbine power is the same in both configurations. On the other hand, the size (and the cost) of a turbine is expected to be a less-than-linear function of the turbine power, meaning that one single turbine is almost always more economical than two smaller turbines of the same total power. For this reason, the single-shaft configuration was originally selected for the S-CO2 cycle and has become a reference arrangement in almost all analyses of the cycle. In addition to higher cost, each additional turbine introduces another set of entry/exist performance losses. Those losses, especially at the turbine exit, were calculated to be a significant source of inefficiency for the S-CO2 cycle. Another advantage of the single-shaft arrangement is better equipment protection in severe accidents. In case of the shaft break, the spin-off of the turbine will be resisted by either the compressors or the generator, depending on the shaft brake location. In the split-shaft configuration on the other hand, each turbine has only one source of spin-off resistance. So in the event of shaft break, that resistance will most certainly be lost leading with high probability to blade disintegration and likely blade ballistic hazards.

Extension of the Supercritical Carbon Dioxide Brayton Cycle to Low Reactor Power Operation: Investigations using the Coupled ANL Plant Dynamics Code-SAS4A/SASSYS-1 Liquid Metal Reactor Code System
April 30, 2012
32 ANL-ARC-223
Figure 4-1. Single-Shaft (Top) and Split-Shaft (Bottom) Turbomachinery
Arrangements. The main advantage of the split-shaft configuration is a decoupling of the compressors from the generator, allowing the compressors to operate at basically any speed. One benefit of this approach is that the compressors can be designed for higher (than grid frequency) speed potentially providing higher efficiency, smaller blades, and fewer stages for the compressors [4]. Another, and possibly the most important, advantage of the speed decoupling is that in transients the compressor speed can be varied independent of the generator speed resulting in more efficient off-design operation of the compressors. This is especially important at cycle start-up when flexibility in compressor speed is a basic requirement. To investigate the above mentioned benefits of the split-shaft configuration, it was originally planned as part of the workscope for FY2012 to create a model of the split-shaft arrangement in the PDC code. However, as discussed below, the latest transient results obtained with the single-shaft arrangement (and described above in this report) have shown that the major benefits of the split-shaft configurations can also be achieved from the single-shaft layout when the flexibility to vary the shaft speed is introduced. As the results in previous section demonstrate, when connected to the grid, the single-shaft cycle can effectively follow the load over the entire range. No compressor speed variation is needed. It is still possible though that varying compressor speed may improve the efficiency at partial load and this may be a subject for future investigation.
Compressors
Compressors
Turbine Generator
Generator
Power Turbine Compressor
Turbine
Single-Shaft
Split-Shaft

Extension of the Supercritical Carbon Dioxide Brayton Cycle to Low Reactor Power Operation: Investigations using the Coupled ANL Plant Dynamics Code-SAS4A/SASSYS-1 Liquid Metal Reactor Code System April 30, 2012
ANL-ARC-223 33
When the system is disconnected from the grid, the shaft speed can be changed as effectively as it would be with the split-shaft arrangement. In the split-shaft configuration, zero generator power would mean disconnection of the power turbine, such that the resulting system will be almost identical to the single-shaft arrangement. Since the system start-up will be performed while connection to the grid is not yet established, the start-up of the compressors would not be much different in two configurations. As the results in the previous section show, the compressor speed can be varied even with the single-shaft configuration (after disconnection from the grid) for operations such as decay heat removal and start-up/shutdown. As discussed above, another benefit of the split-shaft configuration is possibly higher efficiency of the compressors (by not limiting the rotational speed at the design point). However, as also discussed above, this configuration would require two turbines, basically doubling the turbine exit losses. In the S-CO2 cycle, where compressor work is much smaller than the turbine work, the gain in compressor efficiency will most likely be offset by the reduction in turbine work due to increased exit losses. In addition, if the turbine and compressors are designed to provide maximum efficiency at the design point (as is usually the case), operation at partial loads will lead to decrease in efficiency in both the turbine and the compressors. To counteract that effect to still provide sufficient power for the turbine to drive the compressors at partial loads in the split-shaft configuration, some form of reserve capacity would be required at the design point. That reserve capacity can be achieved either by flow throttling at the design conditions or by designing the turbine and compressors not to operate at their peak efficiency at full power. In either case, this would introduce an additional loss in cycle efficiency at the design conditions. There is also another limitation specific for the S-CO2 cycle – due to compactness of the turbomachinery, the minimum shaft diameter to carry the power of the turbine and, most importantly, the compressors becomes an important, and often limiting, design consideration. In this regard, higher compressor speed and possibly smaller compressors in the split-shaft configuration will only strengthen the minimum shaft diameter criteria, possibly further limiting the gain in compressor performance. Avoidance of the need for higher rotational speeds associated with the smaller power and compressor turbines of the split-shaft arrangement may be another advantage of the single-shaft configuration with its single larger turbine. Based on these observations, it was decided that the split-shaft configuration will not provide significant benefits compared to the previously simulated single-shaft arrangement to warrant a simulation of this arrangement with the PDC. Although there could still be (small) advantages of the split-shaft configuration for cycle operation and performance, they are currently judged not to be significant enough to offset the clear economic benefits of the single-shaft arrangement which requires only one turbine, instead of two in the split-shaft configuration. If the cycle efficiency at partial load becomes an important design configuration, the split-shaft configuration can be re-examined to investigate if variation in the compressor speed indeed offers a significant gain in cycle efficiency at reduced loads.

Extension of the Supercritical Carbon Dioxide Brayton Cycle to Low Reactor Power Operation: Investigations using the Coupled ANL Plant Dynamics Code-SAS4A/SASSYS-1 Liquid Metal Reactor Code System
April 30, 2012
34 ANL-ARC-223
5 Summary and the Importance of the Results Significant progress has been made on the development of a control strategy for the supercritical carbon dioxide (S-CO2) Brayton cycle enabling removal of power from an autonomous load following SFR down to decay heat levels such that the S-CO2 cycle can be used to cool the reactor until switchover to the normal shutdown heat removal system or a passive decay heat removal system such as Direct Reactor Auxiliary Cooling System (DRACS) loops with DRACS in-vessel heat exchangers. This capability of the new control strategy eliminates the need for use of a separate shutdown heat removal system which might also use supercritical CO2. It has been found that this capability can be achieved by introducing a new control mechanism involving shaft speed control for the common shaft joining the turbine and two compressors following reduction of the load demand from the electrical grid to zero. Following disconnection of the generator from the electrical grid, heat is removed from the intermediate sodium circuit through the sodium-to-CO2 heat exchanger, the turbine solely drives the two compressors, and heat is rejected from the cycle through the CO2-to-water cooler. To investigate the effectiveness of shaft speed control, calculations are carried out using the coupled Plant Dynamics Code-SAS4A/SASSYS-1 code for a linear load reduction transient for a 1000 MWt metallic-fueled SFR with autonomous load following. No deliberate motion of control rods or adjustment of sodium pump speeds is assumed to take place. It is assumed that the S-CO2 turbomachinery shaft speed linearly decreases from 100 to 20% nominal following reduction of grid load to zero. The reactor power is calculated to autonomously decrease down to 3% nominal providing a lengthy window in time for switchover to the normal shutdown heat removal system or for a passive decay heat removal system to become effective. However, the calculations reveal that the compressor conditions are calculated to approach surge such that the need for a surge control system for each compressor is identified. The new control strategy is an alternative to a split-shaft layout involving separate power and compressor turbines which had previously been identified as a promising approach enabling heat removal from a SFR at low power levels. In particular, the new control strategy eliminates the incremental expense associated with two shafts and an additional turbine. When the cycle is disconnected from the grid, the shaft speed can be changed as effectively as it would be with the split-shaft arrangement for which the power turbine would be disconnected from the grid resulting in an operating mode similar to that achieved with the single-shaft arrangement. For some specific results, it is worthwhile emphasizing their importance. First, it is demonstrated once again that the S-CO2 cycle can operate in the decay heat removal mode, even with autonomous reactor control. This time, though, it has been demonstrated that such operation is practically achievable since it does not unrealistically require external power input to drive the compressors. Second, because external power is not needed to drive the compressors, the results show that the S-CO2 cycle can be used for initial decay heat removal for a lengthy interval in time in the absence of any off-site electrical

Extension of the Supercritical Carbon Dioxide Brayton Cycle to Low Reactor Power Operation: Investigations using the Coupled ANL Plant Dynamics Code-SAS4A/SASSYS-1 Liquid Metal Reactor Code System April 30, 2012
ANL-ARC-223 35
power. The turbine provides sufficient power to drive the compressors and sodium and heat sink pumps to maintain the reactor coolability. Some electrical power would still be needed for the controls and control room, but those requirements are expected to be minor and can be satisfied by a battery backup, if necessary. Combined with autonomous reactor control, this represents a significant safety advantage of the S-CO2 cycle by maintaining removal of the reactor power until the core decay heat falls to levels well below those for which the emergency decay heat removal system is designed. The current study indicates that the split-shaft configuration does not provide any significant benefits for the S-CO2 cycle over the current single-shaft layout with shaft speed control. It has been demonstrated that when connected to the grid the single-shaft cycle can effectively follow the load over the entire range. No compressor speed variation is needed while power is delivered to the grid. When the system is disconnected from the grid, the shaft speed can be changed as effectively as it would be with the split-shaft arrangement. In the split-shaft configuration, zero generator power means disconnection of the power turbine, such that the resulting system will be almost identical to the single-shaft arrangement. Without this advantage of the split-shaft configuration, the economic benefits of the single-shaft arrangement, provided by just one turbine and lower losses at the design point, are more important to the overall cycle performance. Therefore, the single-shaft configuration shall be retained as the reference arrangement for S-CO2 cycle power converter preconceptual designs. It is also important to compare the behavior calculated for the single-shaft S-CO2 Brayton cycle with that of a traditional Rankine steam cycle. As the grid load decreases, the steam turbine inlet pressure is reduced. When the load falls to zero, the generator is disconnected from the electrical grid and the turbine is tripped meaning that the turbine stop valve is operated such that steam bypasses the turbine and is condensed in the condenser. Condensate and feedwater flow is typically maintained through the operation of the condensate and feedwater pumps which are driven by electrical power. Thus, with a steam cycle following reduction of the load to zero, the heat removed from the reactor is rejected with none going into maintaining flow around the cycle. Continued condensate and feedwater circulation requires the availability of electric power. (There are nuclear power plant designs in which feedwater flow can be maintained through use of an emergency turbine-driven feedwater pump.) The S-CO2 Brayton cycle differs in that following reduction of the grid load to zero, part of the heat removed from the reactor can still be utilized to drive the compressors thereby continuing flow around the cycle and heat removal by the cycle without the availability of alternating current (AC) electrical power. Improvements to the ANL Plant Dynamics Code have been carried out. The major code improvement is the introduction of a restart capability which simplifies investigation of control strategies for very long transients. Another code modification is transfer of the entire code to a new Intel Fortran complier; the execution of the code using the new compiler was verified by demonstrating that the same results are obtained as when the previous Compaq Visual Fortran compiler was used.

Extension of the Supercritical Carbon Dioxide Brayton Cycle to Low Reactor Power Operation: Investigations using the Coupled ANL Plant Dynamics Code-SAS4A/SASSYS-1 Liquid Metal Reactor Code System
April 30, 2012
36 ANL-ARC-223
Acknowledgements The authors are grateful to Gary Rochau (SNL), the Technical Area Lead, Bob Hill (ANL/NE), the National Technical Director, and Matt Hutmaker (U.S. DOE), the Headquarters Program Manager for the Advanced Reactor Concepts Program. The authors are also indebted to Jeremy Floyd (CEA Cadarache) for his assistance in developing the restart capability for the PDC.

Extension of the Supercritical Carbon Dioxide Brayton Cycle to Low Reactor Power Operation: Investigations using the Coupled ANL Plant Dynamics Code-SAS4A/SASSYS-1 Liquid Metal Reactor Code System April 30, 2012
ANL-ARC-223 37
References 1. A. Moisseytsev and J. J. Sienicki, “Development of the ANL Plant Dynamics Code and
Control Strategies for the Supercritical Carbon Dioxide Brayton Cycle and Code Validation with Data from the Sandia Small-Scale Supercritical Carbon Dioxide Brayton Cycle Test Loop,” ANL-ARC-218, Argonne National Laboratory, September 29, 2011.
2. A. Moisseytsev and J. J. Sienicki, “Autonomous Load Following Behavior of a Sodium-
Cooled Fast Reactor with a Supercritical Carbon Dioxide Brayton Cycle,” Paper 11192, 2011 International Congress on Advances in Nuclear Power Plants (ICAPP ‘11), Nice, France, May 2-5, 2011.
3. A. Moisseytsev and J. J. Sienicki, “Development of a Plant Dynamics Computer Code for
Analysis of a Supercritical Carbon Dioxide Brayton Cycle Energy Converter Coupled to a Natural Circulation Lead-Cooled Fast Reactor,” ANL-06/27, Argonne National Laboratory, July 2006.
4. G. A. Johnson and M. W. McDowell, “Supercritical CO2 Cycle Development at Pratt &
Whitney Rocketdyne,” 2011 Supercritical CO2 Power Cycle Symposium, Boulder, Colorado, May 24-25, 2011.


Argonne National Laboratory is a U.S. Department of Energy laboratory managed by UChicago Argonne, LLC
Nuclear Engineering Division Argonne National Laboratory 9700 South Case Avenue, Bldg. #208 Argonne, IL 60439 www.anl.gov