Embed Size (px)
Citation preview
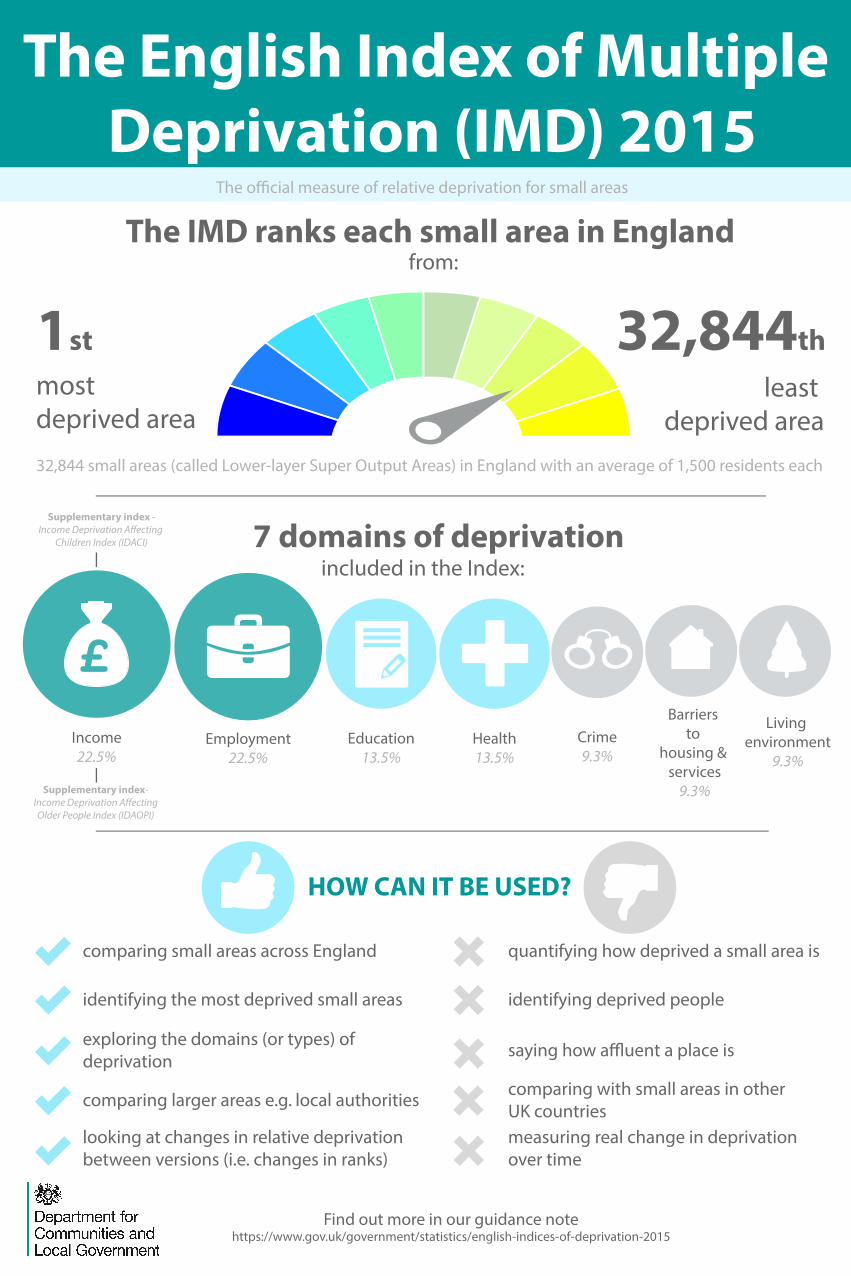
The English Index of Multiple Deprivation (IMD) 2015
The o�cial measure of relative deprivation for small areas
7 domains of deprivation
The IMD ranks each small area in England from:
Employment22.5%
Health13.5%
Education13.5%
Crime9.3%
Barriers to
housing & services
9.3%
Living environment
9.3%
most deprived area
1st
least deprived area
32,844th
comparing small areas across England
identifying the most deprived small areas
exploring the domains (or types) of deprivation
HOW CAN IT BE USED?
included in the Index:
32,844 small areas (called Lower-layer Super Output Areas) in England with an average of 1,500 residents each
Income22.5%
Supplementary index -Income Deprivation A�ecting
Children Index (IDACI)
Supplementary index- Income Deprivation A�ecting Older People Index (IDAOPI)
comparing larger areas e.g. local authorities
looking at changes in relative deprivationbetween versions (i.e. changes in ranks)
saying how a�uent a place is
quantifying how deprived a small area is
identifying deprived people
comparing with small areas in other UK countriesmeasuring real change in deprivation over time
Find out more in our guidance notehttps://www.gov.uk/government/statistics/english-indices-of-deprivation-2015
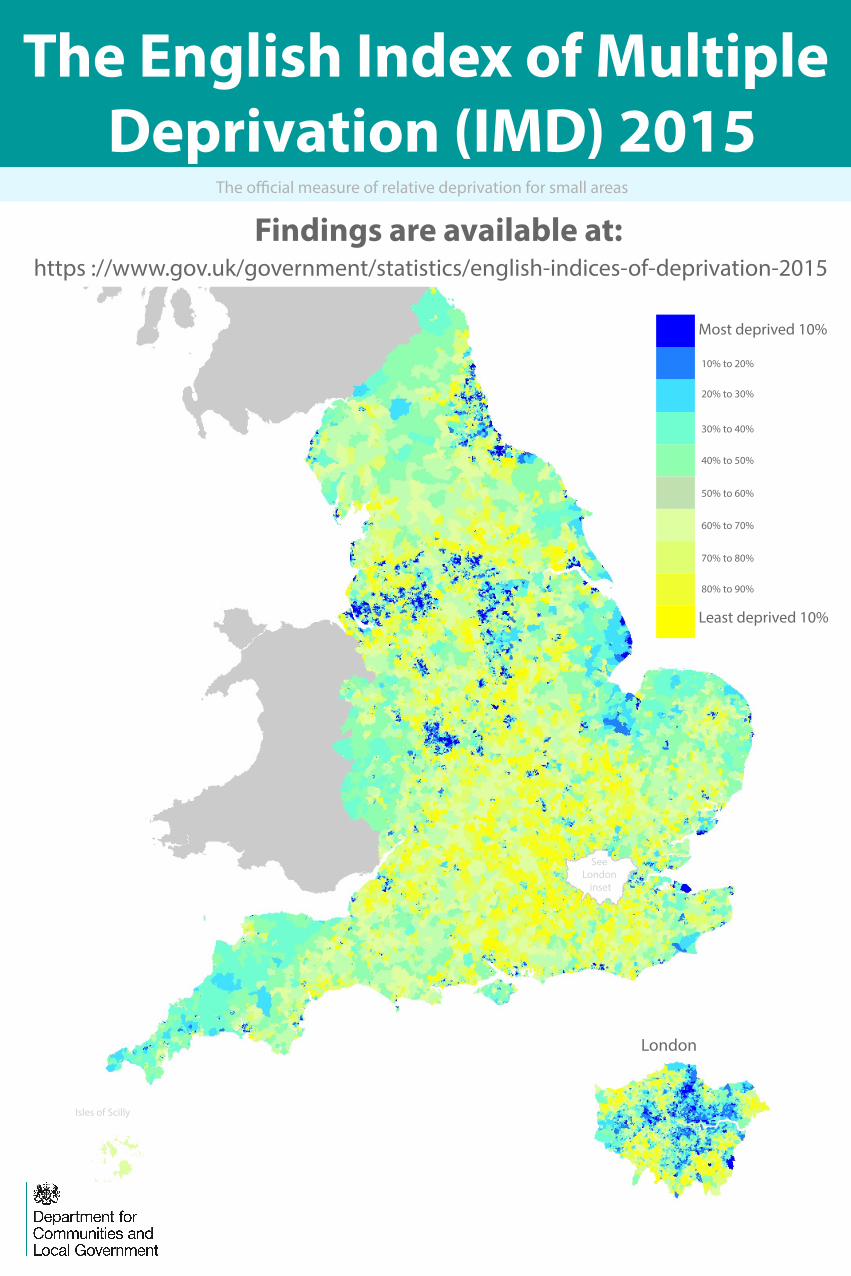
The English Index of Multiple Deprivation (IMD) 2015
Most deprived 10%
30% to 40%
40% to 50%
50% to 60%
60% to 70%
70% to 80%
80% to 90%
Least deprived 10%
20% to 30%
10% to 20%
https ://www.gov.uk/government/statistics/english-indices-of-deprivation-2015Findings are available at:
The o�cial measure of relative deprivation for small areas
Isles of Scilly
London
See London
inset