Embed Size (px)
Citation preview

Summary of Major Analyses and Conclusions in the BLM Technical Support Document
Copper Rulemaking Advisory CommitteeMeeting 1
Dec. 17, 2015
1Presenter: James McConaghie, WQ Specialist
Environmental Solutions, Water Quality Standards and Assessment Section

Collect and assess available data. Understand the range and character of the data. Identify the most sensitive parameters. Estimate missing parameters. Generate criteria from the BLM. Compare BLM results to previous criteria.
Purpose of analyses

1. Acquire and prepare data to run the Biotic Ligand Model
2. Generate criteria using the BLM
3. Understand and apply BLM results
Topics for technical review

Part 1:Preparing data for the BLM
Part 1

Collect and assess available data
Create a BLM database for Oregon
Explore characteristics of the data
Determine sensitivity of the model to the data

Database structure
Site
Sample
Parameter
•Geographical locations where samples were collected.
•Groups of parameters collected at a specific time and location.
•Used to calculate an Instantaneous Water Quality Criterion with the BLM.
•Individual measurements of any of the 10 measured input parameters of the BLM model.
BLM Database

Existing archived data USGS-NWIS database OR-DEQ LASAR database
Current field monitoring OR-DEQ BLM \ Ambient Monitoring OR-DEQ Toxics Monitoring
Data sources

Where has data been collected?

Parameter Sample size Importance:
pH 20,827•Highly sensitive BLM parameter. •Potentially limits the number of samples for calculating BLM criteria.
DOC 4,992•Highly sensitive BLM parameter. •Limits the number of samples usable for calculating BLM criteria.
Specific conductance
21,504 •Estimator of missing geochemical cations and anions.•For filling parameter “gaps” within samples.
Copper 4,169 •To evaluate attainment of BLM criteria and the Fixed Monitoring Benchmark (FMB) procedure.
Hardness 1,957 •To compare BLM-IWQC with the existing hardness-based criteria.
Potential Samples
22,844 •Total number of samples with at least 1 of the above BLM parameters measured.
How many samples are available?

How many Samples Are Available?
# of samples suitable to calculate BLM criteria
20531
929
124
1133
114
2340
200
0
500
1000
1500
2000
2500
Cascades Coastal Eastern Willamette Valley
Region
Cou
nt (n
=)
Samples
Sites

How many samples are available?

Range of BLM parameters
10
100
1000
1.5 IQR
25th %
75th %
Median
Statistical Outliers
Min
Max

Range of BLM parameters
0.1
10.0
1,000.0
Cu DOC Na Ca Mg K Cl SO4 Alk.
Con
cent
ratio
n (m
g/L)
0
10
20
30
Temp
Deg
-C
5
6
7
8
9
10
pH
pH U
nits
10
100
1000
Cond.
Sp. C
ond.
(um
ho\c
m)

Model sensitivity to BLM parameters
1
100
0.0 0.5 1.0
DOC
1
100
0.0 0.5 1.0
pH
1
100
0.0 0.5 1.0
Temperature
1
100
0.0 0.5 1.0
Alkalinity
1
100
0.0 0.5 1.0
Sodium
1
100
0.0 0.5 1.0
Calcium
1
100
0.0 0.5 1.0
Magnesium
1
100
0.0 0.5 1.0
Potassium
1
100
0.0 0.5 1.0
Chloride
1
100
0.0 0.5 1.0Percentile
log
IWQ
C
Sulfate
*The BLM IWQC are highly sensitive to changes in DOC and pH

Sites with complete sets of measured data
164 sites361 samples

Accuracy of estimation required depends on sensitivity
Geochemical Ions less sensitive
DOC & pH more sensitive
Estimate missing parameters

Two Methods Explored:
1. Regression on Conductivity
2. Georegional estimates from summary of existing data
Estimate missing parameters

Specific conductivity is a widely collected parameter
Look at correlation between BLM parameters and specific conductivity
Develop equations to predict concentration of missing parameters
Regression on conductivity

Regression on conductivity: correlation

0
20
40
60
0 25 50 75CCC
DO
C
0
25
50
75
0 25 50 75CCC
Alk
.
0
25
50
75
0 25 50 75CCC
Ca
0
25
50
75
0 25 50 75CCC
Na
0
25
50
75
0 25 50 75CCC
Mg
0
25
50
75
0 25 50 75CCC
K
0
25
50
75
0 25 50 75CCC
Cl
0
25
50
75
0 25 50 75CCC
SO
4
Chronic IWQC from Measured Parameters (μg/L)
Chronic IW
QC from
Estim
ated
Param
eters (μg
/L)
DOC Alkalinity Calcium
Sodium Magnesium Potassium
Chloride Sulfate
Regression on conductivity: accuracy

y 0.075 0.97 x ,r2=0.999
RMSE 0.53
0
20
40
60
80
0 25 50 75Measured Chronic IWQC (ug/L)
Estim
ated
Chr
onic
IWQ
C (u
g/L)
Regression on conductivity: accuracy
Substitution of ALL Geochemical Ions in Measured Samples
*IWQC calculated by estimating geochemical parameters from conductivity regression were accurate.

Regression on conductivity: conclusions
Model input data for geochemical ions can be estimated using specific conductivity
Given poor correlation and high model sensitivity to DOC and pH, specific conductance should not be used to estimate DOC or pH values.
To calculate accurate IWQC, use measured values of DOC and pH parameters.
Where measured DOC and pH are not available, it may be necessary to use conservative estimates from best available measured data.
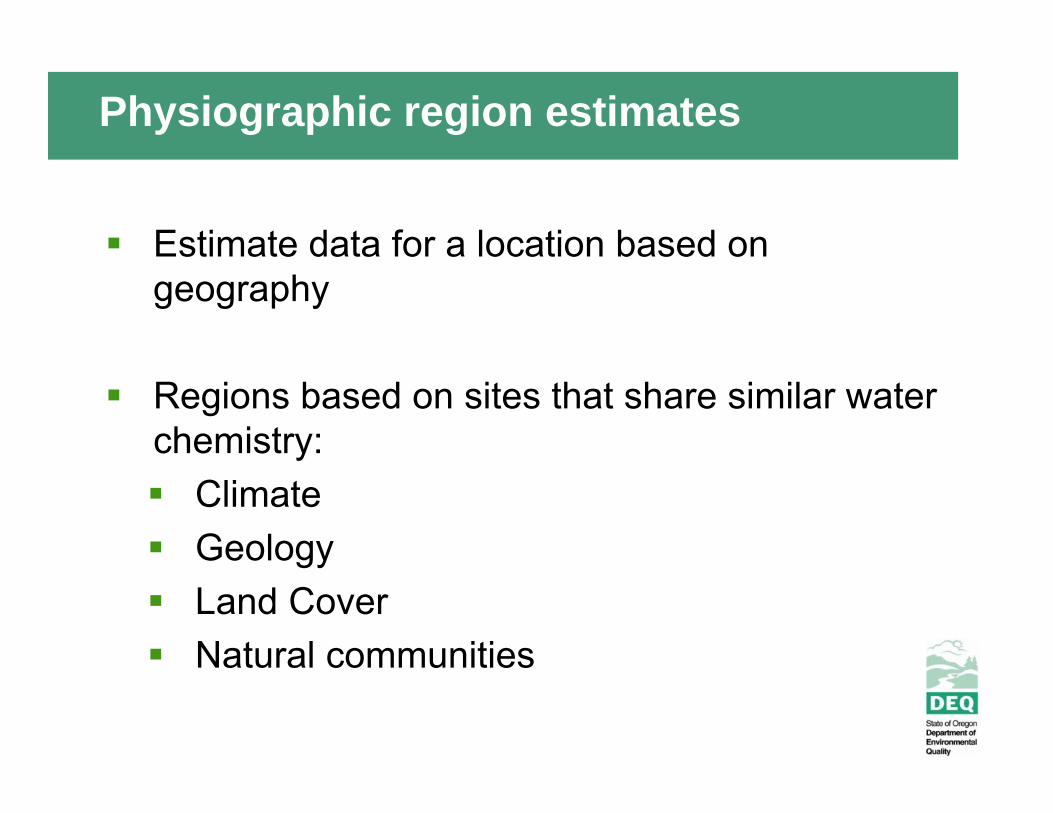
Estimate data for a location based on geography
Regions based on sites that share similar water chemistry: Climate Geology Land Cover Natural communities
Physiographic region estimates

Physiographic regions for BLM

Physiographic regions
DOC
pH
a b c dGroups:
n = 240 n = 930 n = 1146 n = 2372
0.1
1.0
10.0
100.0
DO
C (m
g/L)
n = 369 n = 1159 n = 1562 n = 17665
6
7
8
9
10
Casca
des
Coasta
l
Easter
n
Willa
mette V
alley
pH
a b c dGroups:
*Distribution of DOC and pH data is statistically different in each region

DEQ proposes using four physiographic geo-regions for evaluating estimates of BLM parameters
Using larger regions provides more data for each region, therefore improving accuracy of estimates.
These physiographic regions have statistically different data for specific conductance, DOC and pH.
Therefore, estimates using regional data, rather than statewide data, will be more accurate.
Specific conductance, DOC, and pH data was not statistically different among sites grouped by EPA Level-III Ecoregions
Physiographic regions: conclusions

Physiographic regions: conclusions
In order to calculate accurate IWQC, the BLM should use measured values of DOC and pH parameters
Where measured values are not available, it may be necessary to use a conservative estimate based on the best available measured data for each region.

Part 2:Deriving criteria with the BLM
Part 2

Biotic Ligand Model
Data Inputs Outputs IWQC
Deriving criteria with the BLM

How do we determine criteria for sites missing data?
Two Methods:1. Estimate Missing Input Parameters 2. Assign Defaults based on Model Outputs From sites where there is sufficient data Regional basis
Biotic Ligand Model
Data Inputs Outputs IWQC

Estimate missing ions with conductivity data Estimate DOC using regional estimates Estimate pH and temperature from regions or
nearby stations
1. Estimate model inputs for missing parameters
Biotic Ligand Model
Data Inputs Outputs IWQC

1. Physiographic region estimates
n = 343 n = 343 n = 343
0.1
1.0
10.0
100.0
Actual
IWQC
OR med
ian
OR 10th%
DOC Estimates
log1
0 IW
QC
(ug/
L)
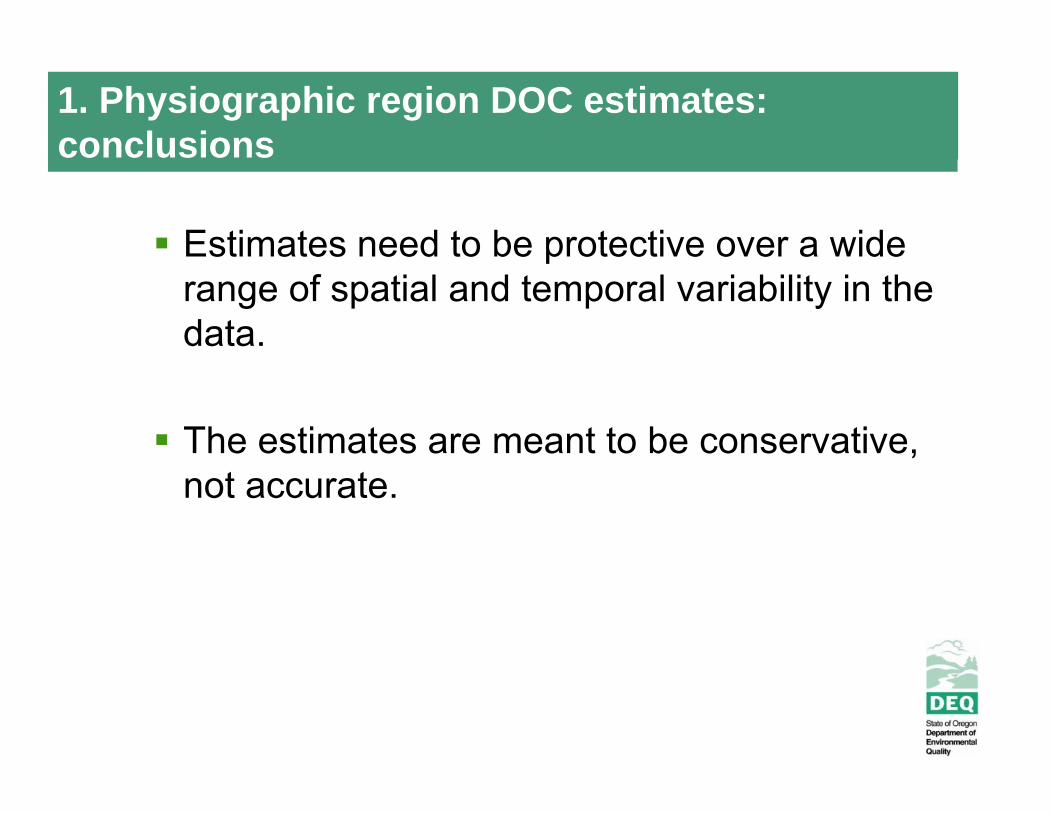
Estimates need to be protective over a wide range of spatial and temporal variability in the data.
The estimates are meant to be conservative, not accurate.
1. Physiographic region DOC estimates: conclusions

Calculate IWQC for all samples with sufficient data
Apply a percentile of the population of measured criteria to use as default criteria
2. Default criteria from model outputs
Biotic Ligand Model
Data Inputs Outputs IWQC

n = 205 n = 929 n = 1133 n = 2340
DL (0.05 ug/L)
QL (1.5 ug/L)
0.1
0.5
1.0
5.0
10.0
25.0
50.0
100.0
Cascades Coastal Eastern Willamette ValleyRegions
Chr
onic
IWQ
C2. Default criteria from model outputs
10th%
25thth%
75thth%
95th %
Median

Copper IWQC for the different physiographic regions have statistically different sample medians
Median and 10th % IWQC values were near or below quantification limits for copper
IWQC values can vary widely within and among sites.
2. Default criteria from outputs: conclusions

Part 3:Applying Criteria from the BLM
Part 3

Comparing BLM criteria to HB criteria
Compare BLM Criteria to Hardness-Based Criteria
Assess changes in attainability
Identify vulnerable conditions where HBC are not protective
Identify vulnerable regions / locations

0
25
50
75
5 10 15 20
Chronic Hardness Criteria (ug/L)
Chr
onic
BLM
IWQ
C (u
g/L)
NMFSProposed Default:
1.45 ug/L
Comparison of hardness-based and BLM derived chronic criteria
Comparing BLM criteria to HB criteria
BLM less stringentn=164
BLM more stringentn=178
Totaln=342

LOOKOUT CREEK NEAR BLUE RIVER, OR
LITTLE ABIQUA CREEK NEAR SCOTTS MILLS, OR
Siuslaw River at Tide boat ramp
COLUMBIA RIVER @ BEAVER ARMY TERMINAL NR QUINCY,OR
Umatilla River at Westland Road (Hermiston)
WILLAMETTE RIVER AT PORTLAND, OR
ZOLLNER CREEK NEAR MT ANGEL, OR
123
1.62.02.4
510
510
01020304050
05
1015
5101520
2001 2003 2005 2007 2009 2011 2013 2015
Chr
onic
Cu
Crit
eria
(ug\
L)
Criteria HBC BLM-IWQC
Comparing BLM criteria to HB criteria

Comparing BLM criteria to HB Criteria

Comparing BLM and HBC: conclusions
BLM criteria generally less stringent than HBC• BLM expected to more accurately measure Cu toxicity
Temporal variability of BLM > HBC
HBC not protective for some locations• Low DOC , <1.5mg/L• Neutral pH, <7.4, and below
Depends on sample chemistry, not location

Comparing BLM criteria to copper
Calculate criteria for sites with sufficient data
How does copper concentration in the environment compare to criteria developed by the BLM?

Comparing BLM criteria to copper
Where:TU > 1 = exceeds the water quality criteria TU ≤ 1 = meets the water quality criteria
i
ii IWQC
CuTU

Comparing BLM criteria to copperChronic Toxic Units
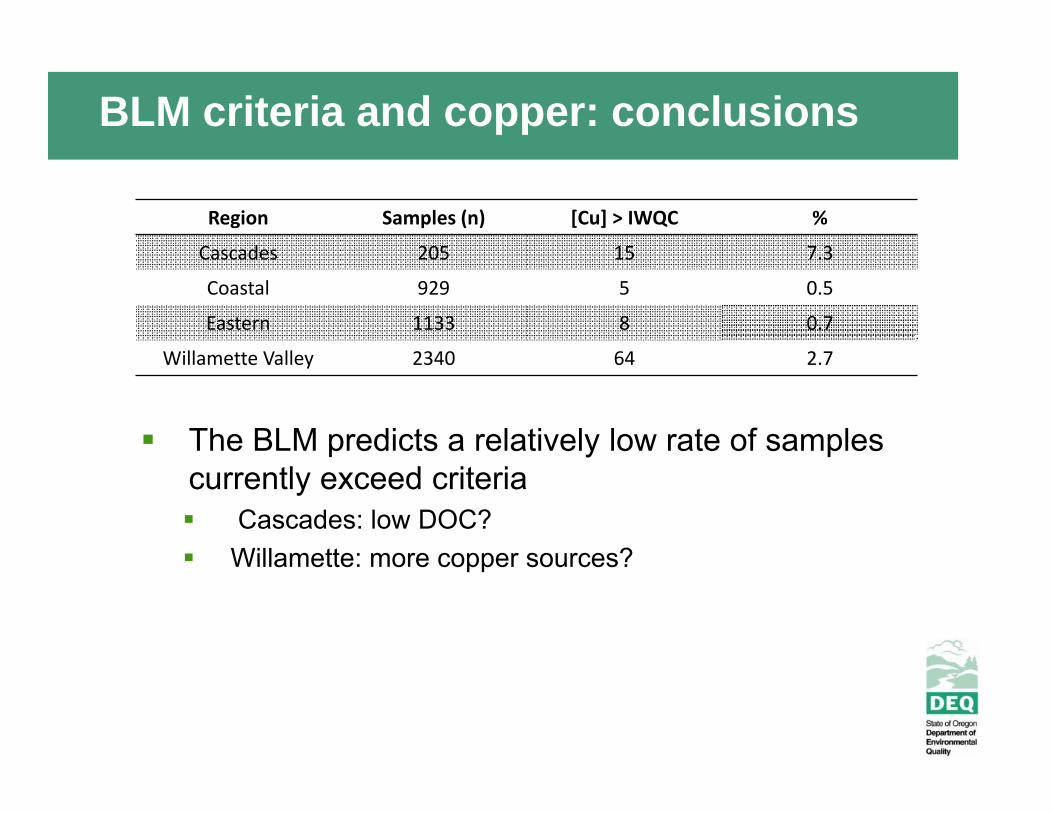
BLM criteria and copper: conclusions
Region Samples (n) [Cu] > IWQC %
Cascades 205 15 7.3
Coastal 929 5 0.5
Eastern 1133 8 0.7
Willamette Valley 2340 64 2.7
The BLM predicts a relatively low rate of samples currently exceed criteria Cascades: low DOC? Willamette: more copper sources?

Key conclusions of the technical review
Biotic Ligand Model
Data Inputs Outputs IWQC

DEQ developed a database of existing archived and current monitoring data that could be used to calculate BLM-based criteria.
The BLM is most sensitive to DOC and pH, and this sensitivity was verified in Oregon’s dataset.
The derivation of BLM-based criteria for most locations requires estimation of some missing parameters
Measurements of specific conductance were found to provide strong correlation to geochemical ions and alkalinity
Regional observations of DOC may provide an estimation method where measured DOC data are insufficient.
Key conclusions: acquiring data

DOC estimates derived from EPA and DEQ databases are generally conservative in order to ensure they are protective over the potential range of conditions at a site.
Given the high spatial and temporal variability of DOC, collection of sufficient DOC is necessary to establish accurate:
Water Quality CriteriaWater Quality Based Effluent LimitsAssessment of copper water body impairmentsSensitive environmental conditions
Key conclusions: generating criteria

BLM-derived criteria were frequently higher than Oregon’s hardness-based criteria (total recoverable copper)
Existing hardness-based criteria may not be protective of aquatic life in locations with very low DOC and low pH.
Temporal variation in criteria must be considered when applying BLM results.
Key conclusions: applying criteria

The median and 10th percentile of statewide IWQCs are near or below typical quantification limits (QL) of ~1.5-2 μg/L for copper.
The number of samples where copper concentrations exceed BLM criteria generated for sites where DEQ had sufficient data to derived BLM criteria is relatively low.
BLM-derived criteria can vary widely across / within waterbodies.
Key conclusions: applying criteria

AcknowledgementsExternal Review PanelKathleen Collins EPA, Region 10Luis CruzJoe Beaman EPA, Headquarters
Jeff Lockwood National Marine Fisheries Service, NOAAChris Mebane U.S. Geologic Survey, USGSDianne Barton Columbia River Intertribal Fish CommissionDr. Bill Stubblefield Oregon State UniversityDr. Jeff Louch,Dr. Barry Malmberg
National Council for Air and Stream Improvement, Inc.
Bob Baumgartner Clean Water ServicesDr. Robert Gensemer,John GondekAmanda Kovach
GEI Consultants, Inc.
Scott TobiasonRobert SantoreDave DeForest
Windward Environmental, LLC
Oregon DEQ Internal Review PanelDebra Sturdevant Water Quality Standards and AssessmentsJames Bloom Watershed ManagementErich Brandstetter Surface Water ManagementGreg Coffeen Water Quality MonitoringSteve Schnurbusch Permits and Compliance – DEQ Western Region
Karla Urbanowicz Water Quality Standards and Assessments

Questions?
Windward Environmental, LLC