Embed Size (px)
Citation preview

Pershing Square Capital Management, L.P.
A Homespun FortuneOctober 18, 2011

Disclaimer
The analyses and conclusions of Pershing Square Capital Management, L.P. ("Pershing Square") contained inthis presentation are based on publicly available information. Pershing Square recognizes that there may beconfidential information in the possession of the companies discussed in this presentation that could leadthese companies to disagree with Pershing Square’s conclusions. This presentation and the informationcontained herein is not investment advice or a recommendation or solicitation to buy or sell any securities.All investments involve risk, including the loss of principal.
The analyses provided may include certain statements, estimates and projections prepared with respect to,among other things, the historical and anticipated operating performance of the companies discussed in thispresentation, access to capital markets, market conditions and the values of assets and liabilities. Suchstatements, estimates, and projections reflect various assumptions by Pershing Square concerninganticipated results that are inherently subject to significant economic, competitive, and other uncertaintiesand contingencies and have been included solely for illustrative purposes. No representations, express orimplied, are made as to the accuracy or completeness of such statements, estimates or projections or withrespect to any other materials herein and Pershing Square disclaims any liability with respect thereto. Actualresults may vary materially from the estimates and projected results contained herein.
Funds managed by Pershing Square and its affiliates are invested in Fortune Brands Home & Security, Inc.(“FBHS”) common stock and cash settled derivative financial instruments based on the price of FBHScommon stock. Pershing Square manages funds that are in the business of trading – buying and selling –securities and financial instruments. It is possible that there will be developments in the future that causePershing Square to change its position regarding FBHS. Pershing Square may buy, sell, cover or otherwisechange the form of its investment in FBHS for any reason. Pershing Square hereby disclaims any duty toprovide any updates or changes to the analyses contained here including, without limitation, the manner ortype of any Pershing Square investment.
1

Fortune Brands Home & Security
2
FBHS (or the “Company”) is a leading North Americanresidential building products company
Manufacturer of:
Faucets
Kitchen and bath cabinets
Security and storage products
Windows and doors
Equity market capitalization of ~$2.0bn
Enterprise valuation of ~$2.5bn
Spun-off from Fortune Brands on October 4, 2011
Ticker: “FBHS”
Recent stockprice: $13 (1)
(1) Based on stock price as of Friday, October 14 2011.

Snapshot of FBHS
Plumbing
#1 Faucet brand in North America
Stable business driven by replacementdemand and “low ticket” remodeling projects
3
Kitchen & Bath Cabinetry
Windows and Doors
Security and Storage
#1 N. American kitchen and bath cabinet maker
Leveraged to housing recovery
#1 Padlock brand in North America
Stable, recurring cash flows
Good growth potential
Leveraged to housing recovery

Investment Highlights
4
Secular Winner…
Industry leader with significant scale and strong market positions
Winning new business and growing as financially leveraged competitorsremain defensive
Strong management team -- highly experienced operators
…And Cyclical Winner
Well-positioned when the housing market normalizes
Cyclical growth will not require capital investment above normal levels
Immense operating leverage: EBITDA can be 3x in a normalized housing market
Platform Business
Highly fragmented industry is ripe for consolidation
Opportunities to leverage scale and distribution through acquisitions inadjacent categories (i.e. electronic security, bath accessories)
Investment Highlights
5(1) See page 31 for valuation analysis.
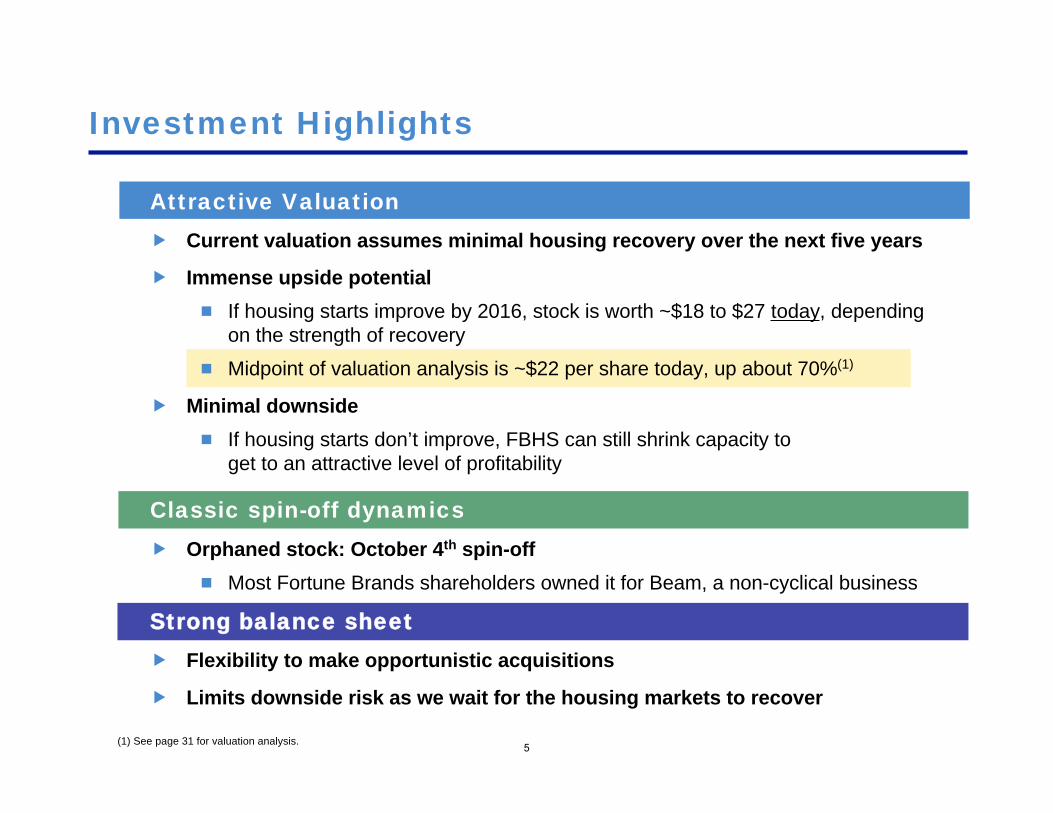
Attractive Valuation
Current valuation assumes minimal housing recovery over the next five years
Immense upside potential
If housing starts improve by 2016, stock is worth ~$18 to $27 today, dependingon the strength of recovery
Midpoint of valuation analysis is ~$22 per share today, up about 70%(1)
Minimal downside
If housing starts don’t improve, FBHS can still shrink capacity toget to an attractive level of profitability
Classic spin-off dynamics
Orphaned stock: October 4th spin-off
Most Fortune Brands shareholders owned it for Beam, a non-cyclical business
Strong balance sheet
Flexibility to make opportunistic acquisitions
Limits downside risk as we wait for the housing markets to recover

FBHS: Business Overview

Plumbing
7
FinancialsCommentary
Manufactures faucets,accessories, and kitchen sinksunder the #1 Moen brand
Large installed base helps winreplacement sales
Faucets are a “small ticket”remodeling expenditure – anaffordable way to improve thelook of the bathroom/kitchen
Generally a stable categorywhere branding and innovationcan drive marketplace gains
Variable-cost business model
The Plumbing segment, which contributed 54% of FBHS pre-corporate2010 EBIT, has performed exceptionally well in the downturn due toboth marketplace gains and the “small ticket” aspect of the category
$ in millions
Plumbing FY 2008 FY 2009 FY 2010
Revenue $967 $835 $924
Growth (14)% 11 %
EBIT $171 $117 $133
Margin 17.6 % 14.0 % 14.3 %
% of FBHS Revenues 26% 28% 29%
% of FBHS pre-corp EBIT 48% 81% 54%

Kitchen & Bath Cabinets FY 2008 FY 2009 FY 2010
Revenue $1,552 $1,126 $1,189
Growth (27)% 6 %
EBIT $141 $4 $31
Margin 9.1 % 0.4 % 2.6 %
% of FBHS Revenues 41% 37% 37%
% of FBHS pre-corp EBIT 40% 3% 13%
Kitchen & Bath Cabinets
8
#1 North American manufacturer of kitchen and bath cabinets
Key brands include: Aristokraft, Omega, and Diamond
Well-balanced distribution channels and flexible supply chain allow for differentiatedprice points and multiple levels of cabinet customization
Distributes through dealers, wholesalers, home centers, and large builders
Highly geared to “big ticket” remodeling projects and new home construction
Currently winning new business against competitors like Masco
High fixed-cost business model
The Cabinets segment is barely profitable today as demand for newhomes and “big ticket” remodeling projects has diminished drastically
$ in millions
The segment has significant excesscapacity, which is pressuringmargins today, but will allow forexplosive growth when the housingmarkets recover

Security & Storage FY 2008 FY 2009 FY 2010
Revenue $571 $495 $520
Growth (13)% 5 %
EBIT $59 $42 $61
Margin 10.3 % 8.4 % 11.7 %
% of FBHS Revenues 15% 16% 16%
% of FBHS pre-corp EBIT 17% 29% 25%
Security and Storage
FinancialsCommentary
Manufactures Masterlockpadlocks and Waterloo storageproducts
Historically stable demand incore padlock market
FBHS exploring opportunitiesto expand Masterlock brandthrough acquisitions
Good potential to grow inadjacent categories (electronicsecurity and monitoring)
Masterlock is a great business with a strong marketplace position,stable cash flows, minimal capex requirements and good growthpotential in adjacent categories
$ in millions
Security and Storage contributed 25% ofFBHS’s 2010 EBIT
9

Windows and Doors
FinancialsCommentary
Manufactures fiberglass andsteel residential and patio doorsystems and vinyl-framedwindows
Key brands includeTherma-Tru Doors andSimonton Windows
Currently lapping difficultcomparisons driven by 2010federal tax credits for energyefficiency
EBIT Margins remain depressed as thesegment is significantly leveraged to newhome construction
FBHS’s Windows and Doors segment contributed only 8% of total pre-corporate EBIT in 2010.
$ in millions
10
Windows & Doors FY 2008 FY 2009 FY 2010
Revenue $668 $551 $601
Growth (18)% 9 %
EBIT ($17) ($19) $21
Margin (2.6)% (3.4)% 3.4 %
% of FBHS Revenues 18% 18% 19%
% of FBHS pre-corp EBIT (5)% (13)% 8 %
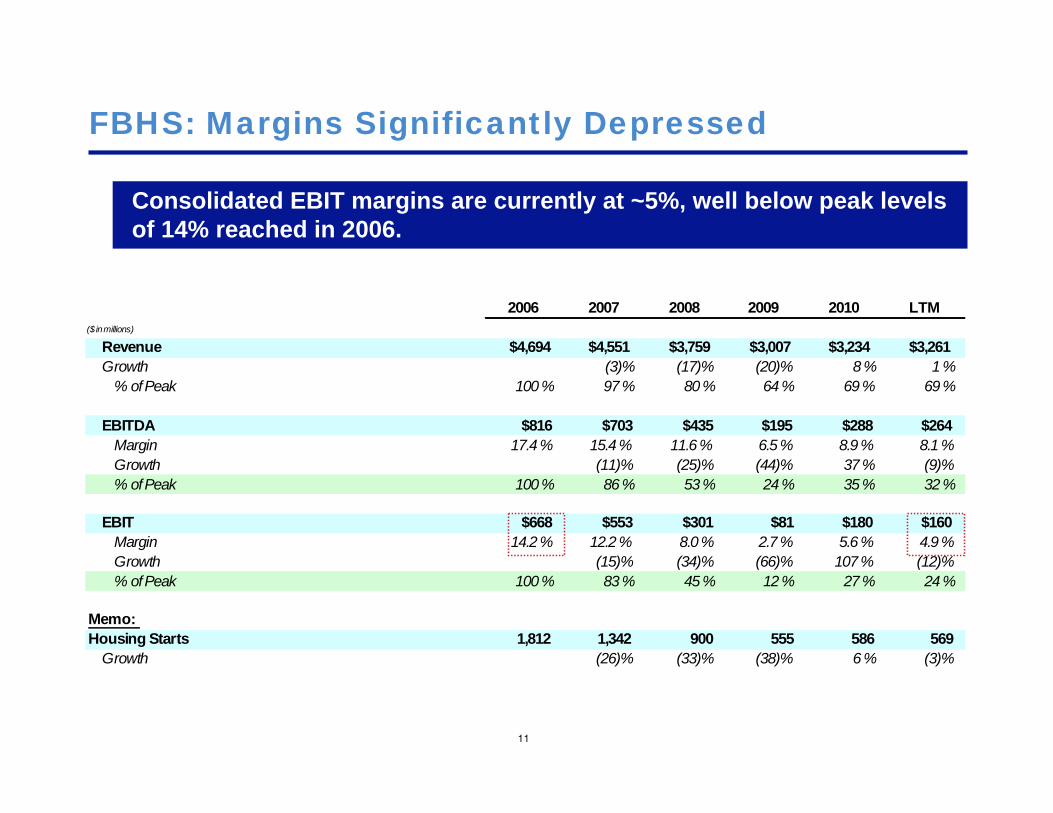
2006 2007 2008 2009 2010 LTM
($ in millions)
Revenue $4,694 $4,551 $3,759 $3,007 $3,234 $3,261
Growth (3)% (17)% (20)% 8 % 1 %
% of Peak 100 % 97 % 80 % 64 % 69 % 69 %
EBITDA $816 $703 $435 $195 $288 $264
Margin 17.4 % 15.4 % 11.6 % 6.5 % 8.9 % 8.1 %
Growth (11)% (25)% (44)% 37 % (9)%
% of Peak 100 % 86 % 53 % 24 % 35 % 32 %
EBIT $668 $553 $301 $81 $180 $160
Margin 14.2 % 12.2 % 8.0 % 2.7 % 5.6 % 4.9 %
Growth (15)% (34)% (66)% 107 % (12)%
% of Peak 100 % 83 % 45 % 12 % 27 % 24 %
Memo:
Housing Starts 1,812 1,342 900 555 586 569
Growth (26)% (33)% (38)% 6 % (3)%
FBHS: Margins Significantly Depressed
11
Consolidated EBIT margins are currently at ~5%, well below peak levelsof 14% reached in 2006.

Segments: A Tale of Two Cities
The company’s operating profit margin decline is primarily the result ofcomparatively weaker performance in the highly cyclical Cabinets andWindows/Doors segments…
FBHS Segments Doing Well Today: FBHS Segments Under Pressure:
% of FBHS % of FBHS
2010 Revenue 2010 EBIT (1)
Plumbing 29% 54%
Security and Storage 16% 25%
Total 45% 79%
% of FBHS % of FBHS
2010 Revenue 2010 EBIT (1)
Cabinets 37% 13%
Windows / Doors 19% 8 %
Total 55% 21%
Strong and stable replacement demand
Leveraged to “low-ticket” remodeling
More variable-cost model
Represents ~45% of FBHS sales and~80% of FBHS EBIT today (1)
Margins have held up nicely
Leveraged to new home construction andbig ticket remodeling
More fixed-cost model
Represents 55% of FBHS sales and ~20%of FBHS EBIT today (1)
Currently at low capacity utilization rates,in anticipation of a recovery
Explosive growth potential when housingmarkets recover12(1) Excludes corporate costs

2004 2005 2006 2007 2008 2009
Employees 21,171 21,480 27,729 22,771 18,409 15,834
Y-o-Y Change 1 % 29 % (18)% (19)% (14)%
Change Since Peak (18)% (34)% (43)%
Manufacturing Plants 48 53 64 56 47 41
Y-o-Y Change 10 % 21 % (13)% (16)% (13)%
Change Since Peak (13)% (27)% (36)%
Restructured the Business in the Downturn…
The Company substantially improved its cost structure by reducing itsfootprint between 2006 and 2009. Manufacturing facilities andemployee count have been reduced by roughly 40%.
13

…But Kept Enough Capacity for a Recovery
Currently operating at ~60% capacity overall, in anticipation of arecovery
Lower levels of capacity at highly cyclical segments (Cabinet andWindow/Doors)
Higher levels of capacity in more stable segments (Plumbing andSecurity)
Footprint is currently right-sized to support $5bn in sales (at 1.5mmnew housing starts)
Current sales base is ~$3.3bn
FBHS is well-positioned to accelerate profit growth as volumes grow ina recovery scenario
14

% of 2010 2010 Normalized
Revenue Margins Margins
Cabinets 37 % 2.6 % 10 %
Plumbing 29 % 14.3 % 15 %
Windows Doors 19 % 3.4 % 8 %
Security & Storage 16 % 11.7 % 12 %
Segment 7.6 % 11 %
Corp. Expense as % of Rev (2.0)% (1.4)%
Total 5.6 % 10 %
What If Capacity Were Reduced Further?
If management becomes more bearish about a recovery, it can reducecapacity further and shrink the cost base. We believe that if thebusiness were right-sized to the current sales base of ~$3.3bn, EBITmargins could be approximately 10%
15
Cap
acity
reductio
n
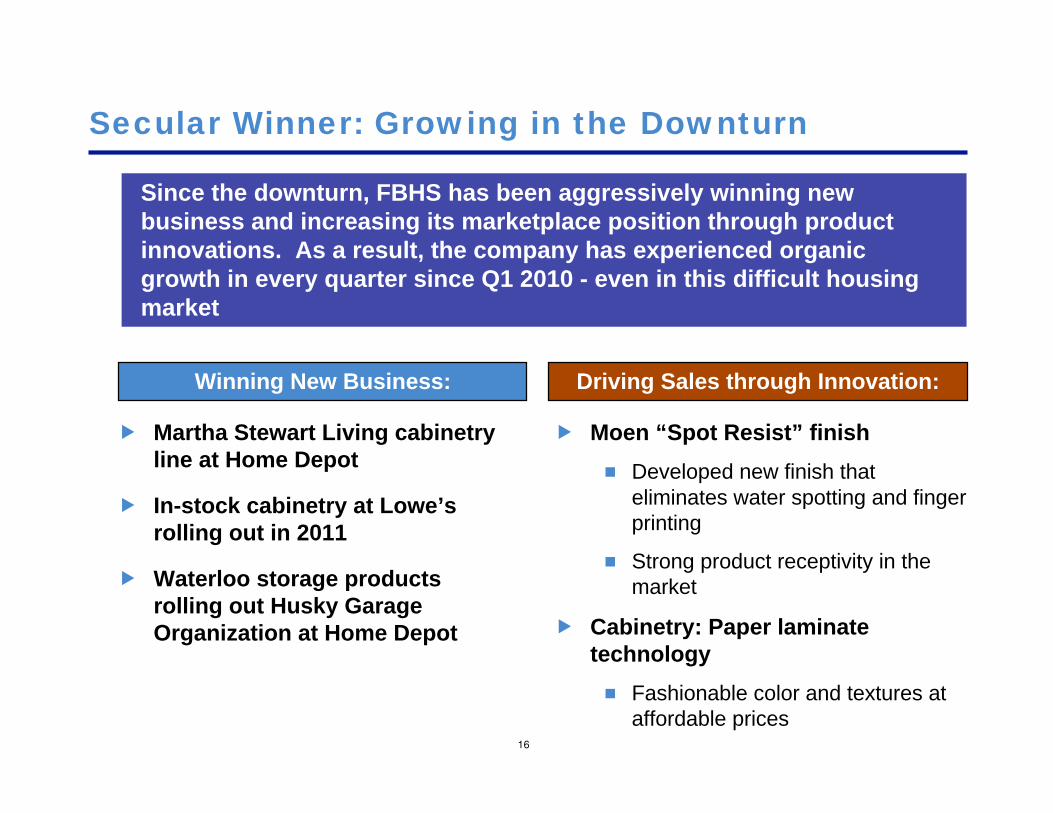
Secular Winner: Growing in the Downturn
16
Winning New Business: Driving Sales through Innovation:
Martha Stewart Living cabinetryline at Home Depot
In-stock cabinetry at Lowe’srolling out in 2011
Waterloo storage productsrolling out Husky GarageOrganization at Home Depot
Moen “Spot Resist” finish
Developed new finish thateliminates water spotting and fingerprinting
Strong product receptivity in themarket
Cabinetry: Paper laminatetechnology
Fashionable color and textures ataffordable prices
Since the downturn, FBHS has been aggressively winning newbusiness and increasing its marketplace position through productinnovations. As a result, the company has experienced organicgrowth in every quarter since Q1 2010 - even in this difficult housingmarket

Strong Balance Sheet Allows for Flexibility
Total Debt / EBITDA (1):
The Company has significantly less financial leverage than its peersallowing it to acquire smaller building products companies that arecurrently operating at trough levels of profitability
FBHS:
$520mm of total debt
LTM EBITDA - Capex:$194mm
No liquidity concerns
(1) Peer average based on Moody’s. Peers include Armstrong, Lennox, Masco, Mohawk, Owens Corning, Stanley Black &Decker and Whirlpool. FBHS leverage based on 12/31/2010 pro forma metrics.
17

Housing Market Review

Long-term Housing Market Drivers
New Home
Construction
Repair and
Remodel
Positive population / immigration growth
Increased levels of household formation
Favorable housing affordability
Aging housing stock (average of 40years), particularly homes > 12 years
Existing home sales
Note: This page is taken from FBHS investor presentation dated September 6, 2011
Economic factors that enable a recovery:
Consumer confidence
Unemployment—at the local market level
Credit availability
Stability in home prices
19

Historical Housing Starts: 1965 to Present
20
Housing starts are currently at the lowest levels in the last 40 years andwell below the long term annual average of ~1.5mm
Average~1.5mm
Source: Bloomberg

We are in Year Five of the Housing Recession
21
Housing starts are currently at ~25% of peak levels achieved in 2006and have been below the long-term trend of sustainable housingdemand for nearly 4 years
Peak:
~2.3mm
Trough: <0.5mm
Current: ~0.6mm
Average~1.5mm
Source: Bloomberg

What a Housing Recovery Might Look Like
22
We believe that the current level of excess supply is ~2mm to 2.5mm housingunits and normalized housing demand is approximately 1.5mm
At a normalized level of housing demand:
Excess housing supply could be eliminated in roughly 2.5 years if housing startsremain at ~600k
At the depressed level of housing demand (~1m):
Excess supply could be eliminated in ~ 5.5 years if housing starts remain at~600k
Although the pace of the housing recovery is difficult to predict, webelieve a recovery over the next several years is highly likely
Depressed Normalized
Housing Demand 1,000 1,500
Housing Starts 600 600
Annual Reduction of Excess Supply 400 900
Current Excess Supply 2,250 2,250
Years to Zero Excess Supply 5.6 2.5
(Units in 000s, except years)

Repair/Remodel Market Overview
23
Repair / Remodeling projects are generally discretionary
Certain replacement projects can wait: Cabinets, tiling (versus more criticalitems such as doors, windows, roofing)
Weak existing home sales are hurting the R&R market - new homeownersspend 2x the average repair/remodel level
Despite the weak market, there is pent-up demand from an aging housingstock
Today the ticket matters a lot
Big ticket remodel items (cabinets, tiling) are weak
Small ticket remodel items (faucets, paint) are showing strength
Longer term, Repair / Remodel growth rates tend to trend in linewith GDP

Housing Market Summary
24
Housing starts are currently at the lowest levels in 40 years
Long-term average of housing starts is ~1.5mm versus today of 600k
Repair and remodel market is likely facing pent-up demand given aginghousing stock
Before housing starts return to their long-term trend, we need to absorbthe current excess supply of homes – a matter of time
The current level of housing starts (~600k) is unsustainable over thelonger term
Historical levels of annual household formation are far in excess of 600k
We think a meaningful recovery in housing starts could happen in thenext several years
However, new homes will likely be smaller and more affordable (cheaperproducts) than in recent years
FBHS’s market position may improve, given the Company’s skew to morevalue-priced products

“The only way a correction takes place is to have
household formation exceed new construction by a
significant amount for a significant period of time. We've
had it for quite a while. And when you see these figures
of 500,000 or 600,000, that means we're sopping up
housing inventory. And I don't know exactly when that
hits equilibrium, but it isn't five years from now. I know
that. And I think it actually could be reasonably soon.”
--Warren Buffett (July 8, 2011 Bloomberg TV interview)
25

Valuation

Upside Case: Housing Recovery
27
EBITDA: ~$265MM
EBITDA: ~$550MM
EBITDA: ~$850MM
Home Starts ~0.6M 1MM 1.5MM
Revenue $3B $4B $5B
EBITDA Margin 8% ~14% ~17%
Management estimates that when housing starts recover to ~1mm to1.5mm, EBITDA will be 2 to 3x current levels
~2X LTMEBITDA
~3X LTMEBITDA
Note: Partial Recovery assumes 2-3% Repair & Remodel CAGR and Full Recovery assumes 4-6% CAGR
PartialRecovery
Full Recovery /Normalized Starts
Last TwelveMonths

Downside: What if there is No Housing Recovery?
28
If housing starts were to stay at depressed levels (~600k) for the longerterm, we believe FBHS could right-size the business to achieve a morenormalized level of profitability
We estimate that FBHS can generate at least $400MM in EBITDA ontoday’s sales base by cutting capacity and excess cost
FBHS has maintained excess capacity to position itself for a housingrebound
If it fails to materialize, we believe management can right-size the coststructure and achieve a ~10% EBIT margin
FY 2011E Revenue $3.3bn
Normalized EBIT Margin 10%
EBIT $330mm
Plus: D&A (reduced capacity) 70mm
EBITDA $400mm

No Recovery Recovery
LTM (Cut Capacity) Partial Full
Housing Starts (000s) 569 600 1,000 1,500
EBITDA $264 $400 $550 $850
EBITDA - Capex $194 $330 $450 $750
EPS $0.57 $1.26 $1.76 $3.00
FCF per Share $0.79 $1.26 $1.76 $3.00
EV / EBITDA 9.7 x 6.4 x 4.7 x 3.0 x
EV / EBITDA-Capex 13.2 x 7.8 x 5.7 x 3.4 x
P/E 23.0 x 10.3 x 7.4 x 4.3 x
P/FCF 16.5 x 10.3 x 7.4 x 4.3 x
Current Trading Multiples
29
FBHS currently trades ~9.7x LTM EBITDA and ~16.5x LTM cash earnings. Ifno recovery occurs, FBHS is trading at ~10x our estimate of cash earnings.If a recovery occurs, FBHS trades at ~4x to 7x our estimates of cashearnings, depending on the strength of recovery
Note: EPS and FCF per share based on a 35% normalized tax rate.
Memo: Market Capitalization
Recent Stock Price $13.00
Diluted Shares (mm) 157Market Cap $2,045
Plus: Net Debt 520Enterprise Value $2,565

Valuing FBHS in a Recovery
30
Assuming a 7x Forward EBITDA multiple, even if the recovery isprotracted or prolonged, we believe we will earn an attractive IRR atthe current share price
Note: Assumes 7x EBITDA exit multiple and includes the value of annual free cash flow generated until exit. Based on R&M CAGR of2-3%, 3-4%,and 4-6% for housing starts of 1.0m,1.3m, and 1.5m
Total Return
Housing Starts 1.0M 1.3M 1.5M
EBITDA $550 $700 $850
2014 83 % 139 % 196 %
Recovery 2015 92 % 151 % 209 %
Year 2016 101 % 162 % 223 %
2017 111 % 174 % 237 %
IRR
Housing Starts 1.0M 1.3M 1.5M
EBITDA $550 $700 $850
2014 35 % 55 % 72 %
Recovery 2015 24 % 36 % 46 %
Year 2016 19 % 27 % 34 %
2017 16 % 22 % 28 %

Stock Price at Various Levels of Recovery
31
~$14 per share
~$18 per share
~$27 per share
Housing Starts 0.6M 1.0M 1.5M
Year 2014 2016 2016
EBITDA ($MM) $400 $550 $850
EBITDA Multiple 7x 7x 6.5x
Assuming on a housing recovery over the next several years, we believe FBHS is
worth ~$18 to $27 per share today. The midpoint valuation is $22/share today,
which is up ~70% from the recent share price of $13. If the housing market never
recovers, we believe FBHS is still worth nearly $14 per share today
PartialRecovery
Full Recovery /Normalized Starts
No Recovery(capacity reduction)
~40% upside
~110% upside
~8% upside
Note: Assumes 157MM shares, $520MM of net debt, and uses a 10% discount rate to discount the future stock price to today. Includes thevalue of annual free cash flow generated until exit.
What FBHS is worth today:

Conclusion
32
Pace and strength of a housing recovery is difficult to predict
However, at some point, the housing markets will recover
Investing in FBHS is a low-risk way to profit from an eventual housingmarket recovery
Pure-play residential building products company
Best operators in the business
Improving marketplace position, even in tough housing markets
Many of its competitors are on the defensive
No liquidity concerns and currently generating a healthy FCF yield of 6%
Downside is limited, given clean balance sheet and Company’s ability toreduce capacity, if necessary
Upside potential is enormous, as cyclical growth will not require capitalinvestment above normal levels