Embed Size (px)
Citation preview

February 9, 2016
Company name HORIBA, Ltd. Listed stock exchanges: Tokyo
Listing code 6856 URL: http://www.horiba.com
Representative Atsushi Horiba, Chairman, President and CEO TEL: (81)75-313-8121
Contact Junichi Tajika, Department Manager, Financial & Control Division, Accounting Dept.
Scheduled date of start of dividend payment: March 7, 2016
(Figures have been rounded down to the nearest million yen)
1. Consolidated Results for the Year Ended December 31, 2015 (January 1, 2015 - December 31, 2015)(1) Consolidated Operating Results (Percentages represent changes from the previous year)
Net Sales Operating Income Ordinary Income Net Income% % % %
11.7 12.5 14.5 21.710.8 25.3 26.0 17.7
(Note) Comprehensive Income: FY2015 9,702 million yen -22.5%, FY2014 12,511 million yen -27.1%
Net Income per ShareNet Income per Share
(Diluted)Return on Equity
Ordinary Incometo Total Assets
OperatingIncome to Net
Sales
Yen Yen % % %
(Reference) Equity in earnings of affiliates: FY2015 ― million yen, FY2014 -660 million yen
(2) Consolidated Financial Position
Total Assets Net AssetsShareholders' Equity
RatioNet Assetsper Share
(Reference) Net assets excluding subscription rights to shares and minority interests in consolidated subsidiaries: As of December 31, 2015: 129,581 million yen; As of December 31, 2014: 123,924 million yen
(3) Consolidated Cash Flows
Cash Flows fromOperating Activities
Cash Flows fromInvesting Activities
Cash Flows fromFinancing Activities
Cash and CashEquivalents at end of
the period
2. Dividends
3. Consolidated Forecast for the Year Ending December 31, 2016 (January 1, 2016 - December 31, 2016)
(Percentages represent changes from the same period in the previous year)
Millions of yen % Millions of yen % Millions of yen % Millions of yen % Yen
First half 4.3 (22.7) (24.3) (22.4)Full year 1.6 (13.4) (16.7) (20.0)
305.73 304.36 10.2 8.6 11.3
231,032207,335
130,050124,314
56.159.8
3,078.402,928.82
Yen%
17,500 16,500 10,800
Ordinary Income
8,500 8,100 5,200
Net income attributableto owners of parent
Net Income attributableto owners of parent per
ShareOperating Income
256.57123.53
Millions of yen Millions of yen Millions of yen Millions of yen
250.28 249.28 8.9 8.3
Millions of yen Millions of yen
11.2
Millions of yen Millions of yenMillions of yen Millions of yen
18,84816,454
12,88210,589
170,898153,065
19,37217,214
The Company and its consolidated subsidiaries in Japan changed the accounting policy for revenue recognition from fiscal 2016.They had historically recognized revenue mainly on the date of shipment of products and systems. From fiscal 2016, however, theymainly recognize revenue on the date of delivery or installation based on contractual arrangements and others.The percentage of changes compared with preceding period and the same period of previous year are calculated based on theretrospectively-restated amounts of fiscal 2015. Those retrospectively-restated amounts are unaudited and are subject to change.
175,000
Year ended 12/31/15Year ended 12/31/14
Year ended 12/31/15
As of 12/31/15
Net Sales
85,000
Year ended 12/31/15
Year ended 12/31/14
Year ended 12/31/14
As of 12/31/14
14,77011,455
(30,642)(9,875)
12,843(273)
47,85951,109
Summary of Consolidated Financial Statements for the Year Ended December 31, 2015(Japanese GAAP)
Payout Ratio(Consolidated)
Year ended 12/31/14
45.00 75.00-Year ending 12/31/16
(Forecast)29.2
42.00
Firstquarter
Dividends to NetAssets
(Consolidated)
Yen Millions of yen % %
Total Dividends(Annual)
-
Year ended 12/31/15 - 28.00 -
30.00
Secondquarter
Dividend per share
- 25.00 -
Thirdquarter
Year end Total
42.00 2.4
2.32,946
Yen Yen Yen Yen
67.00
22.970.00
2,834 26.8
1 HORIBA, Ltd. (Consolidated)
Notes
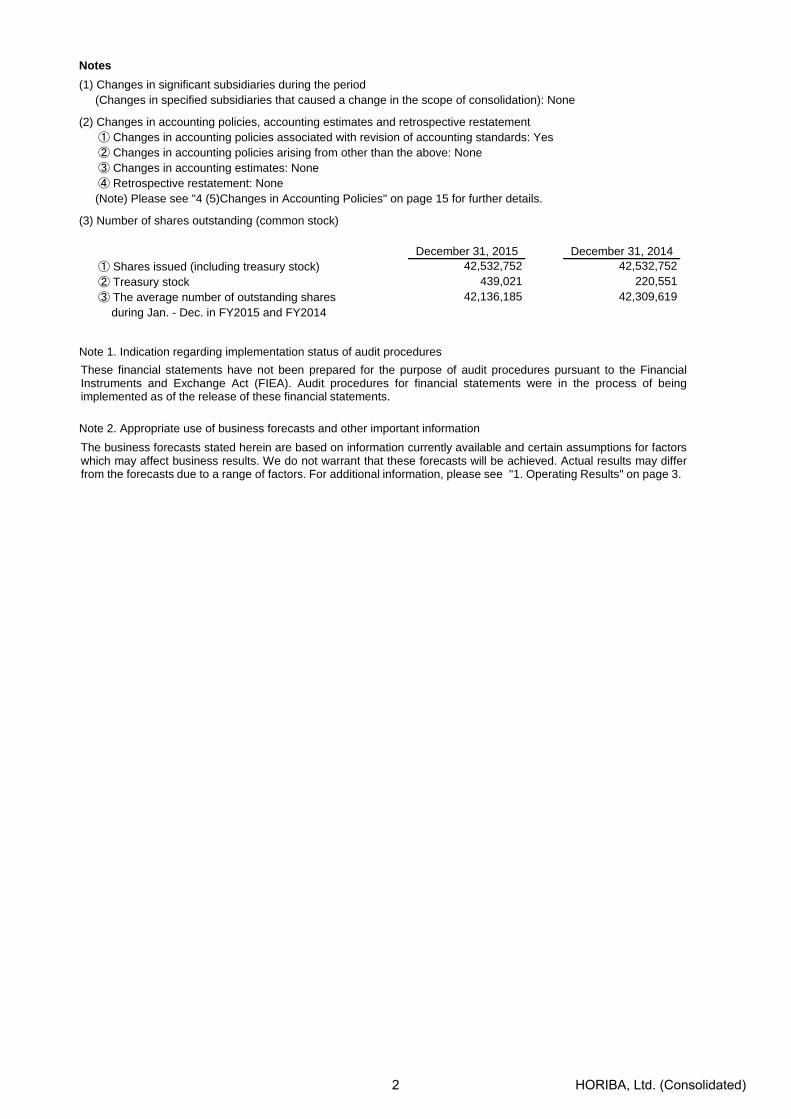
(1) Changes in significant subsidiaries during the period (Changes in specified subsidiaries that caused a change in the scope of consolidation): None
(2) Changes in accounting policies, accounting estimates and retrospective restatement① Changes in accounting policies associated with revision of accounting standards: Yes② Changes in accounting policies arising from other than the above: None③ Changes in accounting estimates: None④ Retrospective restatement: None
(Note) Please see "4 (5)Changes in Accounting Policies" on page 15 for further details.
(3) Number of shares outstanding (common stock)
December 31, 2015 December 31, 2014① Shares issued (including treasury stock)② Treasury stock③ The average number of outstanding shares
during Jan. - Dec. in FY2015 and FY2014
Note 1. Indication regarding implementation status of audit procedures
Note 2. Appropriate use of business forecasts and other important information
42,532,752 42,532,752
42,136,185 42,309,619439,021 220,551
These financial statements have not been prepared for the purpose of audit procedures pursuant to the FinancialInstruments and Exchange Act (FIEA). Audit procedures for financial statements were in the process of beingimplemented as of the release of these financial statements.
The business forecasts stated herein are based on information currently available and certain assumptions for factorswhich may affect business results. We do not warrant that these forecasts will be achieved. Actual results may differfrom the forecasts due to a range of factors. For additional information, please see "1. Operating Results" on page 3.
2 HORIBA, Ltd. (Consolidated)
1. Operating Results
(1) Operating Results Analysis
(For details, see page 17, “HORIBA, Ltd. Financial Highlights for the Year Ended December 31, 2015”)
(i) Operating Results for the year ended December 2015
With regard to the global economy in the fiscal year ended December 31, 2015, the United Stated continued its economic
recovery due to growth in private consumption and other factors on the back of an improved employment environment. In
Europe, despite debt problems and geopolitical risks, a moderate economic recovery continued. Among emerging markets,
Chinese economy decelerated moderately with weakness in fixed asset investment and exports. Southeast Asia
experienced a slowdown in the economy due to influence of Chinese economic slowdown and the drop in commodity
prices. In Brazil, the difficult economic conditions resulted in a currency depreciation and deteriorated the economy.
In Japan, despite some signs of weakness, the economy continued its moderate recovery on the back of improved
corporate earnings, with a continued recovery in corporate capital investment and a steady improvement in employment
and wage environment.
The annual average exchange rates for 2015 were 121.10 yen against the U.S. dollar and 134.31 yen against the euro,
representing year-on-year depreciation of 12.6% against the U.S. dollar and appreciation of 4.5% against the euro.
In the analytical and measurement equipment industry, semiconductor-related investment remained at a high level
throughout fiscal year 2015, and demand for semiconductor production equipment expanded. In the automotive industry as
well, capital and R&D investment by domestic and overseas automakers continued its robust trend since fiscal year 2014.
Moreover, in the background of rising awareness regarding exhaust gas emission regulations around the world and other
factors, demand related to emission measurement systems showed a growth trend. In the scientific analysis equipment
industry, demand for leading-edge scientific analysis equipment in China also grew.
Under such operating environment, HORIBA, Ltd. (“the Company”) and its consolidated subsidiaries (together “the
HORIBA Group” or “HORIBA” as a consolidated group), implemented several measures to strengthen each segment in
current fiscal year.
In the Automotive Test Systems segment, sales of new mainstay emission measurement systems launched in 2013
increased steadily. As for MCT (Mechatronics) business, which was acquired from Carl Schenck AG (Germany) in 2005,
HORIBA also succeeded in capturing demand in various countries beyond Europe, the base for development and
production, which led to a substantial increase in sales. Furthermore, HORIBA acquired ECT* (the engineering and testing
business related to automobile development in general) business from MIRA Ltd. (U.K.) in 2015. Based on this initiative,
HORIBA will take a step forward from the analysis and measurement field in the automobile development sector and
promote expansion into business fields that include the development of next-generation mobility.
*ECT: Engineering Consultancy & Testing
In the Process & Environmental Instruments & Systems segment, HORIBA actively promoted opinion exchanges with local
universities and other institutions in order to strengthen its proposal capability for analytical instruments and systems which
cater for the reinforcement of environmental regulations in China and other Asian countries. Furthermore, in the process
analytical product line which HORIBA acquired from the U.S. corporation Cameron in 2013, HORIBA is pursuing business
expansion in the oil refining market, including shale gas and oil.
In the Medical-Diagnostic Instruments & Systems segment, the Company launched new hematology and C-Reactive
Protein (CRP) analyzers, which boast high market share based on HORIBA’s unique technology. In France, HORIBA
completed a new development center aiming at accelerating product development speed.
In the Semiconductor Instruments & Systems segment, the HORIBA Advanced Technology Center in Kyoto, whose
construction had began from 2013 with the aim of accelerating product development speed and enhancing the efficiency of
production in semiconductor-related businesses, started operation in 2015.
The Scientific Instruments & Systems segment responded to the increasing demand for products such as Raman
spectrometers in China.
3 HORIBA, Ltd. (Consolidated)

Furthermore, in Japan, HORIBA has commenced the relocation to HORIBA BIWAKO E-HARBOR, a new Biwako factory in
Shiga prefecture Japan. It had been under construction to reinforce development and production capabilities in the gas
measurement field for the Automotive Test Systems segment and the Process & Environmental Instruments & Systems
segment, and is under preparations for its full-scale operation in May 2016. The HORIBA Group also completed the global
introduction of its new enterprise resource planning system (GEO System) aiming at speeding up its decision making and
promoting common operational process, and has begun its operation in 85% of Group companies from January 2016.
As a result of such measures and sales efforts, sales increased by 11.7% compared with a year earlier to 170,898 million
yen. Operating income rose by 12.5% year-on-year to 19,372 million yen, ordinary income increased by 14.5% to 18,848
million yen and net income rose by 21.7% to 12,882 million yen.
The operating results of each business segment are summarized as follows.
(Automotive Test Systems)
Along with an increase in capital and R&D investment by automakers, sales of emission measurement systems increased
in Japan. In addition, sales in the Americas increased after conversion to yen because of the yen’s depreciation against the
dollar. Also, the acquisition of ECT business also increased sales. As a result, segment sales increased by 16.8%
year-on-year to 64,251 million yen. Segment operating profit, however, decreased by 23.7% to 4,448 million yen due in part
to one-time expenses related to the acquisition of ECT business and the relocation to HORIBA BIWAKO E-HARBOR,
which was completed in Shiga Prefecture.
(Process & Environmental Instruments & Systems)
Sales of stack gas analyzers for power plants and factories were robust in Japan and China, while sales in the Americas
increased after conversion to yen because of the yen’s depreciation against the dollar. On the other hand, expenses
associated with the relocation to HORIBA BIWAKO E-HARBOR incurred. As a result, segment sales increased by 1.8%
year-on-year to 16,754 million yen while operating income decreased by 11.6% to 1,773 million yen.
(Medical-Diagnostic Instruments & Systems)
The yen’s appreciation against the euro resulted in a decrease in the amount of European sales expressed in yen.
However, sales of the hematology and C-Reactive Protein (CRP) analyzers, which were launched in March 2015 in Japan,
were favorable. As a result, segment sales increased by 1.5% year-on-year to 27,447 million yen and operating income
rose by 39.9% to 2,403 million yen.
(Semiconductor Instruments & Systems)
Due to high level of capital investment by semiconductor manufacturers, sales to semiconductor production equipment
manufacturers surged. As a result, segment sales increased by 22.3% year-on-year to 35,386 million yen and operating
income rose by 46.2% to 9,439 million yen.
(Scientific Instruments & Systems)
Sales of instruments and systems for R&D applications to universities and other institutions in China were robust and the
yen’s depreciation against the dollar resulted in an increase in sales in the Americas in yen terms. Consequently, segment
sales rose by 5.6% year-on-year to 27,059 million yen and operating income rose by 8.4% to 1,307 million yen.
(ii) Outlook for the Year Ending December 31, 2016
Regarding the global economic outlook for the next fiscal year, the United States is expected to continue its economic
recovery, mainly in domestic demand which is driven by an improvement in employment environment. In Europe, although
caution is required regarding geopolitical risks and other factors, a moderate economic recovery is likely to continue. In
emerging markets such as China and Southeast Asia, the economic slowdown is anticipated in light of an adverse trend in
the financial markets and a weakness in commodity prices.
In Japan, the economy is likely to recover moderately, due in part to an improvement in corporate earnings, but factors
such as Chinese economic outlook and the trend in oil prices require caution.
4 HORIBA, Ltd. (Consolidated)
Based on such economic outlook, HORIBA’s forecasts for fiscal 2016 are shown as below.
Our assumed foreign exchange rates are 115 yen against the U.S. dollar (vs. 121.10 yen in fiscal 2015) and 125 yen
against the euro (vs. 134.31 yen in fiscal 2015).
Net sales of 175,000 million yen, up 1.6% y-o-y (*)
In the Automotive Test Systems segment, full-year sales of ECT business will contribute to segment sales increase.
In the Process & Environmental Instruments & Systems segment, growth in sales is expected for stack gas analyzers and
water quality analyzers in Japan, and process analysis product lines in the Americas.
In the Medical-Diagnostic Instruments & Systems segment, an increase in sales of blood cell testing instruments is
forecasted in Asia.
In the Semiconductor Instruments & Systems segment, conservative forecast is made due to uncertainties over outlook in
demand by semiconductor production equipment in the second half of the fiscal year, while demand in the first half is
projected to remain robust.
In the Scientific Instruments & Systems segment, HORIBA anticipates an increasing demand on the back of earnings
recovery in private sector, mainly in Japan.
As a result, net sales are expected to increase by 2,700 million yen from the previous year to 175,000 million yen.
Operating income of 17,500 million yen, down 13.4% y-o-y (*)
In the Automotive Test Systems segment, HORIBA expects segment operating income to decrease, due to a temporary
decrease in sales for emission measurement systems, an increase in amortization costs with respect to goodwill
associated with the acquisition of ECT business, and depreciation costs increase by start-up of operation at HORIBA
BIWAKO E-HARBOR.
The Semiconductor Instruments & Systems segment also expects a decrease in operating income due to uncertainties
over outlook in demand by semiconductor production equipment in the second half of the fiscal year.
As a result, operating income is likely to decrease by 2,700 million yen from the previous year to 17,500 million yen.
Ordinary income of 16,500 million yen, down 16.7% y-o-y (*)
HORIBA’s forecasts incorporate a net non-operating loss of 1,000 million yen (compared to a net non-operating loss of 523
million yen in fiscal 2015), assuming foreign exchange losses and some uncertain non-operating expenses. By including
this factor in addition to an expected decrease in operating income, ordinary income is expected to decrease by 3,300
million yen from the previous year to 16,500 million yen.
Net income attributable to owners of parent of 10,800 million yen, down 20.0% y-o-y (*)
In addition to the decrease in ordinary income, net income is forecast to decrease by 2,700 million yen from the previous
year to 10,800 million yen, as a net extraordinary loss of 700 million yen (compared to a net extraordinary gain of 165
million yen in fiscal 2015) is incorporated in our forecasts, assuming the generation of some extraordinary losses.
(Note) The above forecasts have been made on the basis of information available as of February 9, 2016, but due to the existence of
various uncertain elements, it is possible that actual performance will vary considerably from those forecasts.
* The Company and its consolidated subsidiaries in Japan changed the accounting policy for revenue recognition from fiscal 2016.They had historically recognized revenue mainly on the date of shipment of products and systems. From fiscal 2016, however, theymainly recognize revenue on the date of delivery or installation based on contractual arrangements and others.The percentage of changes compared with preceding period are calculated based on the retrospectively-restated amounts of fiscal2015. Those retrospectively-restated amounts are unaudited and are subject to change.
(2) Basic Policy for Profit Distribution and Dividends for the Year Ended December 31, 2015 and the Year Ending
December 31, 2016
At the board of directors’ meeting held on February 14, 2013, HORIBA decided to adopt a basic dividend policy in which the
Company will maintain a total shareholder return ratio of around 30% of consolidated net income of the Company.
According to its basic policy, we have decided to pay a year-end dividend of 42 yen per share. Combined with the interim
dividend that has been paid out, the annual dividend is 70 yen.
5 HORIBA, Ltd. (Consolidated)

As regards the dividend forecast for the fiscal year ending December 31, 2016, we expect to increase the annual dividend
by 5 yen from the fiscal 2015 to 75 yen (Interim dividend is 30 yen).
The Company will continue to make effective use of internal reserves to improve corporate value through profit growth and
focus on investing in growth areas, and it will make profit returns to shareholders that are linked to consolidated earnings.
2. Management Policies
(1) Basic Management Policies
As a manufacturer of analytical equipment that is developing its business worldwide, the HORIBA Group aims to be a truly
global company. Our basic philosophy is to contribute to society by preserving the environment, bringing human health and
greater convenience and safety to society, and promoting the development of science and technology through our business
activities, which focus on analytical technologies and span a variety of industrial fields in the global market.
In addition, HORIBA Group has long focused on consolidated-based management and promoted the reinforcement of
alliances and the integration of its 49 companies throughout the world by utilizing our human and technological resources.
(2) Management Target Indices
The HORIBA Group formulated the Mid-Long Term Management Plan in February 2011 with numerical targets set for 2015.
The HORIBA Group has been launching various measures to achieve the numerical targets of 150 billion yen in
consolidated net sales, an operating income ratio of 13% or more, and ROE of 11% or more.
In 2015, the last year of the plan, net sales of 170.8 billion yen exceeded the Plan’s target of 150 billion yen. HORIBA made
large-scale capital investments including acquisitions, which have led to fall short of the plan’s targets for operating margin
and ROE.
The new Mid-Long Term Management plan, MLMAP*2020, for the period up to fiscal 2020, is formulated and we are taking
various measures to reach the target. We are aiming at net sales of 250.0 billion yen, operating income of 30.0 billion yen
and ROE of 10% or more.
*MLMAP: MLMAP, standing for Mid-Long Term Management Plan, is the term well known and understood within the HORIBA Group.
(3) Challenges for HORIBA: Mid-Long Term Business Strategies of HORIBA
The HORIBA Group’s business consists of five segments: Automotive Test Systems, Process & Environmental Instruments
& Systems, Medical-Diagnostic Instruments & Systems, Semiconductor Instruments & Systems and Scientific Instruments
& Systems. Each segment operates business in a different market, which enables each to exert its strengths and
complement the weaknesses of each other. Our aim is to achieve well-balanced growth with this structure. Technologies
and know-how in all segments are shared mutually. The transfer of human, production capacity and other resources among
segments gives us the strategic flexibility to temporarily integrate resources in a favorably performing business while
alleviating the burden to a certain extent in an underperforming business. This enables us to achieve efficient
management.
In keeping with the management principle of the “HORIBA Group is One Company.”, HORIBA has pursued integrated
group management by promoting efficiency region by region, and enhancing matrix management. As the next stage,
through “HORIBA Stained Glass Project * ” which was launched in January 2014, we are aiming to promote business
growth and expand business fields with the aim to become a true partner to all customers in analysis and measurement.
The priority measures of the Mid-Long Term Management Plan toward fiscal 2020 are as follows.
● Priority Measure 1: Applying HORIBA Technology in new business fields and new markets and becoming atrue partner in analysis and measurement
By making use of established operational bases and investments for future growth made during the previous Mid-Long
Term Management Plan, HORIBA intends on achieving strategic growth of each business segment on the back of new
investments, in addition to further growth of the two businesses, namely the Automotive Test Systems business and the
Semiconductor business.
6 HORIBA, Ltd. (Consolidated)
In the Automotive Test Systems business, the HORIBA BIWAKO E-HARBOR will increase production volume and improve
profitability to expand business in the emission gas measurement field, turning to advantage the expected tightening of gas
emission regulations in many countries. In addition, HORIBA will grow ECT business. HORIBA will make use of HORIBA
MIRA’s testing knowhow on connection with autonomous driving technology and promote expansion in connection with
next-generation mobility.
In the Semiconductor business, the semiconductor manufacturing market is expected to expand on the back of significant
growth in use of semiconductors as the automotive, medical, and other fields are becoming increasingly high-tech and
connected online. HORIBA, with its stable supply capacity of high-precision products, will aim for further growth in this field.
Moreover, by actively making new investments and pursuing M&A opportunities, HORIBA will enter into other business
fields and markets with great growth potential. They include aspects of fuel cells and other alternative energy sources, the
bio-life science field, and the water analytical and measurement field. HORIBA plans to integrally utilize in-house
technological resources and the customer network of each other’s business in order to realize strategic growth. In addition
to working to achieve the plan’s targets for each business, HORIBA aims to develop businesses which can drive the growth
in the future.
● Priority Measure 2: Accelerating corporate growth by its Super Dream Team based on balanced management,matrix organization, and HORIBA Stained Glass Project
In keeping with the management principle of the “HORIBA Group is One Company,” HORIBA has implemented
well-balanced matrix management and has achieved a high order of integrated group operation. In order to further advance
this group operation, HORIBA will continue to promote diversity, through the HORIBA Stained Glass Project, to realize the
Super Dream Team of its human resources with diversity and to accelerate renovation in existing business and creation of
new businesses.
● Priority Measure 3: Raising capital efficiency to maximize corporate value
Under the previous Mid-Long Term Management Plan, HORIBA promoted laying a foundation for future growth by
establishing many bases and acquiring businesses globally. In order to make effective use of those assets, each group
company and each business segment will set its asset efficiency target and remain dedicated to efficient management
under the new plan.
In 2016, the HORIBA Group also completed the global introduction of its Enterprise Resource Planning System and began
using it at 85% of Group companies, in order to speed up business operation. Under the leadership of the global team, the
business segments, the functional divisions, such as for development and production, and the indirect and administrative
divisions, will support the business segments and help achieve the plan’s targets.
*The “HORIBA Stained Glass Project” was launched in January 2014, in accordance with the belief that employees having
diverse experiences, values, individuality, and restrictions create new value in their efforts to play leading roles through
their diversity and contribute to realize a strong HORIBA.
3. Basic policy on selection of accounting standard
The HORIBA Group prepares its consolidated financial statements in accordance with General Accepted Accounting
Principles in Japan (“JGAAP”), as it allows comparison between different periods and companies. Concerning adoption of
the International Financial Reporting Standards (IFRS), HORIBA intends to appropriately respond with due consideration to
various circumstances in Japan and abroad.
7 HORIBA, Ltd. (Consolidated)

4. Consolidated Financial Statements
(1) Consolidated Balance SheetsAmount: millions of yen
FY2014(As of December 31,
2014)
FY2015(As of December 31,
2015)
Assets
Current Assets:
Cash and bank deposits 43,255 43,922
Trade notes and accounts receivable 52,246 54,772
Marketable securities 11,380 6,927
Merchandise and finished goods 13,811 15,696
Work in process 11,022 9,234
Raw materials and supplies 10,003 10,786
Deferred tax assets 3,635 4,001
Other current assets 5,348 6,463
Allowance for doubtful accounts (1,023) (789)
Total Current Assets 149,680 151,015
Fixed Assets:
Property, Plant and Equipment:
Buildings and structures, net 17,154 31,288
Machinery, equipment and vehicles, net 4,802 6,468
Land 9,908 10,647
Construction in progress 3,817 4,739
Other property, plant and equipment, net 3,758 3,834
Total Property, Plant and Equipment 39,441 56,978
Intangibles:
Goodwill 418 576
Software 4,134 4,851
Other intangibles 1,801 4,870
Total Intangibles 6,353 10,298
Investments and Other Non-Current Assets:
Investment securities 7,122 8,335
Deferred tax assets 1,993 1,671
Net defined benefit asset 2 -
Other investments and other assets 2,785 2,783
Allowance for doubtful accounts (44) (50)
Total Investments and Other Non-Current Assets 11,859 12,739
Total Fixed Assets 57,655 80,017
Total Assets 207,335 231,032
8 HORIBA, Ltd. (Consolidated)

Amount: millions of yen
FY2014(As of December 31,
2014)
FY2015(As of December 31,
2015)
Liabilities
Current Liabilities:
Trade notes and accounts payable 15,406 17,638
Short-term loans payable 10,832 12,879
Accounts payable - other 14,457 14,787
Accrued income taxes 5,220 3,796
Deferred tax liabilities 88 91
Accrued bonuses to employees 908 948
Accrued bonuses to directors and corporate auditors 62 63
Reserve for product warranty 1,525 1,605
Other current liabilities 10,500 10,617
Total Current Liabilities 59,003 62,429
Non-Current Liabilities:
Corporate bonds 15,000 15,000
Long-term loans payable 2,209 16,826
Deferred tax liabilities 174 1,181
2,264 1,947
1,870 1,267
Other non-current liabilities 2,497 2,329
Total Non-Current Liabilities 24,017 38,552
Total Liabilities 83,020 100,982
Net Assets
Shareholders' Equity
Common stock 12,011 12,011
Capital surplus 18,717 18,717
Retained earnings 86,218 96,055
Treasury stock (730) (1,730)
Total Shareholders' Equity 116,216 125,053
Accumulated Other Comprehensive Income
Net unrealized holding gains on securities 2,041 2,624
Deferred gains or losses on hedges 18 (0)
Foreign currency translation adjustments 5,630 1,836
Remeasurements of defined benefit plans 16 66
Total Accumulated Other Comprehensive Income 7,707 4,527
Subscription Rights to Shares 389 469
Minority Interests in Consolidated Subsidiaries 0 0
Total Net Assets 124,314 130,050
Total Liabilities and Net Assets 207,335 231,032
Net defined benefit liability
Provision for loss on dissolution of the employees’pension fund
9 HORIBA, Ltd. (Consolidated)
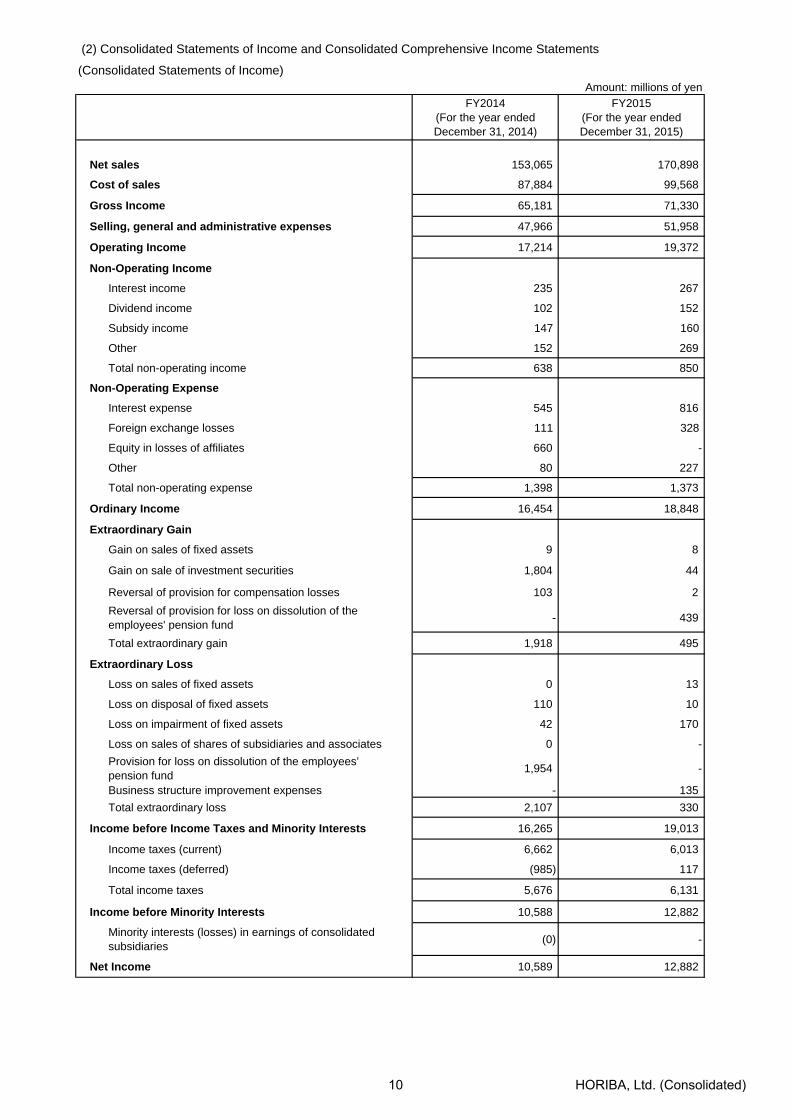
(2) Consolidated Statements of Income and Consolidated Comprehensive Income Statements
(Consolidated Statements of Income)Amount: millions of yen
FY2014(For the year endedDecember 31, 2014)
FY2015(For the year endedDecember 31, 2015)
Net sales 153,065 170,898
Cost of sales 87,884 99,568
Gross Income 65,181 71,330
Selling, general and administrative expenses 47,966 51,958
Operating Income 17,214 19,372
Non-Operating Income
Interest income 235 267
Dividend income 102 152
Subsidy income 147 160
Other 152 269
Total non-operating income 638 850
Non-Operating Expense
Interest expense 545 816
Foreign exchange losses 111 328
Equity in losses of affiliates 660 -
Other 80 227
Total non-operating expense 1,398 1,373
Ordinary Income 16,454 18,848
Extraordinary Gain
Gain on sales of fixed assets 9 8
Gain on sale of investment securities 1,804 44
Reversal of provision for compensation losses 103 2
Reversal of provision for loss on dissolution of theemployees' pension fund
- 439
Total extraordinary gain 1,918 495
Extraordinary Loss
Loss on sales of fixed assets 0 13
Loss on disposal of fixed assets 110 10
Loss on impairment of fixed assets 42 170
Loss on sales of shares of subsidiaries and associates 0 -
Provision for loss on dissolution of the employees’pension fund
1,954 -
Business structure improvement expenses - 135
Total extraordinary loss 2,107 330
Income before Income Taxes and Minority Interests 16,265 19,013
Income taxes (current) 6,662 6,013
Income taxes (deferred) (985) 117
Total income taxes 5,676 6,131
Income before Minority Interests 10,588 12,882
Minority interests (losses) in earnings of consolidatedsubsidiaries
(0) -
Net Income 10,589 12,882
10 HORIBA, Ltd. (Consolidated)
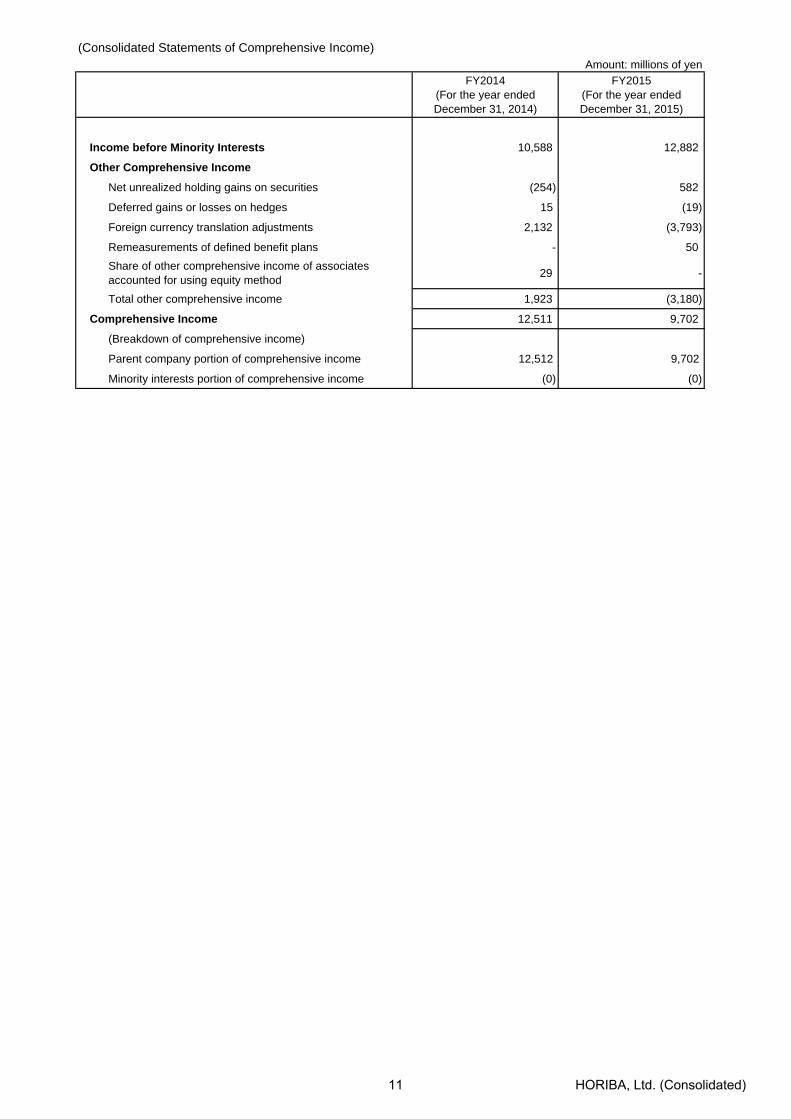
(Consolidated Statements of Comprehensive Income)Amount: millions of yen
FY2014(For the year endedDecember 31, 2014)
FY2015(For the year endedDecember 31, 2015)
Income before Minority Interests 10,588 12,882
Other Comprehensive Income
Net unrealized holding gains on securities (254) 582
Deferred gains or losses on hedges 15 (19)
Foreign currency translation adjustments 2,132 (3,793)
Remeasurements of defined benefit plans - 50
Share of other comprehensive income of associatesaccounted for using equity method
29 -
Total other comprehensive income 1,923 (3,180)
Comprehensive Income 12,511 9,702
(Breakdown of comprehensive income)
Parent company portion of comprehensive income 12,512 9,702
Minority interests portion of comprehensive income (0) (0)
11 HORIBA, Ltd. (Consolidated)

(3) Consolidated Statement of Changes in Net Assets FY2014 (For the year ended December 31, 2014)
Amount: Millions of yen
Cumulative effects of changes inaccounting policies
Purchase of treasury stock
Cumulative effects of changes inaccounting policies
Purchase of treasury stock
Total Shareholders' Equity
108,441
(0) (0)
(0)
35
(730)
(2,834)
10,589
21
7,775
116,216
114,545
Total Net AssetsSubscription
Rights to Shares
Minority Interestsin Consolidated
Subsidiaries
0
(0)
(0)
0
Total AccumulatedOther
ComprehensiveIncome
Accumulated Other Comprehensive Income
-
12,011
-
18,717
(2,834)
10,589
(13)
Beginning balance
Common stock
12,011
Retained earnings
78,477
Shareholders' Equity
Changes during the period
Net unrealizedholding gains on
securities
Dividend from earnings
Net income
Disposal of treasury stock
Others
Capital surplus
18,717
7,740
86,218
Treasury stock
(765)
35
Ending balance 2,041 5,630
5,768
(2,834)
3,468 3353
124,314389
16 53
16 1,93915
15
1,992
21
1618 7,707
(254) 2,161
(254) 2,161
9,768
10,589
1,939
53
Total changes during the period
Ending balance
Changes during the period
Remeasurementsof defined benefit
plans
-Beginning balance
Total changes during the period
Disposal of treasury stock
Others
Dividend from earnings
Net income
2,296
Deferred gains orlosses on hedges
Foreign currencytranslation
adjustments
Beginning balance after reflectionof changes in accounting policies
12,011 18,717 78,477 (765) 108,441
Beginning balance after reflectionof changes in accounting policies
2,296 3 3,468 - 5,768 335 0 114,545
12 HORIBA, Ltd. (Consolidated)

FY2015 (For the year ended December 31, 2015)
Amount: Millions of yen
Cumulative effects of changes inaccounting policies
Purchase of treasury stock
Cumulative effects of changes inaccounting policies
Purchase of treasury stock
5,630 16 7,707 389Beginning balance after reflectionof changes in accounting policies
(90)
12,011
389 0 124,314Beginning balance 2,041 18 5,630 16 7,707
Accumulated Other Comprehensive Income
SubscriptionRights to Shares
Minority Interestsin Consolidated
SubsidiariesTotal Net AssetsNet unrealized
holding gains onsecurities
0 124,224
(90)
2,041 18
130,050
Beginning balance after reflectionof changes in accounting policies
(0) 5,826
Ending balance 2,624 (0) 1,836 66 4,527 469 0
79 (0) (3,100)
Total changes during the period 582 (19) (3,793) 50 (3,180) 79
Others 582 (19) (3,793) 50 (3,180)
(999)
Net income 12,882
Dividend from earnings
Changes during the period
(2,955)
Deferred gains orlosses on hedges
Foreign currencytranslation
adjustments
Remeasurementsof defined benefit
plans
Total AccumulatedOther
ComprehensiveIncome
Ending balance 12,011 18,717 96,055 (1,730) 125,053
Total changes during the period - - 9,926 (999) 8,926
Others
(999) (999)
Net income 12,882 12,882
Dividend from earnings (2,955) (2,955)
Shareholders' Equity
Common stock Capital surplus Retained earnings Treasury stock Total Shareholders' Equity
Changes during the period
Beginning balance 12,011 18,717 86,218 (730) 116,216
18,717 86,128 (730) 116,126
(90)
13 HORIBA, Ltd. (Consolidated)

(4) Consolidated Statements of Cash FlowsAmount: millions of yen
FY2014(For the year endedDecember 31, 2014)
FY2015(For the year endedDecember 31, 2015)
Cash Flows from Operating Activities:Income before income taxes and minority interests 16,265 19,013Depreciation expense 4,815 5,964Loss on impairment of fixed assets 42 170Amortization of goodwill 89 145Increase (decrease) in allowance for doubtful accounts 68 (243)Increase (decrease) in net defined benefit liability (214) (302)Increase (decrease) in provision for loss on dissolution of the employees'pension fund
1,870 (603)
Interest and dividend income (337) (420)Interest expense 545 816Foreign exchange losses (gains) (237) (106)Loss (gain) on sales of fixed assets (9) 5Loss on disposal of fixed assets 110 10Loss (gain) on sales of investment securities (1,804) (44)Decrease (increase) in trade notes and accounts receivable (2,718) (2,286)Decrease (increase) in inventories 12 (1,515)Increase (decrease) in trade notes and accounts payable (1,943) 2,078Other, net 514 161 Subtotal 17,069 22,844Interest and dividends received 346 423Interest paid (538) (814)Income taxes (paid) refund (5,422) (7,682) Net Cash Provided by (used in) Operating Activities 11,455 14,770
Cash Flows from Investing Activities:Increase in time deposits (2,843) (3,204)Decrease in time deposits 2,988 2,964 Decrease in time deposits restricted for use 32 32 Payments for purchase of marketable securities (3,008) (1,702)Proceeds from sales or redemption of marketable securities 2,706 2,504 Payments for purchase of property, plant and equipment (7,806) (15,671)Proceeds from sales of property, plant and equipment 85 68Payments for purchase of intangibles (1,846) (1,442)Proceeds from sales of intangibles - 4Payments for purchase of investment securities (1,859) (620)Proceeds from sales or redemption of investment securities 2,184 83 Proceeds from sales of stocks of subsidiaries and affiliates 1 -Payments of loans receivable (39) (21)Collection of loans receivable 25 43Payments for transfer of business (658) (13,610)Other, net 163 (69) Net Cash Provided by (used in) Investing Activities (9,875) (30,642)
Cash Flows from Financing Activities:Net increase (decrease) in short-term borrowings 3,294 2,380Increase in long-term debt 269 15,388Repayments of long-term debt (803) (826)Repayments on finance lease obligations (200) (170)Net decrease (increase) of treasury stock (0) (999)Cash dividends paid (2,833) (2,928) Net Cash Provided by (used in) Financing Activities (273) 12,843
Effect of Exchange Rate Changes on Cash and Cash Equivalents 556 (668)Net Increase (Decrease) in Cash and Cash Equivalents 1,863 (3,697)Cash and Cash Equivalents at Beginning of Period 49,246 51,109
- 446
Cash and Cash Equivalents at End of Period 51,109 47,859
Increase (Decrease) in Cash and Cash Equivalents Resulting fromChange of Scope of Consolidation
14 HORIBA, Ltd. (Consolidated)
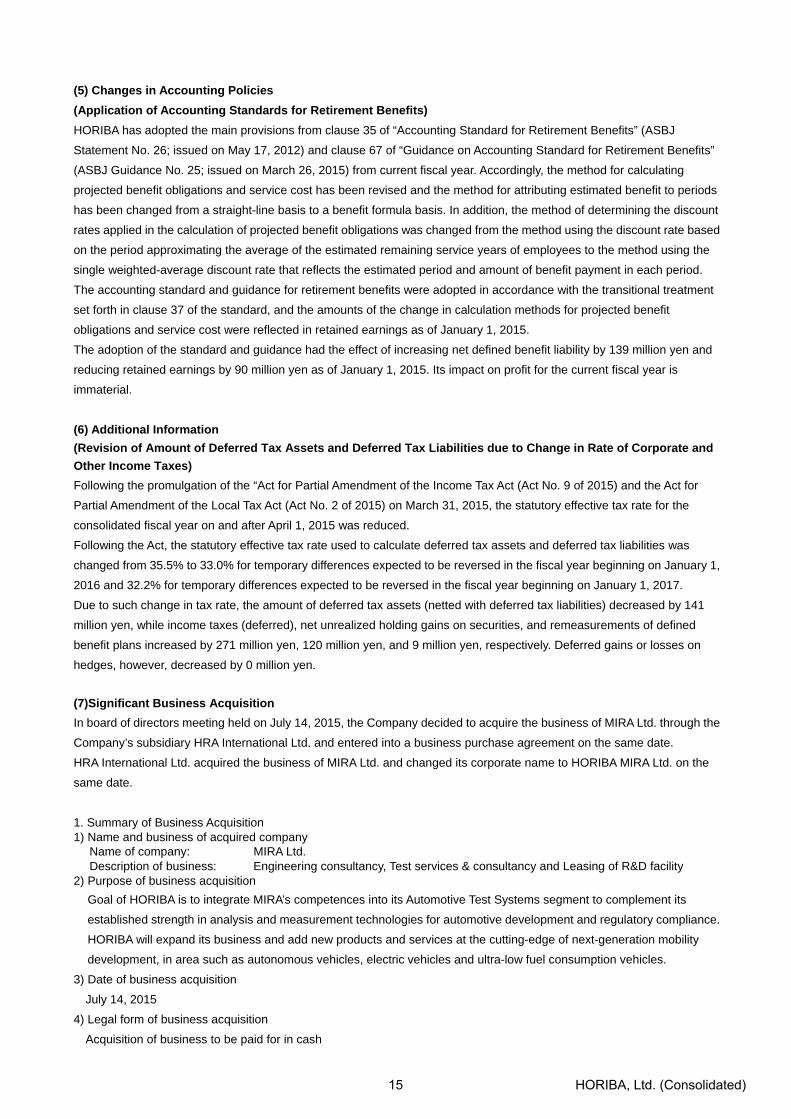
(5) Changes in Accounting Policies
(Application of Accounting Standards for Retirement Benefits)
HORIBA has adopted the main provisions from clause 35 of “Accounting Standard for Retirement Benefits” (ASBJ
Statement No. 26; issued on May 17, 2012) and clause 67 of “Guidance on Accounting Standard for Retirement Benefits”
(ASBJ Guidance No. 25; issued on March 26, 2015) from current fiscal year. Accordingly, the method for calculating
projected benefit obligations and service cost has been revised and the method for attributing estimated benefit to periods
has been changed from a straight-line basis to a benefit formula basis. In addition, the method of determining the discount
rates applied in the calculation of projected benefit obligations was changed from the method using the discount rate based
on the period approximating the average of the estimated remaining service years of employees to the method using the
single weighted-average discount rate that reflects the estimated period and amount of benefit payment in each period.
The accounting standard and guidance for retirement benefits were adopted in accordance with the transitional treatment
set forth in clause 37 of the standard, and the amounts of the change in calculation methods for projected benefit
obligations and service cost were reflected in retained earnings as of January 1, 2015.
The adoption of the standard and guidance had the effect of increasing net defined benefit liability by 139 million yen and
reducing retained earnings by 90 million yen as of January 1, 2015. Its impact on profit for the current fiscal year is
immaterial.
(6) Additional Information
(Revision of Amount of Deferred Tax Assets and Deferred Tax Liabilities due to Change in Rate of Corporate and
Other Income Taxes)
Following the promulgation of the “Act for Partial Amendment of the Income Tax Act (Act No. 9 of 2015) and the Act for
Partial Amendment of the Local Tax Act (Act No. 2 of 2015) on March 31, 2015, the statutory effective tax rate for the
consolidated fiscal year on and after April 1, 2015 was reduced.
Following the Act, the statutory effective tax rate used to calculate deferred tax assets and deferred tax liabilities was
changed from 35.5% to 33.0% for temporary differences expected to be reversed in the fiscal year beginning on January 1,
2016 and 32.2% for temporary differences expected to be reversed in the fiscal year beginning on January 1, 2017.
Due to such change in tax rate, the amount of deferred tax assets (netted with deferred tax liabilities) decreased by 141
million yen, while income taxes (deferred), net unrealized holding gains on securities, and remeasurements of defined
benefit plans increased by 271 million yen, 120 million yen, and 9 million yen, respectively. Deferred gains or losses on
hedges, however, decreased by 0 million yen.
(7)Significant Business Acquisition
In board of directors meeting held on July 14, 2015, the Company decided to acquire the business of MIRA Ltd. through the
Company’s subsidiary HRA International Ltd. and entered into a business purchase agreement on the same date.
HRA International Ltd. acquired the business of MIRA Ltd. and changed its corporate name to HORIBA MIRA Ltd. on the
same date.
1. Summary of Business Acquisition 1) Name and business of acquired company
Name of company: MIRA Ltd. Description of business: Engineering consultancy, Test services & consultancy and Leasing of R&D facility
2) Purpose of business acquisition
Goal of HORIBA is to integrate MIRA’s competences into its Automotive Test Systems segment to complement its
established strength in analysis and measurement technologies for automotive development and regulatory compliance.
HORIBA will expand its business and add new products and services at the cutting-edge of next-generation mobility
development, in area such as autonomous vehicles, electric vehicles and ultra-low fuel consumption vehicles.
3) Date of business acquisition
July 14, 2015
4) Legal form of business acquisition
Acquisition of business to be paid for in cash
15 HORIBA, Ltd. (Consolidated)

5) Name of company after acquisition
HORIBA MIRA Ltd.
6) Primary basis for determination of acquiring the company
The Company’s subsidiary HRA International Ltd. paid cash in consideration of acquiring 100% of the business of MIRA
Ltd.
2. Accounting period during which the financial results of the acquired company were included in the consolidated
statements of income for the fiscal year
From July 14, 2015 to December 31, 2015
3. Acquisition cost and its breakdown of acquired business
Acquisition Price: Cash 15,469 million yen
Acquisition Cost: 15,469
4. Amount of goodwill recognized, reason for recognition, amortization method, and amortization period
1) Amount of goodwill recognized
247 million yen
2) Reason for recognition
This is mainly due to the expectation of excess earning power from future business development.
3) Amortization method and amortization period
Straight-line method of amortization over 5-year period
4) Amounts allocated to intangible assets other than goodwill, primary components of those assets by type, and
amortization period of major types
Customer-related assets 1,905 million yen Amortization period 9 years
Trademark rights 2,142 million yen Amortization period 10 years
Other a107 million yen Amortization period 10 years
5. Amounts and primary components of assets acquired and liabilities assumed as of the date of the business combination
Current assets 4,494 million yen
Fixed assets 14,446 million yen
Total assets 18,941 million yen
Current liabilities 2,809 million yen
Non-current liabilities 911 million yen
Total liabilities 3,720 million yen
6. Approximate amounts and calculation method of the impacts on consolidated statements of income of the fiscal year,
assuming that the business combination was completed on the first date of the fiscal year
Net sales 4,904 million yen
Operating income 53 million yen
Net income (9) million yen
(Calculation method of approximate amounts)
Approximate amounts of the impacts are the difference between the calculated amounts of net sales and income in the
assumption that the business combination was completed on the first date of the fiscal year, and the amounts of net sales
and income of the acquired company are recorded on the consolidated statements of income. The notes above are
unaudited.
16 HORIBA, Ltd. (Consolidated)
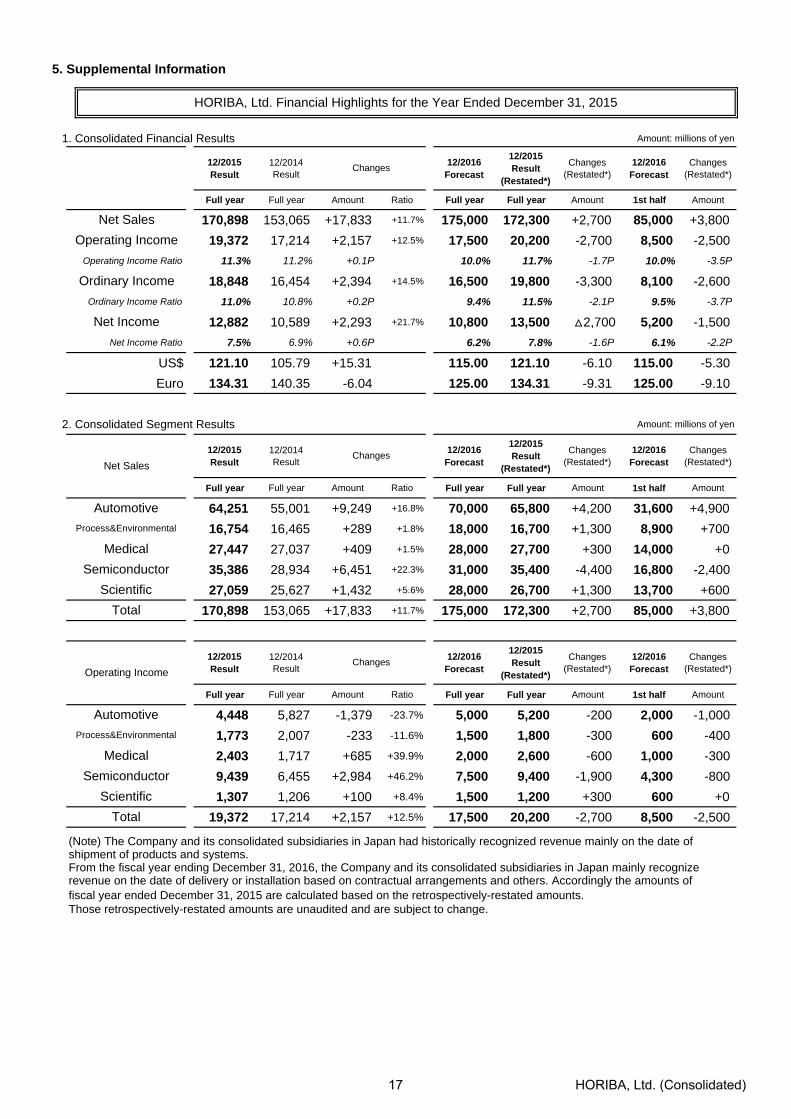
5. Supplemental Information
1. Consolidated Financial Results Amount: millions of yen
12/2015Result
12/2014Result
12/2016Forecast
12/2015Result
(Restated*)
Changes(Restated*)
12/2016Forecast
Changes(Restated*)
Full year Full year Amount Ratio Full year Full year Amount 1st half Amount
170,898 153,065 +17,833 +11.7% 175,000 172,300 +2,700 85,000 +3,800
19,372 17,214 +2,157 +12.5% 17,500 20,200 -2,700 8,500 -2,500
Operating Income Ratio 11.3% 11.2% +0.1P 10.0% 11.7% -1.7P 10.0% -3.5P
18,848 16,454 +2,394 +14.5% 16,500 19,800 -3,300 8,100 -2,600
Ordinary Income Ratio 11.0% 10.8% +0.2P 9.4% 11.5% -2.1P 9.5% -3.7P
12,882 10,589 +2,293 +21.7% 10,800 13,500 2,700 5,200 -1,500
Net Income Ratio 7.5% 6.9% +0.6P 6.2% 7.8% -1.6P 6.1% -2.2P
US$ 121.10 105.79 +15.31 115.00 121.10 -6.10 115.00 -5.30
Euro 134.31 140.35 -6.04 125.00 134.31 -9.31 125.00 -9.10
2. Consolidated Segment Results Amount: millions of yen
12/2015Result
12/2014Result
12/2016Forecast
12/2015Result
(Restated*)
Changes(Restated*)
12/2016Forecast
Changes(Restated*)
Full year Full year Amount Ratio Full year Full year Amount 1st half Amount
64,251 55,001 +9,249 +16.8% 70,000 65,800 +4,200 31,600 +4,900
16,754 16,465 +289 +1.8% 18,000 16,700 +1,300 8,900 +700
27,447 27,037 +409 +1.5% 28,000 27,700 +300 14,000 +0
35,386 28,934 +6,451 +22.3% 31,000 35,400 -4,400 16,800 -2,400
27,059 25,627 +1,432 +5.6% 28,000 26,700 +1,300 13,700 +600
170,898 153,065 +17,833 +11.7% 175,000 172,300 +2,700 85,000 +3,800
12/2015Result
12/2014Result
12/2016Forecast
12/2015Result
(Restated*)
Changes(Restated*)
12/2016Forecast
Changes(Restated*)
Full year Full year Amount Ratio Full year Full year Amount 1st half Amount
4,448 5,827 -1,379 -23.7% 5,000 5,200 -200 2,000 -1,000
1,773 2,007 -233 -11.6% 1,500 1,800 -300 600 -400
2,403 1,717 +685 +39.9% 2,000 2,600 -600 1,000 -300
9,439 6,455 +2,984 +46.2% 7,500 9,400 -1,900 4,300 -800
1,307 1,206 +100 +8.4% 1,500 1,200 +300 600 +0
19,372 17,214 +2,157 +12.5% 17,500 20,200 -2,700 8,500 -2,500
(Note) The Company and its consolidated subsidiaries in Japan had historically recognized revenue mainly on the date ofshipment of products and systems. From the fiscal year ending December 31, 2016, the Company and its consolidated subsidiaries in Japan mainly recognizerevenue on the date of delivery or installation based on contractual arrangements and others. Accordingly the amounts offiscal year ended December 31, 2015 are calculated based on the retrospectively-restated amounts.Those retrospectively-restated amounts are unaudited and are subject to change.
Net Sales
Operating Income
Ordinary Income
Net Income
HORIBA, Ltd. Financial Highlights for the Year Ended December 31, 2015
Changes
Process&Environmental
Total
Medical
Semiconductor
Scientific
Operating Income
Automotive
Automotive
Scientific
Changes
Changes
Medical
Semiconductor
Total
Process&Environmental
Net Sales
17 HORIBA, Ltd. (Consolidated)

3. Consolidated Segment Sales by Destination Amount: millions of yen
12/2015Result
12/2014Result
12/2016Forecast
12/2015Result
(Restated)
Changes(Restated)
12/2016Forecast
Changes(Restated)
Full year Full year Amount Ratio Full year Full year Amount 1st half Amount
64,251 55,001 +9,249 +16.8% 70,000 65,800 +4,200 31,600 +4,900
Japan 18,058 15,392 +2,665 +17.3% 18,000 17,800 +200 10,100 +100
Asia 15,989 15,589 +399 +2.6% 14,200 17,700 -3,500 6,900 -700
Americas(*) 10,477 8,125 +2,351 +28.9% 10,500 10,500 +0 4,200 +200
Europe 19,725 15,893 +3,832 +24.1% 27,300 19,800 +7,500 10,400 +5,300
16,754 16,465 +289 +1.8% 18,000 16,700 +1,300 8,900 +700
Japan 8,392 8,420 -28 -0.3% 9,000 8,300 +700 4,700 +300
Asia 3,524 3,361 +162 +4.8% 3,600 3,500 +100 1,700 +100
Americas(*) 2,567 2,312 +255 +11.0% 3,000 2,600 +400 1,400 +200
Europe 2,270 2,369 -99 -4.2% 2,400 2,300 +100 1,100 +100
27,447 27,037 +409 +1.5% 28,000 27,700 +300 14,000 +0
Japan 5,728 5,252 +475 +9.1% 5,700 6,000 -300 2,900 -200
Asia 4,326 3,513 +812 +23.1% 5,000 4,300 +700 2,400 +200
Americas(*) 6,813 6,739 +74 +1.1% 7,000 6,800 +200 3,500 +100
Europe 10,578 11,531 -953 -8.3% 10,300 10,600 -300 5,200 -100
35,386 28,934 +6,451 +22.3% 31,000 35,400 -4,400 16,800 -2,400
Japan 13,059 11,391 +1,667 +14.6% 12,000 13,100 -1,100 6,400 -500
Asia 14,191 11,133 +3,058 +27.5% 12,500 14,200 -1,700 6,900 -1,000
Americas(*) 6,368 4,598 +1,770 +38.5% 5,500 6,400 -900 2,900 -500
Europe 1,766 1,811 -44 -2.5% 1,000 1,700 -700 600 -400
27,059 25,627 +1,432 +5.6% 28,000 26,700 +1,300 13,700 +600
Japan 7,236 6,970 +265 +3.8% 7,700 6,900 +800 4,000 +400
Asia 6,275 5,486 +789 +14.4% 6,400 6,300 +100 3,000 +0
Americas(*) 7,048 6,065 +983 +16.2% 7,200 7,000 +200 3,400 +100
Europe 6,499 7,105 -606 -8.5% 6,700 6,500 +200 3,300 +100
170,898 153,065 +17,833 +11.7% 175,000 172,300 +2,700 85,000 +3,800
52,474 47,428 +5,045 +10.6% 52,400 52,100 +300 28,100 +100
44,307 39,085 +5,222 +13.4% 41,700 46,000 -4,300 20,900 -1,400
33,276 27,841 +5,435 +19.5% 33,200 33,300 -100 15,400 +100
Europe 40,840 38,710 +2,129 +5.5% 47,700 40,900 +6,800 20,600 +5,000(Note) Americas includes all countries in North America and South America.
Changes
Process&Environmental
Automotive
Scientific
Medical
Semiconductor
Total
Japan
Asia
Americas(*)
18 HORIBA, Ltd. (Consolidated)

5. Consolidated Financial Results (Quarterly Comparison) Amount: millions of yen
12/2015 Result 12/2014 Result
1Q 2Q 3Q 4Q 1Q 2Q 3Q 4Q
40,062 37,554 39,253 54,028 33,370 34,563 33,114 52,0165,370 3,689 2,756 7,556 3,370 2,291 2,140 9,412
Operating Income Ratio 13.4% 9.8% 7.0% 14.0% 10.1% 6.6% 6.5% 18.1%
5,029 3,707 2,646 7,464 3,325 1,812 2,006 9,309Ordinary Income Ratio 12.6% 9.9% 6.7% 13.8% 10.0% 5.2% 6.1% 17.9%
2,962 2,254 2,006 5,658 1,246 1,346 1,352 6,644Net Income Ratio 7.4% 6.0% 5.1% 10.5% 3.7% 3.9% 4.1% 12.8%
US$ 119.16 121.44 122.34 121.46 102.77 102.15 103.87 114.37Euro 134.00 134.20 136.02 133.02 140.80 140.04 137.66 142.90
6. Consolidated Segment Results (Quarterly Comparison) Amount: millions of yen
12/2015 Result 12/2014 Result
1Q 2Q 3Q 4Q 1Q 2Q 3Q 4Q
11,972 11,941 13,941 26,395 9,337 11,925 10,941 22,7964,153 4,032 3,668 4,899 4,324 3,936 3,537 4,6667,181 6,580 6,827 6,857 6,738 6,849 6,150 7,299
10,242 8,831 8,606 7,705 7,333 5,827 6,783 8,9906,511 6,167 6,208 8,171 5,637 6,025 5,701 8,264
40,062 37,554 39,253 54,028 33,370 34,563 33,114 52,016
12/2015 Result 12/2014 Result
1Q 2Q 3Q 4Q 1Q 2Q 3Q 4Q
1,002 456 (731) 3,721 904 (33) 449 4,507603 328 213 627 653 425 369 558740 410 723 528 475 520 4 716
2,733 2,402 2,461 1,841 1,596 1,077 1,377 2,403290 90 88 836 (260) 301 (61) 1,227
5,370 3,689 2,756 7,556 3,370 2,291 2,140 9,412
7. Consolidated Orders and Backlog Information (Quarterly Comparison) Amount: millions of yen
12/2015 Result 12/2014 Result
1Q 2Q 3Q 4Q 1Q 2Q 3Q 4Q
13,006 15,383 16,254 16,196 9,234 13,937 15,438 19,2614,028 4,827 3,596 4,159 4,251 3,714 4,708 4,5647,468 7,904 6,260 7,170 7,326 6,395 6,293 6,9869,669 9,204 7,865 6,999 6,938 5,869 7,986 9,6465,741 6,518 6,709 7,517 5,566 5,888 6,167 9,182
39,914 43,838 40,687 42,043 33,317 35,806 40,593 49,640
12/2015 Result 12/2014 Result
1Q 2Q 3Q 4Q 1Q 2Q 3Q 4Q
35,324 38,766 46,437 36,288 31,317 33,329 37,826 34,2904,503 5,298 5,225 4,486 3,780 3,559 4,730 4,6282,562 3,887 3,320 3,633 2,899 2,445 2,588 2,2754,086 4,458 3,717 3,010 2,758 2,800 4,003 4,6598,076 8,426 8,927 8,274 7,599 7,462 7,928 8,846
54,553 60,836 67,628 55,694 48,355 49,598 57,076 54,701
ContactEita Uesugi, Corporate & Segment Strategy Division, HORIBA, Ltd. 2, Miyanohigashi-cho, Kisshoin, Minami-ku, Kyoto 601-8510, JapanE-mail: [email protected]
Process&Environmental
Automotive
Backlog
Net Sales
Scientific
Scientific
Scientific
Automotive
Medical
Operating Income
Automotive
Medical
Ordinary Income
Total
Operating Income
Semiconductor
Net Sales
Semiconductor
Net Income
Process&Environmental
Process&Environmental
Process&Environmental
Semiconductor
Total
Total
Total
Orders
Automotive
MedicalSemiconductor
Scientific
Medical
19 HORIBA, Ltd. (Consolidated)