HORIBA, Ltd. · HORIBA MIRA full-year results in HORIBA’s consolidated results included for the first time HORIBA BIWAKO E-HARBOR began operation Expansion of HORIBA STEC’s
copy 2017 HORIBA Ltd All rights reserved 1 copy 2017 HORIBA Ltd All rights reserved 1
HORIBA Ltd (6856)
June 12 2017
Morgan Stanley MUFG Kyoto Trip 2017
copy 2017 HORIBA Ltd All rights reserved 2
Contents
[Disclaimer] Plans and forecasts in this presentation that do not constitute historical facts are predictions concerning future business results These statements are based on judgments made in accordance with information available at the present time All rights reserved Reproduction in whole or part of this presentation without permission is prohibited Copies of this presentation and additional information are available at HORIBArsquos website httpwwwhoribacom
2016 Results
2017 Forecast
Business Segment Outline
Shareholder Return
MLMAP2020 [2016-2020] Progress Financial Data Corporate profile
copy 2017 HORIBA Ltd All rights reserved 3
Contents
2016 Results
2017 Forecast
Business Segment Outline
Shareholder Return
MLMAP2020 [2016-2020] Progress Financial Data Corporate profile
copy 2017 HORIBA Ltd All rights reserved 4
External events
Earthquakes in Kumamoto Exhaust gas and fuel economy testing problems Appreciation of the yen Brexit
Internal events
Revenue recognition policy change (January) Shipment base Deliveryinstallation base
HORIBA MIRA full-year results in HORIBArsquos consolidated results included for the first time
HORIBA BIWAKO E-HARBOR began operation Expansion of HORIBA STECrsquos Aso Factory decided HORIBA India Technical Center was established Reorganization of HORIBA Group companies in
France decided (effective January 2017) Water measuring businesses integrated to HORIBA
Advanced Techno Ltd (from January 2017)
Review of 2016
copy 2017 HORIBA Ltd All rights reserved 5
Summary of 2016 Results
Paid the highest dividend amount (85 yen per share) Achieved ROE of 10
Year-on-year declines from the top line down to ordinary profit but the absolute levels were the second highest to the record-highs in 2015
Record-high net profit due to a one-time drop in tax rate
Negative impact of yen appreciation Revenues down 142bn yen OP down 31bn yen
PampL
Total assets were 2396bn yen down 75bn yen from the end of 2015 due to lower yen value caused by the yen appreciation
Equity ratio 554 BS
Operating CF Inflow of 158bn yen due to growth in profit Investing CF Outflow of 104bn yen due to capital spending Financial CF Outflow of 04bn yen due to long-term borrowing
CF FCF
+54bn yen
2015 results are restated numbers Net profit in 2016 was the second highest compared with the restated figures
copy 2017 HORIBA Ltd All rights reserved 6
2015Results
(New Policy)Forecast(as of Nov2016)
Results vs2015 vsForecast
Sales 1719 1700 1700 -11 +01
Operatign Profit 201 175 184 -82 +57
OP 117 103 109 -08p +06p
Ordinary profit 196 170 182 -69 +75
Net Income attributeable toOwners of Parent 132 108 129 -24 +200
Net prof itper share(Yen) 315 256 308 -24 +200
ROE 107 85 100 -07p +15p
2016
(Billions of yen) 2016 full year results
2015 results are restated numbers The same shall apply hereinafter
Sheet1 (2)
全社2014実績
セグ別2014実績
全社2015予想
Sheet4
Sheet5
Sheet6
copy 2017 HORIBA Ltd All rights reserved 7
2015 vs 2015 vs Results
(New Policy)Forecast(as of Nov 2016)
Results 2015 Results(New Policy)
Forecast(as of Nov 2016)
Results 2015
Auto 654 640 622 -49 52 35 35 -321
PampE 167 165 167 +03 17 15 15 -123
Medical 276 265 265 -40 25 27 28 +97
Semi 353 370 388 +98 94 90 96 +26
Scientific 267 260 257 -38 11 08 09 -211
Total 1719 1700 1700 -11 201 175 184 -82
Sales Operating profit2016 2016
Record-high
2016 Results by Segment
2015 results are restated numbers The same shall apply hereinafter
(Billions of yen)
Sheet1 (2)
全社2014実績
セグ別2014実績
全社2015予想
セグ別2015予想
copy 2017 HORIBA Ltd All rights reserved 8
Contents
2016 Results
2017 Forecast
Business Segment Outline
Shareholder Return
MLMAP2020 [2016-2020] Progress Financial Data Corporate profile
copy 2017 HORIBA Ltd All rights reserved 9
Scientific
Auto
Semi
PampE
Medical
Expect steady RampD investments by automakers Closely monitor emission regulations in EU and Japan
Expect continuous investment by semiconductor manufacturers in the first half uncertainties over outlook in demand by semiconductor production equipment in the second half
Closely monitor sales trend of small-sized products in Japan Changes in medical care system in US
2017 Market outlook
Expect firm demand for stack gas analyzers and water measurement equipment in Asian countries
Japan Expect an increase in the private sector capital spending Overseas Closely monitor government budgets and spending in EU
copy 2017 HORIBA Ltd All rights reserved 10
Exchange rate forecast for 2017
2015 2016
Results Results Forecastas of Feb 14
Forecastas of May 12
vs 2016
USD 12110 10878 110 110 +122
EUR 13431 12026 120 120 -026
2017
(Yen)
1 yen OP sensitivity for 2017 Forecast as of May 12 USD 160 million yen EUR 23 million yen
Sheet1 (2)
全社2014実績
セグ別2014実績
全社2015予想
Sheet4
Sheet5
Sheet6
copy 2017 HORIBA Ltd All rights reserved 11
2015 2016Results
(New policy)Results Forecast
as of Feb 14Forecast
as of May 12vs 2016
Sales 1719 1700 1770 1830 +76
Operating profit 201 184 200 210 +135
OP 117 109 113 115 +06p
Ordinary proft 196 182 193 203 +111Net income attribute to
Owners of Parent 132 129 130 136 +49Net profit
per share(Yen) 315 308 309 323 +48
ROE 107 100 95 99 -01p
2017
Forecast for 2017
Record-high
2015 results are restated numbers The same shall apply hereinafter
(Billions of yen)
Sheet1 (2)
全社2014実績
セグ別2014実績
全社2015予想
Sheet4
Sheet5
Sheet6
copy 2017 HORIBA Ltd All rights reserved 12
(Billions of yen) Forecast for 2017 by segment
2016 2016
Results Forecastas of Feb 14
Forecastas of May 12
vs 2016 Results Forecastas of Feb 14
Forecastas of May 12
vs 2016
Auto 622 670 690 +109 35 52 52 +473
PampE 167 180 180 +74 15 16 11 -286
Medical 265 250 250 -59 28 22 22 -216
Semi 388 410 460 +185 96 100 120 +240
Scientific 257 260 250 -29 09 10 05 -471
Total 1700 1770 1830 +76 184 200 210 +135
Sales OP2017 2017
Record- high
Sheet1 (2)
全社2014実績
セグ別2014実績
全社2015予想
セグ別2015予想
copy 2017 HORIBA Ltd All rights reserved 13
Contents
2016 Results
2017 Forecast
Business Segment Outline
Shareholder Return
MLMAP2020 [2016-2020] Progress Financial Data Corporate profile
copy 2017 HORIBA Ltd All rights reserved 14
Next Slide
copy 2017 HORIBA Ltd All rights reserved 15
Topics of Automotive Industries in 2016 The autonomous-driving car age begins
Use of artificial intelligence (AI) Accelerated EV development
RampD shift to electrification Exhaust gas and fuel economy test scandals at
VW and in Japan More strict regulations in EMS (WLTP RDE)
For indoor tests and on-road tests Brexit
2016 Results and 2017 Forecast
EMS Steady sales in Japan increase in OBS
MCT Temporary decline in demand
ECT Full-year incremental sales goodwill of 04bn yen
EMS Steady sales in Japan and Asia MCT Significant recovery improved profitability ECT Many inquiries weak GBP to depress amounts in yen
EMS Emission Measurement Systems OBS On-Board Exhaust Emission Measurement System ECT Engineering Consultancy amp Testing business operated by HORIBA MIRA WLTP RDE See details on Slide 17
(Billions of yen)
Graph1
売上高
営業利益
690
542
72
371
18
357
16
386
28
432
44
495
42
55
58
642
44
654
52
622
35
69
52
Sheet1
Sheet1
売上高
REF
REF
Sheet2
Sheet3
copy 2017 HORIBA Ltd All rights reserved 16
95 110 128 133 108 152
81 116
145 162
197
132
180
2011 2012 2013 2014 2015 2016 2017
BacklogSales
Auto Strategy for improving profitability
[Problem] Long waiting in the design process
[Solution] Reduce design work by standardizing specs
0
10
20
30
40
50
60
70
Aug2015 Feb2016 Aug2016
(days)
60 days in Aug 2015
11days in Aug 2016
Shorten the lead time in the specification-design stage
Lead time from specification adoption to design completion
Significant recovery is expected in 2017 Pick up in automakersrsquo investments Improve order booking by expanding turn-
key projects (in Japan EU the US) Focus on improving profitability Tighter management of project progress
Inquiry
Determ
ine S
pecification
Design
Procure
Product
Installment
Test
Inspection
Collection
Aim at cutting the lead time to one-third
- HORIBA BIWAKO E-HARBOR - MCT
MCT business improves profitability
MCT Sales and Order Backlog (Billions of yen)
(Forecast)
Case of the MEXA series middle-sized EMS product
The lead time was shortened to 15
(Restated)
copy 2017 HORIBA Ltd All rights reserved 17
EMS Sales and Order Backlog (Billions of yen)
137 169 179 202 269 294
265 286 333
374 398 401 420
0
15
30
45
2011 2012 2013 2014 2015 2016 2017
Backlog Sales
Open November 2016
Location Pune western India (Center of Auto Business)
Function Indoor Automotive test Product
customizationTraining
Objective Strengthen demonstration
test and application
development
Regulatory trend in EMS (Emission Measurement System) and Operations in an emerging Market Auto
Regulatory trend Solid sales in Japan (automakers parts makers) Steady investment in Japan WLTP(unified emission regulations by the UN) Start in Sep 2017 in EU and in 2018 in Japan RDE (Real Driving Emission on-road test) regulation Start in Sep 2017 in EU WLTPhellipWorldwide harmonized Light vehicles Test Procedure
HORIBA India Technical Center Establishment
Overview HORIBA India Technical center
(Forecast) (Restated)
Open July 2017 (Plan)
Location Nuneaton Warwickshire UK
Function Cutting-edge Emission Testing Lab (applied
for RDE regulation)
Objective Strengthen
demonstration test
HORIBA MIRA AETC Establishment
(Advanced Emission Test Centre AETC)
Inside of AETC
copy 2017 HORIBA Ltd All rights reserved 18
Auto ECT (HORIBA MIRA) Business
Sale decline caused by weaker GBP vs the JPY Investments of 30bn yen planned each in 2016
and 2017 while closely monitoring the Brexit impacts
Increased inquiries to MIRA Technology Park Accelerated global business (JapanAsia)
ECT Business (EngineeringHORIBA MIRA)
G7 transport ministersrsquo summit (held in Karuizawa Japan in Sep 2016)
Participation in the UK government autonomous driving car project
httpwwwukautodrivecomthe-uk-autodrive-project
George Gillespie CEO of HORIBA MIRA participated as a representative of UK
Main theme Autonomous driving 1 Development and dissemination of cutting-edge
technology regarding automobiles and roads 2 Basic policy for transportation infrastructure
Participated in Jaguar Land Roverrsquos testing contributed to the demonstration test of autonomous driving technology
Major participants Germany BMW France Renault Japan Toyota UK HORIBA MIRA
42 35
45
72 70
02468
2015 2016 2017
Backlog Sales
(Half-year Restated) (Forecast)
JPYGBP 185 yen 147 yen 140 yen
ECT Sales and Backlog (Billions of Yen)
copy 2017 HORIBA Ltd All rights reserved 19
bull Steady sales of stack gas analyzers in Japan
bull Robust process analytical measurement business (US)
bull Weak sales in EU and Asia
bull Expect steady sales to continue in Japan
bull Profitability improvement in gas measurement business
in HORIBA BIWAKO E-HARBOR
bull Increase RampD expenditure for water business
Automatic on-line analysis of PM components Integrate HORIBArsquos technology in and times Identify sources of origin of microparticles Enable 24-hour consecutive analysis of elements
Project to improve water quality of wastewater from dyeing factories Installing wastewater treatment systems and
water quality monitors in Myanmar Joint project with Hitachi Zosen Corporation
Ministry of Environment (MOE) plans to adopt HORIBArsquos products Scheduled to install devices at 4 sites in Japan
in Apr 2017
Designated one of the ldquoModel businesses to improve water environment in Asiardquo by MOE Started experimentation in Jan 2017
Demo facility installed in HORIBA BIWAKO E-HARBOR
PampE SCI
Facilities installed in Wundwin city Myanmar
Water quality analyzer
PM25 analyzer
copy 2017 HORIBA Ltd All rights reserved 21
Firm sales of CBC+CRP analyzers in Japan
Sales decrease in yen due to the yen appreciation
Steady growth in India
Expect firm sales of CBC+CRP analyzers in Japan
bull Accelerated sales expansion by introducing a new
Strategy to expand sales in mediumlarge-sized hematology analyzers Propose total solutions including a data
management system Expand business globally from 2Q of 2017
New brand ldquoYumizenrdquo
Medical Growth with New Brand and Service
Provide maintenance service system using IoT technology
for reducing device downtime
Enhance maintenance support by continuous monitoring amp diagnostic reports
Detect problems in advance and provide appropriate suggestions
Target 6000 contracts by 2020 in Japan Also plan to expand globally
携帯通信網使用
Distributors
Medical Certificate
Call Center
Customer
Through Mobile network
Coordination
Automatic Data Collection Monitoring
Server
Monitoring Machine Condition
Preventive Maintenance
copy 2017 HORIBA Ltd All rights reserved 23
(Billions of yen)
bull Record-high sales and operating profit due to increased investments by semiconductor manufacturers in Asia
bull Sales decrease in yen terms due to the appreciation of the yen
bull Investment to raise Aso factory production capacity Less-certain market outlook for the 2nd half Closely monitor investment trend in China
2016 Results Topics regarding the semiconductor industry and mass flow controller market Data centersrsquo shift to memory for storage Sharp increase in demand for
semiconductors Changes in manufacturing technology
Miniaturization 3D-NAND double-patterning rarr Increase in demand for etching devices Disciplined investment by semiconductor
manufacturers The silicon cycle to fluctuate less widely The market to stabilize
Cutting-edge technology of HORIBA and HORIBA Jobin Yvon Close relationship with academia
MESA-50T SEM-CL
For a rare metal manufacturer
Software development for rare metal analysis
Customized chamber
Specialized in defect
characterization Applied Topcon technology
Collaboration with Raman Testing for protein and
drugs
INV-XploRA
Cutting-edge material development
High concentration cell Minute amount
measurement
New market creation and product development to meet customerrsquos needs
LA-960
Imaging CL device (released in Aug 2016) Convert defective images into high-accuracy images Characteristic distribution analysis of phosphor parts of LED
elements Accelerate RampD for the next-generation power devices
HORIBA HORIBA Jobin Yvon
Electron beam technology of Topcon
New product by integrating HORIBA Grouprsquos technologies
Materials for semiconductors Life science sector
Imaging Cathodoluminescence (CL)
Scientific
copy 2017 HORIBA Ltd All rights reserved 27
Contents
2016 Results
2017 Forecast
Business Segment Outline
Shareholder Return
MLMAP2020 [2016-2020] Progress Financial Data Corporate profile
copy 2017 HORIBA Ltd All rights reserved 28
2015 Results 70 yen per share + 2016 Results 85 yen per share 2017 Forecast 90 yen per share
- Dividend payment + Share buyback = 30 of Consolidated net profit to be targeted - Remaining earnings are retained internally for strategic investment (ie facilities MampA)
(Yen) Per-share dividend (from 2002 to 2017 Forecast)
Basic policy (since 2013)
Dividends and Share buybacks
(fore)
2015 Share buyback 218400 shares
about 10 billion yen
Record high for 7 years in a row
An Average total return ratio of last 3years 292
copy 2017 HORIBA Ltd All rights reserved 29
Contents
2016 Results
2017 Forecast
Business Segment Outline
Shareholder Return
MLMAP2020 [2016-2020] Progress Financial Data Corporate profile
HORIBA Stained Glass Project Lunch gatherings of working mothers Seminars on how to balance long-term care and work Workshop to improve work productivity
Selected as one of New Diversity Management Selection 100 (by the Ministry of Economy Trade and Industry of Japan)
Reasons for the award Corporate motto ldquoJoy and Funrdquo and the Stained Glass Project
Mr Saito executive vice president and Ms Moriguchi leader of Stained Glass Project at the award-receiving ceremony
copy 2017 HORIBA Ltd All rights reserved 37
Decided to introduce a new KPI to measure asset efficiency Indicator composed of ldquoOperating profitrdquo and ldquoWACCrdquo Applying unit Business segments and Group companies Strengthen PDCA cycle Efficient use of business assets and increase profit
Plan to prepare a budget to this project in 2018
Founded financial subsidiaries in the US and the UK Improve capital efficiency through group financing Strengthen financial management function in each region
Enhance asset efficiency and maximize corporate value
Improve asset efficiency amp
Accelerate business growth
Investment
Business Growth
Cash Generation
copy 2017 HORIBA Ltd All rights reserved 38
Symbol of MLMAP2020
Step out of the existing business fields and pursue further expansion Take a new perspective and overcome technologicalmarketorganization barriers
Be flexible think outside the box and move up to the next stage
ONE STEP AHEAD - To create a next stage of HORIBA -
copy 2017 HORIBA Ltd All rights reserved 39
Contents
2016 Results
2017 Forecast
Business Segment Outline
Shareholder Return
MLMAP2020 [2016-2020] Progress Financial Data Corporate profile
PPampE Investment to MIRA(30BJYP) Depreciation Goodwill of MIRA(04BJYP) Biwako factory (07BJYP) RampD Increased in Automotive Test System Business
Good will of MIRA eg hellip Amortization included
2017 Topics
PPampE Investment to MIRA(30BJYP) Expansion of Aso Factory(27BJYP)
Depreciation Goodwill of MIRA(04BJYP) Increase in MIRA and Test center invested in 2016 RampD Increase in Auto and PampE Business
Capital Investment Depreciation RampD (Billions of yen)
全社実績
セグ実績
全社予算
全社予算2案
セグ予算
セグ予算2案
受注_残
半期予想
設備投資
HOR単体実績
HOR単体予算
HOR単体上期予算
copy 2017 HORIBA Ltd All rights reserved 45
241 Bond
redemption in 2020
Current ratio
280
2014 254 60
Short 66
Cash1
492
Bonds 150
Long 25
Cash1
478
Bonds 150
Long 22 Short 108
2013 269 60
447
Cash1
511
Bonds 150
Long 168
Short 128
2015 229 55
Borrowed from JBIC2
151bn yen (2015)
Capital ratio
467
2016 237 55
Cash1
519
Bonds 150
Long 192
Short 124
Cash Balance (Billions of yen)
(Consolidated basis each end of the year) Total Loan Balance
Conclusion of liquidation of receivable contract with 2 banks Recent issuer rating RampI [A-] (July 2016) JCR [A] (August 2016)
1 CashhellipCash and Cash Equivalents at End of Period 2 JBIC Japan Bank for International Cooperation
Graph1
Sheet1
Sheet1
現預金
短期
長期
社債
Sheet1 (2)
tajikaABX =gtHIL
tajikaSTEC=gtHOR
copy 2017 HORIBA Ltd All rights reserved 46
Contents
2016 Results
2017 Forecast
Business Segment Outline
Shareholder Return
MLMAP2020 [2016-2020]Progress Financial Data Corporate profile
copy 2017 HORIBA Ltd All rights reserved 47
Head office Kyoto Japan Founded 1945 Incorporated 1953 CEO Atsushi Horiba Fiscal year end December 31
Atsushi Horiba Chairman President amp CEO
- Corporate motto -
To have interest and pride in our work to enjoy our lives
Corporate Profile
copy 2017 HORIBA Ltd All rights reserved 48
Medical In-Vitro Diagnostic (IVD) Systems Integration of HORIBA ABXrsquos Technology amp Marketing Know-How
Automotive Test Systems Emission Measurement Systems (EMS) Mechatronics Devices (MCT) Driving Control Systems (ITS) Engineering Consultancy amp Testing (ECT)
Business Segments
Process amp Environmental Environmental Systems Environmental Radiation Monitor Environmental Regulation amp Process Business
Semiconductor Mass Flow Controller In-situ Analysis Synergy among HORIBA HQ HORIBA STEC and HORIBA Jobin Yvonrsquos Technologies
Scientific Synergy of HORIBA and HORIBA Jobin Yvonrsquos Technologies Raman Grating and Fluorescence
copy 2017 HORIBA Ltd All rights reserved 49
Sales 1700 Billions of Yen
Business Composition of Sales
Automotive Test Systems
Process amp Environmental
Medical
Semiconductor
Scientific
Automotive 622 (36)
Scientific 257 (15)
Semiconductor 388 (23)
Medical 265 (16)
PampE 167 (10)
Well Balanced Business Operation -Five Business Segments-
(Billions of Yen)
copy 2017 HORIBA Ltd All rights reserved 50
Market Shares
Market shares quoted are estimates by HORIBA
80 20 100
35
Emission Measurement Systems
57 30
Stack Gas Analyzers Automatic Blood Cell Counter plus CRP
Mass Flow Controllers Raman Spectrophotometers Gratings
Global Domestic
copy 2017 HORIBA Ltd All rights reserved 51
EU Japan
Asia Americas
33
26 18
23
Geographic Composition of Sales(2016)
HORIBA Worldwide
Sales of FY2016 1700 BJPY
The Number of Group Companies by region (As of December 31 2016)
America 9 Europe 23 Asia 17 (4 in Japan including HORIBA Ltd) Total 49
copy 2017 HORIBA Ltd All rights reserved 52
Japan 38
Other Asia 15
France 13
Germany 8
Other Europe 2 USA
10
Other Americas 3
7149
従業員数 2015年12月31日現在
2442
946
3761
UK 11
Employees by Region
Total Number of Employees (As of December 31 2016)
Total Asia 53
Total Europe 34
Total Americas 13
copy 2017 HORIBA Ltd All rights reserved 53 copy 2017 HORIBA Ltd All rights reserved 53
copy 2017 HORIBA Ltd All rights reserved 54
Danke
Grazie
Σας ευχαριστούμε
감사합니다
Obrigado
谢谢
ขอบคณครบ
ありがとうございました
धनयवाद
நனற
Cảm ơn
Dziękuję
Tack ska ni ha
Thank you
Merci
Gracias
Большое спасибо
スライド番号 1
Contents
Contents
スライド番号 4
Summary of 2016 Results
2016 full year results
2016 Results by Segment
Contents
2017 Market outlook
Exchange rate forecast for 2017
Forecast for 2017
Forecast for 2017 by segment
Contents
スライド番号 14
2016 Results and 2017 Forecast
Strategy for improving profitability
Regulatory trend in EMS (Emission Measurement System) and Operations in an emerging Market
ECT (HORIBA MIRA) Business
2016 Results and 2017 Forecast
Analysis technology for the environment
2016 Results and 2017 Forecast
Growth with New Brand and Service
2016 Results and 2017 Forecast
スライド番号 24
2016 Results and 2017 Forecast
Exploit new markets using HORIBA technology
Contents
Shareholder Return
Contents
スライド番号 30
スライド番号 31
スライド番号 32
Accelerate growth in water measuring business
Water measuring and analysisbusiness domain
Water measuring and analysisbusiness domain
Selected as one of New Diversity Management Selection 100 (by the Ministry of Economy Trade and Industry of Japan)
Enhance asset efficiency and maximize corporate value
Symbol of MLMAP2020
Contents
Trend of Market capitalization
Changed the accounting policy for revenue recognition
スライド番号 42
スライド番号 43
スライド番号 44
スライド番号 45
Contents
スライド番号 47
Business Segments
スライド番号 49
Market Shares
スライド番号 51
スライド番号 52
スライド番号 53
スライド番号 54
勘定科目
BS_CL12010
BS_CL12020
BS_CL12030
BS_FL21000
BS_FL23000
勘定科目名称
当座借越
短期借入金
1年内返済長期借入金
社債
長期借入金
HOR
0
(2000000000)
0
(10000000000)
0
日本 ニホン
ABX
(827350776)
(4016672108)
(534035942)
0
(1343663409)
欧州 オウシュウ
ASEC
0
(352000000)
0
0
(180000000)
日本 ニホン
HE
0
(1855530779)
0
0
0
欧州 オウシュウ
HIC
0
(1156081000)
(109236000)
0
(682725000)
米州 ベイシュウ
HIT
(99662290)
0
(200000000)
0
(300000000)
日本 ニホン
HSC
0
(20019305)
0
0
0
アジア
HST
0
(166375000)
0
0
0
アジア
JY
0
0
(9753688)
0
(105723687)
欧州 オウシュウ
会社間照合
0
(5047)
欧州 オウシュウ
会社間照合
200000000
日本 ニホン
会社間照合
480000000
日本 ニホン
会社間照合
2000000000
日本 ニホン
会社間照合
118647000
欧州 オウシュウ
会社間照合
175953553
欧州 オウシュウ
連結合計
(927013066)
(7272082686)
(653025630)
(10000000000)
(2132112096)
(99662290)
(352000000)
0
(10000000000)
0
日本 ニホン
(827350776)
(5577607381)
(543789630)
0
(1449387096)
欧州 オウシュウ
0
(1156081000)
(109236000)
0
(682725000)
米州 ベイシュウ
0
(186394305)
0
0
0
アジア
(927013066)
(7272082686)
(653025630)
(10000000000)
(2132112096)
2008
2009
2010
2011
2012
2013
2008
2008
2009
2009
2013
2013
2014
2014
2015
2015
2016
2016
短期借入金 タンキカリイレキン
8852
6618
5575
6684
5523
6606
現預金 ゲンヨキン
18267
21520
49246
51109
47859
51900
長期借入金 チョウキカリイレキン
2132
1730
1195
1291
2113
2576
短期 タンキ
8852
6618
6606
10832
12800
12400
社債 シャサイ
10000
10000
10000
10000
10000
15000
長期 チョウキ
2132
1730
2576
2209
16800
19200
現預金 ゲンヨキン
18267
21520
26958
28893
34685
42228
社債 シャサイ
10000
10000
15000
15000
15000
15000
流動比率 リュウドウヒリツ
2296
2524
2653
2806
2970
2690
自己資本比率 ジコシホンヒリツ
576
609
612
624
650
600
49246
6606
2576
15000
51109
10832
2209
15000
47859
12800
16800
15000
51900
12400
19200
15000
2013年実績 ネン ジッセキ
2014年実績 ネン ジッセキ
2015年計画 ネン ケイカク
増減
計画(GBM) ケイカク
発表案 ハッピョウ アン
vs 2014
売上高 ウリアゲ タカ
営業利益 エイギョウ リエキ
経常利益 ケイジョウ リエキ
当期純利益 トウキ ジュンリエキ
2013年 ネン
2014年 ネン
2015年 ネン
増減
実績
実績
計画(GBM) ケイカク
決定 ケッテイ
vs 2014
売上高 ウリアゲ タカ
営業利益 エイギョウ リエキ
経常利益 ケイジョウ リエキ
当期純利益 トウキ ジュンリエキ
営業利益率 エイギョウ リエキ リツ
2013実績 ジッセキ
2014年 ネン
増減
開示116 カイジ
実績 ジッセキ
vs 2013
売上高 ウリアゲ タカ
営業利益 エイギョウ リエキ
経常利益 ケイジョウ リエキ
当期純利益 トウキ ジュンリエキ
2015
2016
2017
Results
Forecast117
Results
vs 2015
vs Forecast117
Forecast
vs 2016
PPampE
148
153
134
-10
-12
146
+9
Intangibles
14
07
03
-75
-49
04
+11
Capital Investment
163
160
137
-15
-14
150
+9
Depreciation
61
65
68
+12
+5
72
+6
RampD
123
130
129
+5
-1
140
+8
(To net sales)
(7)
(8)
(8)
(8)
2014年 ネン
2015年 ネン
実績 ジッセキ
社内数値 シャナイ スウチ
発表案 ハッピョウ アン
上期 カミ キ
下期 シモキ
通期 ツウキ
上期 カミキ
下期 シモキ
通期 ツウキ
上期 カミ キ
下期 シモキ
通期 ツウキ
売上高 ウリアゲ ダカ
0
0
0
0
0
自動車 ジドウシャ
0
0
0
環境 カンキョウ
0
0
0
医用 イヨウ
0
0
0
半導体 ハンドウタイ
0
0
0
科学 カガク
0
0
0
営業利益 エイギョウ リエキ
0
0
0
0
0
自動車 ジドウシャ
0
0
0
環境 カンキョウ
0
0
0
医用 イヨウ
0
0
0
半導体 ハンドウタイ
0
0
0
科学 カガク
0
0
0
経常利益 ケイジョウ リエキ
0
0
当期純利益 トウキ ジュンリエキ
0
0
営業利益率 エイギョウ リエキ リツ
ERRORDIV0
ERRORDIV0
ERRORDIV0
ERRORDIV0
ERRORDIV0
ERRORDIV0
ERRORDIV0
ERRORDIV0
ERRORDIV0
自動車 ジドウシャ
ERRORDIV0
ERRORDIV0
ERRORDIV0
ERRORDIV0
ERRORDIV0
ERRORDIV0
ERRORDIV0
ERRORDIV0
ERRORDIV0
環境 カンキョウ
ERRORDIV0
ERRORDIV0
ERRORDIV0
ERRORDIV0
ERRORDIV0
ERRORDIV0
ERRORDIV0
ERRORDIV0
ERRORDIV0
医用 イヨウ
ERRORDIV0
ERRORDIV0
ERRORDIV0
ERRORDIV0
ERRORDIV0
ERRORDIV0
ERRORDIV0
ERRORDIV0
ERRORDIV0
半導体 ハンドウタイ
ERRORDIV0
ERRORDIV0
ERRORDIV0
ERRORDIV0
ERRORDIV0
ERRORDIV0
ERRORDIV0
ERRORDIV0
ERRORDIV0
科学 カガク
ERRORDIV0
ERRORDIV0
ERRORDIV0
ERRORDIV0
ERRORDIV0
ERRORDIV0
ERRORDIV0
ERRORDIV0
ERRORDIV0
受注実績 ジュチュウ ジッセキ
2013
2014
1Q
2Q
3Q
4Q
1Q
2Q
3Q
4Q
自動車
128
125
103
166
環境
39
38
41
40
医用
67
64
60
71
半導体
46
51
69
88
科学
53
61
61
77
合計
334
341
337
444
受注残 ジュチュウ ザン
2013
2014
1Q
2Q
3Q
4Q
1Q
2Q
3Q
4Q
自動車
314
335
325
314
環境
33
39
45
38
医用
30
27
24
23
半導体
20
15
25
31
科学
55
67
76
76
合計
454
486
497
484
受注実績 ジュチュウ ジッセキ
2013
2014
1Q
2Q
3Q
4Q
1Q
2Q
3Q
4Q
自動車
128
125
103
166
EMS
93
91
78
110
MCT
32
30
24
48
HIT
4
4
2
9
受注残 ジュチュウ ザン
2013
2014
推移 スイイ
1Q
2Q
3Q
4Q
1Q
2Q
3Q
4Q
自動車
314
335
325
314
EMS
173
188
195
177
MCT
135
142
125
128
HIT
5
5
4
7
売上高 ウリアゲ ダカ
営業利益 エイギョウ リエキ
2014
2015 計画 ケイカク
2014
2015 計画 ケイカク
実績 ジッセキ
社内数値 シャナイ スウチ
発表案① ハッピョウ アン
発表案② ハッピョウ アン
MLMAP2015年数値 ネン スウチ
実績 ジッセキ
社内数値 シャナイ スウチ
発表案① ハッピョウ アン
発表案② ハッピョウ アン
MLMAP2015年数値 ネン スウチ
vs 2014
vs 2014
対外発表 タイガイ ハッピョウ
社内数値 シャナイ スウチ
vs 2014
vs 2014
対外発表 タイガイ ハッピョウ
社内数値 シャナイ スウチ
自動車 ジドウシャ
環境 カンキョウ
医用 イヨウ
半導体 ハンドウタイ
科学 カガク
合計 ゴウケイ
営業利益 エイギョウ リエキ
2014
2015 計画 ケイカク
実績 ジッセキ
社内数値 シャナイ スウチ
発表案① ハッピョウ アン
発表案② ハッピョウ アン
MLMAP2015年数値 ネン スウチ
vs 2014
vs 2014
対外発表 タイガイ ハッピョウ
社内数値 シャナイ スウチ
自動車 ジドウシャ
環境 カンキョウ
医用 イヨウ
半導体 ハンドウタイ
科学 カガク
合計 ゴウケイ
売上高 ウリアゲ ダカ
営業利益 エイギョウ リエキ
2014
2015
2014
2015
実績 ジッセキ
社内数値 シャナイ スウチ
発表案 ハッピョウ アン
vs2014
実績 ジッセキ
社内数値 シャナイ スウチ
発表案 ハッピョウ アン
vs2014
自動車 ジドウシャ
環境 カンキョウ
医用 イヨウ
半導体 ハンドウタイ
科学 カガク
合計 ゴウケイ
2014
2015年計画 ネン ケイカク
実績 ジッセキ
社内数値 シャナイ スウチ
開示案① カイジ アン ハツアン
開示案② カイジ アン ハツアン
MLMAP2015年数値 ネン スウチ
市場 シジョウ
vs 2014
vs 2014
対外発表 タイガイ ハッピョウ
社内数値 シャナイ スウチ
8社平均 シャ ヘイキン
売上高 ウリアゲ タカ
営業利益 エイギョウ リエキ
経常利益 ケイジョウ リエキ
当期純利益 トウキ ジュンリエキ
営業利益率 エイギョウ リエキ リツ
ドル
ユーロ
配当(円1株) ハイトウ エン カブ
2014
2015
MLMAP2015年数値 ネン スウチ
市場 シジョウ
実績 ジッセキ
社内数値 シャナイ スウチ
発表案 ハッピョウ アン
vs2014
対外発表 タイガイ ハッピョウ
社内数値 シャナイ スウチ
8社平均 シャ ヘイキン
売上高 ウリアゲ タカ
営業利益 エイギョウ リエキ
経常利益 ケイジョウ リエキ
当期純利益 トウキ ジュンリエキ
営業利益率 エイギョウ リエキ リツ
ドル
ユーロ
配当(円1株) ハイトウ エン カブ
売上高 ウリアゲ ダカ
営業利益 エイギョウ リエキ
2013年 ネン
2014年 ネン
2013年 ネン
2014年 ネン
実績 ジッセキ
開示116 カイジ
実績 ジッセキ
増減vsv2013 ゾウゲン
実績 ジッセキ
開示116 カイジ
実績 ジッセキ
増減vsv2013 ゾウゲン
自動車 ジドウシャ
環境 カンキョウ
医用 イヨウ
半導体 ハンドウタイ
科学 カガク
合計 ゴウケイ
2013年 ネン
2014年 ネン
増減比較 ゾウゲン ヒカク
市場 シジョウ
実績 ジッセキ
開示(116) カイジ
実績(監査前) ジッセキ カンサ マエ
vs 13年 ネン
vs 開示 カイジ
8社平均 シャ ヘイキン
売上高 ウリアゲ タカ
営業利益 エイギョウ リエキ
経常利益 ケイジョウ リエキ
当期純利益 トウキ ジュンリエキ
営業利益率 エイギョウ リエキ リツ
配当 ハイトウ
配当性向 ハイトウ セイコウ
為替レート(累計)
ドル
ユーロ
2015
2016
Variation
Cash flows from operating activities
14770
15871
1101
Cash flows from investing activities
-30642
-10427
20214
Cash flows from financing activities
12843
-451
-13294
Cash and cash equivalents at end of year
47859
51940
4081
Free cash flows
-15872
5443
21315
Changed points
Original
Shipment base
New
The date of delivery or installation based on contractual arrangements
Applied timing
January 2016
Reason for change
Triggered by the introduction of a new ERP implementation to harmonize with international accounting standards
MLMAP2020 [2016-2020] Progress Financial Data Corporate profile
copy 2017 HORIBA Ltd All rights reserved 4
External events
Earthquakes in Kumamoto Exhaust gas and fuel economy testing problems Appreciation of the yen Brexit
Internal events
Revenue recognition policy change (January) Shipment base Deliveryinstallation base
HORIBA MIRA full-year results in HORIBArsquos consolidated results included for the first time
HORIBA BIWAKO E-HARBOR began operation Expansion of HORIBA STECrsquos Aso Factory decided HORIBA India Technical Center was established Reorganization of HORIBA Group companies in
France decided (effective January 2017) Water measuring businesses integrated to HORIBA
Advanced Techno Ltd (from January 2017)
Review of 2016
copy 2017 HORIBA Ltd All rights reserved 5
Summary of 2016 Results
Paid the highest dividend amount (85 yen per share) Achieved ROE of 10
Year-on-year declines from the top line down to ordinary profit but the absolute levels were the second highest to the record-highs in 2015
Record-high net profit due to a one-time drop in tax rate
Negative impact of yen appreciation Revenues down 142bn yen OP down 31bn yen
PampL
Total assets were 2396bn yen down 75bn yen from the end of 2015 due to lower yen value caused by the yen appreciation
Equity ratio 554 BS
Operating CF Inflow of 158bn yen due to growth in profit Investing CF Outflow of 104bn yen due to capital spending Financial CF Outflow of 04bn yen due to long-term borrowing
CF FCF
+54bn yen
2015 results are restated numbers Net profit in 2016 was the second highest compared with the restated figures
copy 2017 HORIBA Ltd All rights reserved 6
2015Results
(New Policy)Forecast(as of Nov2016)
Results vs2015 vsForecast
Sales 1719 1700 1700 -11 +01
Operatign Profit 201 175 184 -82 +57
OP 117 103 109 -08p +06p
Ordinary profit 196 170 182 -69 +75
Net Income attributeable toOwners of Parent 132 108 129 -24 +200
Net prof itper share(Yen) 315 256 308 -24 +200
ROE 107 85 100 -07p +15p
2016
(Billions of yen) 2016 full year results
2015 results are restated numbers The same shall apply hereinafter
Sheet1 (2)
全社2014実績
セグ別2014実績
全社2015予想
Sheet4
Sheet5
Sheet6
copy 2017 HORIBA Ltd All rights reserved 7
2015 vs 2015 vs Results
(New Policy)Forecast(as of Nov 2016)
Results 2015 Results(New Policy)
Forecast(as of Nov 2016)
Results 2015
Auto 654 640 622 -49 52 35 35 -321
PampE 167 165 167 +03 17 15 15 -123
Medical 276 265 265 -40 25 27 28 +97
Semi 353 370 388 +98 94 90 96 +26
Scientific 267 260 257 -38 11 08 09 -211
Total 1719 1700 1700 -11 201 175 184 -82
Sales Operating profit2016 2016
Record-high
2016 Results by Segment
2015 results are restated numbers The same shall apply hereinafter
(Billions of yen)
Sheet1 (2)
全社2014実績
セグ別2014実績
全社2015予想
セグ別2015予想
copy 2017 HORIBA Ltd All rights reserved 8
Contents
2016 Results
2017 Forecast
Business Segment Outline
Shareholder Return
MLMAP2020 [2016-2020] Progress Financial Data Corporate profile
copy 2017 HORIBA Ltd All rights reserved 9
Scientific
Auto
Semi
PampE
Medical
Expect steady RampD investments by automakers Closely monitor emission regulations in EU and Japan
Expect continuous investment by semiconductor manufacturers in the first half uncertainties over outlook in demand by semiconductor production equipment in the second half
Closely monitor sales trend of small-sized products in Japan Changes in medical care system in US
2017 Market outlook
Expect firm demand for stack gas analyzers and water measurement equipment in Asian countries
Japan Expect an increase in the private sector capital spending Overseas Closely monitor government budgets and spending in EU
copy 2017 HORIBA Ltd All rights reserved 10
Exchange rate forecast for 2017
2015 2016
Results Results Forecastas of Feb 14
Forecastas of May 12
vs 2016
USD 12110 10878 110 110 +122
EUR 13431 12026 120 120 -026
2017
(Yen)
1 yen OP sensitivity for 2017 Forecast as of May 12 USD 160 million yen EUR 23 million yen
Sheet1 (2)
全社2014実績
セグ別2014実績
全社2015予想
Sheet4
Sheet5
Sheet6
copy 2017 HORIBA Ltd All rights reserved 11
2015 2016Results
(New policy)Results Forecast
as of Feb 14Forecast
as of May 12vs 2016
Sales 1719 1700 1770 1830 +76
Operating profit 201 184 200 210 +135
OP 117 109 113 115 +06p
Ordinary proft 196 182 193 203 +111Net income attribute to
Owners of Parent 132 129 130 136 +49Net profit
per share(Yen) 315 308 309 323 +48
ROE 107 100 95 99 -01p
2017
Forecast for 2017
Record-high
2015 results are restated numbers The same shall apply hereinafter
(Billions of yen)
Sheet1 (2)
全社2014実績
セグ別2014実績
全社2015予想
Sheet4
Sheet5
Sheet6
copy 2017 HORIBA Ltd All rights reserved 12
(Billions of yen) Forecast for 2017 by segment
2016 2016
Results Forecastas of Feb 14
Forecastas of May 12
vs 2016 Results Forecastas of Feb 14
Forecastas of May 12
vs 2016
Auto 622 670 690 +109 35 52 52 +473
PampE 167 180 180 +74 15 16 11 -286
Medical 265 250 250 -59 28 22 22 -216
Semi 388 410 460 +185 96 100 120 +240
Scientific 257 260 250 -29 09 10 05 -471
Total 1700 1770 1830 +76 184 200 210 +135
Sales OP2017 2017
Record- high
Sheet1 (2)
全社2014実績
セグ別2014実績
全社2015予想
セグ別2015予想
copy 2017 HORIBA Ltd All rights reserved 13
Contents
2016 Results
2017 Forecast
Business Segment Outline
Shareholder Return
MLMAP2020 [2016-2020] Progress Financial Data Corporate profile
copy 2017 HORIBA Ltd All rights reserved 14
Next Slide
copy 2017 HORIBA Ltd All rights reserved 15
Topics of Automotive Industries in 2016 The autonomous-driving car age begins
Use of artificial intelligence (AI) Accelerated EV development
RampD shift to electrification Exhaust gas and fuel economy test scandals at
VW and in Japan More strict regulations in EMS (WLTP RDE)
For indoor tests and on-road tests Brexit
2016 Results and 2017 Forecast
EMS Steady sales in Japan increase in OBS
MCT Temporary decline in demand
ECT Full-year incremental sales goodwill of 04bn yen
EMS Steady sales in Japan and Asia MCT Significant recovery improved profitability ECT Many inquiries weak GBP to depress amounts in yen
EMS Emission Measurement Systems OBS On-Board Exhaust Emission Measurement System ECT Engineering Consultancy amp Testing business operated by HORIBA MIRA WLTP RDE See details on Slide 17
(Billions of yen)
Graph1
売上高
営業利益
690
542
72
371
18
357
16
386
28
432
44
495
42
55
58
642
44
654
52
622
35
69
52
Sheet1
Sheet1
売上高
REF
REF
Sheet2
Sheet3
copy 2017 HORIBA Ltd All rights reserved 16
95 110 128 133 108 152
81 116
145 162
197
132
180
2011 2012 2013 2014 2015 2016 2017
BacklogSales
Auto Strategy for improving profitability
[Problem] Long waiting in the design process
[Solution] Reduce design work by standardizing specs
0
10
20
30
40
50
60
70
Aug2015 Feb2016 Aug2016
(days)
60 days in Aug 2015
11days in Aug 2016
Shorten the lead time in the specification-design stage
Lead time from specification adoption to design completion
Significant recovery is expected in 2017 Pick up in automakersrsquo investments Improve order booking by expanding turn-
key projects (in Japan EU the US) Focus on improving profitability Tighter management of project progress
Inquiry
Determ
ine S
pecification
Design
Procure
Product
Installment
Test
Inspection
Collection
Aim at cutting the lead time to one-third
- HORIBA BIWAKO E-HARBOR - MCT
MCT business improves profitability
MCT Sales and Order Backlog (Billions of yen)
(Forecast)
Case of the MEXA series middle-sized EMS product
The lead time was shortened to 15
(Restated)
copy 2017 HORIBA Ltd All rights reserved 17
EMS Sales and Order Backlog (Billions of yen)
137 169 179 202 269 294
265 286 333
374 398 401 420
0
15
30
45
2011 2012 2013 2014 2015 2016 2017
Backlog Sales
Open November 2016
Location Pune western India (Center of Auto Business)
Function Indoor Automotive test Product
customizationTraining
Objective Strengthen demonstration
test and application
development
Regulatory trend in EMS (Emission Measurement System) and Operations in an emerging Market Auto
Regulatory trend Solid sales in Japan (automakers parts makers) Steady investment in Japan WLTP(unified emission regulations by the UN) Start in Sep 2017 in EU and in 2018 in Japan RDE (Real Driving Emission on-road test) regulation Start in Sep 2017 in EU WLTPhellipWorldwide harmonized Light vehicles Test Procedure
HORIBA India Technical Center Establishment
Overview HORIBA India Technical center
(Forecast) (Restated)
Open July 2017 (Plan)
Location Nuneaton Warwickshire UK
Function Cutting-edge Emission Testing Lab (applied
for RDE regulation)
Objective Strengthen
demonstration test
HORIBA MIRA AETC Establishment
(Advanced Emission Test Centre AETC)
Inside of AETC
copy 2017 HORIBA Ltd All rights reserved 18
Auto ECT (HORIBA MIRA) Business
Sale decline caused by weaker GBP vs the JPY Investments of 30bn yen planned each in 2016
and 2017 while closely monitoring the Brexit impacts
Increased inquiries to MIRA Technology Park Accelerated global business (JapanAsia)
ECT Business (EngineeringHORIBA MIRA)
G7 transport ministersrsquo summit (held in Karuizawa Japan in Sep 2016)
Participation in the UK government autonomous driving car project
httpwwwukautodrivecomthe-uk-autodrive-project
George Gillespie CEO of HORIBA MIRA participated as a representative of UK
Main theme Autonomous driving 1 Development and dissemination of cutting-edge
technology regarding automobiles and roads 2 Basic policy for transportation infrastructure
Participated in Jaguar Land Roverrsquos testing contributed to the demonstration test of autonomous driving technology
Major participants Germany BMW France Renault Japan Toyota UK HORIBA MIRA
42 35
45
72 70
02468
2015 2016 2017
Backlog Sales
(Half-year Restated) (Forecast)
JPYGBP 185 yen 147 yen 140 yen
ECT Sales and Backlog (Billions of Yen)
copy 2017 HORIBA Ltd All rights reserved 19
bull Steady sales of stack gas analyzers in Japan
bull Robust process analytical measurement business (US)
bull Weak sales in EU and Asia
bull Expect steady sales to continue in Japan
bull Profitability improvement in gas measurement business
in HORIBA BIWAKO E-HARBOR
bull Increase RampD expenditure for water business
Automatic on-line analysis of PM components Integrate HORIBArsquos technology in and times Identify sources of origin of microparticles Enable 24-hour consecutive analysis of elements
Project to improve water quality of wastewater from dyeing factories Installing wastewater treatment systems and
water quality monitors in Myanmar Joint project with Hitachi Zosen Corporation
Ministry of Environment (MOE) plans to adopt HORIBArsquos products Scheduled to install devices at 4 sites in Japan
in Apr 2017
Designated one of the ldquoModel businesses to improve water environment in Asiardquo by MOE Started experimentation in Jan 2017
Demo facility installed in HORIBA BIWAKO E-HARBOR
PampE SCI
Facilities installed in Wundwin city Myanmar
Water quality analyzer
PM25 analyzer
copy 2017 HORIBA Ltd All rights reserved 21
Firm sales of CBC+CRP analyzers in Japan
Sales decrease in yen due to the yen appreciation
Steady growth in India
Expect firm sales of CBC+CRP analyzers in Japan
bull Accelerated sales expansion by introducing a new
Strategy to expand sales in mediumlarge-sized hematology analyzers Propose total solutions including a data
management system Expand business globally from 2Q of 2017
New brand ldquoYumizenrdquo
Medical Growth with New Brand and Service
Provide maintenance service system using IoT technology
for reducing device downtime
Enhance maintenance support by continuous monitoring amp diagnostic reports
Detect problems in advance and provide appropriate suggestions
Target 6000 contracts by 2020 in Japan Also plan to expand globally
携帯通信網使用
Distributors
Medical Certificate
Call Center
Customer
Through Mobile network
Coordination
Automatic Data Collection Monitoring
Server
Monitoring Machine Condition
Preventive Maintenance
copy 2017 HORIBA Ltd All rights reserved 23
(Billions of yen)
bull Record-high sales and operating profit due to increased investments by semiconductor manufacturers in Asia
bull Sales decrease in yen terms due to the appreciation of the yen
bull Investment to raise Aso factory production capacity Less-certain market outlook for the 2nd half Closely monitor investment trend in China
2016 Results Topics regarding the semiconductor industry and mass flow controller market Data centersrsquo shift to memory for storage Sharp increase in demand for
semiconductors Changes in manufacturing technology
Miniaturization 3D-NAND double-patterning rarr Increase in demand for etching devices Disciplined investment by semiconductor
manufacturers The silicon cycle to fluctuate less widely The market to stabilize
Cutting-edge technology of HORIBA and HORIBA Jobin Yvon Close relationship with academia
MESA-50T SEM-CL
For a rare metal manufacturer
Software development for rare metal analysis
Customized chamber
Specialized in defect
characterization Applied Topcon technology
Collaboration with Raman Testing for protein and
drugs
INV-XploRA
Cutting-edge material development
High concentration cell Minute amount
measurement
New market creation and product development to meet customerrsquos needs
LA-960
Imaging CL device (released in Aug 2016) Convert defective images into high-accuracy images Characteristic distribution analysis of phosphor parts of LED
elements Accelerate RampD for the next-generation power devices
HORIBA HORIBA Jobin Yvon
Electron beam technology of Topcon
New product by integrating HORIBA Grouprsquos technologies
Materials for semiconductors Life science sector
Imaging Cathodoluminescence (CL)
Scientific
copy 2017 HORIBA Ltd All rights reserved 27
Contents
2016 Results
2017 Forecast
Business Segment Outline
Shareholder Return
MLMAP2020 [2016-2020] Progress Financial Data Corporate profile
copy 2017 HORIBA Ltd All rights reserved 28
2015 Results 70 yen per share + 2016 Results 85 yen per share 2017 Forecast 90 yen per share
- Dividend payment + Share buyback = 30 of Consolidated net profit to be targeted - Remaining earnings are retained internally for strategic investment (ie facilities MampA)
(Yen) Per-share dividend (from 2002 to 2017 Forecast)
Basic policy (since 2013)
Dividends and Share buybacks
(fore)
2015 Share buyback 218400 shares
about 10 billion yen
Record high for 7 years in a row
An Average total return ratio of last 3years 292
copy 2017 HORIBA Ltd All rights reserved 29
Contents
2016 Results
2017 Forecast
Business Segment Outline
Shareholder Return
MLMAP2020 [2016-2020] Progress Financial Data Corporate profile
HORIBA Stained Glass Project Lunch gatherings of working mothers Seminars on how to balance long-term care and work Workshop to improve work productivity
Selected as one of New Diversity Management Selection 100 (by the Ministry of Economy Trade and Industry of Japan)
Reasons for the award Corporate motto ldquoJoy and Funrdquo and the Stained Glass Project
Mr Saito executive vice president and Ms Moriguchi leader of Stained Glass Project at the award-receiving ceremony
copy 2017 HORIBA Ltd All rights reserved 37
Decided to introduce a new KPI to measure asset efficiency Indicator composed of ldquoOperating profitrdquo and ldquoWACCrdquo Applying unit Business segments and Group companies Strengthen PDCA cycle Efficient use of business assets and increase profit
Plan to prepare a budget to this project in 2018
Founded financial subsidiaries in the US and the UK Improve capital efficiency through group financing Strengthen financial management function in each region
Enhance asset efficiency and maximize corporate value
Improve asset efficiency amp
Accelerate business growth
Investment
Business Growth
Cash Generation
copy 2017 HORIBA Ltd All rights reserved 38
Symbol of MLMAP2020
Step out of the existing business fields and pursue further expansion Take a new perspective and overcome technologicalmarketorganization barriers
Be flexible think outside the box and move up to the next stage
ONE STEP AHEAD - To create a next stage of HORIBA -
copy 2017 HORIBA Ltd All rights reserved 39
Contents
2016 Results
2017 Forecast
Business Segment Outline
Shareholder Return
MLMAP2020 [2016-2020] Progress Financial Data Corporate profile
PPampE Investment to MIRA(30BJYP) Depreciation Goodwill of MIRA(04BJYP) Biwako factory (07BJYP) RampD Increased in Automotive Test System Business
Good will of MIRA eg hellip Amortization included
2017 Topics
PPampE Investment to MIRA(30BJYP) Expansion of Aso Factory(27BJYP)
Depreciation Goodwill of MIRA(04BJYP) Increase in MIRA and Test center invested in 2016 RampD Increase in Auto and PampE Business
Capital Investment Depreciation RampD (Billions of yen)
全社実績
セグ実績
全社予算
全社予算2案
セグ予算
セグ予算2案
受注_残
半期予想
設備投資
HOR単体実績
HOR単体予算
HOR単体上期予算
copy 2017 HORIBA Ltd All rights reserved 45
241 Bond
redemption in 2020
Current ratio
280
2014 254 60
Short 66
Cash1
492
Bonds 150
Long 25
Cash1
478
Bonds 150
Long 22 Short 108
2013 269 60
447
Cash1
511
Bonds 150
Long 168
Short 128
2015 229 55
Borrowed from JBIC2
151bn yen (2015)
Capital ratio
467
2016 237 55
Cash1
519
Bonds 150
Long 192
Short 124
Cash Balance (Billions of yen)
(Consolidated basis each end of the year) Total Loan Balance
Conclusion of liquidation of receivable contract with 2 banks Recent issuer rating RampI [A-] (July 2016) JCR [A] (August 2016)
1 CashhellipCash and Cash Equivalents at End of Period 2 JBIC Japan Bank for International Cooperation
Graph1
Sheet1
Sheet1
現預金
短期
長期
社債
Sheet1 (2)
tajikaABX =gtHIL
tajikaSTEC=gtHOR
copy 2017 HORIBA Ltd All rights reserved 46
Contents
2016 Results
2017 Forecast
Business Segment Outline
Shareholder Return
MLMAP2020 [2016-2020]Progress Financial Data Corporate profile
copy 2017 HORIBA Ltd All rights reserved 47
Head office Kyoto Japan Founded 1945 Incorporated 1953 CEO Atsushi Horiba Fiscal year end December 31
Atsushi Horiba Chairman President amp CEO
- Corporate motto -
To have interest and pride in our work to enjoy our lives
Corporate Profile
copy 2017 HORIBA Ltd All rights reserved 48
Medical In-Vitro Diagnostic (IVD) Systems Integration of HORIBA ABXrsquos Technology amp Marketing Know-How
Automotive Test Systems Emission Measurement Systems (EMS) Mechatronics Devices (MCT) Driving Control Systems (ITS) Engineering Consultancy amp Testing (ECT)
Business Segments
Process amp Environmental Environmental Systems Environmental Radiation Monitor Environmental Regulation amp Process Business
Semiconductor Mass Flow Controller In-situ Analysis Synergy among HORIBA HQ HORIBA STEC and HORIBA Jobin Yvonrsquos Technologies
Scientific Synergy of HORIBA and HORIBA Jobin Yvonrsquos Technologies Raman Grating and Fluorescence
copy 2017 HORIBA Ltd All rights reserved 49
Sales 1700 Billions of Yen
Business Composition of Sales
Automotive Test Systems
Process amp Environmental
Medical
Semiconductor
Scientific
Automotive 622 (36)
Scientific 257 (15)
Semiconductor 388 (23)
Medical 265 (16)
PampE 167 (10)
Well Balanced Business Operation -Five Business Segments-
(Billions of Yen)
copy 2017 HORIBA Ltd All rights reserved 50
Market Shares
Market shares quoted are estimates by HORIBA
80 20 100
35
Emission Measurement Systems
57 30
Stack Gas Analyzers Automatic Blood Cell Counter plus CRP
Mass Flow Controllers Raman Spectrophotometers Gratings
Global Domestic
copy 2017 HORIBA Ltd All rights reserved 51
EU Japan
Asia Americas
33
26 18
23
Geographic Composition of Sales(2016)
HORIBA Worldwide
Sales of FY2016 1700 BJPY
The Number of Group Companies by region (As of December 31 2016)
America 9 Europe 23 Asia 17 (4 in Japan including HORIBA Ltd) Total 49
copy 2017 HORIBA Ltd All rights reserved 52
Japan 38
Other Asia 15
France 13
Germany 8
Other Europe 2 USA
10
Other Americas 3
7149
従業員数 2015年12月31日現在
2442
946
3761
UK 11
Employees by Region
Total Number of Employees (As of December 31 2016)
Total Asia 53
Total Europe 34
Total Americas 13
copy 2017 HORIBA Ltd All rights reserved 53 copy 2017 HORIBA Ltd All rights reserved 53
copy 2017 HORIBA Ltd All rights reserved 54
Danke
Grazie
Σας ευχαριστούμε
감사합니다
Obrigado
谢谢
ขอบคณครบ
ありがとうございました
धनयवाद
நனற
Cảm ơn
Dziękuję
Tack ska ni ha
Thank you
Merci
Gracias
Большое спасибо
スライド番号 1
Contents
Contents
スライド番号 4
Summary of 2016 Results
2016 full year results
2016 Results by Segment
Contents
2017 Market outlook
Exchange rate forecast for 2017
Forecast for 2017
Forecast for 2017 by segment
Contents
スライド番号 14
2016 Results and 2017 Forecast
Strategy for improving profitability
Regulatory trend in EMS (Emission Measurement System) and Operations in an emerging Market
ECT (HORIBA MIRA) Business
2016 Results and 2017 Forecast
Analysis technology for the environment
2016 Results and 2017 Forecast
Growth with New Brand and Service
2016 Results and 2017 Forecast
スライド番号 24
2016 Results and 2017 Forecast
Exploit new markets using HORIBA technology
Contents
Shareholder Return
Contents
スライド番号 30
スライド番号 31
スライド番号 32
Accelerate growth in water measuring business
Water measuring and analysisbusiness domain
Water measuring and analysisbusiness domain
Selected as one of New Diversity Management Selection 100 (by the Ministry of Economy Trade and Industry of Japan)
Enhance asset efficiency and maximize corporate value
Symbol of MLMAP2020
Contents
Trend of Market capitalization
Changed the accounting policy for revenue recognition
スライド番号 42
スライド番号 43
スライド番号 44
スライド番号 45
Contents
スライド番号 47
Business Segments
スライド番号 49
Market Shares
スライド番号 51
スライド番号 52
スライド番号 53
スライド番号 54
勘定科目
BS_CL12010
BS_CL12020
BS_CL12030
BS_FL21000
BS_FL23000
勘定科目名称
当座借越
短期借入金
1年内返済長期借入金
社債
長期借入金
HOR
0
(2000000000)
0
(10000000000)
0
日本 ニホン
ABX
(827350776)
(4016672108)
(534035942)
0
(1343663409)
欧州 オウシュウ
ASEC
0
(352000000)
0
0
(180000000)
日本 ニホン
HE
0
(1855530779)
0
0
0
欧州 オウシュウ
HIC
0
(1156081000)
(109236000)
0
(682725000)
米州 ベイシュウ
HIT
(99662290)
0
(200000000)
0
(300000000)
日本 ニホン
HSC
0
(20019305)
0
0
0
アジア
HST
0
(166375000)
0
0
0
アジア
JY
0
0
(9753688)
0
(105723687)
欧州 オウシュウ
会社間照合
0
(5047)
欧州 オウシュウ
会社間照合
200000000
日本 ニホン
会社間照合
480000000
日本 ニホン
会社間照合
2000000000
日本 ニホン
会社間照合
118647000
欧州 オウシュウ
会社間照合
175953553
欧州 オウシュウ
連結合計
(927013066)
(7272082686)
(653025630)
(10000000000)
(2132112096)
(99662290)
(352000000)
0
(10000000000)
0
日本 ニホン
(827350776)
(5577607381)
(543789630)
0
(1449387096)
欧州 オウシュウ
0
(1156081000)
(109236000)
0
(682725000)
米州 ベイシュウ
0
(186394305)
0
0
0
アジア
(927013066)
(7272082686)
(653025630)
(10000000000)
(2132112096)
2008
2009
2010
2011
2012
2013
2008
2008
2009
2009
2013
2013
2014
2014
2015
2015
2016
2016
短期借入金 タンキカリイレキン
8852
6618
5575
6684
5523
6606
現預金 ゲンヨキン
18267
21520
49246
51109
47859
51900
長期借入金 チョウキカリイレキン
2132
1730
1195
1291
2113
2576
短期 タンキ
8852
6618
6606
10832
12800
12400
社債 シャサイ
10000
10000
10000
10000
10000
15000
長期 チョウキ
2132
1730
2576
2209
16800
19200
現預金 ゲンヨキン
18267
21520
26958
28893
34685
42228
社債 シャサイ
10000
10000
15000
15000
15000
15000
流動比率 リュウドウヒリツ
2296
2524
2653
2806
2970
2690
自己資本比率 ジコシホンヒリツ
576
609
612
624
650
600
49246
6606
2576
15000
51109
10832
2209
15000
47859
12800
16800
15000
51900
12400
19200
15000
2013年実績 ネン ジッセキ
2014年実績 ネン ジッセキ
2015年計画 ネン ケイカク
増減
計画(GBM) ケイカク
発表案 ハッピョウ アン
vs 2014
売上高 ウリアゲ タカ
営業利益 エイギョウ リエキ
経常利益 ケイジョウ リエキ
当期純利益 トウキ ジュンリエキ
2013年 ネン
2014年 ネン
2015年 ネン
増減
実績
実績
計画(GBM) ケイカク
決定 ケッテイ
vs 2014
売上高 ウリアゲ タカ
営業利益 エイギョウ リエキ
経常利益 ケイジョウ リエキ
当期純利益 トウキ ジュンリエキ
営業利益率 エイギョウ リエキ リツ
2013実績 ジッセキ
2014年 ネン
増減
開示116 カイジ
実績 ジッセキ
vs 2013
売上高 ウリアゲ タカ
営業利益 エイギョウ リエキ
経常利益 ケイジョウ リエキ
当期純利益 トウキ ジュンリエキ
2015
2016
2017
Results
Forecast117
Results
vs 2015
vs Forecast117
Forecast
vs 2016
PPampE
148
153
134
-10
-12
146
+9
Intangibles
14
07
03
-75
-49
04
+11
Capital Investment
163
160
137
-15
-14
150
+9
Depreciation
61
65
68
+12
+5
72
+6
RampD
123
130
129
+5
-1
140
+8
(To net sales)
(7)
(8)
(8)
(8)
2014年 ネン
2015年 ネン
実績 ジッセキ
社内数値 シャナイ スウチ
発表案 ハッピョウ アン
上期 カミ キ
下期 シモキ
通期 ツウキ
上期 カミキ
下期 シモキ
通期 ツウキ
上期 カミ キ
下期 シモキ
通期 ツウキ
売上高 ウリアゲ ダカ
0
0
0
0
0
自動車 ジドウシャ
0
0
0
環境 カンキョウ
0
0
0
医用 イヨウ
0
0
0
半導体 ハンドウタイ
0
0
0
科学 カガク
0
0
0
営業利益 エイギョウ リエキ
0
0
0
0
0
自動車 ジドウシャ
0
0
0
環境 カンキョウ
0
0
0
医用 イヨウ
0
0
0
半導体 ハンドウタイ
0
0
0
科学 カガク
0
0
0
経常利益 ケイジョウ リエキ
0
0
当期純利益 トウキ ジュンリエキ
0
0
営業利益率 エイギョウ リエキ リツ
ERRORDIV0
ERRORDIV0
ERRORDIV0
ERRORDIV0
ERRORDIV0
ERRORDIV0
ERRORDIV0
ERRORDIV0
ERRORDIV0
自動車 ジドウシャ
ERRORDIV0
ERRORDIV0
ERRORDIV0
ERRORDIV0
ERRORDIV0
ERRORDIV0
ERRORDIV0
ERRORDIV0
ERRORDIV0
環境 カンキョウ
ERRORDIV0
ERRORDIV0
ERRORDIV0
ERRORDIV0
ERRORDIV0
ERRORDIV0
ERRORDIV0
ERRORDIV0
ERRORDIV0
医用 イヨウ
ERRORDIV0
ERRORDIV0
ERRORDIV0
ERRORDIV0
ERRORDIV0
ERRORDIV0
ERRORDIV0
ERRORDIV0
ERRORDIV0
半導体 ハンドウタイ
ERRORDIV0
ERRORDIV0
ERRORDIV0
ERRORDIV0
ERRORDIV0
ERRORDIV0
ERRORDIV0
ERRORDIV0
ERRORDIV0
科学 カガク
ERRORDIV0
ERRORDIV0
ERRORDIV0
ERRORDIV0
ERRORDIV0
ERRORDIV0
ERRORDIV0
ERRORDIV0
ERRORDIV0
受注実績 ジュチュウ ジッセキ
2013
2014
1Q
2Q
3Q
4Q
1Q
2Q
3Q
4Q
自動車
128
125
103
166
環境
39
38
41
40
医用
67
64
60
71
半導体
46
51
69
88
科学
53
61
61
77
合計
334
341
337
444
受注残 ジュチュウ ザン
2013
2014
1Q
2Q
3Q
4Q
1Q
2Q
3Q
4Q
自動車
314
335
325
314
環境
33
39
45
38
医用
30
27
24
23
半導体
20
15
25
31
科学
55
67
76
76
合計
454
486
497
484
受注実績 ジュチュウ ジッセキ
2013
2014
1Q
2Q
3Q
4Q
1Q
2Q
3Q
4Q
自動車
128
125
103
166
EMS
93
91
78
110
MCT
32
30
24
48
HIT
4
4
2
9
受注残 ジュチュウ ザン
2013
2014
推移 スイイ
1Q
2Q
3Q
4Q
1Q
2Q
3Q
4Q
自動車
314
335
325
314
EMS
173
188
195
177
MCT
135
142
125
128
HIT
5
5
4
7
売上高 ウリアゲ ダカ
営業利益 エイギョウ リエキ
2014
2015 計画 ケイカク
2014
2015 計画 ケイカク
実績 ジッセキ
社内数値 シャナイ スウチ
発表案① ハッピョウ アン
発表案② ハッピョウ アン
MLMAP2015年数値 ネン スウチ
実績 ジッセキ
社内数値 シャナイ スウチ
発表案① ハッピョウ アン
発表案② ハッピョウ アン
MLMAP2015年数値 ネン スウチ
vs 2014
vs 2014
対外発表 タイガイ ハッピョウ
社内数値 シャナイ スウチ
vs 2014
vs 2014
対外発表 タイガイ ハッピョウ
社内数値 シャナイ スウチ
自動車 ジドウシャ
環境 カンキョウ
医用 イヨウ
半導体 ハンドウタイ
科学 カガク
合計 ゴウケイ
営業利益 エイギョウ リエキ
2014
2015 計画 ケイカク
実績 ジッセキ
社内数値 シャナイ スウチ
発表案① ハッピョウ アン
発表案② ハッピョウ アン
MLMAP2015年数値 ネン スウチ
vs 2014
vs 2014
対外発表 タイガイ ハッピョウ
社内数値 シャナイ スウチ
自動車 ジドウシャ
環境 カンキョウ
医用 イヨウ
半導体 ハンドウタイ
科学 カガク
合計 ゴウケイ
売上高 ウリアゲ ダカ
営業利益 エイギョウ リエキ
2014
2015
2014
2015
実績 ジッセキ
社内数値 シャナイ スウチ
発表案 ハッピョウ アン
vs2014
実績 ジッセキ
社内数値 シャナイ スウチ
発表案 ハッピョウ アン
vs2014
自動車 ジドウシャ
環境 カンキョウ
医用 イヨウ
半導体 ハンドウタイ
科学 カガク
合計 ゴウケイ
2014
2015年計画 ネン ケイカク
実績 ジッセキ
社内数値 シャナイ スウチ
開示案① カイジ アン ハツアン
開示案② カイジ アン ハツアン
MLMAP2015年数値 ネン スウチ
市場 シジョウ
vs 2014
vs 2014
対外発表 タイガイ ハッピョウ
社内数値 シャナイ スウチ
8社平均 シャ ヘイキン
売上高 ウリアゲ タカ
営業利益 エイギョウ リエキ
経常利益 ケイジョウ リエキ
当期純利益 トウキ ジュンリエキ
営業利益率 エイギョウ リエキ リツ
ドル
ユーロ
配当(円1株) ハイトウ エン カブ
2014
2015
MLMAP2015年数値 ネン スウチ
市場 シジョウ
実績 ジッセキ
社内数値 シャナイ スウチ
発表案 ハッピョウ アン
vs2014
対外発表 タイガイ ハッピョウ
社内数値 シャナイ スウチ
8社平均 シャ ヘイキン
売上高 ウリアゲ タカ
営業利益 エイギョウ リエキ
経常利益 ケイジョウ リエキ
当期純利益 トウキ ジュンリエキ
営業利益率 エイギョウ リエキ リツ
ドル
ユーロ
配当(円1株) ハイトウ エン カブ
売上高 ウリアゲ ダカ
営業利益 エイギョウ リエキ
2013年 ネン
2014年 ネン
2013年 ネン
2014年 ネン
実績 ジッセキ
開示116 カイジ
実績 ジッセキ
増減vsv2013 ゾウゲン
実績 ジッセキ
開示116 カイジ
実績 ジッセキ
増減vsv2013 ゾウゲン
自動車 ジドウシャ
環境 カンキョウ
医用 イヨウ
半導体 ハンドウタイ
科学 カガク
合計 ゴウケイ
2013年 ネン
2014年 ネン
増減比較 ゾウゲン ヒカク
市場 シジョウ
実績 ジッセキ
開示(116) カイジ
実績(監査前) ジッセキ カンサ マエ
vs 13年 ネン
vs 開示 カイジ
8社平均 シャ ヘイキン
売上高 ウリアゲ タカ
営業利益 エイギョウ リエキ
経常利益 ケイジョウ リエキ
当期純利益 トウキ ジュンリエキ
営業利益率 エイギョウ リエキ リツ
配当 ハイトウ
配当性向 ハイトウ セイコウ
為替レート(累計)
ドル
ユーロ
2015
2016
Variation
Cash flows from operating activities
14770
15871
1101
Cash flows from investing activities
-30642
-10427
20214
Cash flows from financing activities
12843
-451
-13294
Cash and cash equivalents at end of year
47859
51940
4081
Free cash flows
-15872
5443
21315
Changed points
Original
Shipment base
New
The date of delivery or installation based on contractual arrangements
Applied timing
January 2016
Reason for change
Triggered by the introduction of a new ERP implementation to harmonize with international accounting standards
2015 results are restated numbers The same shall apply hereinafter
(Billions of yen)
Sheet1 (2)
全社2014実績
セグ別2014実績
全社2015予想
セグ別2015予想
copy 2017 HORIBA Ltd All rights reserved 8
Contents
2016 Results
2017 Forecast
Business Segment Outline
Shareholder Return
MLMAP2020 [2016-2020] Progress Financial Data Corporate profile
copy 2017 HORIBA Ltd All rights reserved 9
Scientific
Auto
Semi
PampE
Medical
Expect steady RampD investments by automakers Closely monitor emission regulations in EU and Japan
Expect continuous investment by semiconductor manufacturers in the first half uncertainties over outlook in demand by semiconductor production equipment in the second half
Closely monitor sales trend of small-sized products in Japan Changes in medical care system in US
2017 Market outlook
Expect firm demand for stack gas analyzers and water measurement equipment in Asian countries
Japan Expect an increase in the private sector capital spending Overseas Closely monitor government budgets and spending in EU
copy 2017 HORIBA Ltd All rights reserved 10
Exchange rate forecast for 2017
2015 2016
Results Results Forecastas of Feb 14
Forecastas of May 12
vs 2016
USD 12110 10878 110 110 +122
EUR 13431 12026 120 120 -026
2017
(Yen)
1 yen OP sensitivity for 2017 Forecast as of May 12 USD 160 million yen EUR 23 million yen
Sheet1 (2)
全社2014実績
セグ別2014実績
全社2015予想
Sheet4
Sheet5
Sheet6
copy 2017 HORIBA Ltd All rights reserved 11
2015 2016Results
(New policy)Results Forecast
as of Feb 14Forecast
as of May 12vs 2016
Sales 1719 1700 1770 1830 +76
Operating profit 201 184 200 210 +135
OP 117 109 113 115 +06p
Ordinary proft 196 182 193 203 +111Net income attribute to
Owners of Parent 132 129 130 136 +49Net profit
per share(Yen) 315 308 309 323 +48
ROE 107 100 95 99 -01p
2017
Forecast for 2017
Record-high
2015 results are restated numbers The same shall apply hereinafter
(Billions of yen)
Sheet1 (2)
全社2014実績
セグ別2014実績
全社2015予想
Sheet4
Sheet5
Sheet6
copy 2017 HORIBA Ltd All rights reserved 12
(Billions of yen) Forecast for 2017 by segment
2016 2016
Results Forecastas of Feb 14
Forecastas of May 12
vs 2016 Results Forecastas of Feb 14
Forecastas of May 12
vs 2016
Auto 622 670 690 +109 35 52 52 +473
PampE 167 180 180 +74 15 16 11 -286
Medical 265 250 250 -59 28 22 22 -216
Semi 388 410 460 +185 96 100 120 +240
Scientific 257 260 250 -29 09 10 05 -471
Total 1700 1770 1830 +76 184 200 210 +135
Sales OP2017 2017
Record- high
Sheet1 (2)
全社2014実績
セグ別2014実績
全社2015予想
セグ別2015予想
copy 2017 HORIBA Ltd All rights reserved 13
Contents
2016 Results
2017 Forecast
Business Segment Outline
Shareholder Return
MLMAP2020 [2016-2020] Progress Financial Data Corporate profile
copy 2017 HORIBA Ltd All rights reserved 14
Next Slide
copy 2017 HORIBA Ltd All rights reserved 15
Topics of Automotive Industries in 2016 The autonomous-driving car age begins
Use of artificial intelligence (AI) Accelerated EV development
RampD shift to electrification Exhaust gas and fuel economy test scandals at
VW and in Japan More strict regulations in EMS (WLTP RDE)
For indoor tests and on-road tests Brexit
2016 Results and 2017 Forecast
EMS Steady sales in Japan increase in OBS
MCT Temporary decline in demand
ECT Full-year incremental sales goodwill of 04bn yen
EMS Steady sales in Japan and Asia MCT Significant recovery improved profitability ECT Many inquiries weak GBP to depress amounts in yen
EMS Emission Measurement Systems OBS On-Board Exhaust Emission Measurement System ECT Engineering Consultancy amp Testing business operated by HORIBA MIRA WLTP RDE See details on Slide 17
(Billions of yen)
Graph1
売上高
営業利益
690
542
72
371
18
357
16
386
28
432
44
495
42
55
58
642
44
654
52
622
35
69
52
Sheet1
Sheet1
売上高
REF
REF
Sheet2
Sheet3
copy 2017 HORIBA Ltd All rights reserved 16
95 110 128 133 108 152
81 116
145 162
197
132
180
2011 2012 2013 2014 2015 2016 2017
BacklogSales
Auto Strategy for improving profitability
[Problem] Long waiting in the design process
[Solution] Reduce design work by standardizing specs
0
10
20
30
40
50
60
70
Aug2015 Feb2016 Aug2016
(days)
60 days in Aug 2015
11days in Aug 2016
Shorten the lead time in the specification-design stage
Lead time from specification adoption to design completion
Significant recovery is expected in 2017 Pick up in automakersrsquo investments Improve order booking by expanding turn-
key projects (in Japan EU the US) Focus on improving profitability Tighter management of project progress
Inquiry
Determ
ine S
pecification
Design
Procure
Product
Installment
Test
Inspection
Collection
Aim at cutting the lead time to one-third
- HORIBA BIWAKO E-HARBOR - MCT
MCT business improves profitability
MCT Sales and Order Backlog (Billions of yen)
(Forecast)
Case of the MEXA series middle-sized EMS product
The lead time was shortened to 15
(Restated)
copy 2017 HORIBA Ltd All rights reserved 17
EMS Sales and Order Backlog (Billions of yen)
137 169 179 202 269 294
265 286 333
374 398 401 420
0
15
30
45
2011 2012 2013 2014 2015 2016 2017
Backlog Sales
Open November 2016
Location Pune western India (Center of Auto Business)
Function Indoor Automotive test Product
customizationTraining
Objective Strengthen demonstration
test and application
development
Regulatory trend in EMS (Emission Measurement System) and Operations in an emerging Market Auto
Regulatory trend Solid sales in Japan (automakers parts makers) Steady investment in Japan WLTP(unified emission regulations by the UN) Start in Sep 2017 in EU and in 2018 in Japan RDE (Real Driving Emission on-road test) regulation Start in Sep 2017 in EU WLTPhellipWorldwide harmonized Light vehicles Test Procedure
HORIBA India Technical Center Establishment
Overview HORIBA India Technical center
(Forecast) (Restated)
Open July 2017 (Plan)
Location Nuneaton Warwickshire UK
Function Cutting-edge Emission Testing Lab (applied
for RDE regulation)
Objective Strengthen
demonstration test
HORIBA MIRA AETC Establishment
(Advanced Emission Test Centre AETC)
Inside of AETC
copy 2017 HORIBA Ltd All rights reserved 18
Auto ECT (HORIBA MIRA) Business
Sale decline caused by weaker GBP vs the JPY Investments of 30bn yen planned each in 2016
and 2017 while closely monitoring the Brexit impacts
Increased inquiries to MIRA Technology Park Accelerated global business (JapanAsia)
ECT Business (EngineeringHORIBA MIRA)
G7 transport ministersrsquo summit (held in Karuizawa Japan in Sep 2016)
Participation in the UK government autonomous driving car project
httpwwwukautodrivecomthe-uk-autodrive-project
George Gillespie CEO of HORIBA MIRA participated as a representative of UK
Main theme Autonomous driving 1 Development and dissemination of cutting-edge
technology regarding automobiles and roads 2 Basic policy for transportation infrastructure
Participated in Jaguar Land Roverrsquos testing contributed to the demonstration test of autonomous driving technology
Major participants Germany BMW France Renault Japan Toyota UK HORIBA MIRA
42 35
45
72 70
02468
2015 2016 2017
Backlog Sales
(Half-year Restated) (Forecast)
JPYGBP 185 yen 147 yen 140 yen
ECT Sales and Backlog (Billions of Yen)
copy 2017 HORIBA Ltd All rights reserved 19
bull Steady sales of stack gas analyzers in Japan
bull Robust process analytical measurement business (US)
bull Weak sales in EU and Asia
bull Expect steady sales to continue in Japan
bull Profitability improvement in gas measurement business
in HORIBA BIWAKO E-HARBOR
bull Increase RampD expenditure for water business
Automatic on-line analysis of PM components Integrate HORIBArsquos technology in and times Identify sources of origin of microparticles Enable 24-hour consecutive analysis of elements
Project to improve water quality of wastewater from dyeing factories Installing wastewater treatment systems and
water quality monitors in Myanmar Joint project with Hitachi Zosen Corporation
Ministry of Environment (MOE) plans to adopt HORIBArsquos products Scheduled to install devices at 4 sites in Japan
in Apr 2017
Designated one of the ldquoModel businesses to improve water environment in Asiardquo by MOE Started experimentation in Jan 2017
Demo facility installed in HORIBA BIWAKO E-HARBOR
PampE SCI
Facilities installed in Wundwin city Myanmar
Water quality analyzer
PM25 analyzer
copy 2017 HORIBA Ltd All rights reserved 21
Firm sales of CBC+CRP analyzers in Japan
Sales decrease in yen due to the yen appreciation
Steady growth in India
Expect firm sales of CBC+CRP analyzers in Japan
bull Accelerated sales expansion by introducing a new
Strategy to expand sales in mediumlarge-sized hematology analyzers Propose total solutions including a data
management system Expand business globally from 2Q of 2017
New brand ldquoYumizenrdquo
Medical Growth with New Brand and Service
Provide maintenance service system using IoT technology
for reducing device downtime
Enhance maintenance support by continuous monitoring amp diagnostic reports
Detect problems in advance and provide appropriate suggestions
Target 6000 contracts by 2020 in Japan Also plan to expand globally
携帯通信網使用
Distributors
Medical Certificate
Call Center
Customer
Through Mobile network
Coordination
Automatic Data Collection Monitoring
Server
Monitoring Machine Condition
Preventive Maintenance
copy 2017 HORIBA Ltd All rights reserved 23
(Billions of yen)
bull Record-high sales and operating profit due to increased investments by semiconductor manufacturers in Asia
bull Sales decrease in yen terms due to the appreciation of the yen
bull Investment to raise Aso factory production capacity Less-certain market outlook for the 2nd half Closely monitor investment trend in China
2016 Results Topics regarding the semiconductor industry and mass flow controller market Data centersrsquo shift to memory for storage Sharp increase in demand for
semiconductors Changes in manufacturing technology
Miniaturization 3D-NAND double-patterning rarr Increase in demand for etching devices Disciplined investment by semiconductor
manufacturers The silicon cycle to fluctuate less widely The market to stabilize
Cutting-edge technology of HORIBA and HORIBA Jobin Yvon Close relationship with academia
MESA-50T SEM-CL
For a rare metal manufacturer
Software development for rare metal analysis
Customized chamber
Specialized in defect
characterization Applied Topcon technology
Collaboration with Raman Testing for protein and
drugs
INV-XploRA
Cutting-edge material development
High concentration cell Minute amount
measurement
New market creation and product development to meet customerrsquos needs
LA-960
Imaging CL device (released in Aug 2016) Convert defective images into high-accuracy images Characteristic distribution analysis of phosphor parts of LED
elements Accelerate RampD for the next-generation power devices
HORIBA HORIBA Jobin Yvon
Electron beam technology of Topcon
New product by integrating HORIBA Grouprsquos technologies
Materials for semiconductors Life science sector
Imaging Cathodoluminescence (CL)
Scientific
copy 2017 HORIBA Ltd All rights reserved 27
Contents
2016 Results
2017 Forecast
Business Segment Outline
Shareholder Return
MLMAP2020 [2016-2020] Progress Financial Data Corporate profile
copy 2017 HORIBA Ltd All rights reserved 28
2015 Results 70 yen per share + 2016 Results 85 yen per share 2017 Forecast 90 yen per share
- Dividend payment + Share buyback = 30 of Consolidated net profit to be targeted - Remaining earnings are retained internally for strategic investment (ie facilities MampA)
(Yen) Per-share dividend (from 2002 to 2017 Forecast)
Basic policy (since 2013)
Dividends and Share buybacks
(fore)
2015 Share buyback 218400 shares
about 10 billion yen
Record high for 7 years in a row
An Average total return ratio of last 3years 292
copy 2017 HORIBA Ltd All rights reserved 29
Contents
2016 Results
2017 Forecast
Business Segment Outline
Shareholder Return
MLMAP2020 [2016-2020] Progress Financial Data Corporate profile
HORIBA Stained Glass Project Lunch gatherings of working mothers Seminars on how to balance long-term care and work Workshop to improve work productivity
Selected as one of New Diversity Management Selection 100 (by the Ministry of Economy Trade and Industry of Japan)
Reasons for the award Corporate motto ldquoJoy and Funrdquo and the Stained Glass Project
Mr Saito executive vice president and Ms Moriguchi leader of Stained Glass Project at the award-receiving ceremony
copy 2017 HORIBA Ltd All rights reserved 37
Decided to introduce a new KPI to measure asset efficiency Indicator composed of ldquoOperating profitrdquo and ldquoWACCrdquo Applying unit Business segments and Group companies Strengthen PDCA cycle Efficient use of business assets and increase profit
Plan to prepare a budget to this project in 2018
Founded financial subsidiaries in the US and the UK Improve capital efficiency through group financing Strengthen financial management function in each region
Enhance asset efficiency and maximize corporate value
Improve asset efficiency amp
Accelerate business growth
Investment
Business Growth
Cash Generation
copy 2017 HORIBA Ltd All rights reserved 38
Symbol of MLMAP2020
Step out of the existing business fields and pursue further expansion Take a new perspective and overcome technologicalmarketorganization barriers
Be flexible think outside the box and move up to the next stage
ONE STEP AHEAD - To create a next stage of HORIBA -
copy 2017 HORIBA Ltd All rights reserved 39
Contents
2016 Results
2017 Forecast
Business Segment Outline
Shareholder Return
MLMAP2020 [2016-2020] Progress Financial Data Corporate profile
PPampE Investment to MIRA(30BJYP) Depreciation Goodwill of MIRA(04BJYP) Biwako factory (07BJYP) RampD Increased in Automotive Test System Business
Good will of MIRA eg hellip Amortization included
2017 Topics
PPampE Investment to MIRA(30BJYP) Expansion of Aso Factory(27BJYP)
Depreciation Goodwill of MIRA(04BJYP) Increase in MIRA and Test center invested in 2016 RampD Increase in Auto and PampE Business
Capital Investment Depreciation RampD (Billions of yen)
全社実績
セグ実績
全社予算
全社予算2案
セグ予算
セグ予算2案
受注_残
半期予想
設備投資
HOR単体実績
HOR単体予算
HOR単体上期予算
copy 2017 HORIBA Ltd All rights reserved 45
241 Bond
redemption in 2020
Current ratio
280
2014 254 60
Short 66
Cash1
492
Bonds 150
Long 25
Cash1
478
Bonds 150
Long 22 Short 108
2013 269 60
447
Cash1
511
Bonds 150
Long 168
Short 128
2015 229 55
Borrowed from JBIC2
151bn yen (2015)
Capital ratio
467
2016 237 55
Cash1
519
Bonds 150
Long 192
Short 124
Cash Balance (Billions of yen)
(Consolidated basis each end of the year) Total Loan Balance
Conclusion of liquidation of receivable contract with 2 banks Recent issuer rating RampI [A-] (July 2016) JCR [A] (August 2016)
1 CashhellipCash and Cash Equivalents at End of Period 2 JBIC Japan Bank for International Cooperation
Graph1
Sheet1
Sheet1
現預金
短期
長期
社債
Sheet1 (2)
tajikaABX =gtHIL
tajikaSTEC=gtHOR
copy 2017 HORIBA Ltd All rights reserved 46
Contents
2016 Results
2017 Forecast
Business Segment Outline
Shareholder Return
MLMAP2020 [2016-2020]Progress Financial Data Corporate profile
copy 2017 HORIBA Ltd All rights reserved 47
Head office Kyoto Japan Founded 1945 Incorporated 1953 CEO Atsushi Horiba Fiscal year end December 31
Atsushi Horiba Chairman President amp CEO
- Corporate motto -
To have interest and pride in our work to enjoy our lives
Corporate Profile
copy 2017 HORIBA Ltd All rights reserved 48
Medical In-Vitro Diagnostic (IVD) Systems Integration of HORIBA ABXrsquos Technology amp Marketing Know-How
Automotive Test Systems Emission Measurement Systems (EMS) Mechatronics Devices (MCT) Driving Control Systems (ITS) Engineering Consultancy amp Testing (ECT)
Business Segments
Process amp Environmental Environmental Systems Environmental Radiation Monitor Environmental Regulation amp Process Business
Semiconductor Mass Flow Controller In-situ Analysis Synergy among HORIBA HQ HORIBA STEC and HORIBA Jobin Yvonrsquos Technologies
Scientific Synergy of HORIBA and HORIBA Jobin Yvonrsquos Technologies Raman Grating and Fluorescence
copy 2017 HORIBA Ltd All rights reserved 49
Sales 1700 Billions of Yen
Business Composition of Sales
Automotive Test Systems
Process amp Environmental
Medical
Semiconductor
Scientific
Automotive 622 (36)
Scientific 257 (15)
Semiconductor 388 (23)
Medical 265 (16)
PampE 167 (10)
Well Balanced Business Operation -Five Business Segments-
(Billions of Yen)
copy 2017 HORIBA Ltd All rights reserved 50
Market Shares
Market shares quoted are estimates by HORIBA
80 20 100
35
Emission Measurement Systems
57 30
Stack Gas Analyzers Automatic Blood Cell Counter plus CRP
Mass Flow Controllers Raman Spectrophotometers Gratings
Global Domestic
copy 2017 HORIBA Ltd All rights reserved 51
EU Japan
Asia Americas
33
26 18
23
Geographic Composition of Sales(2016)
HORIBA Worldwide
Sales of FY2016 1700 BJPY
The Number of Group Companies by region (As of December 31 2016)
America 9 Europe 23 Asia 17 (4 in Japan including HORIBA Ltd) Total 49
copy 2017 HORIBA Ltd All rights reserved 52
Japan 38
Other Asia 15
France 13
Germany 8
Other Europe 2 USA
10
Other Americas 3
7149
従業員数 2015年12月31日現在
2442
946
3761
UK 11
Employees by Region
Total Number of Employees (As of December 31 2016)
Total Asia 53
Total Europe 34
Total Americas 13
copy 2017 HORIBA Ltd All rights reserved 53 copy 2017 HORIBA Ltd All rights reserved 53
copy 2017 HORIBA Ltd All rights reserved 54
Danke
Grazie
Σας ευχαριστούμε
감사합니다
Obrigado
谢谢
ขอบคณครบ
ありがとうございました
धनयवाद
நனற
Cảm ơn
Dziękuję
Tack ska ni ha
Thank you
Merci
Gracias
Большое спасибо
スライド番号 1
Contents
Contents
スライド番号 4
Summary of 2016 Results
2016 full year results
2016 Results by Segment
Contents
2017 Market outlook
Exchange rate forecast for 2017
Forecast for 2017
Forecast for 2017 by segment
Contents
スライド番号 14
2016 Results and 2017 Forecast
Strategy for improving profitability
Regulatory trend in EMS (Emission Measurement System) and Operations in an emerging Market
ECT (HORIBA MIRA) Business
2016 Results and 2017 Forecast
Analysis technology for the environment
2016 Results and 2017 Forecast
Growth with New Brand and Service
2016 Results and 2017 Forecast
スライド番号 24
2016 Results and 2017 Forecast
Exploit new markets using HORIBA technology
Contents
Shareholder Return
Contents
スライド番号 30
スライド番号 31
スライド番号 32
Accelerate growth in water measuring business
Water measuring and analysisbusiness domain
Water measuring and analysisbusiness domain
Selected as one of New Diversity Management Selection 100 (by the Ministry of Economy Trade and Industry of Japan)
Enhance asset efficiency and maximize corporate value
Symbol of MLMAP2020
Contents
Trend of Market capitalization
Changed the accounting policy for revenue recognition
スライド番号 42
スライド番号 43
スライド番号 44
スライド番号 45
Contents
スライド番号 47
Business Segments
スライド番号 49
Market Shares
スライド番号 51
スライド番号 52
スライド番号 53
スライド番号 54
勘定科目
BS_CL12010
BS_CL12020
BS_CL12030
BS_FL21000
BS_FL23000
勘定科目名称
当座借越
短期借入金
1年内返済長期借入金
社債
長期借入金
HOR
0
(2000000000)
0
(10000000000)
0
日本 ニホン
ABX
(827350776)
(4016672108)
(534035942)
0
(1343663409)
欧州 オウシュウ
ASEC
0
(352000000)
0
0
(180000000)
日本 ニホン
HE
0
(1855530779)
0
0
0
欧州 オウシュウ
HIC
0
(1156081000)
(109236000)
0
(682725000)
米州 ベイシュウ
HIT
(99662290)
0
(200000000)
0
(300000000)
日本 ニホン
HSC
0
(20019305)
0
0
0
アジア
HST
0
(166375000)
0
0
0
アジア
JY
0
0
(9753688)
0
(105723687)
欧州 オウシュウ
会社間照合
0
(5047)
欧州 オウシュウ
会社間照合
200000000
日本 ニホン
会社間照合
480000000
日本 ニホン
会社間照合
2000000000
日本 ニホン
会社間照合
118647000
欧州 オウシュウ
会社間照合
175953553
欧州 オウシュウ
連結合計
(927013066)
(7272082686)
(653025630)
(10000000000)
(2132112096)
(99662290)
(352000000)
0
(10000000000)
0
日本 ニホン
(827350776)
(5577607381)
(543789630)
0
(1449387096)
欧州 オウシュウ
0
(1156081000)
(109236000)
0
(682725000)
米州 ベイシュウ
0
(186394305)
0
0
0
アジア
(927013066)
(7272082686)
(653025630)
(10000000000)
(2132112096)
2008
2009
2010
2011
2012
2013
2008
2008
2009
2009
2013
2013
2014
2014
2015
2015
2016
2016
短期借入金 タンキカリイレキン
8852
6618
5575
6684
5523
6606
現預金 ゲンヨキン
18267
21520
49246
51109
47859
51900
長期借入金 チョウキカリイレキン
2132
1730
1195
1291
2113
2576
短期 タンキ
8852
6618
6606
10832
12800
12400
社債 シャサイ
10000
10000
10000
10000
10000
15000
長期 チョウキ
2132
1730
2576
2209
16800
19200
現預金 ゲンヨキン
18267
21520
26958
28893
34685
42228
社債 シャサイ
10000
10000
15000
15000
15000
15000
流動比率 リュウドウヒリツ
2296
2524
2653
2806
2970
2690
自己資本比率 ジコシホンヒリツ
576
609
612
624
650
600
49246
6606
2576
15000
51109
10832
2209
15000
47859
12800
16800
15000
51900
12400
19200
15000
2013年実績 ネン ジッセキ
2014年実績 ネン ジッセキ
2015年計画 ネン ケイカク
増減
計画(GBM) ケイカク
発表案 ハッピョウ アン
vs 2014
売上高 ウリアゲ タカ
営業利益 エイギョウ リエキ
経常利益 ケイジョウ リエキ
当期純利益 トウキ ジュンリエキ
2013年 ネン
2014年 ネン
2015年 ネン
増減
実績
実績
計画(GBM) ケイカク
決定 ケッテイ
vs 2014
売上高 ウリアゲ タカ
営業利益 エイギョウ リエキ
経常利益 ケイジョウ リエキ
当期純利益 トウキ ジュンリエキ
営業利益率 エイギョウ リエキ リツ
2013実績 ジッセキ
2014年 ネン
増減
開示116 カイジ
実績 ジッセキ
vs 2013
売上高 ウリアゲ タカ
営業利益 エイギョウ リエキ
経常利益 ケイジョウ リエキ
当期純利益 トウキ ジュンリエキ
2015
2016
2017
Results
Forecast117
Results
vs 2015
vs Forecast117
Forecast
vs 2016
PPampE
148
153
134
-10
-12
146
+9
Intangibles
14
07
03
-75
-49
04
+11
Capital Investment
163
160
137
-15
-14
150
+9
Depreciation
61
65
68
+12
+5
72
+6
RampD
123
130
129
+5
-1
140
+8
(To net sales)
(7)
(8)
(8)
(8)
2014年 ネン
2015年 ネン
実績 ジッセキ
社内数値 シャナイ スウチ
発表案 ハッピョウ アン
上期 カミ キ
下期 シモキ
通期 ツウキ
上期 カミキ
下期 シモキ
通期 ツウキ
上期 カミ キ
下期 シモキ
通期 ツウキ
売上高 ウリアゲ ダカ
0
0
0
0
0
自動車 ジドウシャ
0
0
0
環境 カンキョウ
0
0
0
医用 イヨウ
0
0
0
半導体 ハンドウタイ
0
0
0
科学 カガク
0
0
0
営業利益 エイギョウ リエキ
0
0
0
0
0
自動車 ジドウシャ
0
0
0
環境 カンキョウ
0
0
0
医用 イヨウ
0
0
0
半導体 ハンドウタイ
0
0
0
科学 カガク
0
0
0
経常利益 ケイジョウ リエキ
0
0
当期純利益 トウキ ジュンリエキ
0
0
営業利益率 エイギョウ リエキ リツ
ERRORDIV0
ERRORDIV0
ERRORDIV0
ERRORDIV0
ERRORDIV0
ERRORDIV0
ERRORDIV0
ERRORDIV0
ERRORDIV0
自動車 ジドウシャ
ERRORDIV0
ERRORDIV0
ERRORDIV0
ERRORDIV0
ERRORDIV0
ERRORDIV0
ERRORDIV0
ERRORDIV0
ERRORDIV0
環境 カンキョウ
ERRORDIV0
ERRORDIV0
ERRORDIV0
ERRORDIV0
ERRORDIV0
ERRORDIV0
ERRORDIV0
ERRORDIV0
ERRORDIV0
医用 イヨウ
ERRORDIV0
ERRORDIV0
ERRORDIV0
ERRORDIV0
ERRORDIV0
ERRORDIV0
ERRORDIV0
ERRORDIV0
ERRORDIV0
半導体 ハンドウタイ
ERRORDIV0
ERRORDIV0
ERRORDIV0
ERRORDIV0
ERRORDIV0
ERRORDIV0
ERRORDIV0
ERRORDIV0
ERRORDIV0
科学 カガク
ERRORDIV0
ERRORDIV0
ERRORDIV0
ERRORDIV0
ERRORDIV0
ERRORDIV0
ERRORDIV0
ERRORDIV0
ERRORDIV0
受注実績 ジュチュウ ジッセキ
2013
2014
1Q
2Q
3Q
4Q
1Q
2Q
3Q
4Q
自動車
128
125
103
166
環境
39
38
41
40
医用
67
64
60
71
半導体
46
51
69
88
科学
53
61
61
77
合計
334
341
337
444
受注残 ジュチュウ ザン
2013
2014
1Q
2Q
3Q
4Q
1Q
2Q
3Q
4Q
自動車
314
335
325
314
環境
33
39
45
38
医用
30
27
24
23
半導体
20
15
25
31
科学
55
67
76
76
合計
454
486
497
484
受注実績 ジュチュウ ジッセキ
2013
2014
1Q
2Q
3Q
4Q
1Q
2Q
3Q
4Q
自動車
128
125
103
166
EMS
93
91
78
110
MCT
32
30
24
48
HIT
4
4
2
9
受注残 ジュチュウ ザン
2013
2014
推移 スイイ
1Q
2Q
3Q
4Q
1Q
2Q
3Q
4Q
自動車
314
335
325
314
EMS
173
188
195
177
MCT
135
142
125
128
HIT
5
5
4
7
売上高 ウリアゲ ダカ
営業利益 エイギョウ リエキ
2014
2015 計画 ケイカク
2014
2015 計画 ケイカク
実績 ジッセキ
社内数値 シャナイ スウチ
発表案① ハッピョウ アン
発表案② ハッピョウ アン
MLMAP2015年数値 ネン スウチ
実績 ジッセキ
社内数値 シャナイ スウチ
発表案① ハッピョウ アン
発表案② ハッピョウ アン
MLMAP2015年数値 ネン スウチ
vs 2014
vs 2014
対外発表 タイガイ ハッピョウ
社内数値 シャナイ スウチ
vs 2014
vs 2014
対外発表 タイガイ ハッピョウ
社内数値 シャナイ スウチ
自動車 ジドウシャ
環境 カンキョウ
医用 イヨウ
半導体 ハンドウタイ
科学 カガク
合計 ゴウケイ
営業利益 エイギョウ リエキ
2014
2015 計画 ケイカク
実績 ジッセキ
社内数値 シャナイ スウチ
発表案① ハッピョウ アン
発表案② ハッピョウ アン
MLMAP2015年数値 ネン スウチ
vs 2014
vs 2014
対外発表 タイガイ ハッピョウ
社内数値 シャナイ スウチ
自動車 ジドウシャ
環境 カンキョウ
医用 イヨウ
半導体 ハンドウタイ
科学 カガク
合計 ゴウケイ
売上高 ウリアゲ ダカ
営業利益 エイギョウ リエキ
2014
2015
2014
2015
実績 ジッセキ
社内数値 シャナイ スウチ
発表案 ハッピョウ アン
vs2014
実績 ジッセキ
社内数値 シャナイ スウチ
発表案 ハッピョウ アン
vs2014
自動車 ジドウシャ
環境 カンキョウ
医用 イヨウ
半導体 ハンドウタイ
科学 カガク
合計 ゴウケイ
2014
2015年計画 ネン ケイカク
実績 ジッセキ
社内数値 シャナイ スウチ
開示案① カイジ アン ハツアン
開示案② カイジ アン ハツアン
MLMAP2015年数値 ネン スウチ
市場 シジョウ
vs 2014
vs 2014
対外発表 タイガイ ハッピョウ
社内数値 シャナイ スウチ
8社平均 シャ ヘイキン
売上高 ウリアゲ タカ
営業利益 エイギョウ リエキ
経常利益 ケイジョウ リエキ
当期純利益 トウキ ジュンリエキ
営業利益率 エイギョウ リエキ リツ
ドル
ユーロ
配当(円1株) ハイトウ エン カブ
2014
2015
MLMAP2015年数値 ネン スウチ
市場 シジョウ
実績 ジッセキ
社内数値 シャナイ スウチ
発表案 ハッピョウ アン
vs2014
対外発表 タイガイ ハッピョウ
社内数値 シャナイ スウチ
8社平均 シャ ヘイキン
売上高 ウリアゲ タカ
営業利益 エイギョウ リエキ
経常利益 ケイジョウ リエキ
当期純利益 トウキ ジュンリエキ
営業利益率 エイギョウ リエキ リツ
ドル
ユーロ
配当(円1株) ハイトウ エン カブ
売上高 ウリアゲ ダカ
営業利益 エイギョウ リエキ
2013年 ネン
2014年 ネン
2013年 ネン
2014年 ネン
実績 ジッセキ
開示116 カイジ
実績 ジッセキ
増減vsv2013 ゾウゲン
実績 ジッセキ
開示116 カイジ
実績 ジッセキ
増減vsv2013 ゾウゲン
自動車 ジドウシャ
環境 カンキョウ
医用 イヨウ
半導体 ハンドウタイ
科学 カガク
合計 ゴウケイ
2013年 ネン
2014年 ネン
増減比較 ゾウゲン ヒカク
市場 シジョウ
実績 ジッセキ
開示(116) カイジ
実績(監査前) ジッセキ カンサ マエ
vs 13年 ネン
vs 開示 カイジ
8社平均 シャ ヘイキン
売上高 ウリアゲ タカ
営業利益 エイギョウ リエキ
経常利益 ケイジョウ リエキ
当期純利益 トウキ ジュンリエキ
営業利益率 エイギョウ リエキ リツ
配当 ハイトウ
配当性向 ハイトウ セイコウ
為替レート(累計)
ドル
ユーロ
2015
2016
Variation
Cash flows from operating activities
14770
15871
1101
Cash flows from investing activities
-30642
-10427
20214
Cash flows from financing activities
12843
-451
-13294
Cash and cash equivalents at end of year
47859
51940
4081
Free cash flows
-15872
5443
21315
Changed points
Original
Shipment base
New
The date of delivery or installation based on contractual arrangements
Applied timing
January 2016
Reason for change
Triggered by the introduction of a new ERP implementation to harmonize with international accounting standards
MLMAP2020 [2016-2020] Progress Financial Data Corporate profile
copy 2017 HORIBA Ltd All rights reserved 9
Scientific
Auto
Semi
PampE
Medical
Expect steady RampD investments by automakers Closely monitor emission regulations in EU and Japan
Expect continuous investment by semiconductor manufacturers in the first half uncertainties over outlook in demand by semiconductor production equipment in the second half
Closely monitor sales trend of small-sized products in Japan Changes in medical care system in US
2017 Market outlook
Expect firm demand for stack gas analyzers and water measurement equipment in Asian countries
Japan Expect an increase in the private sector capital spending Overseas Closely monitor government budgets and spending in EU
copy 2017 HORIBA Ltd All rights reserved 10
Exchange rate forecast for 2017
2015 2016
Results Results Forecastas of Feb 14
Forecastas of May 12
vs 2016
USD 12110 10878 110 110 +122
EUR 13431 12026 120 120 -026
2017
(Yen)
1 yen OP sensitivity for 2017 Forecast as of May 12 USD 160 million yen EUR 23 million yen
Sheet1 (2)
全社2014実績
セグ別2014実績
全社2015予想
Sheet4
Sheet5
Sheet6
copy 2017 HORIBA Ltd All rights reserved 11
2015 2016Results
(New policy)Results Forecast
as of Feb 14Forecast
as of May 12vs 2016
Sales 1719 1700 1770 1830 +76
Operating profit 201 184 200 210 +135
OP 117 109 113 115 +06p
Ordinary proft 196 182 193 203 +111Net income attribute to
Owners of Parent 132 129 130 136 +49Net profit
per share(Yen) 315 308 309 323 +48
ROE 107 100 95 99 -01p
2017
Forecast for 2017
Record-high
2015 results are restated numbers The same shall apply hereinafter
(Billions of yen)
Sheet1 (2)
全社2014実績
セグ別2014実績
全社2015予想
Sheet4
Sheet5
Sheet6
copy 2017 HORIBA Ltd All rights reserved 12
(Billions of yen) Forecast for 2017 by segment
2016 2016
Results Forecastas of Feb 14
Forecastas of May 12
vs 2016 Results Forecastas of Feb 14
Forecastas of May 12
vs 2016
Auto 622 670 690 +109 35 52 52 +473
PampE 167 180 180 +74 15 16 11 -286
Medical 265 250 250 -59 28 22 22 -216
Semi 388 410 460 +185 96 100 120 +240
Scientific 257 260 250 -29 09 10 05 -471
Total 1700 1770 1830 +76 184 200 210 +135
Sales OP2017 2017
Record- high
Sheet1 (2)
全社2014実績
セグ別2014実績
全社2015予想
セグ別2015予想
copy 2017 HORIBA Ltd All rights reserved 13
Contents
2016 Results
2017 Forecast
Business Segment Outline
Shareholder Return
MLMAP2020 [2016-2020] Progress Financial Data Corporate profile
copy 2017 HORIBA Ltd All rights reserved 14
Next Slide
copy 2017 HORIBA Ltd All rights reserved 15
Topics of Automotive Industries in 2016 The autonomous-driving car age begins
Use of artificial intelligence (AI) Accelerated EV development
RampD shift to electrification Exhaust gas and fuel economy test scandals at
VW and in Japan More strict regulations in EMS (WLTP RDE)
For indoor tests and on-road tests Brexit
2016 Results and 2017 Forecast
EMS Steady sales in Japan increase in OBS
MCT Temporary decline in demand
ECT Full-year incremental sales goodwill of 04bn yen
EMS Steady sales in Japan and Asia MCT Significant recovery improved profitability ECT Many inquiries weak GBP to depress amounts in yen
EMS Emission Measurement Systems OBS On-Board Exhaust Emission Measurement System ECT Engineering Consultancy amp Testing business operated by HORIBA MIRA WLTP RDE See details on Slide 17
(Billions of yen)
Graph1
売上高
営業利益
690
542
72
371
18
357
16
386
28
432
44
495
42
55
58
642
44
654
52
622
35
69
52
Sheet1
Sheet1
売上高
REF
REF
Sheet2
Sheet3
copy 2017 HORIBA Ltd All rights reserved 16
95 110 128 133 108 152
81 116
145 162
197
132
180
2011 2012 2013 2014 2015 2016 2017
BacklogSales
Auto Strategy for improving profitability
[Problem] Long waiting in the design process
[Solution] Reduce design work by standardizing specs
0
10
20
30
40
50
60
70
Aug2015 Feb2016 Aug2016
(days)
60 days in Aug 2015
11days in Aug 2016
Shorten the lead time in the specification-design stage
Lead time from specification adoption to design completion
Significant recovery is expected in 2017 Pick up in automakersrsquo investments Improve order booking by expanding turn-
key projects (in Japan EU the US) Focus on improving profitability Tighter management of project progress
Inquiry
Determ
ine S
pecification
Design
Procure
Product
Installment
Test
Inspection
Collection
Aim at cutting the lead time to one-third
- HORIBA BIWAKO E-HARBOR - MCT
MCT business improves profitability
MCT Sales and Order Backlog (Billions of yen)
(Forecast)
Case of the MEXA series middle-sized EMS product
The lead time was shortened to 15
(Restated)
copy 2017 HORIBA Ltd All rights reserved 17
EMS Sales and Order Backlog (Billions of yen)
137 169 179 202 269 294
265 286 333
374 398 401 420
0
15
30
45
2011 2012 2013 2014 2015 2016 2017
Backlog Sales
Open November 2016
Location Pune western India (Center of Auto Business)
Function Indoor Automotive test Product
customizationTraining
Objective Strengthen demonstration
test and application
development
Regulatory trend in EMS (Emission Measurement System) and Operations in an emerging Market Auto
Regulatory trend Solid sales in Japan (automakers parts makers) Steady investment in Japan WLTP(unified emission regulations by the UN) Start in Sep 2017 in EU and in 2018 in Japan RDE (Real Driving Emission on-road test) regulation Start in Sep 2017 in EU WLTPhellipWorldwide harmonized Light vehicles Test Procedure
HORIBA India Technical Center Establishment
Overview HORIBA India Technical center
(Forecast) (Restated)
Open July 2017 (Plan)
Location Nuneaton Warwickshire UK
Function Cutting-edge Emission Testing Lab (applied
for RDE regulation)
Objective Strengthen
demonstration test
HORIBA MIRA AETC Establishment
(Advanced Emission Test Centre AETC)
Inside of AETC
copy 2017 HORIBA Ltd All rights reserved 18
Auto ECT (HORIBA MIRA) Business
Sale decline caused by weaker GBP vs the JPY Investments of 30bn yen planned each in 2016
and 2017 while closely monitoring the Brexit impacts
Increased inquiries to MIRA Technology Park Accelerated global business (JapanAsia)
ECT Business (EngineeringHORIBA MIRA)
G7 transport ministersrsquo summit (held in Karuizawa Japan in Sep 2016)
Participation in the UK government autonomous driving car project
httpwwwukautodrivecomthe-uk-autodrive-project
George Gillespie CEO of HORIBA MIRA participated as a representative of UK
Main theme Autonomous driving 1 Development and dissemination of cutting-edge
technology regarding automobiles and roads 2 Basic policy for transportation infrastructure
Participated in Jaguar Land Roverrsquos testing contributed to the demonstration test of autonomous driving technology
Major participants Germany BMW France Renault Japan Toyota UK HORIBA MIRA
42 35
45
72 70
02468
2015 2016 2017
Backlog Sales
(Half-year Restated) (Forecast)
JPYGBP 185 yen 147 yen 140 yen
ECT Sales and Backlog (Billions of Yen)
copy 2017 HORIBA Ltd All rights reserved 19
bull Steady sales of stack gas analyzers in Japan
bull Robust process analytical measurement business (US)
bull Weak sales in EU and Asia
bull Expect steady sales to continue in Japan
bull Profitability improvement in gas measurement business
in HORIBA BIWAKO E-HARBOR
bull Increase RampD expenditure for water business
Automatic on-line analysis of PM components Integrate HORIBArsquos technology in and times Identify sources of origin of microparticles Enable 24-hour consecutive analysis of elements
Project to improve water quality of wastewater from dyeing factories Installing wastewater treatment systems and
water quality monitors in Myanmar Joint project with Hitachi Zosen Corporation
Ministry of Environment (MOE) plans to adopt HORIBArsquos products Scheduled to install devices at 4 sites in Japan
in Apr 2017
Designated one of the ldquoModel businesses to improve water environment in Asiardquo by MOE Started experimentation in Jan 2017
Demo facility installed in HORIBA BIWAKO E-HARBOR
PampE SCI
Facilities installed in Wundwin city Myanmar
Water quality analyzer
PM25 analyzer
copy 2017 HORIBA Ltd All rights reserved 21
Firm sales of CBC+CRP analyzers in Japan
Sales decrease in yen due to the yen appreciation
Steady growth in India
Expect firm sales of CBC+CRP analyzers in Japan
bull Accelerated sales expansion by introducing a new
Strategy to expand sales in mediumlarge-sized hematology analyzers Propose total solutions including a data
management system Expand business globally from 2Q of 2017
New brand ldquoYumizenrdquo
Medical Growth with New Brand and Service
Provide maintenance service system using IoT technology
for reducing device downtime
Enhance maintenance support by continuous monitoring amp diagnostic reports
Detect problems in advance and provide appropriate suggestions
Target 6000 contracts by 2020 in Japan Also plan to expand globally
携帯通信網使用
Distributors
Medical Certificate
Call Center
Customer
Through Mobile network
Coordination
Automatic Data Collection Monitoring
Server
Monitoring Machine Condition
Preventive Maintenance
copy 2017 HORIBA Ltd All rights reserved 23
(Billions of yen)
bull Record-high sales and operating profit due to increased investments by semiconductor manufacturers in Asia
bull Sales decrease in yen terms due to the appreciation of the yen
bull Investment to raise Aso factory production capacity Less-certain market outlook for the 2nd half Closely monitor investment trend in China
2016 Results Topics regarding the semiconductor industry and mass flow controller market Data centersrsquo shift to memory for storage Sharp increase in demand for
semiconductors Changes in manufacturing technology
Miniaturization 3D-NAND double-patterning rarr Increase in demand for etching devices Disciplined investment by semiconductor
manufacturers The silicon cycle to fluctuate less widely The market to stabilize
Cutting-edge technology of HORIBA and HORIBA Jobin Yvon Close relationship with academia
MESA-50T SEM-CL
For a rare metal manufacturer
Software development for rare metal analysis
Customized chamber
Specialized in defect
characterization Applied Topcon technology
Collaboration with Raman Testing for protein and
drugs
INV-XploRA
Cutting-edge material development
High concentration cell Minute amount
measurement
New market creation and product development to meet customerrsquos needs
LA-960
Imaging CL device (released in Aug 2016) Convert defective images into high-accuracy images Characteristic distribution analysis of phosphor parts of LED
elements Accelerate RampD for the next-generation power devices
HORIBA HORIBA Jobin Yvon
Electron beam technology of Topcon
New product by integrating HORIBA Grouprsquos technologies
Materials for semiconductors Life science sector
Imaging Cathodoluminescence (CL)
Scientific
copy 2017 HORIBA Ltd All rights reserved 27
Contents
2016 Results
2017 Forecast
Business Segment Outline
Shareholder Return
MLMAP2020 [2016-2020] Progress Financial Data Corporate profile
copy 2017 HORIBA Ltd All rights reserved 28
2015 Results 70 yen per share + 2016 Results 85 yen per share 2017 Forecast 90 yen per share
- Dividend payment + Share buyback = 30 of Consolidated net profit to be targeted - Remaining earnings are retained internally for strategic investment (ie facilities MampA)
(Yen) Per-share dividend (from 2002 to 2017 Forecast)
Basic policy (since 2013)
Dividends and Share buybacks
(fore)
2015 Share buyback 218400 shares
about 10 billion yen
Record high for 7 years in a row
An Average total return ratio of last 3years 292
copy 2017 HORIBA Ltd All rights reserved 29
Contents
2016 Results
2017 Forecast
Business Segment Outline
Shareholder Return
MLMAP2020 [2016-2020] Progress Financial Data Corporate profile
HORIBA Stained Glass Project Lunch gatherings of working mothers Seminars on how to balance long-term care and work Workshop to improve work productivity
Selected as one of New Diversity Management Selection 100 (by the Ministry of Economy Trade and Industry of Japan)
Reasons for the award Corporate motto ldquoJoy and Funrdquo and the Stained Glass Project
Mr Saito executive vice president and Ms Moriguchi leader of Stained Glass Project at the award-receiving ceremony
copy 2017 HORIBA Ltd All rights reserved 37
Decided to introduce a new KPI to measure asset efficiency Indicator composed of ldquoOperating profitrdquo and ldquoWACCrdquo Applying unit Business segments and Group companies Strengthen PDCA cycle Efficient use of business assets and increase profit
Plan to prepare a budget to this project in 2018
Founded financial subsidiaries in the US and the UK Improve capital efficiency through group financing Strengthen financial management function in each region
Enhance asset efficiency and maximize corporate value
Improve asset efficiency amp
Accelerate business growth
Investment
Business Growth
Cash Generation
copy 2017 HORIBA Ltd All rights reserved 38
Symbol of MLMAP2020
Step out of the existing business fields and pursue further expansion Take a new perspective and overcome technologicalmarketorganization barriers
Be flexible think outside the box and move up to the next stage
ONE STEP AHEAD - To create a next stage of HORIBA -
copy 2017 HORIBA Ltd All rights reserved 39
Contents
2016 Results
2017 Forecast
Business Segment Outline
Shareholder Return
MLMAP2020 [2016-2020] Progress Financial Data Corporate profile
PPampE Investment to MIRA(30BJYP) Depreciation Goodwill of MIRA(04BJYP) Biwako factory (07BJYP) RampD Increased in Automotive Test System Business
Good will of MIRA eg hellip Amortization included
2017 Topics
PPampE Investment to MIRA(30BJYP) Expansion of Aso Factory(27BJYP)
Depreciation Goodwill of MIRA(04BJYP) Increase in MIRA and Test center invested in 2016 RampD Increase in Auto and PampE Business
Capital Investment Depreciation RampD (Billions of yen)
全社実績
セグ実績
全社予算
全社予算2案
セグ予算
セグ予算2案
受注_残
半期予想
設備投資
HOR単体実績
HOR単体予算
HOR単体上期予算
copy 2017 HORIBA Ltd All rights reserved 45
241 Bond
redemption in 2020
Current ratio
280
2014 254 60
Short 66
Cash1
492
Bonds 150
Long 25
Cash1
478
Bonds 150
Long 22 Short 108
2013 269 60
447
Cash1
511
Bonds 150
Long 168
Short 128
2015 229 55
Borrowed from JBIC2
151bn yen (2015)
Capital ratio
467
2016 237 55
Cash1
519
Bonds 150
Long 192
Short 124
Cash Balance (Billions of yen)
(Consolidated basis each end of the year) Total Loan Balance
Conclusion of liquidation of receivable contract with 2 banks Recent issuer rating RampI [A-] (July 2016) JCR [A] (August 2016)
1 CashhellipCash and Cash Equivalents at End of Period 2 JBIC Japan Bank for International Cooperation
Graph1
Sheet1
Sheet1
現預金
短期
長期
社債
Sheet1 (2)
tajikaABX =gtHIL
tajikaSTEC=gtHOR
copy 2017 HORIBA Ltd All rights reserved 46
Contents
2016 Results
2017 Forecast
Business Segment Outline
Shareholder Return
MLMAP2020 [2016-2020]Progress Financial Data Corporate profile
copy 2017 HORIBA Ltd All rights reserved 47
Head office Kyoto Japan Founded 1945 Incorporated 1953 CEO Atsushi Horiba Fiscal year end December 31
Atsushi Horiba Chairman President amp CEO
- Corporate motto -
To have interest and pride in our work to enjoy our lives
Corporate Profile
copy 2017 HORIBA Ltd All rights reserved 48
Medical In-Vitro Diagnostic (IVD) Systems Integration of HORIBA ABXrsquos Technology amp Marketing Know-How
Automotive Test Systems Emission Measurement Systems (EMS) Mechatronics Devices (MCT) Driving Control Systems (ITS) Engineering Consultancy amp Testing (ECT)
Business Segments
Process amp Environmental Environmental Systems Environmental Radiation Monitor Environmental Regulation amp Process Business
Semiconductor Mass Flow Controller In-situ Analysis Synergy among HORIBA HQ HORIBA STEC and HORIBA Jobin Yvonrsquos Technologies
Scientific Synergy of HORIBA and HORIBA Jobin Yvonrsquos Technologies Raman Grating and Fluorescence
copy 2017 HORIBA Ltd All rights reserved 49
Sales 1700 Billions of Yen
Business Composition of Sales
Automotive Test Systems
Process amp Environmental
Medical
Semiconductor
Scientific
Automotive 622 (36)
Scientific 257 (15)
Semiconductor 388 (23)
Medical 265 (16)
PampE 167 (10)
Well Balanced Business Operation -Five Business Segments-
(Billions of Yen)
copy 2017 HORIBA Ltd All rights reserved 50
Market Shares
Market shares quoted are estimates by HORIBA
80 20 100
35
Emission Measurement Systems
57 30
Stack Gas Analyzers Automatic Blood Cell Counter plus CRP
Mass Flow Controllers Raman Spectrophotometers Gratings
Global Domestic
copy 2017 HORIBA Ltd All rights reserved 51
EU Japan
Asia Americas
33
26 18
23
Geographic Composition of Sales(2016)
HORIBA Worldwide
Sales of FY2016 1700 BJPY
The Number of Group Companies by region (As of December 31 2016)
America 9 Europe 23 Asia 17 (4 in Japan including HORIBA Ltd) Total 49
copy 2017 HORIBA Ltd All rights reserved 52
Japan 38
Other Asia 15
France 13
Germany 8
Other Europe 2 USA
10
Other Americas 3
7149
従業員数 2015年12月31日現在
2442
946
3761
UK 11
Employees by Region
Total Number of Employees (As of December 31 2016)
Total Asia 53
Total Europe 34
Total Americas 13
copy 2017 HORIBA Ltd All rights reserved 53 copy 2017 HORIBA Ltd All rights reserved 53
copy 2017 HORIBA Ltd All rights reserved 54
Danke
Grazie
Σας ευχαριστούμε
감사합니다
Obrigado
谢谢
ขอบคณครบ
ありがとうございました
धनयवाद
நனற
Cảm ơn
Dziękuję
Tack ska ni ha
Thank you
Merci
Gracias
Большое спасибо
スライド番号 1
Contents
Contents
スライド番号 4
Summary of 2016 Results
2016 full year results
2016 Results by Segment
Contents
2017 Market outlook
Exchange rate forecast for 2017
Forecast for 2017
Forecast for 2017 by segment
Contents
スライド番号 14
2016 Results and 2017 Forecast
Strategy for improving profitability
Regulatory trend in EMS (Emission Measurement System) and Operations in an emerging Market
ECT (HORIBA MIRA) Business
2016 Results and 2017 Forecast
Analysis technology for the environment
2016 Results and 2017 Forecast
Growth with New Brand and Service
2016 Results and 2017 Forecast
スライド番号 24
2016 Results and 2017 Forecast
Exploit new markets using HORIBA technology
Contents
Shareholder Return
Contents
スライド番号 30
スライド番号 31
スライド番号 32
Accelerate growth in water measuring business
Water measuring and analysisbusiness domain
Water measuring and analysisbusiness domain
Selected as one of New Diversity Management Selection 100 (by the Ministry of Economy Trade and Industry of Japan)
Enhance asset efficiency and maximize corporate value
Symbol of MLMAP2020
Contents
Trend of Market capitalization
Changed the accounting policy for revenue recognition
スライド番号 42
スライド番号 43
スライド番号 44
スライド番号 45
Contents
スライド番号 47
Business Segments
スライド番号 49
Market Shares
スライド番号 51
スライド番号 52
スライド番号 53
スライド番号 54
勘定科目
BS_CL12010
BS_CL12020
BS_CL12030
BS_FL21000
BS_FL23000
勘定科目名称
当座借越
短期借入金
1年内返済長期借入金
社債
長期借入金
HOR
0
(2000000000)
0
(10000000000)
0
日本 ニホン
ABX
(827350776)
(4016672108)
(534035942)
0
(1343663409)
欧州 オウシュウ
ASEC
0
(352000000)
0
0
(180000000)
日本 ニホン
HE
0
(1855530779)
0
0
0
欧州 オウシュウ
HIC
0
(1156081000)
(109236000)
0
(682725000)
米州 ベイシュウ
HIT
(99662290)
0
(200000000)
0
(300000000)
日本 ニホン
HSC
0
(20019305)
0
0
0
アジア
HST
0
(166375000)
0
0
0
アジア
JY
0
0
(9753688)
0
(105723687)
欧州 オウシュウ
会社間照合
0
(5047)
欧州 オウシュウ
会社間照合
200000000
日本 ニホン
会社間照合
480000000
日本 ニホン
会社間照合
2000000000
日本 ニホン
会社間照合
118647000
欧州 オウシュウ
会社間照合
175953553
欧州 オウシュウ
連結合計
(927013066)
(7272082686)
(653025630)
(10000000000)
(2132112096)
(99662290)
(352000000)
0
(10000000000)
0
日本 ニホン
(827350776)
(5577607381)
(543789630)
0
(1449387096)
欧州 オウシュウ
0
(1156081000)
(109236000)
0
(682725000)
米州 ベイシュウ
0
(186394305)
0
0
0
アジア
(927013066)
(7272082686)
(653025630)
(10000000000)
(2132112096)
2008
2009
2010
2011
2012
2013
2008
2008
2009
2009
2013
2013
2014
2014
2015
2015
2016
2016
短期借入金 タンキカリイレキン
8852
6618
5575
6684
5523
6606
現預金 ゲンヨキン
18267
21520
49246
51109
47859
51900
長期借入金 チョウキカリイレキン
2132
1730
1195
1291
2113
2576
短期 タンキ
8852
6618
6606
10832
12800
12400
社債 シャサイ
10000
10000
10000
10000
10000
15000
長期 チョウキ
2132
1730
2576
2209
16800
19200
現預金 ゲンヨキン
18267
21520
26958
28893
34685
42228
社債 シャサイ
10000
10000
15000
15000
15000
15000
流動比率 リュウドウヒリツ
2296
2524
2653
2806
2970
2690
自己資本比率 ジコシホンヒリツ
576
609
612
624
650
600
49246
6606
2576
15000
51109
10832
2209
15000
47859
12800
16800
15000
51900
12400
19200
15000
2013年実績 ネン ジッセキ
2014年実績 ネン ジッセキ
2015年計画 ネン ケイカク
増減
計画(GBM) ケイカク
発表案 ハッピョウ アン
vs 2014
売上高 ウリアゲ タカ
営業利益 エイギョウ リエキ
経常利益 ケイジョウ リエキ
当期純利益 トウキ ジュンリエキ
2013年 ネン
2014年 ネン
2015年 ネン
増減
実績
実績
計画(GBM) ケイカク
決定 ケッテイ
vs 2014
売上高 ウリアゲ タカ
営業利益 エイギョウ リエキ
経常利益 ケイジョウ リエキ
当期純利益 トウキ ジュンリエキ
営業利益率 エイギョウ リエキ リツ
2013実績 ジッセキ
2014年 ネン
増減
開示116 カイジ
実績 ジッセキ
vs 2013
売上高 ウリアゲ タカ
営業利益 エイギョウ リエキ
経常利益 ケイジョウ リエキ
当期純利益 トウキ ジュンリエキ
2015
2016
2017
Results
Forecast117
Results
vs 2015
vs Forecast117
Forecast
vs 2016
PPampE
148
153
134
-10
-12
146
+9
Intangibles
14
07
03
-75
-49
04
+11
Capital Investment
163
160
137
-15
-14
150
+9
Depreciation
61
65
68
+12
+5
72
+6
RampD
123
130
129
+5
-1
140
+8
(To net sales)
(7)
(8)
(8)
(8)
2014年 ネン
2015年 ネン
実績 ジッセキ
社内数値 シャナイ スウチ
発表案 ハッピョウ アン
上期 カミ キ
下期 シモキ
通期 ツウキ
上期 カミキ
下期 シモキ
通期 ツウキ
上期 カミ キ
下期 シモキ
通期 ツウキ
売上高 ウリアゲ ダカ
0
0
0
0
0
自動車 ジドウシャ
0
0
0
環境 カンキョウ
0
0
0
医用 イヨウ
0
0
0
半導体 ハンドウタイ
0
0
0
科学 カガク
0
0
0
営業利益 エイギョウ リエキ
0
0
0
0
0
自動車 ジドウシャ
0
0
0
環境 カンキョウ
0
0
0
医用 イヨウ
0
0
0
半導体 ハンドウタイ
0
0
0
科学 カガク
0
0
0
経常利益 ケイジョウ リエキ
0
0
当期純利益 トウキ ジュンリエキ
0
0
営業利益率 エイギョウ リエキ リツ
ERRORDIV0
ERRORDIV0
ERRORDIV0
ERRORDIV0
ERRORDIV0
ERRORDIV0
ERRORDIV0
ERRORDIV0
ERRORDIV0
自動車 ジドウシャ
ERRORDIV0
ERRORDIV0
ERRORDIV0
ERRORDIV0
ERRORDIV0
ERRORDIV0
ERRORDIV0
ERRORDIV0
ERRORDIV0
環境 カンキョウ
ERRORDIV0
ERRORDIV0
ERRORDIV0
ERRORDIV0
ERRORDIV0
ERRORDIV0
ERRORDIV0
ERRORDIV0
ERRORDIV0
医用 イヨウ
ERRORDIV0
ERRORDIV0
ERRORDIV0
ERRORDIV0
ERRORDIV0
ERRORDIV0
ERRORDIV0
ERRORDIV0
ERRORDIV0
半導体 ハンドウタイ
ERRORDIV0
ERRORDIV0
ERRORDIV0
ERRORDIV0
ERRORDIV0
ERRORDIV0
ERRORDIV0
ERRORDIV0
ERRORDIV0
科学 カガク
ERRORDIV0
ERRORDIV0
ERRORDIV0
ERRORDIV0
ERRORDIV0
ERRORDIV0
ERRORDIV0
ERRORDIV0
ERRORDIV0
受注実績 ジュチュウ ジッセキ
2013
2014
1Q
2Q
3Q
4Q
1Q
2Q
3Q
4Q
自動車
128
125
103
166
環境
39
38
41
40
医用
67
64
60
71
半導体
46
51
69
88
科学
53
61
61
77
合計
334
341
337
444
受注残 ジュチュウ ザン
2013
2014
1Q
2Q
3Q
4Q
1Q
2Q
3Q
4Q
自動車
314
335
325
314
環境
33
39
45
38
医用
30
27
24
23
半導体
20
15
25
31
科学
55
67
76
76
合計
454
486
497
484
受注実績 ジュチュウ ジッセキ
2013
2014
1Q
2Q
3Q
4Q
1Q
2Q
3Q
4Q
自動車
128
125
103
166
EMS
93
91
78
110
MCT
32
30
24
48
HIT
4
4
2
9
受注残 ジュチュウ ザン
2013
2014
推移 スイイ
1Q
2Q
3Q
4Q
1Q
2Q
3Q
4Q
自動車
314
335
325
314
EMS
173
188
195
177
MCT
135
142
125
128
HIT
5
5
4
7
売上高 ウリアゲ ダカ
営業利益 エイギョウ リエキ
2014
2015 計画 ケイカク
2014
2015 計画 ケイカク
実績 ジッセキ
社内数値 シャナイ スウチ
発表案① ハッピョウ アン
発表案② ハッピョウ アン
MLMAP2015年数値 ネン スウチ
実績 ジッセキ
社内数値 シャナイ スウチ
発表案① ハッピョウ アン
発表案② ハッピョウ アン
MLMAP2015年数値 ネン スウチ
vs 2014
vs 2014
対外発表 タイガイ ハッピョウ
社内数値 シャナイ スウチ
vs 2014
vs 2014
対外発表 タイガイ ハッピョウ
社内数値 シャナイ スウチ
自動車 ジドウシャ
環境 カンキョウ
医用 イヨウ
半導体 ハンドウタイ
科学 カガク
合計 ゴウケイ
営業利益 エイギョウ リエキ
2014
2015 計画 ケイカク
実績 ジッセキ
社内数値 シャナイ スウチ
発表案① ハッピョウ アン
発表案② ハッピョウ アン
MLMAP2015年数値 ネン スウチ
vs 2014
vs 2014
対外発表 タイガイ ハッピョウ
社内数値 シャナイ スウチ
自動車 ジドウシャ
環境 カンキョウ
医用 イヨウ
半導体 ハンドウタイ
科学 カガク
合計 ゴウケイ
売上高 ウリアゲ ダカ
営業利益 エイギョウ リエキ
2014
2015
2014
2015
実績 ジッセキ
社内数値 シャナイ スウチ
発表案 ハッピョウ アン
vs2014
実績 ジッセキ
社内数値 シャナイ スウチ
発表案 ハッピョウ アン
vs2014
自動車 ジドウシャ
環境 カンキョウ
医用 イヨウ
半導体 ハンドウタイ
科学 カガク
合計 ゴウケイ
2014
2015年計画 ネン ケイカク
実績 ジッセキ
社内数値 シャナイ スウチ
開示案① カイジ アン ハツアン
開示案② カイジ アン ハツアン
MLMAP2015年数値 ネン スウチ
市場 シジョウ
vs 2014
vs 2014
対外発表 タイガイ ハッピョウ
社内数値 シャナイ スウチ
8社平均 シャ ヘイキン
売上高 ウリアゲ タカ
営業利益 エイギョウ リエキ
経常利益 ケイジョウ リエキ
当期純利益 トウキ ジュンリエキ
営業利益率 エイギョウ リエキ リツ
ドル
ユーロ
配当(円1株) ハイトウ エン カブ
2014
2015
MLMAP2015年数値 ネン スウチ
市場 シジョウ
実績 ジッセキ
社内数値 シャナイ スウチ
発表案 ハッピョウ アン
vs2014
対外発表 タイガイ ハッピョウ
社内数値 シャナイ スウチ
8社平均 シャ ヘイキン
売上高 ウリアゲ タカ
営業利益 エイギョウ リエキ
経常利益 ケイジョウ リエキ
当期純利益 トウキ ジュンリエキ
営業利益率 エイギョウ リエキ リツ
ドル
ユーロ
配当(円1株) ハイトウ エン カブ
売上高 ウリアゲ ダカ
営業利益 エイギョウ リエキ
2013年 ネン
2014年 ネン
2013年 ネン
2014年 ネン
実績 ジッセキ
開示116 カイジ
実績 ジッセキ
増減vsv2013 ゾウゲン
実績 ジッセキ
開示116 カイジ
実績 ジッセキ
増減vsv2013 ゾウゲン
自動車 ジドウシャ
環境 カンキョウ
医用 イヨウ
半導体 ハンドウタイ
科学 カガク
合計 ゴウケイ
2013年 ネン
2014年 ネン
増減比較 ゾウゲン ヒカク
市場 シジョウ
実績 ジッセキ
開示(116) カイジ
実績(監査前) ジッセキ カンサ マエ
vs 13年 ネン
vs 開示 カイジ
8社平均 シャ ヘイキン
売上高 ウリアゲ タカ
営業利益 エイギョウ リエキ
経常利益 ケイジョウ リエキ
当期純利益 トウキ ジュンリエキ
営業利益率 エイギョウ リエキ リツ
配当 ハイトウ
配当性向 ハイトウ セイコウ
為替レート(累計)
ドル
ユーロ
2015
2016
Variation
Cash flows from operating activities
14770
15871
1101
Cash flows from investing activities
-30642
-10427
20214
Cash flows from financing activities
12843
-451
-13294
Cash and cash equivalents at end of year
47859
51940
4081
Free cash flows
-15872
5443
21315
Changed points
Original
Shipment base
New
The date of delivery or installation based on contractual arrangements
Applied timing
January 2016
Reason for change
Triggered by the introduction of a new ERP implementation to harmonize with international accounting standards
2008
2009
2010
2011
2012
2013
2014
2015
2015
2016
2017
売上高
542
371
357
386
432
495
550
642
654
622
690
営業利益
72
18
16
28
44
42
58
44
52
35
52
2008
2008
2009
2009
2010
2010
2011
2011
2012
2012
2013
2013
2014
2014
2015
2015
2015
2015
2016
2016
2017
2017
copy 2017 HORIBA Ltd All rights reserved 14
Next Slide
copy 2017 HORIBA Ltd All rights reserved 15
Topics of Automotive Industries in 2016 The autonomous-driving car age begins
Use of artificial intelligence (AI) Accelerated EV development
RampD shift to electrification Exhaust gas and fuel economy test scandals at
VW and in Japan More strict regulations in EMS (WLTP RDE)
For indoor tests and on-road tests Brexit
2016 Results and 2017 Forecast
EMS Steady sales in Japan increase in OBS
MCT Temporary decline in demand
ECT Full-year incremental sales goodwill of 04bn yen
EMS Steady sales in Japan and Asia MCT Significant recovery improved profitability ECT Many inquiries weak GBP to depress amounts in yen
EMS Emission Measurement Systems OBS On-Board Exhaust Emission Measurement System ECT Engineering Consultancy amp Testing business operated by HORIBA MIRA WLTP RDE See details on Slide 17
(Billions of yen)
Graph1
売上高
営業利益
690
542
72
371
18
357
16
386
28
432
44
495
42
55
58
642
44
654
52
622
35
69
52
Sheet1
Sheet1
売上高
REF
REF
Sheet2
Sheet3
copy 2017 HORIBA Ltd All rights reserved 16
95 110 128 133 108 152
81 116
145 162
197
132
180
2011 2012 2013 2014 2015 2016 2017
BacklogSales
Auto Strategy for improving profitability
[Problem] Long waiting in the design process
[Solution] Reduce design work by standardizing specs
0
10
20
30
40
50
60
70
Aug2015 Feb2016 Aug2016
(days)
60 days in Aug 2015
11days in Aug 2016
Shorten the lead time in the specification-design stage
Lead time from specification adoption to design completion
Significant recovery is expected in 2017 Pick up in automakersrsquo investments Improve order booking by expanding turn-
key projects (in Japan EU the US) Focus on improving profitability Tighter management of project progress
Inquiry
Determ
ine S
pecification
Design
Procure
Product
Installment
Test
Inspection
Collection
Aim at cutting the lead time to one-third
- HORIBA BIWAKO E-HARBOR - MCT
MCT business improves profitability
MCT Sales and Order Backlog (Billions of yen)
(Forecast)
Case of the MEXA series middle-sized EMS product
The lead time was shortened to 15
(Restated)
copy 2017 HORIBA Ltd All rights reserved 17
EMS Sales and Order Backlog (Billions of yen)
137 169 179 202 269 294
265 286 333
374 398 401 420
0
15
30
45
2011 2012 2013 2014 2015 2016 2017
Backlog Sales
Open November 2016
Location Pune western India (Center of Auto Business)
Function Indoor Automotive test Product
customizationTraining
Objective Strengthen demonstration
test and application
development
Regulatory trend in EMS (Emission Measurement System) and Operations in an emerging Market Auto
Regulatory trend Solid sales in Japan (automakers parts makers) Steady investment in Japan WLTP(unified emission regulations by the UN) Start in Sep 2017 in EU and in 2018 in Japan RDE (Real Driving Emission on-road test) regulation Start in Sep 2017 in EU WLTPhellipWorldwide harmonized Light vehicles Test Procedure
HORIBA India Technical Center Establishment
Overview HORIBA India Technical center
(Forecast) (Restated)
Open July 2017 (Plan)
Location Nuneaton Warwickshire UK
Function Cutting-edge Emission Testing Lab (applied
for RDE regulation)
Objective Strengthen
demonstration test
HORIBA MIRA AETC Establishment
(Advanced Emission Test Centre AETC)
Inside of AETC
copy 2017 HORIBA Ltd All rights reserved 18
Auto ECT (HORIBA MIRA) Business
Sale decline caused by weaker GBP vs the JPY Investments of 30bn yen planned each in 2016
and 2017 while closely monitoring the Brexit impacts
Increased inquiries to MIRA Technology Park Accelerated global business (JapanAsia)
ECT Business (EngineeringHORIBA MIRA)
G7 transport ministersrsquo summit (held in Karuizawa Japan in Sep 2016)
Participation in the UK government autonomous driving car project
httpwwwukautodrivecomthe-uk-autodrive-project
George Gillespie CEO of HORIBA MIRA participated as a representative of UK
Main theme Autonomous driving 1 Development and dissemination of cutting-edge
technology regarding automobiles and roads 2 Basic policy for transportation infrastructure
Participated in Jaguar Land Roverrsquos testing contributed to the demonstration test of autonomous driving technology
Major participants Germany BMW France Renault Japan Toyota UK HORIBA MIRA
42 35
45
72 70
02468
2015 2016 2017
Backlog Sales
(Half-year Restated) (Forecast)
JPYGBP 185 yen 147 yen 140 yen
ECT Sales and Backlog (Billions of Yen)
copy 2017 HORIBA Ltd All rights reserved 19
bull Steady sales of stack gas analyzers in Japan
bull Robust process analytical measurement business (US)
bull Weak sales in EU and Asia
bull Expect steady sales to continue in Japan
bull Profitability improvement in gas measurement business
in HORIBA BIWAKO E-HARBOR
bull Increase RampD expenditure for water business
Automatic on-line analysis of PM components Integrate HORIBArsquos technology in and times Identify sources of origin of microparticles Enable 24-hour consecutive analysis of elements
Project to improve water quality of wastewater from dyeing factories Installing wastewater treatment systems and
water quality monitors in Myanmar Joint project with Hitachi Zosen Corporation
Ministry of Environment (MOE) plans to adopt HORIBArsquos products Scheduled to install devices at 4 sites in Japan
in Apr 2017
Designated one of the ldquoModel businesses to improve water environment in Asiardquo by MOE Started experimentation in Jan 2017
Demo facility installed in HORIBA BIWAKO E-HARBOR
PampE SCI
Facilities installed in Wundwin city Myanmar
Water quality analyzer
PM25 analyzer
copy 2017 HORIBA Ltd All rights reserved 21
Firm sales of CBC+CRP analyzers in Japan
Sales decrease in yen due to the yen appreciation
Steady growth in India
Expect firm sales of CBC+CRP analyzers in Japan
bull Accelerated sales expansion by introducing a new
Strategy to expand sales in mediumlarge-sized hematology analyzers Propose total solutions including a data
management system Expand business globally from 2Q of 2017
New brand ldquoYumizenrdquo
Medical Growth with New Brand and Service
Provide maintenance service system using IoT technology
for reducing device downtime
Enhance maintenance support by continuous monitoring amp diagnostic reports
Detect problems in advance and provide appropriate suggestions
Target 6000 contracts by 2020 in Japan Also plan to expand globally
携帯通信網使用
Distributors
Medical Certificate
Call Center
Customer
Through Mobile network
Coordination
Automatic Data Collection Monitoring
Server
Monitoring Machine Condition
Preventive Maintenance
copy 2017 HORIBA Ltd All rights reserved 23
(Billions of yen)
bull Record-high sales and operating profit due to increased investments by semiconductor manufacturers in Asia
bull Sales decrease in yen terms due to the appreciation of the yen
bull Investment to raise Aso factory production capacity Less-certain market outlook for the 2nd half Closely monitor investment trend in China
2016 Results Topics regarding the semiconductor industry and mass flow controller market Data centersrsquo shift to memory for storage Sharp increase in demand for
semiconductors Changes in manufacturing technology
Miniaturization 3D-NAND double-patterning rarr Increase in demand for etching devices Disciplined investment by semiconductor
manufacturers The silicon cycle to fluctuate less widely The market to stabilize
Cutting-edge technology of HORIBA and HORIBA Jobin Yvon Close relationship with academia
MESA-50T SEM-CL
For a rare metal manufacturer
Software development for rare metal analysis
Customized chamber
Specialized in defect
characterization Applied Topcon technology
Collaboration with Raman Testing for protein and
drugs
INV-XploRA
Cutting-edge material development
High concentration cell Minute amount
measurement
New market creation and product development to meet customerrsquos needs
LA-960
Imaging CL device (released in Aug 2016) Convert defective images into high-accuracy images Characteristic distribution analysis of phosphor parts of LED
elements Accelerate RampD for the next-generation power devices
HORIBA HORIBA Jobin Yvon
Electron beam technology of Topcon
New product by integrating HORIBA Grouprsquos technologies
Materials for semiconductors Life science sector
Imaging Cathodoluminescence (CL)
Scientific
copy 2017 HORIBA Ltd All rights reserved 27
Contents
2016 Results
2017 Forecast
Business Segment Outline
Shareholder Return
MLMAP2020 [2016-2020] Progress Financial Data Corporate profile
copy 2017 HORIBA Ltd All rights reserved 28
2015 Results 70 yen per share + 2016 Results 85 yen per share 2017 Forecast 90 yen per share
- Dividend payment + Share buyback = 30 of Consolidated net profit to be targeted - Remaining earnings are retained internally for strategic investment (ie facilities MampA)
(Yen) Per-share dividend (from 2002 to 2017 Forecast)
Basic policy (since 2013)
Dividends and Share buybacks
(fore)
2015 Share buyback 218400 shares
about 10 billion yen
Record high for 7 years in a row
An Average total return ratio of last 3years 292
copy 2017 HORIBA Ltd All rights reserved 29
Contents
2016 Results
2017 Forecast
Business Segment Outline
Shareholder Return
MLMAP2020 [2016-2020] Progress Financial Data Corporate profile
HORIBA Stained Glass Project Lunch gatherings of working mothers Seminars on how to balance long-term care and work Workshop to improve work productivity
Selected as one of New Diversity Management Selection 100 (by the Ministry of Economy Trade and Industry of Japan)
Reasons for the award Corporate motto ldquoJoy and Funrdquo and the Stained Glass Project
Mr Saito executive vice president and Ms Moriguchi leader of Stained Glass Project at the award-receiving ceremony
copy 2017 HORIBA Ltd All rights reserved 37
Decided to introduce a new KPI to measure asset efficiency Indicator composed of ldquoOperating profitrdquo and ldquoWACCrdquo Applying unit Business segments and Group companies Strengthen PDCA cycle Efficient use of business assets and increase profit
Plan to prepare a budget to this project in 2018
Founded financial subsidiaries in the US and the UK Improve capital efficiency through group financing Strengthen financial management function in each region
Enhance asset efficiency and maximize corporate value
Improve asset efficiency amp
Accelerate business growth
Investment
Business Growth
Cash Generation
copy 2017 HORIBA Ltd All rights reserved 38
Symbol of MLMAP2020
Step out of the existing business fields and pursue further expansion Take a new perspective and overcome technologicalmarketorganization barriers
Be flexible think outside the box and move up to the next stage
ONE STEP AHEAD - To create a next stage of HORIBA -
copy 2017 HORIBA Ltd All rights reserved 39
Contents
2016 Results
2017 Forecast
Business Segment Outline
Shareholder Return
MLMAP2020 [2016-2020] Progress Financial Data Corporate profile
PPampE Investment to MIRA(30BJYP) Depreciation Goodwill of MIRA(04BJYP) Biwako factory (07BJYP) RampD Increased in Automotive Test System Business
Good will of MIRA eg hellip Amortization included
2017 Topics
PPampE Investment to MIRA(30BJYP) Expansion of Aso Factory(27BJYP)
Depreciation Goodwill of MIRA(04BJYP) Increase in MIRA and Test center invested in 2016 RampD Increase in Auto and PampE Business
Capital Investment Depreciation RampD (Billions of yen)
全社実績
セグ実績
全社予算
全社予算2案
セグ予算
セグ予算2案
受注_残
半期予想
設備投資
HOR単体実績
HOR単体予算
HOR単体上期予算
copy 2017 HORIBA Ltd All rights reserved 45
241 Bond
redemption in 2020
Current ratio
280
2014 254 60
Short 66
Cash1
492
Bonds 150
Long 25
Cash1
478
Bonds 150
Long 22 Short 108
2013 269 60
447
Cash1
511
Bonds 150
Long 168
Short 128
2015 229 55
Borrowed from JBIC2
151bn yen (2015)
Capital ratio
467
2016 237 55
Cash1
519
Bonds 150
Long 192
Short 124
Cash Balance (Billions of yen)
(Consolidated basis each end of the year) Total Loan Balance
Conclusion of liquidation of receivable contract with 2 banks Recent issuer rating RampI [A-] (July 2016) JCR [A] (August 2016)
1 CashhellipCash and Cash Equivalents at End of Period 2 JBIC Japan Bank for International Cooperation
Graph1
Sheet1
Sheet1
現預金
短期
長期
社債
Sheet1 (2)
tajikaABX =gtHIL
tajikaSTEC=gtHOR
copy 2017 HORIBA Ltd All rights reserved 46
Contents
2016 Results
2017 Forecast
Business Segment Outline
Shareholder Return
MLMAP2020 [2016-2020]Progress Financial Data Corporate profile
copy 2017 HORIBA Ltd All rights reserved 47
Head office Kyoto Japan Founded 1945 Incorporated 1953 CEO Atsushi Horiba Fiscal year end December 31
Atsushi Horiba Chairman President amp CEO
- Corporate motto -
To have interest and pride in our work to enjoy our lives
Corporate Profile
copy 2017 HORIBA Ltd All rights reserved 48
Medical In-Vitro Diagnostic (IVD) Systems Integration of HORIBA ABXrsquos Technology amp Marketing Know-How
Automotive Test Systems Emission Measurement Systems (EMS) Mechatronics Devices (MCT) Driving Control Systems (ITS) Engineering Consultancy amp Testing (ECT)
Business Segments
Process amp Environmental Environmental Systems Environmental Radiation Monitor Environmental Regulation amp Process Business
Semiconductor Mass Flow Controller In-situ Analysis Synergy among HORIBA HQ HORIBA STEC and HORIBA Jobin Yvonrsquos Technologies
Scientific Synergy of HORIBA and HORIBA Jobin Yvonrsquos Technologies Raman Grating and Fluorescence
copy 2017 HORIBA Ltd All rights reserved 49
Sales 1700 Billions of Yen
Business Composition of Sales
Automotive Test Systems
Process amp Environmental
Medical
Semiconductor
Scientific
Automotive 622 (36)
Scientific 257 (15)
Semiconductor 388 (23)
Medical 265 (16)
PampE 167 (10)
Well Balanced Business Operation -Five Business Segments-
(Billions of Yen)
copy 2017 HORIBA Ltd All rights reserved 50
Market Shares
Market shares quoted are estimates by HORIBA
80 20 100
35
Emission Measurement Systems
57 30
Stack Gas Analyzers Automatic Blood Cell Counter plus CRP
Mass Flow Controllers Raman Spectrophotometers Gratings
Global Domestic
copy 2017 HORIBA Ltd All rights reserved 51
EU Japan
Asia Americas
33
26 18
23
Geographic Composition of Sales(2016)
HORIBA Worldwide
Sales of FY2016 1700 BJPY
The Number of Group Companies by region (As of December 31 2016)
America 9 Europe 23 Asia 17 (4 in Japan including HORIBA Ltd) Total 49
copy 2017 HORIBA Ltd All rights reserved 52
Japan 38
Other Asia 15
France 13
Germany 8
Other Europe 2 USA
10
Other Americas 3
7149
従業員数 2015年12月31日現在
2442
946
3761
UK 11
Employees by Region
Total Number of Employees (As of December 31 2016)
Total Asia 53
Total Europe 34
Total Americas 13
copy 2017 HORIBA Ltd All rights reserved 53 copy 2017 HORIBA Ltd All rights reserved 53
copy 2017 HORIBA Ltd All rights reserved 54
Danke
Grazie
Σας ευχαριστούμε
감사합니다
Obrigado
谢谢
ขอบคณครบ
ありがとうございました
धनयवाद
நனற
Cảm ơn
Dziękuję
Tack ska ni ha
Thank you
Merci
Gracias
Большое спасибо
スライド番号 1
Contents
Contents
スライド番号 4
Summary of 2016 Results
2016 full year results
2016 Results by Segment
Contents
2017 Market outlook
Exchange rate forecast for 2017
Forecast for 2017
Forecast for 2017 by segment
Contents
スライド番号 14
2016 Results and 2017 Forecast
Strategy for improving profitability
Regulatory trend in EMS (Emission Measurement System) and Operations in an emerging Market
ECT (HORIBA MIRA) Business
2016 Results and 2017 Forecast
Analysis technology for the environment
2016 Results and 2017 Forecast
Growth with New Brand and Service
2016 Results and 2017 Forecast
スライド番号 24
2016 Results and 2017 Forecast
Exploit new markets using HORIBA technology
Contents
Shareholder Return
Contents
スライド番号 30
スライド番号 31
スライド番号 32
Accelerate growth in water measuring business
Water measuring and analysisbusiness domain
Water measuring and analysisbusiness domain
Selected as one of New Diversity Management Selection 100 (by the Ministry of Economy Trade and Industry of Japan)
Enhance asset efficiency and maximize corporate value
Symbol of MLMAP2020
Contents
Trend of Market capitalization
Changed the accounting policy for revenue recognition
スライド番号 42
スライド番号 43
スライド番号 44
スライド番号 45
Contents
スライド番号 47
Business Segments
スライド番号 49
Market Shares
スライド番号 51
スライド番号 52
スライド番号 53
スライド番号 54
勘定科目
BS_CL12010
BS_CL12020
BS_CL12030
BS_FL21000
BS_FL23000
勘定科目名称
当座借越
短期借入金
1年内返済長期借入金
社債
長期借入金
HOR
0
(2000000000)
0
(10000000000)
0
日本 ニホン
ABX
(827350776)
(4016672108)
(534035942)
0
(1343663409)
欧州 オウシュウ
ASEC
0
(352000000)
0
0
(180000000)
日本 ニホン
HE
0
(1855530779)
0
0
0
欧州 オウシュウ
HIC
0
(1156081000)
(109236000)
0
(682725000)
米州 ベイシュウ
HIT
(99662290)
0
(200000000)
0
(300000000)
日本 ニホン
HSC
0
(20019305)
0
0
0
アジア
HST
0
(166375000)
0
0
0
アジア
JY
0
0
(9753688)
0
(105723687)
欧州 オウシュウ
会社間照合
0
(5047)
欧州 オウシュウ
会社間照合
200000000
日本 ニホン
会社間照合
480000000
日本 ニホン
会社間照合
2000000000
日本 ニホン
会社間照合
118647000
欧州 オウシュウ
会社間照合
175953553
欧州 オウシュウ
連結合計
(927013066)
(7272082686)
(653025630)
(10000000000)
(2132112096)
(99662290)
(352000000)
0
(10000000000)
0
日本 ニホン
(827350776)
(5577607381)
(543789630)
0
(1449387096)
欧州 オウシュウ
0
(1156081000)
(109236000)
0
(682725000)
米州 ベイシュウ
0
(186394305)
0
0
0
アジア
(927013066)
(7272082686)
(653025630)
(10000000000)
(2132112096)
2008
2009
2010
2011
2012
2013
2008
2008
2009
2009
2013
2013
2014
2014
2015
2015
2016
2016
短期借入金 タンキカリイレキン
8852
6618
5575
6684
5523
6606
現預金 ゲンヨキン
18267
21520
49246
51109
47859
51900
長期借入金 チョウキカリイレキン
2132
1730
1195
1291
2113
2576
短期 タンキ
8852
6618
6606
10832
12800
12400
社債 シャサイ
10000
10000
10000
10000
10000
15000
長期 チョウキ
2132
1730
2576
2209
16800
19200
現預金 ゲンヨキン
18267
21520
26958
28893
34685
42228
社債 シャサイ
10000
10000
15000
15000
15000
15000
流動比率 リュウドウヒリツ
2296
2524
2653
2806
2970
2690
自己資本比率 ジコシホンヒリツ
576
609
612
624
650
600
49246
6606
2576
15000
51109
10832
2209
15000
47859
12800
16800
15000
51900
12400
19200
15000
2013年実績 ネン ジッセキ
2014年実績 ネン ジッセキ
2015年計画 ネン ケイカク
増減
計画(GBM) ケイカク
発表案 ハッピョウ アン
vs 2014
売上高 ウリアゲ タカ
営業利益 エイギョウ リエキ
経常利益 ケイジョウ リエキ
当期純利益 トウキ ジュンリエキ
2013年 ネン
2014年 ネン
2015年 ネン
増減
実績
実績
計画(GBM) ケイカク
決定 ケッテイ
vs 2014
売上高 ウリアゲ タカ
営業利益 エイギョウ リエキ
経常利益 ケイジョウ リエキ
当期純利益 トウキ ジュンリエキ
営業利益率 エイギョウ リエキ リツ
2013実績 ジッセキ
2014年 ネン
増減
開示116 カイジ
実績 ジッセキ
vs 2013
売上高 ウリアゲ タカ
営業利益 エイギョウ リエキ
経常利益 ケイジョウ リエキ
当期純利益 トウキ ジュンリエキ
2015
2016
2017
Results
Forecast117
Results
vs 2015
vs Forecast117
Forecast
vs 2016
PPampE
148
153
134
-10
-12
146
+9
Intangibles
14
07
03
-75
-49
04
+11
Capital Investment
163
160
137
-15
-14
150
+9
Depreciation
61
65
68
+12
+5
72
+6
RampD
123
130
129
+5
-1
140
+8
(To net sales)
(7)
(8)
(8)
(8)
2014年 ネン
2015年 ネン
実績 ジッセキ
社内数値 シャナイ スウチ
発表案 ハッピョウ アン
上期 カミ キ
下期 シモキ
通期 ツウキ
上期 カミキ
下期 シモキ
通期 ツウキ
上期 カミ キ
下期 シモキ
通期 ツウキ
売上高 ウリアゲ ダカ
0
0
0
0
0
自動車 ジドウシャ
0
0
0
環境 カンキョウ
0
0
0
医用 イヨウ
0
0
0
半導体 ハンドウタイ
0
0
0
科学 カガク
0
0
0
営業利益 エイギョウ リエキ
0
0
0
0
0
自動車 ジドウシャ
0
0
0
環境 カンキョウ
0
0
0
医用 イヨウ
0
0
0
半導体 ハンドウタイ
0
0
0
科学 カガク
0
0
0
経常利益 ケイジョウ リエキ
0
0
当期純利益 トウキ ジュンリエキ
0
0
営業利益率 エイギョウ リエキ リツ
ERRORDIV0
ERRORDIV0
ERRORDIV0
ERRORDIV0
ERRORDIV0
ERRORDIV0
ERRORDIV0
ERRORDIV0
ERRORDIV0
自動車 ジドウシャ
ERRORDIV0
ERRORDIV0
ERRORDIV0
ERRORDIV0
ERRORDIV0
ERRORDIV0
ERRORDIV0
ERRORDIV0
ERRORDIV0
環境 カンキョウ
ERRORDIV0
ERRORDIV0
ERRORDIV0
ERRORDIV0
ERRORDIV0
ERRORDIV0
ERRORDIV0
ERRORDIV0
ERRORDIV0
医用 イヨウ
ERRORDIV0
ERRORDIV0
ERRORDIV0
ERRORDIV0
ERRORDIV0
ERRORDIV0
ERRORDIV0
ERRORDIV0
ERRORDIV0
半導体 ハンドウタイ
ERRORDIV0
ERRORDIV0
ERRORDIV0
ERRORDIV0
ERRORDIV0
ERRORDIV0
ERRORDIV0
ERRORDIV0
ERRORDIV0
科学 カガク
ERRORDIV0
ERRORDIV0
ERRORDIV0
ERRORDIV0
ERRORDIV0
ERRORDIV0
ERRORDIV0
ERRORDIV0
ERRORDIV0
受注実績 ジュチュウ ジッセキ
2013
2014
1Q
2Q
3Q
4Q
1Q
2Q
3Q
4Q
自動車
128
125
103
166
環境
39
38
41
40
医用
67
64
60
71
半導体
46
51
69
88
科学
53
61
61
77
合計
334
341
337
444
受注残 ジュチュウ ザン
2013
2014
1Q
2Q
3Q
4Q
1Q
2Q
3Q
4Q
自動車
314
335
325
314
環境
33
39
45
38
医用
30
27
24
23
半導体
20
15
25
31
科学
55
67
76
76
合計
454
486
497
484
受注実績 ジュチュウ ジッセキ
2013
2014
1Q
2Q
3Q
4Q
1Q
2Q
3Q
4Q
自動車
128
125
103
166
EMS
93
91
78
110
MCT
32
30
24
48
HIT
4
4
2
9
受注残 ジュチュウ ザン
2013
2014
推移 スイイ
1Q
2Q
3Q
4Q
1Q
2Q
3Q
4Q
自動車
314
335
325
314
EMS
173
188
195
177
MCT
135
142
125
128
HIT
5
5
4
7
売上高 ウリアゲ ダカ
営業利益 エイギョウ リエキ
2014
2015 計画 ケイカク
2014
2015 計画 ケイカク
実績 ジッセキ
社内数値 シャナイ スウチ
発表案① ハッピョウ アン
発表案② ハッピョウ アン
MLMAP2015年数値 ネン スウチ
実績 ジッセキ
社内数値 シャナイ スウチ
発表案① ハッピョウ アン
発表案② ハッピョウ アン
MLMAP2015年数値 ネン スウチ
vs 2014
vs 2014
対外発表 タイガイ ハッピョウ
社内数値 シャナイ スウチ
vs 2014
vs 2014
対外発表 タイガイ ハッピョウ
社内数値 シャナイ スウチ
自動車 ジドウシャ
環境 カンキョウ
医用 イヨウ
半導体 ハンドウタイ
科学 カガク
合計 ゴウケイ
営業利益 エイギョウ リエキ
2014
2015 計画 ケイカク
実績 ジッセキ
社内数値 シャナイ スウチ
発表案① ハッピョウ アン
発表案② ハッピョウ アン
MLMAP2015年数値 ネン スウチ
vs 2014
vs 2014
対外発表 タイガイ ハッピョウ
社内数値 シャナイ スウチ
自動車 ジドウシャ
環境 カンキョウ
医用 イヨウ
半導体 ハンドウタイ
科学 カガク
合計 ゴウケイ
売上高 ウリアゲ ダカ
営業利益 エイギョウ リエキ
2014
2015
2014
2015
実績 ジッセキ
社内数値 シャナイ スウチ
発表案 ハッピョウ アン
vs2014
実績 ジッセキ
社内数値 シャナイ スウチ
発表案 ハッピョウ アン
vs2014
自動車 ジドウシャ
環境 カンキョウ
医用 イヨウ
半導体 ハンドウタイ
科学 カガク
合計 ゴウケイ
2014
2015年計画 ネン ケイカク
実績 ジッセキ
社内数値 シャナイ スウチ
開示案① カイジ アン ハツアン
開示案② カイジ アン ハツアン
MLMAP2015年数値 ネン スウチ
市場 シジョウ
vs 2014
vs 2014
対外発表 タイガイ ハッピョウ
社内数値 シャナイ スウチ
8社平均 シャ ヘイキン
売上高 ウリアゲ タカ
営業利益 エイギョウ リエキ
経常利益 ケイジョウ リエキ
当期純利益 トウキ ジュンリエキ
営業利益率 エイギョウ リエキ リツ
ドル
ユーロ
配当(円1株) ハイトウ エン カブ
2014
2015
MLMAP2015年数値 ネン スウチ
市場 シジョウ
実績 ジッセキ
社内数値 シャナイ スウチ
発表案 ハッピョウ アン
vs2014
対外発表 タイガイ ハッピョウ
社内数値 シャナイ スウチ
8社平均 シャ ヘイキン
売上高 ウリアゲ タカ
営業利益 エイギョウ リエキ
経常利益 ケイジョウ リエキ
当期純利益 トウキ ジュンリエキ
営業利益率 エイギョウ リエキ リツ
ドル
ユーロ
配当(円1株) ハイトウ エン カブ
売上高 ウリアゲ ダカ
営業利益 エイギョウ リエキ
2013年 ネン
2014年 ネン
2013年 ネン
2014年 ネン
実績 ジッセキ
開示116 カイジ
実績 ジッセキ
増減vsv2013 ゾウゲン
実績 ジッセキ
開示116 カイジ
実績 ジッセキ
増減vsv2013 ゾウゲン
自動車 ジドウシャ
環境 カンキョウ
医用 イヨウ
半導体 ハンドウタイ
科学 カガク
合計 ゴウケイ
2013年 ネン
2014年 ネン
増減比較 ゾウゲン ヒカク
市場 シジョウ
実績 ジッセキ
開示(116) カイジ
実績(監査前) ジッセキ カンサ マエ
vs 13年 ネン
vs 開示 カイジ
8社平均 シャ ヘイキン
売上高 ウリアゲ タカ
営業利益 エイギョウ リエキ
経常利益 ケイジョウ リエキ
当期純利益 トウキ ジュンリエキ
営業利益率 エイギョウ リエキ リツ
配当 ハイトウ
配当性向 ハイトウ セイコウ
為替レート(累計)
ドル
ユーロ
2015
2016
Variation
Cash flows from operating activities
14770
15871
1101
Cash flows from investing activities
-30642
-10427
20214
Cash flows from financing activities
12843
-451
-13294
Cash and cash equivalents at end of year
47859
51940
4081
Free cash flows
-15872
5443
21315
Changed points
Original
Shipment base
New
The date of delivery or installation based on contractual arrangements
Applied timing
January 2016
Reason for change
Triggered by the introduction of a new ERP implementation to harmonize with international accounting standards
2008
2009
2010
2011
2012
2013
2014
2015
2015
2016
2017
売上高
542
371
357
386
432
495
550
642
654
622
690
営業利益
72
18
16
28
44
42
58
44
52
35
52
2008
2008
2009
2009
2010
2010
2011
2011
2012
2012
2013
2013
2014
2014
2015
2015
2015
2015
2016
2016
2017
2017
Graph1
売上高
営業利益
690
542
72
371
18
357
16
386
28
432
44
495
42
55
58
642
44
654
52
622
35
69
52
Sheet1
Sheet1
売上高
REF
REF
Sheet2
Sheet3
copy 2017 HORIBA Ltd All rights reserved 16
95 110 128 133 108 152
81 116
145 162
197
132
180
2011 2012 2013 2014 2015 2016 2017
BacklogSales
Auto Strategy for improving profitability
[Problem] Long waiting in the design process
[Solution] Reduce design work by standardizing specs
0
10
20
30
40
50
60
70
Aug2015 Feb2016 Aug2016
(days)
60 days in Aug 2015
11days in Aug 2016
Shorten the lead time in the specification-design stage
Lead time from specification adoption to design completion
Significant recovery is expected in 2017 Pick up in automakersrsquo investments Improve order booking by expanding turn-
key projects (in Japan EU the US) Focus on improving profitability Tighter management of project progress
Inquiry
Determ
ine S
pecification
Design
Procure
Product
Installment
Test
Inspection
Collection
Aim at cutting the lead time to one-third
- HORIBA BIWAKO E-HARBOR - MCT
MCT business improves profitability
MCT Sales and Order Backlog (Billions of yen)
(Forecast)
Case of the MEXA series middle-sized EMS product
The lead time was shortened to 15
(Restated)
copy 2017 HORIBA Ltd All rights reserved 17
EMS Sales and Order Backlog (Billions of yen)
137 169 179 202 269 294
265 286 333
374 398 401 420
0
15
30
45
2011 2012 2013 2014 2015 2016 2017
Backlog Sales
Open November 2016
Location Pune western India (Center of Auto Business)
Function Indoor Automotive test Product
customizationTraining
Objective Strengthen demonstration
test and application
development
Regulatory trend in EMS (Emission Measurement System) and Operations in an emerging Market Auto
Regulatory trend Solid sales in Japan (automakers parts makers) Steady investment in Japan WLTP(unified emission regulations by the UN) Start in Sep 2017 in EU and in 2018 in Japan RDE (Real Driving Emission on-road test) regulation Start in Sep 2017 in EU WLTPhellipWorldwide harmonized Light vehicles Test Procedure
HORIBA India Technical Center Establishment
Overview HORIBA India Technical center
(Forecast) (Restated)
Open July 2017 (Plan)
Location Nuneaton Warwickshire UK
Function Cutting-edge Emission Testing Lab (applied
for RDE regulation)
Objective Strengthen
demonstration test
HORIBA MIRA AETC Establishment
(Advanced Emission Test Centre AETC)
Inside of AETC
copy 2017 HORIBA Ltd All rights reserved 18
Auto ECT (HORIBA MIRA) Business
Sale decline caused by weaker GBP vs the JPY Investments of 30bn yen planned each in 2016
and 2017 while closely monitoring the Brexit impacts
Increased inquiries to MIRA Technology Park Accelerated global business (JapanAsia)
ECT Business (EngineeringHORIBA MIRA)
G7 transport ministersrsquo summit (held in Karuizawa Japan in Sep 2016)
Participation in the UK government autonomous driving car project
httpwwwukautodrivecomthe-uk-autodrive-project
George Gillespie CEO of HORIBA MIRA participated as a representative of UK
Main theme Autonomous driving 1 Development and dissemination of cutting-edge
technology regarding automobiles and roads 2 Basic policy for transportation infrastructure
Participated in Jaguar Land Roverrsquos testing contributed to the demonstration test of autonomous driving technology
Major participants Germany BMW France Renault Japan Toyota UK HORIBA MIRA
42 35
45
72 70
02468
2015 2016 2017
Backlog Sales
(Half-year Restated) (Forecast)
JPYGBP 185 yen 147 yen 140 yen
ECT Sales and Backlog (Billions of Yen)
copy 2017 HORIBA Ltd All rights reserved 19
bull Steady sales of stack gas analyzers in Japan
bull Robust process analytical measurement business (US)
bull Weak sales in EU and Asia
bull Expect steady sales to continue in Japan
bull Profitability improvement in gas measurement business
in HORIBA BIWAKO E-HARBOR
bull Increase RampD expenditure for water business
Automatic on-line analysis of PM components Integrate HORIBArsquos technology in and times Identify sources of origin of microparticles Enable 24-hour consecutive analysis of elements
Project to improve water quality of wastewater from dyeing factories Installing wastewater treatment systems and
water quality monitors in Myanmar Joint project with Hitachi Zosen Corporation
Ministry of Environment (MOE) plans to adopt HORIBArsquos products Scheduled to install devices at 4 sites in Japan
in Apr 2017
Designated one of the ldquoModel businesses to improve water environment in Asiardquo by MOE Started experimentation in Jan 2017
Demo facility installed in HORIBA BIWAKO E-HARBOR
PampE SCI
Facilities installed in Wundwin city Myanmar
Water quality analyzer
PM25 analyzer
copy 2017 HORIBA Ltd All rights reserved 21
Firm sales of CBC+CRP analyzers in Japan
Sales decrease in yen due to the yen appreciation
Steady growth in India
Expect firm sales of CBC+CRP analyzers in Japan
bull Accelerated sales expansion by introducing a new
Strategy to expand sales in mediumlarge-sized hematology analyzers Propose total solutions including a data
management system Expand business globally from 2Q of 2017
New brand ldquoYumizenrdquo
Medical Growth with New Brand and Service
Provide maintenance service system using IoT technology
for reducing device downtime
Enhance maintenance support by continuous monitoring amp diagnostic reports
Detect problems in advance and provide appropriate suggestions
Target 6000 contracts by 2020 in Japan Also plan to expand globally
携帯通信網使用
Distributors
Medical Certificate
Call Center
Customer
Through Mobile network
Coordination
Automatic Data Collection Monitoring
Server
Monitoring Machine Condition
Preventive Maintenance
copy 2017 HORIBA Ltd All rights reserved 23
(Billions of yen)
bull Record-high sales and operating profit due to increased investments by semiconductor manufacturers in Asia
bull Sales decrease in yen terms due to the appreciation of the yen
bull Investment to raise Aso factory production capacity Less-certain market outlook for the 2nd half Closely monitor investment trend in China
2016 Results Topics regarding the semiconductor industry and mass flow controller market Data centersrsquo shift to memory for storage Sharp increase in demand for
semiconductors Changes in manufacturing technology
Miniaturization 3D-NAND double-patterning rarr Increase in demand for etching devices Disciplined investment by semiconductor
manufacturers The silicon cycle to fluctuate less widely The market to stabilize
Cutting-edge technology of HORIBA and HORIBA Jobin Yvon Close relationship with academia
MESA-50T SEM-CL
For a rare metal manufacturer
Software development for rare metal analysis
Customized chamber
Specialized in defect
characterization Applied Topcon technology
Collaboration with Raman Testing for protein and
drugs
INV-XploRA
Cutting-edge material development
High concentration cell Minute amount
measurement
New market creation and product development to meet customerrsquos needs
LA-960
Imaging CL device (released in Aug 2016) Convert defective images into high-accuracy images Characteristic distribution analysis of phosphor parts of LED
elements Accelerate RampD for the next-generation power devices
HORIBA HORIBA Jobin Yvon
Electron beam technology of Topcon
New product by integrating HORIBA Grouprsquos technologies
Materials for semiconductors Life science sector
Imaging Cathodoluminescence (CL)
Scientific
copy 2017 HORIBA Ltd All rights reserved 27
Contents
2016 Results
2017 Forecast
Business Segment Outline
Shareholder Return
MLMAP2020 [2016-2020] Progress Financial Data Corporate profile
copy 2017 HORIBA Ltd All rights reserved 28
2015 Results 70 yen per share + 2016 Results 85 yen per share 2017 Forecast 90 yen per share
- Dividend payment + Share buyback = 30 of Consolidated net profit to be targeted - Remaining earnings are retained internally for strategic investment (ie facilities MampA)
(Yen) Per-share dividend (from 2002 to 2017 Forecast)
Basic policy (since 2013)
Dividends and Share buybacks
(fore)
2015 Share buyback 218400 shares
about 10 billion yen
Record high for 7 years in a row
An Average total return ratio of last 3years 292
copy 2017 HORIBA Ltd All rights reserved 29
Contents
2016 Results
2017 Forecast
Business Segment Outline
Shareholder Return
MLMAP2020 [2016-2020] Progress Financial Data Corporate profile
HORIBA Stained Glass Project Lunch gatherings of working mothers Seminars on how to balance long-term care and work Workshop to improve work productivity
Selected as one of New Diversity Management Selection 100 (by the Ministry of Economy Trade and Industry of Japan)
Reasons for the award Corporate motto ldquoJoy and Funrdquo and the Stained Glass Project
Mr Saito executive vice president and Ms Moriguchi leader of Stained Glass Project at the award-receiving ceremony
copy 2017 HORIBA Ltd All rights reserved 37
Decided to introduce a new KPI to measure asset efficiency Indicator composed of ldquoOperating profitrdquo and ldquoWACCrdquo Applying unit Business segments and Group companies Strengthen PDCA cycle Efficient use of business assets and increase profit
Plan to prepare a budget to this project in 2018
Founded financial subsidiaries in the US and the UK Improve capital efficiency through group financing Strengthen financial management function in each region
Enhance asset efficiency and maximize corporate value
Improve asset efficiency amp
Accelerate business growth
Investment
Business Growth
Cash Generation
copy 2017 HORIBA Ltd All rights reserved 38
Symbol of MLMAP2020
Step out of the existing business fields and pursue further expansion Take a new perspective and overcome technologicalmarketorganization barriers
Be flexible think outside the box and move up to the next stage
ONE STEP AHEAD - To create a next stage of HORIBA -
copy 2017 HORIBA Ltd All rights reserved 39
Contents
2016 Results
2017 Forecast
Business Segment Outline
Shareholder Return
MLMAP2020 [2016-2020] Progress Financial Data Corporate profile
PPampE Investment to MIRA(30BJYP) Depreciation Goodwill of MIRA(04BJYP) Biwako factory (07BJYP) RampD Increased in Automotive Test System Business
Good will of MIRA eg hellip Amortization included
2017 Topics
PPampE Investment to MIRA(30BJYP) Expansion of Aso Factory(27BJYP)
Depreciation Goodwill of MIRA(04BJYP) Increase in MIRA and Test center invested in 2016 RampD Increase in Auto and PampE Business
Capital Investment Depreciation RampD (Billions of yen)
全社実績
セグ実績
全社予算
全社予算2案
セグ予算
セグ予算2案
受注_残
半期予想
設備投資
HOR単体実績
HOR単体予算
HOR単体上期予算
copy 2017 HORIBA Ltd All rights reserved 45
241 Bond
redemption in 2020
Current ratio
280
2014 254 60
Short 66
Cash1
492
Bonds 150
Long 25
Cash1
478
Bonds 150
Long 22 Short 108
2013 269 60
447
Cash1
511
Bonds 150
Long 168
Short 128
2015 229 55
Borrowed from JBIC2
151bn yen (2015)
Capital ratio
467
2016 237 55
Cash1
519
Bonds 150
Long 192
Short 124
Cash Balance (Billions of yen)
(Consolidated basis each end of the year) Total Loan Balance
Conclusion of liquidation of receivable contract with 2 banks Recent issuer rating RampI [A-] (July 2016) JCR [A] (August 2016)
1 CashhellipCash and Cash Equivalents at End of Period 2 JBIC Japan Bank for International Cooperation
Graph1
Sheet1
Sheet1
現預金
短期
長期
社債
Sheet1 (2)
tajikaABX =gtHIL
tajikaSTEC=gtHOR
copy 2017 HORIBA Ltd All rights reserved 46
Contents
2016 Results
2017 Forecast
Business Segment Outline
Shareholder Return
MLMAP2020 [2016-2020]Progress Financial Data Corporate profile
copy 2017 HORIBA Ltd All rights reserved 47
Head office Kyoto Japan Founded 1945 Incorporated 1953 CEO Atsushi Horiba Fiscal year end December 31
Atsushi Horiba Chairman President amp CEO
- Corporate motto -
To have interest and pride in our work to enjoy our lives
Corporate Profile
copy 2017 HORIBA Ltd All rights reserved 48
Medical In-Vitro Diagnostic (IVD) Systems Integration of HORIBA ABXrsquos Technology amp Marketing Know-How
Automotive Test Systems Emission Measurement Systems (EMS) Mechatronics Devices (MCT) Driving Control Systems (ITS) Engineering Consultancy amp Testing (ECT)
Business Segments
Process amp Environmental Environmental Systems Environmental Radiation Monitor Environmental Regulation amp Process Business
Semiconductor Mass Flow Controller In-situ Analysis Synergy among HORIBA HQ HORIBA STEC and HORIBA Jobin Yvonrsquos Technologies
Scientific Synergy of HORIBA and HORIBA Jobin Yvonrsquos Technologies Raman Grating and Fluorescence
copy 2017 HORIBA Ltd All rights reserved 49
Sales 1700 Billions of Yen
Business Composition of Sales
Automotive Test Systems
Process amp Environmental
Medical
Semiconductor
Scientific
Automotive 622 (36)
Scientific 257 (15)
Semiconductor 388 (23)
Medical 265 (16)
PampE 167 (10)
Well Balanced Business Operation -Five Business Segments-
(Billions of Yen)
copy 2017 HORIBA Ltd All rights reserved 50
Market Shares
Market shares quoted are estimates by HORIBA
80 20 100
35
Emission Measurement Systems
57 30
Stack Gas Analyzers Automatic Blood Cell Counter plus CRP
Mass Flow Controllers Raman Spectrophotometers Gratings
Global Domestic
copy 2017 HORIBA Ltd All rights reserved 51
EU Japan
Asia Americas
33
26 18
23
Geographic Composition of Sales(2016)
HORIBA Worldwide
Sales of FY2016 1700 BJPY
The Number of Group Companies by region (As of December 31 2016)
America 9 Europe 23 Asia 17 (4 in Japan including HORIBA Ltd) Total 49
copy 2017 HORIBA Ltd All rights reserved 52
Japan 38
Other Asia 15
France 13
Germany 8
Other Europe 2 USA
10
Other Americas 3
7149
従業員数 2015年12月31日現在
2442
946
3761
UK 11
Employees by Region
Total Number of Employees (As of December 31 2016)
Total Asia 53
Total Europe 34
Total Americas 13
copy 2017 HORIBA Ltd All rights reserved 53 copy 2017 HORIBA Ltd All rights reserved 53
copy 2017 HORIBA Ltd All rights reserved 54
Danke
Grazie
Σας ευχαριστούμε
감사합니다
Obrigado
谢谢
ขอบคณครบ
ありがとうございました
धनयवाद
நனற
Cảm ơn
Dziękuję
Tack ska ni ha
Thank you
Merci
Gracias
Большое спасибо
スライド番号 1
Contents
Contents
スライド番号 4
Summary of 2016 Results
2016 full year results
2016 Results by Segment
Contents
2017 Market outlook
Exchange rate forecast for 2017
Forecast for 2017
Forecast for 2017 by segment
Contents
スライド番号 14
2016 Results and 2017 Forecast
Strategy for improving profitability
Regulatory trend in EMS (Emission Measurement System) and Operations in an emerging Market
ECT (HORIBA MIRA) Business
2016 Results and 2017 Forecast
Analysis technology for the environment
2016 Results and 2017 Forecast
Growth with New Brand and Service
2016 Results and 2017 Forecast
スライド番号 24
2016 Results and 2017 Forecast
Exploit new markets using HORIBA technology
Contents
Shareholder Return
Contents
スライド番号 30
スライド番号 31
スライド番号 32
Accelerate growth in water measuring business
Water measuring and analysisbusiness domain
Water measuring and analysisbusiness domain
Selected as one of New Diversity Management Selection 100 (by the Ministry of Economy Trade and Industry of Japan)
Enhance asset efficiency and maximize corporate value
Symbol of MLMAP2020
Contents
Trend of Market capitalization
Changed the accounting policy for revenue recognition
スライド番号 42
スライド番号 43
スライド番号 44
スライド番号 45
Contents
スライド番号 47
Business Segments
スライド番号 49
Market Shares
スライド番号 51
スライド番号 52
スライド番号 53
スライド番号 54
勘定科目
BS_CL12010
BS_CL12020
BS_CL12030
BS_FL21000
BS_FL23000
勘定科目名称
当座借越
短期借入金
1年内返済長期借入金
社債
長期借入金
HOR
0
(2000000000)
0
(10000000000)
0
日本 ニホン
ABX
(827350776)
(4016672108)
(534035942)
0
(1343663409)
欧州 オウシュウ
ASEC
0
(352000000)
0
0
(180000000)
日本 ニホン
HE
0
(1855530779)
0
0
0
欧州 オウシュウ
HIC
0
(1156081000)
(109236000)
0
(682725000)
米州 ベイシュウ
HIT
(99662290)
0
(200000000)
0
(300000000)
日本 ニホン
HSC
0
(20019305)
0
0
0
アジア
HST
0
(166375000)
0
0
0
アジア
JY
0
0
(9753688)
0
(105723687)
欧州 オウシュウ
会社間照合
0
(5047)
欧州 オウシュウ
会社間照合
200000000
日本 ニホン
会社間照合
480000000
日本 ニホン
会社間照合
2000000000
日本 ニホン
会社間照合
118647000
欧州 オウシュウ
会社間照合
175953553
欧州 オウシュウ
連結合計
(927013066)
(7272082686)
(653025630)
(10000000000)
(2132112096)
(99662290)
(352000000)
0
(10000000000)
0
日本 ニホン
(827350776)
(5577607381)
(543789630)
0
(1449387096)
欧州 オウシュウ
0
(1156081000)
(109236000)
0
(682725000)
米州 ベイシュウ
0
(186394305)
0
0
0
アジア
(927013066)
(7272082686)
(653025630)
(10000000000)
(2132112096)
2008
2009
2010
2011
2012
2013
2008
2008
2009
2009
2013
2013
2014
2014
2015
2015
2016
2016
短期借入金 タンキカリイレキン
8852
6618
5575
6684
5523
6606
現預金 ゲンヨキン
18267
21520
49246
51109
47859
51900
長期借入金 チョウキカリイレキン
2132
1730
1195
1291
2113
2576
短期 タンキ
8852
6618
6606
10832
12800
12400
社債 シャサイ
10000
10000
10000
10000
10000
15000
長期 チョウキ
2132
1730
2576
2209
16800
19200
現預金 ゲンヨキン
18267
21520
26958
28893
34685
42228
社債 シャサイ
10000
10000
15000
15000
15000
15000
流動比率 リュウドウヒリツ
2296
2524
2653
2806
2970
2690
自己資本比率 ジコシホンヒリツ
576
609
612
624
650
600
49246
6606
2576
15000
51109
10832
2209
15000
47859
12800
16800
15000
51900
12400
19200
15000
2013年実績 ネン ジッセキ
2014年実績 ネン ジッセキ
2015年計画 ネン ケイカク
増減
計画(GBM) ケイカク
発表案 ハッピョウ アン
vs 2014
売上高 ウリアゲ タカ
営業利益 エイギョウ リエキ
経常利益 ケイジョウ リエキ
当期純利益 トウキ ジュンリエキ
2013年 ネン
2014年 ネン
2015年 ネン
増減
実績
実績
計画(GBM) ケイカク
決定 ケッテイ
vs 2014
売上高 ウリアゲ タカ
営業利益 エイギョウ リエキ
経常利益 ケイジョウ リエキ
当期純利益 トウキ ジュンリエキ
営業利益率 エイギョウ リエキ リツ
2013実績 ジッセキ
2014年 ネン
増減
開示116 カイジ
実績 ジッセキ
vs 2013
売上高 ウリアゲ タカ
営業利益 エイギョウ リエキ
経常利益 ケイジョウ リエキ
当期純利益 トウキ ジュンリエキ
2015
2016
2017
Results
Forecast117
Results
vs 2015
vs Forecast117
Forecast
vs 2016
PPampE
148
153
134
-10
-12
146
+9
Intangibles
14
07
03
-75
-49
04
+11
Capital Investment
163
160
137
-15
-14
150
+9
Depreciation
61
65
68
+12
+5
72
+6
RampD
123
130
129
+5
-1
140
+8
(To net sales)
(7)
(8)
(8)
(8)
2014年 ネン
2015年 ネン
実績 ジッセキ
社内数値 シャナイ スウチ
発表案 ハッピョウ アン
上期 カミ キ
下期 シモキ
通期 ツウキ
上期 カミキ
下期 シモキ
通期 ツウキ
上期 カミ キ
下期 シモキ
通期 ツウキ
売上高 ウリアゲ ダカ
0
0
0
0
0
自動車 ジドウシャ
0
0
0
環境 カンキョウ
0
0
0
医用 イヨウ
0
0
0
半導体 ハンドウタイ
0
0
0
科学 カガク
0
0
0
営業利益 エイギョウ リエキ
0
0
0
0
0
自動車 ジドウシャ
0
0
0
環境 カンキョウ
0
0
0
医用 イヨウ
0
0
0
半導体 ハンドウタイ
0
0
0
科学 カガク
0
0
0
経常利益 ケイジョウ リエキ
0
0
当期純利益 トウキ ジュンリエキ
0
0
営業利益率 エイギョウ リエキ リツ
ERRORDIV0
ERRORDIV0
ERRORDIV0
ERRORDIV0
ERRORDIV0
ERRORDIV0
ERRORDIV0
ERRORDIV0
ERRORDIV0
自動車 ジドウシャ
ERRORDIV0
ERRORDIV0
ERRORDIV0
ERRORDIV0
ERRORDIV0
ERRORDIV0
ERRORDIV0
ERRORDIV0
ERRORDIV0
環境 カンキョウ
ERRORDIV0
ERRORDIV0
ERRORDIV0
ERRORDIV0
ERRORDIV0
ERRORDIV0
ERRORDIV0
ERRORDIV0
ERRORDIV0
医用 イヨウ
ERRORDIV0
ERRORDIV0
ERRORDIV0
ERRORDIV0
ERRORDIV0
ERRORDIV0
ERRORDIV0
ERRORDIV0
ERRORDIV0
半導体 ハンドウタイ
ERRORDIV0
ERRORDIV0
ERRORDIV0
ERRORDIV0
ERRORDIV0
ERRORDIV0
ERRORDIV0
ERRORDIV0
ERRORDIV0
科学 カガク
ERRORDIV0
ERRORDIV0
ERRORDIV0
ERRORDIV0
ERRORDIV0
ERRORDIV0
ERRORDIV0
ERRORDIV0
ERRORDIV0
受注実績 ジュチュウ ジッセキ
2013
2014
1Q
2Q
3Q
4Q
1Q
2Q
3Q
4Q
自動車
128
125
103
166
環境
39
38
41
40
医用
67
64
60
71
半導体
46
51
69
88
科学
53
61
61
77
合計
334
341
337
444
受注残 ジュチュウ ザン
2013
2014
1Q
2Q
3Q
4Q
1Q
2Q
3Q
4Q
自動車
314
335
325
314
環境
33
39
45
38
医用
30
27
24
23
半導体
20
15
25
31
科学
55
67
76
76
合計
454
486
497
484
受注実績 ジュチュウ ジッセキ
2013
2014
1Q
2Q
3Q
4Q
1Q
2Q
3Q
4Q
自動車
128
125
103
166
EMS
93
91
78
110
MCT
32
30
24
48
HIT
4
4
2
9
受注残 ジュチュウ ザン
2013
2014
推移 スイイ
1Q
2Q
3Q
4Q
1Q
2Q
3Q
4Q
自動車
314
335
325
314
EMS
173
188
195
177
MCT
135
142
125
128
HIT
5
5
4
7
売上高 ウリアゲ ダカ
営業利益 エイギョウ リエキ
2014
2015 計画 ケイカク
2014
2015 計画 ケイカク
実績 ジッセキ
社内数値 シャナイ スウチ
発表案① ハッピョウ アン
発表案② ハッピョウ アン
MLMAP2015年数値 ネン スウチ
実績 ジッセキ
社内数値 シャナイ スウチ
発表案① ハッピョウ アン
発表案② ハッピョウ アン
MLMAP2015年数値 ネン スウチ
vs 2014
vs 2014
対外発表 タイガイ ハッピョウ
社内数値 シャナイ スウチ
vs 2014
vs 2014
対外発表 タイガイ ハッピョウ
社内数値 シャナイ スウチ
自動車 ジドウシャ
環境 カンキョウ
医用 イヨウ
半導体 ハンドウタイ
科学 カガク
合計 ゴウケイ
営業利益 エイギョウ リエキ
2014
2015 計画 ケイカク
実績 ジッセキ
社内数値 シャナイ スウチ
発表案① ハッピョウ アン
発表案② ハッピョウ アン
MLMAP2015年数値 ネン スウチ
vs 2014
vs 2014
対外発表 タイガイ ハッピョウ
社内数値 シャナイ スウチ
自動車 ジドウシャ
環境 カンキョウ
医用 イヨウ
半導体 ハンドウタイ
科学 カガク
合計 ゴウケイ
売上高 ウリアゲ ダカ
営業利益 エイギョウ リエキ
2014
2015
2014
2015
実績 ジッセキ
社内数値 シャナイ スウチ
発表案 ハッピョウ アン
vs2014
実績 ジッセキ
社内数値 シャナイ スウチ
発表案 ハッピョウ アン
vs2014
自動車 ジドウシャ
環境 カンキョウ
医用 イヨウ
半導体 ハンドウタイ
科学 カガク
合計 ゴウケイ
2014
2015年計画 ネン ケイカク
実績 ジッセキ
社内数値 シャナイ スウチ
開示案① カイジ アン ハツアン
開示案② カイジ アン ハツアン
MLMAP2015年数値 ネン スウチ
市場 シジョウ
vs 2014
vs 2014
対外発表 タイガイ ハッピョウ
社内数値 シャナイ スウチ
8社平均 シャ ヘイキン
売上高 ウリアゲ タカ
営業利益 エイギョウ リエキ
経常利益 ケイジョウ リエキ
当期純利益 トウキ ジュンリエキ
営業利益率 エイギョウ リエキ リツ
ドル
ユーロ
配当(円1株) ハイトウ エン カブ
2014
2015
MLMAP2015年数値 ネン スウチ
市場 シジョウ
実績 ジッセキ
社内数値 シャナイ スウチ
発表案 ハッピョウ アン
vs2014
対外発表 タイガイ ハッピョウ
社内数値 シャナイ スウチ
8社平均 シャ ヘイキン
売上高 ウリアゲ タカ
営業利益 エイギョウ リエキ
経常利益 ケイジョウ リエキ
当期純利益 トウキ ジュンリエキ
営業利益率 エイギョウ リエキ リツ
ドル
ユーロ
配当(円1株) ハイトウ エン カブ
売上高 ウリアゲ ダカ
営業利益 エイギョウ リエキ
2013年 ネン
2014年 ネン
2013年 ネン
2014年 ネン
実績 ジッセキ
開示116 カイジ
実績 ジッセキ
増減vsv2013 ゾウゲン
実績 ジッセキ
開示116 カイジ
実績 ジッセキ
増減vsv2013 ゾウゲン
自動車 ジドウシャ
環境 カンキョウ
医用 イヨウ
半導体 ハンドウタイ
科学 カガク
合計 ゴウケイ
2013年 ネン
2014年 ネン
増減比較 ゾウゲン ヒカク
市場 シジョウ
実績 ジッセキ
開示(116) カイジ
実績(監査前) ジッセキ カンサ マエ
vs 13年 ネン
vs 開示 カイジ
8社平均 シャ ヘイキン
売上高 ウリアゲ タカ
営業利益 エイギョウ リエキ
経常利益 ケイジョウ リエキ
当期純利益 トウキ ジュンリエキ
営業利益率 エイギョウ リエキ リツ
配当 ハイトウ
配当性向 ハイトウ セイコウ
為替レート(累計)
ドル
ユーロ
2015
2016
Variation
Cash flows from operating activities
14770
15871
1101
Cash flows from investing activities
-30642
-10427
20214
Cash flows from financing activities
12843
-451
-13294
Cash and cash equivalents at end of year
47859
51940
4081
Free cash flows
-15872
5443
21315
Changed points
Original
Shipment base
New
The date of delivery or installation based on contractual arrangements
Applied timing
January 2016
Reason for change
Triggered by the introduction of a new ERP implementation to harmonize with international accounting standards
2008
2009
2010
2011
2012
2013
2014
2015
2015
2016
2017
売上高
542
371
357
386
432
495
550
642
654
622
690
営業利益
72
18
16
28
44
42
58
44
52
35
52
2008
2008
2009
2009
2010
2010
2011
2011
2012
2012
2013
2013
2014
2014
2015
2015
2015
2015
2016
2016
2017
2017
Sheet1
Sheet1
売上高
REF
REF
Sheet2
Sheet3
copy 2017 HORIBA Ltd All rights reserved 16
95 110 128 133 108 152
81 116
145 162
197
132
180
2011 2012 2013 2014 2015 2016 2017
BacklogSales
Auto Strategy for improving profitability
[Problem] Long waiting in the design process
[Solution] Reduce design work by standardizing specs
0
10
20
30
40
50
60
70
Aug2015 Feb2016 Aug2016
(days)
60 days in Aug 2015
11days in Aug 2016
Shorten the lead time in the specification-design stage
Lead time from specification adoption to design completion
Significant recovery is expected in 2017 Pick up in automakersrsquo investments Improve order booking by expanding turn-
key projects (in Japan EU the US) Focus on improving profitability Tighter management of project progress
Inquiry
Determ
ine S
pecification
Design
Procure
Product
Installment
Test
Inspection
Collection
Aim at cutting the lead time to one-third
- HORIBA BIWAKO E-HARBOR - MCT
MCT business improves profitability
MCT Sales and Order Backlog (Billions of yen)
(Forecast)
Case of the MEXA series middle-sized EMS product
The lead time was shortened to 15
(Restated)
copy 2017 HORIBA Ltd All rights reserved 17
EMS Sales and Order Backlog (Billions of yen)
137 169 179 202 269 294
265 286 333
374 398 401 420
0
15
30
45
2011 2012 2013 2014 2015 2016 2017
Backlog Sales
Open November 2016
Location Pune western India (Center of Auto Business)
Function Indoor Automotive test Product
customizationTraining
Objective Strengthen demonstration
test and application
development
Regulatory trend in EMS (Emission Measurement System) and Operations in an emerging Market Auto
Regulatory trend Solid sales in Japan (automakers parts makers) Steady investment in Japan WLTP(unified emission regulations by the UN) Start in Sep 2017 in EU and in 2018 in Japan RDE (Real Driving Emission on-road test) regulation Start in Sep 2017 in EU WLTPhellipWorldwide harmonized Light vehicles Test Procedure
HORIBA India Technical Center Establishment
Overview HORIBA India Technical center
(Forecast) (Restated)
Open July 2017 (Plan)
Location Nuneaton Warwickshire UK
Function Cutting-edge Emission Testing Lab (applied
for RDE regulation)
Objective Strengthen
demonstration test
HORIBA MIRA AETC Establishment
(Advanced Emission Test Centre AETC)
Inside of AETC
copy 2017 HORIBA Ltd All rights reserved 18
Auto ECT (HORIBA MIRA) Business
Sale decline caused by weaker GBP vs the JPY Investments of 30bn yen planned each in 2016
and 2017 while closely monitoring the Brexit impacts
Increased inquiries to MIRA Technology Park Accelerated global business (JapanAsia)
ECT Business (EngineeringHORIBA MIRA)
G7 transport ministersrsquo summit (held in Karuizawa Japan in Sep 2016)
Participation in the UK government autonomous driving car project
httpwwwukautodrivecomthe-uk-autodrive-project
George Gillespie CEO of HORIBA MIRA participated as a representative of UK
Main theme Autonomous driving 1 Development and dissemination of cutting-edge
technology regarding automobiles and roads 2 Basic policy for transportation infrastructure
Participated in Jaguar Land Roverrsquos testing contributed to the demonstration test of autonomous driving technology
Major participants Germany BMW France Renault Japan Toyota UK HORIBA MIRA
42 35
45
72 70
02468
2015 2016 2017
Backlog Sales
(Half-year Restated) (Forecast)
JPYGBP 185 yen 147 yen 140 yen
ECT Sales and Backlog (Billions of Yen)
copy 2017 HORIBA Ltd All rights reserved 19
bull Steady sales of stack gas analyzers in Japan
bull Robust process analytical measurement business (US)
bull Weak sales in EU and Asia
bull Expect steady sales to continue in Japan
bull Profitability improvement in gas measurement business
in HORIBA BIWAKO E-HARBOR
bull Increase RampD expenditure for water business
Automatic on-line analysis of PM components Integrate HORIBArsquos technology in and times Identify sources of origin of microparticles Enable 24-hour consecutive analysis of elements
Project to improve water quality of wastewater from dyeing factories Installing wastewater treatment systems and
water quality monitors in Myanmar Joint project with Hitachi Zosen Corporation
Ministry of Environment (MOE) plans to adopt HORIBArsquos products Scheduled to install devices at 4 sites in Japan
in Apr 2017
Designated one of the ldquoModel businesses to improve water environment in Asiardquo by MOE Started experimentation in Jan 2017
Demo facility installed in HORIBA BIWAKO E-HARBOR
PampE SCI
Facilities installed in Wundwin city Myanmar
Water quality analyzer
PM25 analyzer
copy 2017 HORIBA Ltd All rights reserved 21
Firm sales of CBC+CRP analyzers in Japan
Sales decrease in yen due to the yen appreciation
Steady growth in India
Expect firm sales of CBC+CRP analyzers in Japan
bull Accelerated sales expansion by introducing a new
Strategy to expand sales in mediumlarge-sized hematology analyzers Propose total solutions including a data
management system Expand business globally from 2Q of 2017
New brand ldquoYumizenrdquo
Medical Growth with New Brand and Service
Provide maintenance service system using IoT technology
for reducing device downtime
Enhance maintenance support by continuous monitoring amp diagnostic reports
Detect problems in advance and provide appropriate suggestions
Target 6000 contracts by 2020 in Japan Also plan to expand globally
携帯通信網使用
Distributors
Medical Certificate
Call Center
Customer
Through Mobile network
Coordination
Automatic Data Collection Monitoring
Server
Monitoring Machine Condition
Preventive Maintenance
copy 2017 HORIBA Ltd All rights reserved 23
(Billions of yen)
bull Record-high sales and operating profit due to increased investments by semiconductor manufacturers in Asia
bull Sales decrease in yen terms due to the appreciation of the yen
bull Investment to raise Aso factory production capacity Less-certain market outlook for the 2nd half Closely monitor investment trend in China
2016 Results Topics regarding the semiconductor industry and mass flow controller market Data centersrsquo shift to memory for storage Sharp increase in demand for
semiconductors Changes in manufacturing technology
Miniaturization 3D-NAND double-patterning rarr Increase in demand for etching devices Disciplined investment by semiconductor
manufacturers The silicon cycle to fluctuate less widely The market to stabilize
Cutting-edge technology of HORIBA and HORIBA Jobin Yvon Close relationship with academia
MESA-50T SEM-CL
For a rare metal manufacturer
Software development for rare metal analysis
Customized chamber
Specialized in defect
characterization Applied Topcon technology
Collaboration with Raman Testing for protein and
drugs
INV-XploRA
Cutting-edge material development
High concentration cell Minute amount
measurement
New market creation and product development to meet customerrsquos needs
LA-960
Imaging CL device (released in Aug 2016) Convert defective images into high-accuracy images Characteristic distribution analysis of phosphor parts of LED
elements Accelerate RampD for the next-generation power devices
HORIBA HORIBA Jobin Yvon
Electron beam technology of Topcon
New product by integrating HORIBA Grouprsquos technologies
Materials for semiconductors Life science sector
Imaging Cathodoluminescence (CL)
Scientific
copy 2017 HORIBA Ltd All rights reserved 27
Contents
2016 Results
2017 Forecast
Business Segment Outline
Shareholder Return
MLMAP2020 [2016-2020] Progress Financial Data Corporate profile
copy 2017 HORIBA Ltd All rights reserved 28
2015 Results 70 yen per share + 2016 Results 85 yen per share 2017 Forecast 90 yen per share
- Dividend payment + Share buyback = 30 of Consolidated net profit to be targeted - Remaining earnings are retained internally for strategic investment (ie facilities MampA)
(Yen) Per-share dividend (from 2002 to 2017 Forecast)
Basic policy (since 2013)
Dividends and Share buybacks
(fore)
2015 Share buyback 218400 shares
about 10 billion yen
Record high for 7 years in a row
An Average total return ratio of last 3years 292
copy 2017 HORIBA Ltd All rights reserved 29
Contents
2016 Results
2017 Forecast
Business Segment Outline
Shareholder Return
MLMAP2020 [2016-2020] Progress Financial Data Corporate profile
HORIBA Stained Glass Project Lunch gatherings of working mothers Seminars on how to balance long-term care and work Workshop to improve work productivity
Selected as one of New Diversity Management Selection 100 (by the Ministry of Economy Trade and Industry of Japan)
Reasons for the award Corporate motto ldquoJoy and Funrdquo and the Stained Glass Project
Mr Saito executive vice president and Ms Moriguchi leader of Stained Glass Project at the award-receiving ceremony
copy 2017 HORIBA Ltd All rights reserved 37
Decided to introduce a new KPI to measure asset efficiency Indicator composed of ldquoOperating profitrdquo and ldquoWACCrdquo Applying unit Business segments and Group companies Strengthen PDCA cycle Efficient use of business assets and increase profit
Plan to prepare a budget to this project in 2018
Founded financial subsidiaries in the US and the UK Improve capital efficiency through group financing Strengthen financial management function in each region
Enhance asset efficiency and maximize corporate value
Improve asset efficiency amp
Accelerate business growth
Investment
Business Growth
Cash Generation
copy 2017 HORIBA Ltd All rights reserved 38
Symbol of MLMAP2020
Step out of the existing business fields and pursue further expansion Take a new perspective and overcome technologicalmarketorganization barriers
Be flexible think outside the box and move up to the next stage
ONE STEP AHEAD - To create a next stage of HORIBA -
copy 2017 HORIBA Ltd All rights reserved 39
Contents
2016 Results
2017 Forecast
Business Segment Outline
Shareholder Return
MLMAP2020 [2016-2020] Progress Financial Data Corporate profile
PPampE Investment to MIRA(30BJYP) Depreciation Goodwill of MIRA(04BJYP) Biwako factory (07BJYP) RampD Increased in Automotive Test System Business
Good will of MIRA eg hellip Amortization included
2017 Topics
PPampE Investment to MIRA(30BJYP) Expansion of Aso Factory(27BJYP)
Depreciation Goodwill of MIRA(04BJYP) Increase in MIRA and Test center invested in 2016 RampD Increase in Auto and PampE Business
Capital Investment Depreciation RampD (Billions of yen)
全社実績
セグ実績
全社予算
全社予算2案
セグ予算
セグ予算2案
受注_残
半期予想
設備投資
HOR単体実績
HOR単体予算
HOR単体上期予算
copy 2017 HORIBA Ltd All rights reserved 45
241 Bond
redemption in 2020
Current ratio
280
2014 254 60
Short 66
Cash1
492
Bonds 150
Long 25
Cash1
478
Bonds 150
Long 22 Short 108
2013 269 60
447
Cash1
511
Bonds 150
Long 168
Short 128
2015 229 55
Borrowed from JBIC2
151bn yen (2015)
Capital ratio
467
2016 237 55
Cash1
519
Bonds 150
Long 192
Short 124
Cash Balance (Billions of yen)
(Consolidated basis each end of the year) Total Loan Balance
Conclusion of liquidation of receivable contract with 2 banks Recent issuer rating RampI [A-] (July 2016) JCR [A] (August 2016)
1 CashhellipCash and Cash Equivalents at End of Period 2 JBIC Japan Bank for International Cooperation
Graph1
Sheet1
Sheet1
現預金
短期
長期
社債
Sheet1 (2)
tajikaABX =gtHIL
tajikaSTEC=gtHOR
copy 2017 HORIBA Ltd All rights reserved 46
Contents
2016 Results
2017 Forecast
Business Segment Outline
Shareholder Return
MLMAP2020 [2016-2020]Progress Financial Data Corporate profile
copy 2017 HORIBA Ltd All rights reserved 47
Head office Kyoto Japan Founded 1945 Incorporated 1953 CEO Atsushi Horiba Fiscal year end December 31
Atsushi Horiba Chairman President amp CEO
- Corporate motto -
To have interest and pride in our work to enjoy our lives
Corporate Profile
copy 2017 HORIBA Ltd All rights reserved 48
Medical In-Vitro Diagnostic (IVD) Systems Integration of HORIBA ABXrsquos Technology amp Marketing Know-How
Automotive Test Systems Emission Measurement Systems (EMS) Mechatronics Devices (MCT) Driving Control Systems (ITS) Engineering Consultancy amp Testing (ECT)
Business Segments
Process amp Environmental Environmental Systems Environmental Radiation Monitor Environmental Regulation amp Process Business
Semiconductor Mass Flow Controller In-situ Analysis Synergy among HORIBA HQ HORIBA STEC and HORIBA Jobin Yvonrsquos Technologies
Scientific Synergy of HORIBA and HORIBA Jobin Yvonrsquos Technologies Raman Grating and Fluorescence
copy 2017 HORIBA Ltd All rights reserved 49
Sales 1700 Billions of Yen
Business Composition of Sales
Automotive Test Systems
Process amp Environmental
Medical
Semiconductor
Scientific
Automotive 622 (36)
Scientific 257 (15)
Semiconductor 388 (23)
Medical 265 (16)
PampE 167 (10)
Well Balanced Business Operation -Five Business Segments-
(Billions of Yen)
copy 2017 HORIBA Ltd All rights reserved 50
Market Shares
Market shares quoted are estimates by HORIBA
80 20 100
35
Emission Measurement Systems
57 30
Stack Gas Analyzers Automatic Blood Cell Counter plus CRP
Mass Flow Controllers Raman Spectrophotometers Gratings
Global Domestic
copy 2017 HORIBA Ltd All rights reserved 51
EU Japan
Asia Americas
33
26 18
23
Geographic Composition of Sales(2016)
HORIBA Worldwide
Sales of FY2016 1700 BJPY
The Number of Group Companies by region (As of December 31 2016)
America 9 Europe 23 Asia 17 (4 in Japan including HORIBA Ltd) Total 49
copy 2017 HORIBA Ltd All rights reserved 52
Japan 38
Other Asia 15
France 13
Germany 8
Other Europe 2 USA
10
Other Americas 3
7149
従業員数 2015年12月31日現在
2442
946
3761
UK 11
Employees by Region
Total Number of Employees (As of December 31 2016)
Total Asia 53
Total Europe 34
Total Americas 13
copy 2017 HORIBA Ltd All rights reserved 53 copy 2017 HORIBA Ltd All rights reserved 53
copy 2017 HORIBA Ltd All rights reserved 54
Danke
Grazie
Σας ευχαριστούμε
감사합니다
Obrigado
谢谢
ขอบคณครบ
ありがとうございました
धनयवाद
நனற
Cảm ơn
Dziękuję
Tack ska ni ha
Thank you
Merci
Gracias
Большое спасибо
スライド番号 1
Contents
Contents
スライド番号 4
Summary of 2016 Results
2016 full year results
2016 Results by Segment
Contents
2017 Market outlook
Exchange rate forecast for 2017
Forecast for 2017
Forecast for 2017 by segment
Contents
スライド番号 14
2016 Results and 2017 Forecast
Strategy for improving profitability
Regulatory trend in EMS (Emission Measurement System) and Operations in an emerging Market
ECT (HORIBA MIRA) Business
2016 Results and 2017 Forecast
Analysis technology for the environment
2016 Results and 2017 Forecast
Growth with New Brand and Service
2016 Results and 2017 Forecast
スライド番号 24
2016 Results and 2017 Forecast
Exploit new markets using HORIBA technology
Contents
Shareholder Return
Contents
スライド番号 30
スライド番号 31
スライド番号 32
Accelerate growth in water measuring business
Water measuring and analysisbusiness domain
Water measuring and analysisbusiness domain
Selected as one of New Diversity Management Selection 100 (by the Ministry of Economy Trade and Industry of Japan)
Enhance asset efficiency and maximize corporate value
Symbol of MLMAP2020
Contents
Trend of Market capitalization
Changed the accounting policy for revenue recognition
スライド番号 42
スライド番号 43
スライド番号 44
スライド番号 45
Contents
スライド番号 47
Business Segments
スライド番号 49
Market Shares
スライド番号 51
スライド番号 52
スライド番号 53
スライド番号 54
勘定科目
BS_CL12010
BS_CL12020
BS_CL12030
BS_FL21000
BS_FL23000
勘定科目名称
当座借越
短期借入金
1年内返済長期借入金
社債
長期借入金
HOR
0
(2000000000)
0
(10000000000)
0
日本 ニホン
ABX
(827350776)
(4016672108)
(534035942)
0
(1343663409)
欧州 オウシュウ
ASEC
0
(352000000)
0
0
(180000000)
日本 ニホン
HE
0
(1855530779)
0
0
0
欧州 オウシュウ
HIC
0
(1156081000)
(109236000)
0
(682725000)
米州 ベイシュウ
HIT
(99662290)
0
(200000000)
0
(300000000)
日本 ニホン
HSC
0
(20019305)
0
0
0
アジア
HST
0
(166375000)
0
0
0
アジア
JY
0
0
(9753688)
0
(105723687)
欧州 オウシュウ
会社間照合
0
(5047)
欧州 オウシュウ
会社間照合
200000000
日本 ニホン
会社間照合
480000000
日本 ニホン
会社間照合
2000000000
日本 ニホン
会社間照合
118647000
欧州 オウシュウ
会社間照合
175953553
欧州 オウシュウ
連結合計
(927013066)
(7272082686)
(653025630)
(10000000000)
(2132112096)
(99662290)
(352000000)
0
(10000000000)
0
日本 ニホン
(827350776)
(5577607381)
(543789630)
0
(1449387096)
欧州 オウシュウ
0
(1156081000)
(109236000)
0
(682725000)
米州 ベイシュウ
0
(186394305)
0
0
0
アジア
(927013066)
(7272082686)
(653025630)
(10000000000)
(2132112096)
2008
2009
2010
2011
2012
2013
2008
2008
2009
2009
2013
2013
2014
2014
2015
2015
2016
2016
短期借入金 タンキカリイレキン
8852
6618
5575
6684
5523
6606
現預金 ゲンヨキン
18267
21520
49246
51109
47859
51900
長期借入金 チョウキカリイレキン
2132
1730
1195
1291
2113
2576
短期 タンキ
8852
6618
6606
10832
12800
12400
社債 シャサイ
10000
10000
10000
10000
10000
15000
長期 チョウキ
2132
1730
2576
2209
16800
19200
現預金 ゲンヨキン
18267
21520
26958
28893
34685
42228
社債 シャサイ
10000
10000
15000
15000
15000
15000
流動比率 リュウドウヒリツ
2296
2524
2653
2806
2970
2690
自己資本比率 ジコシホンヒリツ
576
609
612
624
650
600
49246
6606
2576
15000
51109
10832
2209
15000
47859
12800
16800
15000
51900
12400
19200
15000
2013年実績 ネン ジッセキ
2014年実績 ネン ジッセキ
2015年計画 ネン ケイカク
増減
計画(GBM) ケイカク
発表案 ハッピョウ アン
vs 2014
売上高 ウリアゲ タカ
営業利益 エイギョウ リエキ
経常利益 ケイジョウ リエキ
当期純利益 トウキ ジュンリエキ
2013年 ネン
2014年 ネン
2015年 ネン
増減
実績
実績
計画(GBM) ケイカク
決定 ケッテイ
vs 2014
売上高 ウリアゲ タカ
営業利益 エイギョウ リエキ
経常利益 ケイジョウ リエキ
当期純利益 トウキ ジュンリエキ
営業利益率 エイギョウ リエキ リツ
2013実績 ジッセキ
2014年 ネン
増減
開示116 カイジ
実績 ジッセキ
vs 2013
売上高 ウリアゲ タカ
営業利益 エイギョウ リエキ
経常利益 ケイジョウ リエキ
当期純利益 トウキ ジュンリエキ
2015
2016
2017
Results
Forecast117
Results
vs 2015
vs Forecast117
Forecast
vs 2016
PPampE
148
153
134
-10
-12
146
+9
Intangibles
14
07
03
-75
-49
04
+11
Capital Investment
163
160
137
-15
-14
150
+9
Depreciation
61
65
68
+12
+5
72
+6
RampD
123
130
129
+5
-1
140
+8
(To net sales)
(7)
(8)
(8)
(8)
2014年 ネン
2015年 ネン
実績 ジッセキ
社内数値 シャナイ スウチ
発表案 ハッピョウ アン
上期 カミ キ
下期 シモキ
通期 ツウキ
上期 カミキ
下期 シモキ
通期 ツウキ
上期 カミ キ
下期 シモキ
通期 ツウキ
売上高 ウリアゲ ダカ
0
0
0
0
0
自動車 ジドウシャ
0
0
0
環境 カンキョウ
0
0
0
医用 イヨウ
0
0
0
半導体 ハンドウタイ
0
0
0
科学 カガク
0
0
0
営業利益 エイギョウ リエキ
0
0
0
0
0
自動車 ジドウシャ
0
0
0
環境 カンキョウ
0
0
0
医用 イヨウ
0
0
0
半導体 ハンドウタイ
0
0
0
科学 カガク
0
0
0
経常利益 ケイジョウ リエキ
0
0
当期純利益 トウキ ジュンリエキ
0
0
営業利益率 エイギョウ リエキ リツ
ERRORDIV0
ERRORDIV0
ERRORDIV0
ERRORDIV0
ERRORDIV0
ERRORDIV0
ERRORDIV0
ERRORDIV0
ERRORDIV0
自動車 ジドウシャ
ERRORDIV0
ERRORDIV0
ERRORDIV0
ERRORDIV0
ERRORDIV0
ERRORDIV0
ERRORDIV0
ERRORDIV0
ERRORDIV0
環境 カンキョウ
ERRORDIV0
ERRORDIV0
ERRORDIV0
ERRORDIV0
ERRORDIV0
ERRORDIV0
ERRORDIV0
ERRORDIV0
ERRORDIV0
医用 イヨウ
ERRORDIV0
ERRORDIV0
ERRORDIV0
ERRORDIV0
ERRORDIV0
ERRORDIV0
ERRORDIV0
ERRORDIV0
ERRORDIV0
半導体 ハンドウタイ
ERRORDIV0
ERRORDIV0
ERRORDIV0
ERRORDIV0
ERRORDIV0
ERRORDIV0
ERRORDIV0
ERRORDIV0
ERRORDIV0
科学 カガク
ERRORDIV0
ERRORDIV0
ERRORDIV0
ERRORDIV0
ERRORDIV0
ERRORDIV0
ERRORDIV0
ERRORDIV0
ERRORDIV0
受注実績 ジュチュウ ジッセキ
2013
2014
1Q
2Q
3Q
4Q
1Q
2Q
3Q
4Q
自動車
128
125
103
166
環境
39
38
41
40
医用
67
64
60
71
半導体
46
51
69
88
科学
53
61
61
77
合計
334
341
337
444
受注残 ジュチュウ ザン
2013
2014
1Q
2Q
3Q
4Q
1Q
2Q
3Q
4Q
自動車
314
335
325
314
環境
33
39
45
38
医用
30
27
24
23
半導体
20
15
25
31
科学
55
67
76
76
合計
454
486
497
484
受注実績 ジュチュウ ジッセキ
2013
2014
1Q
2Q
3Q
4Q
1Q
2Q
3Q
4Q
自動車
128
125
103
166
EMS
93
91
78
110
MCT
32
30
24
48
HIT
4
4
2
9
受注残 ジュチュウ ザン
2013
2014
推移 スイイ
1Q
2Q
3Q
4Q
1Q
2Q
3Q
4Q
自動車
314
335
325
314
EMS
173
188
195
177
MCT
135
142
125
128
HIT
5
5
4
7
売上高 ウリアゲ ダカ
営業利益 エイギョウ リエキ
2014
2015 計画 ケイカク
2014
2015 計画 ケイカク
実績 ジッセキ
社内数値 シャナイ スウチ
発表案① ハッピョウ アン
発表案② ハッピョウ アン
MLMAP2015年数値 ネン スウチ
実績 ジッセキ
社内数値 シャナイ スウチ
発表案① ハッピョウ アン
発表案② ハッピョウ アン
MLMAP2015年数値 ネン スウチ
vs 2014
vs 2014
対外発表 タイガイ ハッピョウ
社内数値 シャナイ スウチ
vs 2014
vs 2014
対外発表 タイガイ ハッピョウ
社内数値 シャナイ スウチ
自動車 ジドウシャ
環境 カンキョウ
医用 イヨウ
半導体 ハンドウタイ
科学 カガク
合計 ゴウケイ
営業利益 エイギョウ リエキ
2014
2015 計画 ケイカク
実績 ジッセキ
社内数値 シャナイ スウチ
発表案① ハッピョウ アン
発表案② ハッピョウ アン
MLMAP2015年数値 ネン スウチ
vs 2014
vs 2014
対外発表 タイガイ ハッピョウ
社内数値 シャナイ スウチ
自動車 ジドウシャ
環境 カンキョウ
医用 イヨウ
半導体 ハンドウタイ
科学 カガク
合計 ゴウケイ
売上高 ウリアゲ ダカ
営業利益 エイギョウ リエキ
2014
2015
2014
2015
実績 ジッセキ
社内数値 シャナイ スウチ
発表案 ハッピョウ アン
vs2014
実績 ジッセキ
社内数値 シャナイ スウチ
発表案 ハッピョウ アン
vs2014
自動車 ジドウシャ
環境 カンキョウ
医用 イヨウ
半導体 ハンドウタイ
科学 カガク
合計 ゴウケイ
2014
2015年計画 ネン ケイカク
実績 ジッセキ
社内数値 シャナイ スウチ
開示案① カイジ アン ハツアン
開示案② カイジ アン ハツアン
MLMAP2015年数値 ネン スウチ
市場 シジョウ
vs 2014
vs 2014
対外発表 タイガイ ハッピョウ
社内数値 シャナイ スウチ
8社平均 シャ ヘイキン
売上高 ウリアゲ タカ
営業利益 エイギョウ リエキ
経常利益 ケイジョウ リエキ
当期純利益 トウキ ジュンリエキ
営業利益率 エイギョウ リエキ リツ
ドル
ユーロ
配当(円1株) ハイトウ エン カブ
2014
2015
MLMAP2015年数値 ネン スウチ
市場 シジョウ
実績 ジッセキ
社内数値 シャナイ スウチ
発表案 ハッピョウ アン
vs2014
対外発表 タイガイ ハッピョウ
社内数値 シャナイ スウチ
8社平均 シャ ヘイキン
売上高 ウリアゲ タカ
営業利益 エイギョウ リエキ
経常利益 ケイジョウ リエキ
当期純利益 トウキ ジュンリエキ
営業利益率 エイギョウ リエキ リツ
ドル
ユーロ
配当(円1株) ハイトウ エン カブ
売上高 ウリアゲ ダカ
営業利益 エイギョウ リエキ
2013年 ネン
2014年 ネン
2013年 ネン
2014年 ネン
実績 ジッセキ
開示116 カイジ
実績 ジッセキ
増減vsv2013 ゾウゲン
実績 ジッセキ
開示116 カイジ
実績 ジッセキ
増減vsv2013 ゾウゲン
自動車 ジドウシャ
環境 カンキョウ
医用 イヨウ
半導体 ハンドウタイ
科学 カガク
合計 ゴウケイ
2013年 ネン
2014年 ネン
増減比較 ゾウゲン ヒカク
市場 シジョウ
実績 ジッセキ
開示(116) カイジ
実績(監査前) ジッセキ カンサ マエ
vs 13年 ネン
vs 開示 カイジ
8社平均 シャ ヘイキン
売上高 ウリアゲ タカ
営業利益 エイギョウ リエキ
経常利益 ケイジョウ リエキ
当期純利益 トウキ ジュンリエキ
営業利益率 エイギョウ リエキ リツ
配当 ハイトウ
配当性向 ハイトウ セイコウ
為替レート(累計)
ドル
ユーロ
2015
2016
Variation
Cash flows from operating activities
14770
15871
1101
Cash flows from investing activities
-30642
-10427
20214
Cash flows from financing activities
12843
-451
-13294
Cash and cash equivalents at end of year
47859
51940
4081
Free cash flows
-15872
5443
21315
Changed points
Original
Shipment base
New
The date of delivery or installation based on contractual arrangements
Applied timing
January 2016
Reason for change
Triggered by the introduction of a new ERP implementation to harmonize with international accounting standards
2008
2009
2010
2011
2012
2013
2014
2015
2015
2016
2017
売上高
542
371
357
386
432
495
550
642
654
622
690
営業利益
72
18
16
28
44
42
58
44
52
35
52
Sheet1
売上高
REF
REF
Sheet2
Sheet3
copy 2017 HORIBA Ltd All rights reserved 16
95 110 128 133 108 152
81 116
145 162
197
132
180
2011 2012 2013 2014 2015 2016 2017
BacklogSales
Auto Strategy for improving profitability
[Problem] Long waiting in the design process
[Solution] Reduce design work by standardizing specs
0
10
20
30
40
50
60
70
Aug2015 Feb2016 Aug2016
(days)
60 days in Aug 2015
11days in Aug 2016
Shorten the lead time in the specification-design stage
Lead time from specification adoption to design completion
Significant recovery is expected in 2017 Pick up in automakersrsquo investments Improve order booking by expanding turn-
key projects (in Japan EU the US) Focus on improving profitability Tighter management of project progress
Inquiry
Determ
ine S
pecification
Design
Procure
Product
Installment
Test
Inspection
Collection
Aim at cutting the lead time to one-third
- HORIBA BIWAKO E-HARBOR - MCT
MCT business improves profitability
MCT Sales and Order Backlog (Billions of yen)
(Forecast)
Case of the MEXA series middle-sized EMS product
The lead time was shortened to 15
(Restated)
copy 2017 HORIBA Ltd All rights reserved 17
EMS Sales and Order Backlog (Billions of yen)
137 169 179 202 269 294
265 286 333
374 398 401 420
0
15
30
45
2011 2012 2013 2014 2015 2016 2017
Backlog Sales
Open November 2016
Location Pune western India (Center of Auto Business)
Function Indoor Automotive test Product
customizationTraining
Objective Strengthen demonstration
test and application
development
Regulatory trend in EMS (Emission Measurement System) and Operations in an emerging Market Auto
Regulatory trend Solid sales in Japan (automakers parts makers) Steady investment in Japan WLTP(unified emission regulations by the UN) Start in Sep 2017 in EU and in 2018 in Japan RDE (Real Driving Emission on-road test) regulation Start in Sep 2017 in EU WLTPhellipWorldwide harmonized Light vehicles Test Procedure
HORIBA India Technical Center Establishment
Overview HORIBA India Technical center
(Forecast) (Restated)
Open July 2017 (Plan)
Location Nuneaton Warwickshire UK
Function Cutting-edge Emission Testing Lab (applied
for RDE regulation)
Objective Strengthen
demonstration test
HORIBA MIRA AETC Establishment
(Advanced Emission Test Centre AETC)
Inside of AETC
copy 2017 HORIBA Ltd All rights reserved 18
Auto ECT (HORIBA MIRA) Business
Sale decline caused by weaker GBP vs the JPY Investments of 30bn yen planned each in 2016
and 2017 while closely monitoring the Brexit impacts
Increased inquiries to MIRA Technology Park Accelerated global business (JapanAsia)
ECT Business (EngineeringHORIBA MIRA)
G7 transport ministersrsquo summit (held in Karuizawa Japan in Sep 2016)
Participation in the UK government autonomous driving car project
httpwwwukautodrivecomthe-uk-autodrive-project
George Gillespie CEO of HORIBA MIRA participated as a representative of UK
Main theme Autonomous driving 1 Development and dissemination of cutting-edge
technology regarding automobiles and roads 2 Basic policy for transportation infrastructure
Participated in Jaguar Land Roverrsquos testing contributed to the demonstration test of autonomous driving technology
Major participants Germany BMW France Renault Japan Toyota UK HORIBA MIRA
42 35
45
72 70
02468
2015 2016 2017
Backlog Sales
(Half-year Restated) (Forecast)
JPYGBP 185 yen 147 yen 140 yen
ECT Sales and Backlog (Billions of Yen)
copy 2017 HORIBA Ltd All rights reserved 19
bull Steady sales of stack gas analyzers in Japan
bull Robust process analytical measurement business (US)
bull Weak sales in EU and Asia
bull Expect steady sales to continue in Japan
bull Profitability improvement in gas measurement business
in HORIBA BIWAKO E-HARBOR
bull Increase RampD expenditure for water business
Automatic on-line analysis of PM components Integrate HORIBArsquos technology in and times Identify sources of origin of microparticles Enable 24-hour consecutive analysis of elements
Project to improve water quality of wastewater from dyeing factories Installing wastewater treatment systems and
water quality monitors in Myanmar Joint project with Hitachi Zosen Corporation
Ministry of Environment (MOE) plans to adopt HORIBArsquos products Scheduled to install devices at 4 sites in Japan
in Apr 2017
Designated one of the ldquoModel businesses to improve water environment in Asiardquo by MOE Started experimentation in Jan 2017
Demo facility installed in HORIBA BIWAKO E-HARBOR
PampE SCI
Facilities installed in Wundwin city Myanmar
Water quality analyzer
PM25 analyzer
copy 2017 HORIBA Ltd All rights reserved 21
Firm sales of CBC+CRP analyzers in Japan
Sales decrease in yen due to the yen appreciation
Steady growth in India
Expect firm sales of CBC+CRP analyzers in Japan
bull Accelerated sales expansion by introducing a new
Strategy to expand sales in mediumlarge-sized hematology analyzers Propose total solutions including a data
management system Expand business globally from 2Q of 2017
New brand ldquoYumizenrdquo
Medical Growth with New Brand and Service
Provide maintenance service system using IoT technology
for reducing device downtime
Enhance maintenance support by continuous monitoring amp diagnostic reports
Detect problems in advance and provide appropriate suggestions
Target 6000 contracts by 2020 in Japan Also plan to expand globally
携帯通信網使用
Distributors
Medical Certificate
Call Center
Customer
Through Mobile network
Coordination
Automatic Data Collection Monitoring
Server
Monitoring Machine Condition
Preventive Maintenance
copy 2017 HORIBA Ltd All rights reserved 23
(Billions of yen)
bull Record-high sales and operating profit due to increased investments by semiconductor manufacturers in Asia
bull Sales decrease in yen terms due to the appreciation of the yen
bull Investment to raise Aso factory production capacity Less-certain market outlook for the 2nd half Closely monitor investment trend in China
2016 Results Topics regarding the semiconductor industry and mass flow controller market Data centersrsquo shift to memory for storage Sharp increase in demand for
semiconductors Changes in manufacturing technology
Miniaturization 3D-NAND double-patterning rarr Increase in demand for etching devices Disciplined investment by semiconductor
manufacturers The silicon cycle to fluctuate less widely The market to stabilize
Cutting-edge technology of HORIBA and HORIBA Jobin Yvon Close relationship with academia
MESA-50T SEM-CL
For a rare metal manufacturer
Software development for rare metal analysis
Customized chamber
Specialized in defect
characterization Applied Topcon technology
Collaboration with Raman Testing for protein and
drugs
INV-XploRA
Cutting-edge material development
High concentration cell Minute amount
measurement
New market creation and product development to meet customerrsquos needs
LA-960
Imaging CL device (released in Aug 2016) Convert defective images into high-accuracy images Characteristic distribution analysis of phosphor parts of LED
elements Accelerate RampD for the next-generation power devices
HORIBA HORIBA Jobin Yvon
Electron beam technology of Topcon
New product by integrating HORIBA Grouprsquos technologies
Materials for semiconductors Life science sector
Imaging Cathodoluminescence (CL)
Scientific
copy 2017 HORIBA Ltd All rights reserved 27
Contents
2016 Results
2017 Forecast
Business Segment Outline
Shareholder Return
MLMAP2020 [2016-2020] Progress Financial Data Corporate profile
copy 2017 HORIBA Ltd All rights reserved 28
2015 Results 70 yen per share + 2016 Results 85 yen per share 2017 Forecast 90 yen per share
- Dividend payment + Share buyback = 30 of Consolidated net profit to be targeted - Remaining earnings are retained internally for strategic investment (ie facilities MampA)
(Yen) Per-share dividend (from 2002 to 2017 Forecast)
Basic policy (since 2013)
Dividends and Share buybacks
(fore)
2015 Share buyback 218400 shares
about 10 billion yen
Record high for 7 years in a row
An Average total return ratio of last 3years 292
copy 2017 HORIBA Ltd All rights reserved 29
Contents
2016 Results
2017 Forecast
Business Segment Outline
Shareholder Return
MLMAP2020 [2016-2020] Progress Financial Data Corporate profile
HORIBA Stained Glass Project Lunch gatherings of working mothers Seminars on how to balance long-term care and work Workshop to improve work productivity
Selected as one of New Diversity Management Selection 100 (by the Ministry of Economy Trade and Industry of Japan)
Reasons for the award Corporate motto ldquoJoy and Funrdquo and the Stained Glass Project
Mr Saito executive vice president and Ms Moriguchi leader of Stained Glass Project at the award-receiving ceremony
copy 2017 HORIBA Ltd All rights reserved 37
Decided to introduce a new KPI to measure asset efficiency Indicator composed of ldquoOperating profitrdquo and ldquoWACCrdquo Applying unit Business segments and Group companies Strengthen PDCA cycle Efficient use of business assets and increase profit
Plan to prepare a budget to this project in 2018
Founded financial subsidiaries in the US and the UK Improve capital efficiency through group financing Strengthen financial management function in each region
Enhance asset efficiency and maximize corporate value
Improve asset efficiency amp
Accelerate business growth
Investment
Business Growth
Cash Generation
copy 2017 HORIBA Ltd All rights reserved 38
Symbol of MLMAP2020
Step out of the existing business fields and pursue further expansion Take a new perspective and overcome technologicalmarketorganization barriers
Be flexible think outside the box and move up to the next stage
ONE STEP AHEAD - To create a next stage of HORIBA -
copy 2017 HORIBA Ltd All rights reserved 39
Contents
2016 Results
2017 Forecast
Business Segment Outline
Shareholder Return
MLMAP2020 [2016-2020] Progress Financial Data Corporate profile
PPampE Investment to MIRA(30BJYP) Depreciation Goodwill of MIRA(04BJYP) Biwako factory (07BJYP) RampD Increased in Automotive Test System Business
Good will of MIRA eg hellip Amortization included
2017 Topics
PPampE Investment to MIRA(30BJYP) Expansion of Aso Factory(27BJYP)
Depreciation Goodwill of MIRA(04BJYP) Increase in MIRA and Test center invested in 2016 RampD Increase in Auto and PampE Business
Capital Investment Depreciation RampD (Billions of yen)
全社実績
セグ実績
全社予算
全社予算2案
セグ予算
セグ予算2案
受注_残
半期予想
設備投資
HOR単体実績
HOR単体予算
HOR単体上期予算
copy 2017 HORIBA Ltd All rights reserved 45
241 Bond
redemption in 2020
Current ratio
280
2014 254 60
Short 66
Cash1
492
Bonds 150
Long 25
Cash1
478
Bonds 150
Long 22 Short 108
2013 269 60
447
Cash1
511
Bonds 150
Long 168
Short 128
2015 229 55
Borrowed from JBIC2
151bn yen (2015)
Capital ratio
467
2016 237 55
Cash1
519
Bonds 150
Long 192
Short 124
Cash Balance (Billions of yen)
(Consolidated basis each end of the year) Total Loan Balance
Conclusion of liquidation of receivable contract with 2 banks Recent issuer rating RampI [A-] (July 2016) JCR [A] (August 2016)
1 CashhellipCash and Cash Equivalents at End of Period 2 JBIC Japan Bank for International Cooperation
Graph1
Sheet1
Sheet1
現預金
短期
長期
社債
Sheet1 (2)
tajikaABX =gtHIL
tajikaSTEC=gtHOR
copy 2017 HORIBA Ltd All rights reserved 46
Contents
2016 Results
2017 Forecast
Business Segment Outline
Shareholder Return
MLMAP2020 [2016-2020]Progress Financial Data Corporate profile
copy 2017 HORIBA Ltd All rights reserved 47
Head office Kyoto Japan Founded 1945 Incorporated 1953 CEO Atsushi Horiba Fiscal year end December 31
Atsushi Horiba Chairman President amp CEO
- Corporate motto -
To have interest and pride in our work to enjoy our lives
Corporate Profile
copy 2017 HORIBA Ltd All rights reserved 48
Medical In-Vitro Diagnostic (IVD) Systems Integration of HORIBA ABXrsquos Technology amp Marketing Know-How
Automotive Test Systems Emission Measurement Systems (EMS) Mechatronics Devices (MCT) Driving Control Systems (ITS) Engineering Consultancy amp Testing (ECT)
Business Segments
Process amp Environmental Environmental Systems Environmental Radiation Monitor Environmental Regulation amp Process Business
Semiconductor Mass Flow Controller In-situ Analysis Synergy among HORIBA HQ HORIBA STEC and HORIBA Jobin Yvonrsquos Technologies
Scientific Synergy of HORIBA and HORIBA Jobin Yvonrsquos Technologies Raman Grating and Fluorescence
copy 2017 HORIBA Ltd All rights reserved 49
Sales 1700 Billions of Yen
Business Composition of Sales
Automotive Test Systems
Process amp Environmental
Medical
Semiconductor
Scientific
Automotive 622 (36)
Scientific 257 (15)
Semiconductor 388 (23)
Medical 265 (16)
PampE 167 (10)
Well Balanced Business Operation -Five Business Segments-
(Billions of Yen)
copy 2017 HORIBA Ltd All rights reserved 50
Market Shares
Market shares quoted are estimates by HORIBA
80 20 100
35
Emission Measurement Systems
57 30
Stack Gas Analyzers Automatic Blood Cell Counter plus CRP
Mass Flow Controllers Raman Spectrophotometers Gratings
Global Domestic
copy 2017 HORIBA Ltd All rights reserved 51
EU Japan
Asia Americas
33
26 18
23
Geographic Composition of Sales(2016)
HORIBA Worldwide
Sales of FY2016 1700 BJPY
The Number of Group Companies by region (As of December 31 2016)
America 9 Europe 23 Asia 17 (4 in Japan including HORIBA Ltd) Total 49
copy 2017 HORIBA Ltd All rights reserved 52
Japan 38
Other Asia 15
France 13
Germany 8
Other Europe 2 USA
10
Other Americas 3
7149
従業員数 2015年12月31日現在
2442
946
3761
UK 11
Employees by Region
Total Number of Employees (As of December 31 2016)
Total Asia 53
Total Europe 34
Total Americas 13
copy 2017 HORIBA Ltd All rights reserved 53 copy 2017 HORIBA Ltd All rights reserved 53
copy 2017 HORIBA Ltd All rights reserved 54
Danke
Grazie
Σας ευχαριστούμε
감사합니다
Obrigado
谢谢
ขอบคณครบ
ありがとうございました
धनयवाद
நனற
Cảm ơn
Dziękuję
Tack ska ni ha
Thank you
Merci
Gracias
Большое спасибо
スライド番号 1
Contents
Contents
スライド番号 4
Summary of 2016 Results
2016 full year results
2016 Results by Segment
Contents
2017 Market outlook
Exchange rate forecast for 2017
Forecast for 2017
Forecast for 2017 by segment
Contents
スライド番号 14
2016 Results and 2017 Forecast
Strategy for improving profitability
Regulatory trend in EMS (Emission Measurement System) and Operations in an emerging Market
ECT (HORIBA MIRA) Business
2016 Results and 2017 Forecast
Analysis technology for the environment
2016 Results and 2017 Forecast
Growth with New Brand and Service
2016 Results and 2017 Forecast
スライド番号 24
2016 Results and 2017 Forecast
Exploit new markets using HORIBA technology
Contents
Shareholder Return
Contents
スライド番号 30
スライド番号 31
スライド番号 32
Accelerate growth in water measuring business
Water measuring and analysisbusiness domain
Water measuring and analysisbusiness domain
Selected as one of New Diversity Management Selection 100 (by the Ministry of Economy Trade and Industry of Japan)
Enhance asset efficiency and maximize corporate value
Symbol of MLMAP2020
Contents
Trend of Market capitalization
Changed the accounting policy for revenue recognition
スライド番号 42
スライド番号 43
スライド番号 44
スライド番号 45
Contents
スライド番号 47
Business Segments
スライド番号 49
Market Shares
スライド番号 51
スライド番号 52
スライド番号 53
スライド番号 54
勘定科目
BS_CL12010
BS_CL12020
BS_CL12030
BS_FL21000
BS_FL23000
勘定科目名称
当座借越
短期借入金
1年内返済長期借入金
社債
長期借入金
HOR
0
(2000000000)
0
(10000000000)
0
日本 ニホン
ABX
(827350776)
(4016672108)
(534035942)
0
(1343663409)
欧州 オウシュウ
ASEC
0
(352000000)
0
0
(180000000)
日本 ニホン
HE
0
(1855530779)
0
0
0
欧州 オウシュウ
HIC
0
(1156081000)
(109236000)
0
(682725000)
米州 ベイシュウ
HIT
(99662290)
0
(200000000)
0
(300000000)
日本 ニホン
HSC
0
(20019305)
0
0
0
アジア
HST
0
(166375000)
0
0
0
アジア
JY
0
0
(9753688)
0
(105723687)
欧州 オウシュウ
会社間照合
0
(5047)
欧州 オウシュウ
会社間照合
200000000
日本 ニホン
会社間照合
480000000
日本 ニホン
会社間照合
2000000000
日本 ニホン
会社間照合
118647000
欧州 オウシュウ
会社間照合
175953553
欧州 オウシュウ
連結合計
(927013066)
(7272082686)
(653025630)
(10000000000)
(2132112096)
(99662290)
(352000000)
0
(10000000000)
0
日本 ニホン
(827350776)
(5577607381)
(543789630)
0
(1449387096)
欧州 オウシュウ
0
(1156081000)
(109236000)
0
(682725000)
米州 ベイシュウ
0
(186394305)
0
0
0
アジア
(927013066)
(7272082686)
(653025630)
(10000000000)
(2132112096)
2008
2009
2010
2011
2012
2013
2008
2008
2009
2009
2013
2013
2014
2014
2015
2015
2016
2016
短期借入金 タンキカリイレキン
8852
6618
5575
6684
5523
6606
現預金 ゲンヨキン
18267
21520
49246
51109
47859
51900
長期借入金 チョウキカリイレキン
2132
1730
1195
1291
2113
2576
短期 タンキ
8852
6618
6606
10832
12800
12400
社債 シャサイ
10000
10000
10000
10000
10000
15000
長期 チョウキ
2132
1730
2576
2209
16800
19200
現預金 ゲンヨキン
18267
21520
26958
28893
34685
42228
社債 シャサイ
10000
10000
15000
15000
15000
15000
流動比率 リュウドウヒリツ
2296
2524
2653
2806
2970
2690
自己資本比率 ジコシホンヒリツ
576
609
612
624
650
600
49246
6606
2576
15000
51109
10832
2209
15000
47859
12800
16800
15000
51900
12400
19200
15000
2013年実績 ネン ジッセキ
2014年実績 ネン ジッセキ
2015年計画 ネン ケイカク
増減
計画(GBM) ケイカク
発表案 ハッピョウ アン
vs 2014
売上高 ウリアゲ タカ
営業利益 エイギョウ リエキ
経常利益 ケイジョウ リエキ
当期純利益 トウキ ジュンリエキ
2013年 ネン
2014年 ネン
2015年 ネン
増減
実績
実績
計画(GBM) ケイカク
決定 ケッテイ
vs 2014
売上高 ウリアゲ タカ
営業利益 エイギョウ リエキ
経常利益 ケイジョウ リエキ
当期純利益 トウキ ジュンリエキ
営業利益率 エイギョウ リエキ リツ
2013実績 ジッセキ
2014年 ネン
増減
開示116 カイジ
実績 ジッセキ
vs 2013
売上高 ウリアゲ タカ
営業利益 エイギョウ リエキ
経常利益 ケイジョウ リエキ
当期純利益 トウキ ジュンリエキ
2015
2016
2017
Results
Forecast117
Results
vs 2015
vs Forecast117
Forecast
vs 2016
PPampE
148
153
134
-10
-12
146
+9
Intangibles
14
07
03
-75
-49
04
+11
Capital Investment
163
160
137
-15
-14
150
+9
Depreciation
61
65
68
+12
+5
72
+6
RampD
123
130
129
+5
-1
140
+8
(To net sales)
(7)
(8)
(8)
(8)
2014年 ネン
2015年 ネン
実績 ジッセキ
社内数値 シャナイ スウチ
発表案 ハッピョウ アン
上期 カミ キ
下期 シモキ
通期 ツウキ
上期 カミキ
下期 シモキ
通期 ツウキ
上期 カミ キ
下期 シモキ
通期 ツウキ
売上高 ウリアゲ ダカ
0
0
0
0
0
自動車 ジドウシャ
0
0
0
環境 カンキョウ
0
0
0
医用 イヨウ
0
0
0
半導体 ハンドウタイ
0
0
0
科学 カガク
0
0
0
営業利益 エイギョウ リエキ
0
0
0
0
0
自動車 ジドウシャ
0
0
0
環境 カンキョウ
0
0
0
医用 イヨウ
0
0
0
半導体 ハンドウタイ
0
0
0
科学 カガク
0
0
0
経常利益 ケイジョウ リエキ
0
0
当期純利益 トウキ ジュンリエキ
0
0
営業利益率 エイギョウ リエキ リツ
ERRORDIV0
ERRORDIV0
ERRORDIV0
ERRORDIV0
ERRORDIV0
ERRORDIV0
ERRORDIV0
ERRORDIV0
ERRORDIV0
自動車 ジドウシャ
ERRORDIV0
ERRORDIV0
ERRORDIV0
ERRORDIV0
ERRORDIV0
ERRORDIV0
ERRORDIV0
ERRORDIV0
ERRORDIV0
環境 カンキョウ
ERRORDIV0
ERRORDIV0
ERRORDIV0
ERRORDIV0
ERRORDIV0
ERRORDIV0
ERRORDIV0
ERRORDIV0
ERRORDIV0
医用 イヨウ
ERRORDIV0
ERRORDIV0
ERRORDIV0
ERRORDIV0
ERRORDIV0
ERRORDIV0
ERRORDIV0
ERRORDIV0
ERRORDIV0
半導体 ハンドウタイ
ERRORDIV0
ERRORDIV0
ERRORDIV0
ERRORDIV0
ERRORDIV0
ERRORDIV0
ERRORDIV0
ERRORDIV0
ERRORDIV0
科学 カガク
ERRORDIV0
ERRORDIV0
ERRORDIV0
ERRORDIV0
ERRORDIV0
ERRORDIV0
ERRORDIV0
ERRORDIV0
ERRORDIV0
受注実績 ジュチュウ ジッセキ
2013
2014
1Q
2Q
3Q
4Q
1Q
2Q
3Q
4Q
自動車
128
125
103
166
環境
39
38
41
40
医用
67
64
60
71
半導体
46
51
69
88
科学
53
61
61
77
合計
334
341
337
444
受注残 ジュチュウ ザン
2013
2014
1Q
2Q
3Q
4Q
1Q
2Q
3Q
4Q
自動車
314
335
325
314
環境
33
39
45
38
医用
30
27
24
23
半導体
20
15
25
31
科学
55
67
76
76
合計
454
486
497
484
受注実績 ジュチュウ ジッセキ
2013
2014
1Q
2Q
3Q
4Q
1Q
2Q
3Q
4Q
自動車
128
125
103
166
EMS
93
91
78
110
MCT
32
30
24
48
HIT
4
4
2
9
受注残 ジュチュウ ザン
2013
2014
推移 スイイ
1Q
2Q
3Q
4Q
1Q
2Q
3Q
4Q
自動車
314
335
325
314
EMS
173
188
195
177
MCT
135
142
125
128
HIT
5
5
4
7
売上高 ウリアゲ ダカ
営業利益 エイギョウ リエキ
2014
2015 計画 ケイカク
2014
2015 計画 ケイカク
実績 ジッセキ
社内数値 シャナイ スウチ
発表案① ハッピョウ アン
発表案② ハッピョウ アン
MLMAP2015年数値 ネン スウチ
実績 ジッセキ
社内数値 シャナイ スウチ
発表案① ハッピョウ アン
発表案② ハッピョウ アン
MLMAP2015年数値 ネン スウチ
vs 2014
vs 2014
対外発表 タイガイ ハッピョウ
社内数値 シャナイ スウチ
vs 2014
vs 2014
対外発表 タイガイ ハッピョウ
社内数値 シャナイ スウチ
自動車 ジドウシャ
環境 カンキョウ
医用 イヨウ
半導体 ハンドウタイ
科学 カガク
合計 ゴウケイ
営業利益 エイギョウ リエキ
2014
2015 計画 ケイカク
実績 ジッセキ
社内数値 シャナイ スウチ
発表案① ハッピョウ アン
発表案② ハッピョウ アン
MLMAP2015年数値 ネン スウチ
vs 2014
vs 2014
対外発表 タイガイ ハッピョウ
社内数値 シャナイ スウチ
自動車 ジドウシャ
環境 カンキョウ
医用 イヨウ
半導体 ハンドウタイ
科学 カガク
合計 ゴウケイ
売上高 ウリアゲ ダカ
営業利益 エイギョウ リエキ
2014
2015
2014
2015
実績 ジッセキ
社内数値 シャナイ スウチ
発表案 ハッピョウ アン
vs2014
実績 ジッセキ
社内数値 シャナイ スウチ
発表案 ハッピョウ アン
vs2014
自動車 ジドウシャ
環境 カンキョウ
医用 イヨウ
半導体 ハンドウタイ
科学 カガク
合計 ゴウケイ
2014
2015年計画 ネン ケイカク
実績 ジッセキ
社内数値 シャナイ スウチ
開示案① カイジ アン ハツアン
開示案② カイジ アン ハツアン
MLMAP2015年数値 ネン スウチ
市場 シジョウ
vs 2014
vs 2014
対外発表 タイガイ ハッピョウ
社内数値 シャナイ スウチ
8社平均 シャ ヘイキン
売上高 ウリアゲ タカ
営業利益 エイギョウ リエキ
経常利益 ケイジョウ リエキ
当期純利益 トウキ ジュンリエキ
営業利益率 エイギョウ リエキ リツ
ドル
ユーロ
配当(円1株) ハイトウ エン カブ
2014
2015
MLMAP2015年数値 ネン スウチ
市場 シジョウ
実績 ジッセキ
社内数値 シャナイ スウチ
発表案 ハッピョウ アン
vs2014
対外発表 タイガイ ハッピョウ
社内数値 シャナイ スウチ
8社平均 シャ ヘイキン
売上高 ウリアゲ タカ
営業利益 エイギョウ リエキ
経常利益 ケイジョウ リエキ
当期純利益 トウキ ジュンリエキ
営業利益率 エイギョウ リエキ リツ
ドル
ユーロ
配当(円1株) ハイトウ エン カブ
売上高 ウリアゲ ダカ
営業利益 エイギョウ リエキ
2013年 ネン
2014年 ネン
2013年 ネン
2014年 ネン
実績 ジッセキ
開示116 カイジ
実績 ジッセキ
増減vsv2013 ゾウゲン
実績 ジッセキ
開示116 カイジ
実績 ジッセキ
増減vsv2013 ゾウゲン
自動車 ジドウシャ
環境 カンキョウ
医用 イヨウ
半導体 ハンドウタイ
科学 カガク
合計 ゴウケイ
2013年 ネン
2014年 ネン
増減比較 ゾウゲン ヒカク
市場 シジョウ
実績 ジッセキ
開示(116) カイジ
実績(監査前) ジッセキ カンサ マエ
vs 13年 ネン
vs 開示 カイジ
8社平均 シャ ヘイキン
売上高 ウリアゲ タカ
営業利益 エイギョウ リエキ
経常利益 ケイジョウ リエキ
当期純利益 トウキ ジュンリエキ
営業利益率 エイギョウ リエキ リツ
配当 ハイトウ
配当性向 ハイトウ セイコウ
為替レート(累計)
ドル
ユーロ
2015
2016
Variation
Cash flows from operating activities
14770
15871
1101
Cash flows from investing activities
-30642
-10427
20214
Cash flows from financing activities
12843
-451
-13294
Cash and cash equivalents at end of year
47859
51940
4081
Free cash flows
-15872
5443
21315
Changed points
Original
Shipment base
New
The date of delivery or installation based on contractual arrangements
Applied timing
January 2016
Reason for change
Triggered by the introduction of a new ERP implementation to harmonize with international accounting standards
copy 2017 HORIBA Ltd All rights reserved 20
PampE Analysis technology for the environment
Gas Water
Automatic on-line analysis of PM components Integrate HORIBArsquos technology in and times Identify sources of origin of microparticles Enable 24-hour consecutive analysis of elements
Project to improve water quality of wastewater from dyeing factories Installing wastewater treatment systems and
water quality monitors in Myanmar Joint project with Hitachi Zosen Corporation
Ministry of Environment (MOE) plans to adopt HORIBArsquos products Scheduled to install devices at 4 sites in Japan
in Apr 2017
Designated one of the ldquoModel businesses to improve water environment in Asiardquo by MOE Started experimentation in Jan 2017
Demo facility installed in HORIBA BIWAKO E-HARBOR
PampE SCI
Facilities installed in Wundwin city Myanmar
Water quality analyzer
PM25 analyzer
copy 2017 HORIBA Ltd All rights reserved 21
Firm sales of CBC+CRP analyzers in Japan
Sales decrease in yen due to the yen appreciation
Steady growth in India
Expect firm sales of CBC+CRP analyzers in Japan
bull Accelerated sales expansion by introducing a new
Strategy to expand sales in mediumlarge-sized hematology analyzers Propose total solutions including a data
management system Expand business globally from 2Q of 2017
New brand ldquoYumizenrdquo
Medical Growth with New Brand and Service
Provide maintenance service system using IoT technology
for reducing device downtime
Enhance maintenance support by continuous monitoring amp diagnostic reports
Detect problems in advance and provide appropriate suggestions
Target 6000 contracts by 2020 in Japan Also plan to expand globally
携帯通信網使用
Distributors
Medical Certificate
Call Center
Customer
Through Mobile network
Coordination
Automatic Data Collection Monitoring
Server
Monitoring Machine Condition
Preventive Maintenance
copy 2017 HORIBA Ltd All rights reserved 23
(Billions of yen)
bull Record-high sales and operating profit due to increased investments by semiconductor manufacturers in Asia
bull Sales decrease in yen terms due to the appreciation of the yen
bull Investment to raise Aso factory production capacity Less-certain market outlook for the 2nd half Closely monitor investment trend in China
2016 Results Topics regarding the semiconductor industry and mass flow controller market Data centersrsquo shift to memory for storage Sharp increase in demand for
semiconductors Changes in manufacturing technology
Miniaturization 3D-NAND double-patterning rarr Increase in demand for etching devices Disciplined investment by semiconductor
manufacturers The silicon cycle to fluctuate less widely The market to stabilize
Cutting-edge technology of HORIBA and HORIBA Jobin Yvon Close relationship with academia
MESA-50T SEM-CL
For a rare metal manufacturer
Software development for rare metal analysis
Customized chamber
Specialized in defect
characterization Applied Topcon technology
Collaboration with Raman Testing for protein and
drugs
INV-XploRA
Cutting-edge material development
High concentration cell Minute amount
measurement
New market creation and product development to meet customerrsquos needs
LA-960
Imaging CL device (released in Aug 2016) Convert defective images into high-accuracy images Characteristic distribution analysis of phosphor parts of LED
elements Accelerate RampD for the next-generation power devices
HORIBA HORIBA Jobin Yvon
Electron beam technology of Topcon
New product by integrating HORIBA Grouprsquos technologies
Materials for semiconductors Life science sector
Imaging Cathodoluminescence (CL)
Scientific
copy 2017 HORIBA Ltd All rights reserved 27
Contents
2016 Results
2017 Forecast
Business Segment Outline
Shareholder Return
MLMAP2020 [2016-2020] Progress Financial Data Corporate profile
copy 2017 HORIBA Ltd All rights reserved 28
2015 Results 70 yen per share + 2016 Results 85 yen per share 2017 Forecast 90 yen per share
- Dividend payment + Share buyback = 30 of Consolidated net profit to be targeted - Remaining earnings are retained internally for strategic investment (ie facilities MampA)
(Yen) Per-share dividend (from 2002 to 2017 Forecast)
Basic policy (since 2013)
Dividends and Share buybacks
(fore)
2015 Share buyback 218400 shares
about 10 billion yen
Record high for 7 years in a row
An Average total return ratio of last 3years 292
copy 2017 HORIBA Ltd All rights reserved 29
Contents
2016 Results
2017 Forecast
Business Segment Outline
Shareholder Return
MLMAP2020 [2016-2020] Progress Financial Data Corporate profile
HORIBA Stained Glass Project Lunch gatherings of working mothers Seminars on how to balance long-term care and work Workshop to improve work productivity
Selected as one of New Diversity Management Selection 100 (by the Ministry of Economy Trade and Industry of Japan)
Reasons for the award Corporate motto ldquoJoy and Funrdquo and the Stained Glass Project
Mr Saito executive vice president and Ms Moriguchi leader of Stained Glass Project at the award-receiving ceremony
copy 2017 HORIBA Ltd All rights reserved 37
Decided to introduce a new KPI to measure asset efficiency Indicator composed of ldquoOperating profitrdquo and ldquoWACCrdquo Applying unit Business segments and Group companies Strengthen PDCA cycle Efficient use of business assets and increase profit
Plan to prepare a budget to this project in 2018
Founded financial subsidiaries in the US and the UK Improve capital efficiency through group financing Strengthen financial management function in each region
Enhance asset efficiency and maximize corporate value
Improve asset efficiency amp
Accelerate business growth
Investment
Business Growth
Cash Generation
copy 2017 HORIBA Ltd All rights reserved 38
Symbol of MLMAP2020
Step out of the existing business fields and pursue further expansion Take a new perspective and overcome technologicalmarketorganization barriers
Be flexible think outside the box and move up to the next stage
ONE STEP AHEAD - To create a next stage of HORIBA -
copy 2017 HORIBA Ltd All rights reserved 39
Contents
2016 Results
2017 Forecast
Business Segment Outline
Shareholder Return
MLMAP2020 [2016-2020] Progress Financial Data Corporate profile
PPampE Investment to MIRA(30BJYP) Depreciation Goodwill of MIRA(04BJYP) Biwako factory (07BJYP) RampD Increased in Automotive Test System Business
Good will of MIRA eg hellip Amortization included
2017 Topics
PPampE Investment to MIRA(30BJYP) Expansion of Aso Factory(27BJYP)
Depreciation Goodwill of MIRA(04BJYP) Increase in MIRA and Test center invested in 2016 RampD Increase in Auto and PampE Business
Capital Investment Depreciation RampD (Billions of yen)
全社実績
セグ実績
全社予算
全社予算2案
セグ予算
セグ予算2案
受注_残
半期予想
設備投資
HOR単体実績
HOR単体予算
HOR単体上期予算
copy 2017 HORIBA Ltd All rights reserved 45
241 Bond
redemption in 2020
Current ratio
280
2014 254 60
Short 66
Cash1
492
Bonds 150
Long 25
Cash1
478
Bonds 150
Long 22 Short 108
2013 269 60
447
Cash1
511
Bonds 150
Long 168
Short 128
2015 229 55
Borrowed from JBIC2
151bn yen (2015)
Capital ratio
467
2016 237 55
Cash1
519
Bonds 150
Long 192
Short 124
Cash Balance (Billions of yen)
(Consolidated basis each end of the year) Total Loan Balance
Conclusion of liquidation of receivable contract with 2 banks Recent issuer rating RampI [A-] (July 2016) JCR [A] (August 2016)
1 CashhellipCash and Cash Equivalents at End of Period 2 JBIC Japan Bank for International Cooperation
Graph1
Sheet1
Sheet1
現預金
短期
長期
社債
Sheet1 (2)
tajikaABX =gtHIL
tajikaSTEC=gtHOR
copy 2017 HORIBA Ltd All rights reserved 46
Contents
2016 Results
2017 Forecast
Business Segment Outline
Shareholder Return
MLMAP2020 [2016-2020]Progress Financial Data Corporate profile
copy 2017 HORIBA Ltd All rights reserved 47
Head office Kyoto Japan Founded 1945 Incorporated 1953 CEO Atsushi Horiba Fiscal year end December 31
Atsushi Horiba Chairman President amp CEO
- Corporate motto -
To have interest and pride in our work to enjoy our lives
Corporate Profile
copy 2017 HORIBA Ltd All rights reserved 48
Medical In-Vitro Diagnostic (IVD) Systems Integration of HORIBA ABXrsquos Technology amp Marketing Know-How
Automotive Test Systems Emission Measurement Systems (EMS) Mechatronics Devices (MCT) Driving Control Systems (ITS) Engineering Consultancy amp Testing (ECT)
Business Segments
Process amp Environmental Environmental Systems Environmental Radiation Monitor Environmental Regulation amp Process Business
Semiconductor Mass Flow Controller In-situ Analysis Synergy among HORIBA HQ HORIBA STEC and HORIBA Jobin Yvonrsquos Technologies
Scientific Synergy of HORIBA and HORIBA Jobin Yvonrsquos Technologies Raman Grating and Fluorescence
copy 2017 HORIBA Ltd All rights reserved 49
Sales 1700 Billions of Yen
Business Composition of Sales
Automotive Test Systems
Process amp Environmental
Medical
Semiconductor
Scientific
Automotive 622 (36)
Scientific 257 (15)
Semiconductor 388 (23)
Medical 265 (16)
PampE 167 (10)
Well Balanced Business Operation -Five Business Segments-
(Billions of Yen)
copy 2017 HORIBA Ltd All rights reserved 50
Market Shares
Market shares quoted are estimates by HORIBA
80 20 100
35
Emission Measurement Systems
57 30
Stack Gas Analyzers Automatic Blood Cell Counter plus CRP
Mass Flow Controllers Raman Spectrophotometers Gratings
Global Domestic
copy 2017 HORIBA Ltd All rights reserved 51
EU Japan
Asia Americas
33
26 18
23
Geographic Composition of Sales(2016)
HORIBA Worldwide
Sales of FY2016 1700 BJPY
The Number of Group Companies by region (As of December 31 2016)
America 9 Europe 23 Asia 17 (4 in Japan including HORIBA Ltd) Total 49
copy 2017 HORIBA Ltd All rights reserved 52
Japan 38
Other Asia 15
France 13
Germany 8
Other Europe 2 USA
10
Other Americas 3
7149
従業員数 2015年12月31日現在
2442
946
3761
UK 11
Employees by Region
Total Number of Employees (As of December 31 2016)
Total Asia 53
Total Europe 34
Total Americas 13
copy 2017 HORIBA Ltd All rights reserved 53 copy 2017 HORIBA Ltd All rights reserved 53
copy 2017 HORIBA Ltd All rights reserved 54
Danke
Grazie
Σας ευχαριστούμε
감사합니다
Obrigado
谢谢
ขอบคณครบ
ありがとうございました
धनयवाद
நனற
Cảm ơn
Dziękuję
Tack ska ni ha
Thank you
Merci
Gracias
Большое спасибо
スライド番号 1
Contents
Contents
スライド番号 4
Summary of 2016 Results
2016 full year results
2016 Results by Segment
Contents
2017 Market outlook
Exchange rate forecast for 2017
Forecast for 2017
Forecast for 2017 by segment
Contents
スライド番号 14
2016 Results and 2017 Forecast
Strategy for improving profitability
Regulatory trend in EMS (Emission Measurement System) and Operations in an emerging Market
ECT (HORIBA MIRA) Business
2016 Results and 2017 Forecast
Analysis technology for the environment
2016 Results and 2017 Forecast
Growth with New Brand and Service
2016 Results and 2017 Forecast
スライド番号 24
2016 Results and 2017 Forecast
Exploit new markets using HORIBA technology
Contents
Shareholder Return
Contents
スライド番号 30
スライド番号 31
スライド番号 32
Accelerate growth in water measuring business
Water measuring and analysisbusiness domain
Water measuring and analysisbusiness domain
Selected as one of New Diversity Management Selection 100 (by the Ministry of Economy Trade and Industry of Japan)
Enhance asset efficiency and maximize corporate value
Symbol of MLMAP2020
Contents
Trend of Market capitalization
Changed the accounting policy for revenue recognition
スライド番号 42
スライド番号 43
スライド番号 44
スライド番号 45
Contents
スライド番号 47
Business Segments
スライド番号 49
Market Shares
スライド番号 51
スライド番号 52
スライド番号 53
スライド番号 54
勘定科目
BS_CL12010
BS_CL12020
BS_CL12030
BS_FL21000
BS_FL23000
勘定科目名称
当座借越
短期借入金
1年内返済長期借入金
社債
長期借入金
HOR
0
(2000000000)
0
(10000000000)
0
日本 ニホン
ABX
(827350776)
(4016672108)
(534035942)
0
(1343663409)
欧州 オウシュウ
ASEC
0
(352000000)
0
0
(180000000)
日本 ニホン
HE
0
(1855530779)
0
0
0
欧州 オウシュウ
HIC
0
(1156081000)
(109236000)
0
(682725000)
米州 ベイシュウ
HIT
(99662290)
0
(200000000)
0
(300000000)
日本 ニホン
HSC
0
(20019305)
0
0
0
アジア
HST
0
(166375000)
0
0
0
アジア
JY
0
0
(9753688)
0
(105723687)
欧州 オウシュウ
会社間照合
0
(5047)
欧州 オウシュウ
会社間照合
200000000
日本 ニホン
会社間照合
480000000
日本 ニホン
会社間照合
2000000000
日本 ニホン
会社間照合
118647000
欧州 オウシュウ
会社間照合
175953553
欧州 オウシュウ
連結合計
(927013066)
(7272082686)
(653025630)
(10000000000)
(2132112096)
(99662290)
(352000000)
0
(10000000000)
0
日本 ニホン
(827350776)
(5577607381)
(543789630)
0
(1449387096)
欧州 オウシュウ
0
(1156081000)
(109236000)
0
(682725000)
米州 ベイシュウ
0
(186394305)
0
0
0
アジア
(927013066)
(7272082686)
(653025630)
(10000000000)
(2132112096)
2008
2009
2010
2011
2012
2013
2008
2008
2009
2009
2013
2013
2014
2014
2015
2015
2016
2016
短期借入金 タンキカリイレキン
8852
6618
5575
6684
5523
6606
現預金 ゲンヨキン
18267
21520
49246
51109
47859
51900
長期借入金 チョウキカリイレキン
2132
1730
1195
1291
2113
2576
短期 タンキ
8852
6618
6606
10832
12800
12400
社債 シャサイ
10000
10000
10000
10000
10000
15000
長期 チョウキ
2132
1730
2576
2209
16800
19200
現預金 ゲンヨキン
18267
21520
26958
28893
34685
42228
社債 シャサイ
10000
10000
15000
15000
15000
15000
流動比率 リュウドウヒリツ
2296
2524
2653
2806
2970
2690
自己資本比率 ジコシホンヒリツ
576
609
612
624
650
600
49246
6606
2576
15000
51109
10832
2209
15000
47859
12800
16800
15000
51900
12400
19200
15000
2013年実績 ネン ジッセキ
2014年実績 ネン ジッセキ
2015年計画 ネン ケイカク
増減
計画(GBM) ケイカク
発表案 ハッピョウ アン
vs 2014
売上高 ウリアゲ タカ
営業利益 エイギョウ リエキ
経常利益 ケイジョウ リエキ
当期純利益 トウキ ジュンリエキ
2013年 ネン
2014年 ネン
2015年 ネン
増減
実績
実績
計画(GBM) ケイカク
決定 ケッテイ
vs 2014
売上高 ウリアゲ タカ
営業利益 エイギョウ リエキ
経常利益 ケイジョウ リエキ
当期純利益 トウキ ジュンリエキ
営業利益率 エイギョウ リエキ リツ
2013実績 ジッセキ
2014年 ネン
増減
開示116 カイジ
実績 ジッセキ
vs 2013
売上高 ウリアゲ タカ
営業利益 エイギョウ リエキ
経常利益 ケイジョウ リエキ
当期純利益 トウキ ジュンリエキ
2015
2016
2017
Results
Forecast117
Results
vs 2015
vs Forecast117
Forecast
vs 2016
PPampE
148
153
134
-10
-12
146
+9
Intangibles
14
07
03
-75
-49
04
+11
Capital Investment
163
160
137
-15
-14
150
+9
Depreciation
61
65
68
+12
+5
72
+6
RampD
123
130
129
+5
-1
140
+8
(To net sales)
(7)
(8)
(8)
(8)
2014年 ネン
2015年 ネン
実績 ジッセキ
社内数値 シャナイ スウチ
発表案 ハッピョウ アン
上期 カミ キ
下期 シモキ
通期 ツウキ
上期 カミキ
下期 シモキ
通期 ツウキ
上期 カミ キ
下期 シモキ
通期 ツウキ
売上高 ウリアゲ ダカ
0
0
0
0
0
自動車 ジドウシャ
0
0
0
環境 カンキョウ
0
0
0
医用 イヨウ
0
0
0
半導体 ハンドウタイ
0
0
0
科学 カガク
0
0
0
営業利益 エイギョウ リエキ
0
0
0
0
0
自動車 ジドウシャ
0
0
0
環境 カンキョウ
0
0
0
医用 イヨウ
0
0
0
半導体 ハンドウタイ
0
0
0
科学 カガク
0
0
0
経常利益 ケイジョウ リエキ
0
0
当期純利益 トウキ ジュンリエキ
0
0
営業利益率 エイギョウ リエキ リツ
ERRORDIV0
ERRORDIV0
ERRORDIV0
ERRORDIV0
ERRORDIV0
ERRORDIV0
ERRORDIV0
ERRORDIV0
ERRORDIV0
自動車 ジドウシャ
ERRORDIV0
ERRORDIV0
ERRORDIV0
ERRORDIV0
ERRORDIV0
ERRORDIV0
ERRORDIV0
ERRORDIV0
ERRORDIV0
環境 カンキョウ
ERRORDIV0
ERRORDIV0
ERRORDIV0
ERRORDIV0
ERRORDIV0
ERRORDIV0
ERRORDIV0
ERRORDIV0
ERRORDIV0
医用 イヨウ
ERRORDIV0
ERRORDIV0
ERRORDIV0
ERRORDIV0
ERRORDIV0
ERRORDIV0
ERRORDIV0
ERRORDIV0
ERRORDIV0
半導体 ハンドウタイ
ERRORDIV0
ERRORDIV0
ERRORDIV0
ERRORDIV0
ERRORDIV0
ERRORDIV0
ERRORDIV0
ERRORDIV0
ERRORDIV0
科学 カガク
ERRORDIV0
ERRORDIV0
ERRORDIV0
ERRORDIV0
ERRORDIV0
ERRORDIV0
ERRORDIV0
ERRORDIV0
ERRORDIV0
受注実績 ジュチュウ ジッセキ
2013
2014
1Q
2Q
3Q
4Q
1Q
2Q
3Q
4Q
自動車
128
125
103
166
環境
39
38
41
40
医用
67
64
60
71
半導体
46
51
69
88
科学
53
61
61
77
合計
334
341
337
444
受注残 ジュチュウ ザン
2013
2014
1Q
2Q
3Q
4Q
1Q
2Q
3Q
4Q
自動車
314
335
325
314
環境
33
39
45
38
医用
30
27
24
23
半導体
20
15
25
31
科学
55
67
76
76
合計
454
486
497
484
受注実績 ジュチュウ ジッセキ
2013
2014
1Q
2Q
3Q
4Q
1Q
2Q
3Q
4Q
自動車
128
125
103
166
EMS
93
91
78
110
MCT
32
30
24
48
HIT
4
4
2
9
受注残 ジュチュウ ザン
2013
2014
推移 スイイ
1Q
2Q
3Q
4Q
1Q
2Q
3Q
4Q
自動車
314
335
325
314
EMS
173
188
195
177
MCT
135
142
125
128
HIT
5
5
4
7
売上高 ウリアゲ ダカ
営業利益 エイギョウ リエキ
2014
2015 計画 ケイカク
2014
2015 計画 ケイカク
実績 ジッセキ
社内数値 シャナイ スウチ
発表案① ハッピョウ アン
発表案② ハッピョウ アン
MLMAP2015年数値 ネン スウチ
実績 ジッセキ
社内数値 シャナイ スウチ
発表案① ハッピョウ アン
発表案② ハッピョウ アン
MLMAP2015年数値 ネン スウチ
vs 2014
vs 2014
対外発表 タイガイ ハッピョウ
社内数値 シャナイ スウチ
vs 2014
vs 2014
対外発表 タイガイ ハッピョウ
社内数値 シャナイ スウチ
自動車 ジドウシャ
環境 カンキョウ
医用 イヨウ
半導体 ハンドウタイ
科学 カガク
合計 ゴウケイ
営業利益 エイギョウ リエキ
2014
2015 計画 ケイカク
実績 ジッセキ
社内数値 シャナイ スウチ
発表案① ハッピョウ アン
発表案② ハッピョウ アン
MLMAP2015年数値 ネン スウチ
vs 2014
vs 2014
対外発表 タイガイ ハッピョウ
社内数値 シャナイ スウチ
自動車 ジドウシャ
環境 カンキョウ
医用 イヨウ
半導体 ハンドウタイ
科学 カガク
合計 ゴウケイ
売上高 ウリアゲ ダカ
営業利益 エイギョウ リエキ
2014
2015
2014
2015
実績 ジッセキ
社内数値 シャナイ スウチ
発表案 ハッピョウ アン
vs2014
実績 ジッセキ
社内数値 シャナイ スウチ
発表案 ハッピョウ アン
vs2014
自動車 ジドウシャ
環境 カンキョウ
医用 イヨウ
半導体 ハンドウタイ
科学 カガク
合計 ゴウケイ
2014
2015年計画 ネン ケイカク
実績 ジッセキ
社内数値 シャナイ スウチ
開示案① カイジ アン ハツアン
開示案② カイジ アン ハツアン
MLMAP2015年数値 ネン スウチ
市場 シジョウ
vs 2014
vs 2014
対外発表 タイガイ ハッピョウ
社内数値 シャナイ スウチ
8社平均 シャ ヘイキン
売上高 ウリアゲ タカ
営業利益 エイギョウ リエキ
経常利益 ケイジョウ リエキ
当期純利益 トウキ ジュンリエキ
営業利益率 エイギョウ リエキ リツ
ドル
ユーロ
配当(円1株) ハイトウ エン カブ
2014
2015
MLMAP2015年数値 ネン スウチ
市場 シジョウ
実績 ジッセキ
社内数値 シャナイ スウチ
発表案 ハッピョウ アン
vs2014
対外発表 タイガイ ハッピョウ
社内数値 シャナイ スウチ
8社平均 シャ ヘイキン
売上高 ウリアゲ タカ
営業利益 エイギョウ リエキ
経常利益 ケイジョウ リエキ
当期純利益 トウキ ジュンリエキ
営業利益率 エイギョウ リエキ リツ
ドル
ユーロ
配当(円1株) ハイトウ エン カブ
売上高 ウリアゲ ダカ
営業利益 エイギョウ リエキ
2013年 ネン
2014年 ネン
2013年 ネン
2014年 ネン
実績 ジッセキ
開示116 カイジ
実績 ジッセキ
増減vsv2013 ゾウゲン
実績 ジッセキ
開示116 カイジ
実績 ジッセキ
増減vsv2013 ゾウゲン
自動車 ジドウシャ
環境 カンキョウ
医用 イヨウ
半導体 ハンドウタイ
科学 カガク
合計 ゴウケイ
2013年 ネン
2014年 ネン
増減比較 ゾウゲン ヒカク
市場 シジョウ
実績 ジッセキ
開示(116) カイジ
実績(監査前) ジッセキ カンサ マエ
vs 13年 ネン
vs 開示 カイジ
8社平均 シャ ヘイキン
売上高 ウリアゲ タカ
営業利益 エイギョウ リエキ
経常利益 ケイジョウ リエキ
当期純利益 トウキ ジュンリエキ
営業利益率 エイギョウ リエキ リツ
配当 ハイトウ
配当性向 ハイトウ セイコウ
為替レート(累計)
ドル
ユーロ
2015
2016
Variation
Cash flows from operating activities
14770
15871
1101
Cash flows from investing activities
-30642
-10427
20214
Cash flows from financing activities
12843
-451
-13294
Cash and cash equivalents at end of year
47859
51940
4081
Free cash flows
-15872
5443
21315
Changed points
Original
Shipment base
New
The date of delivery or installation based on contractual arrangements
Applied timing
January 2016
Reason for change
Triggered by the introduction of a new ERP implementation to harmonize with international accounting standards
copy 2017 HORIBA Ltd All rights reserved 22
Brand building in the IVD market
Strategy to expand sales in mediumlarge-sized hematology analyzers Propose total solutions including a data
management system Expand business globally from 2Q of 2017
New brand ldquoYumizenrdquo
Medical Growth with New Brand and Service
Provide maintenance service system using IoT technology
for reducing device downtime
Enhance maintenance support by continuous monitoring amp diagnostic reports
Detect problems in advance and provide appropriate suggestions
Target 6000 contracts by 2020 in Japan Also plan to expand globally
携帯通信網使用
Distributors
Medical Certificate
Call Center
Customer
Through Mobile network
Coordination
Automatic Data Collection Monitoring
Server
Monitoring Machine Condition
Preventive Maintenance
copy 2017 HORIBA Ltd All rights reserved 23
(Billions of yen)
bull Record-high sales and operating profit due to increased investments by semiconductor manufacturers in Asia
bull Sales decrease in yen terms due to the appreciation of the yen
bull Investment to raise Aso factory production capacity Less-certain market outlook for the 2nd half Closely monitor investment trend in China
2016 Results Topics regarding the semiconductor industry and mass flow controller market Data centersrsquo shift to memory for storage Sharp increase in demand for
semiconductors Changes in manufacturing technology
Miniaturization 3D-NAND double-patterning rarr Increase in demand for etching devices Disciplined investment by semiconductor
manufacturers The silicon cycle to fluctuate less widely The market to stabilize
Cutting-edge technology of HORIBA and HORIBA Jobin Yvon Close relationship with academia
MESA-50T SEM-CL
For a rare metal manufacturer
Software development for rare metal analysis
Customized chamber
Specialized in defect
characterization Applied Topcon technology
Collaboration with Raman Testing for protein and
drugs
INV-XploRA
Cutting-edge material development
High concentration cell Minute amount
measurement
New market creation and product development to meet customerrsquos needs
LA-960
Imaging CL device (released in Aug 2016) Convert defective images into high-accuracy images Characteristic distribution analysis of phosphor parts of LED
elements Accelerate RampD for the next-generation power devices
HORIBA HORIBA Jobin Yvon
Electron beam technology of Topcon
New product by integrating HORIBA Grouprsquos technologies
Materials for semiconductors Life science sector
Imaging Cathodoluminescence (CL)
Scientific
copy 2017 HORIBA Ltd All rights reserved 27
Contents
2016 Results
2017 Forecast
Business Segment Outline
Shareholder Return
MLMAP2020 [2016-2020] Progress Financial Data Corporate profile
copy 2017 HORIBA Ltd All rights reserved 28
2015 Results 70 yen per share + 2016 Results 85 yen per share 2017 Forecast 90 yen per share
- Dividend payment + Share buyback = 30 of Consolidated net profit to be targeted - Remaining earnings are retained internally for strategic investment (ie facilities MampA)
(Yen) Per-share dividend (from 2002 to 2017 Forecast)
Basic policy (since 2013)
Dividends and Share buybacks
(fore)
2015 Share buyback 218400 shares
about 10 billion yen
Record high for 7 years in a row
An Average total return ratio of last 3years 292
copy 2017 HORIBA Ltd All rights reserved 29
Contents
2016 Results
2017 Forecast
Business Segment Outline
Shareholder Return
MLMAP2020 [2016-2020] Progress Financial Data Corporate profile
HORIBA Stained Glass Project Lunch gatherings of working mothers Seminars on how to balance long-term care and work Workshop to improve work productivity
Selected as one of New Diversity Management Selection 100 (by the Ministry of Economy Trade and Industry of Japan)
Reasons for the award Corporate motto ldquoJoy and Funrdquo and the Stained Glass Project
Mr Saito executive vice president and Ms Moriguchi leader of Stained Glass Project at the award-receiving ceremony
copy 2017 HORIBA Ltd All rights reserved 37
Decided to introduce a new KPI to measure asset efficiency Indicator composed of ldquoOperating profitrdquo and ldquoWACCrdquo Applying unit Business segments and Group companies Strengthen PDCA cycle Efficient use of business assets and increase profit
Plan to prepare a budget to this project in 2018
Founded financial subsidiaries in the US and the UK Improve capital efficiency through group financing Strengthen financial management function in each region
Enhance asset efficiency and maximize corporate value
Improve asset efficiency amp
Accelerate business growth
Investment
Business Growth
Cash Generation
copy 2017 HORIBA Ltd All rights reserved 38
Symbol of MLMAP2020
Step out of the existing business fields and pursue further expansion Take a new perspective and overcome technologicalmarketorganization barriers
Be flexible think outside the box and move up to the next stage
ONE STEP AHEAD - To create a next stage of HORIBA -
copy 2017 HORIBA Ltd All rights reserved 39
Contents
2016 Results
2017 Forecast
Business Segment Outline
Shareholder Return
MLMAP2020 [2016-2020] Progress Financial Data Corporate profile
PPampE Investment to MIRA(30BJYP) Depreciation Goodwill of MIRA(04BJYP) Biwako factory (07BJYP) RampD Increased in Automotive Test System Business
Good will of MIRA eg hellip Amortization included
2017 Topics
PPampE Investment to MIRA(30BJYP) Expansion of Aso Factory(27BJYP)
Depreciation Goodwill of MIRA(04BJYP) Increase in MIRA and Test center invested in 2016 RampD Increase in Auto and PampE Business
Capital Investment Depreciation RampD (Billions of yen)
全社実績
セグ実績
全社予算
全社予算2案
セグ予算
セグ予算2案
受注_残
半期予想
設備投資
HOR単体実績
HOR単体予算
HOR単体上期予算
copy 2017 HORIBA Ltd All rights reserved 45
241 Bond
redemption in 2020
Current ratio
280
2014 254 60
Short 66
Cash1
492
Bonds 150
Long 25
Cash1
478
Bonds 150
Long 22 Short 108
2013 269 60
447
Cash1
511
Bonds 150
Long 168
Short 128
2015 229 55
Borrowed from JBIC2
151bn yen (2015)
Capital ratio
467
2016 237 55
Cash1
519
Bonds 150
Long 192
Short 124
Cash Balance (Billions of yen)
(Consolidated basis each end of the year) Total Loan Balance
Conclusion of liquidation of receivable contract with 2 banks Recent issuer rating RampI [A-] (July 2016) JCR [A] (August 2016)
1 CashhellipCash and Cash Equivalents at End of Period 2 JBIC Japan Bank for International Cooperation
Graph1
Sheet1
Sheet1
現預金
短期
長期
社債
Sheet1 (2)
tajikaABX =gtHIL
tajikaSTEC=gtHOR
copy 2017 HORIBA Ltd All rights reserved 46
Contents
2016 Results
2017 Forecast
Business Segment Outline
Shareholder Return
MLMAP2020 [2016-2020]Progress Financial Data Corporate profile
copy 2017 HORIBA Ltd All rights reserved 47
Head office Kyoto Japan Founded 1945 Incorporated 1953 CEO Atsushi Horiba Fiscal year end December 31
Atsushi Horiba Chairman President amp CEO
- Corporate motto -
To have interest and pride in our work to enjoy our lives
Corporate Profile
copy 2017 HORIBA Ltd All rights reserved 48
Medical In-Vitro Diagnostic (IVD) Systems Integration of HORIBA ABXrsquos Technology amp Marketing Know-How
Automotive Test Systems Emission Measurement Systems (EMS) Mechatronics Devices (MCT) Driving Control Systems (ITS) Engineering Consultancy amp Testing (ECT)
Business Segments
Process amp Environmental Environmental Systems Environmental Radiation Monitor Environmental Regulation amp Process Business
Semiconductor Mass Flow Controller In-situ Analysis Synergy among HORIBA HQ HORIBA STEC and HORIBA Jobin Yvonrsquos Technologies
Scientific Synergy of HORIBA and HORIBA Jobin Yvonrsquos Technologies Raman Grating and Fluorescence
copy 2017 HORIBA Ltd All rights reserved 49
Sales 1700 Billions of Yen
Business Composition of Sales
Automotive Test Systems
Process amp Environmental
Medical
Semiconductor
Scientific
Automotive 622 (36)
Scientific 257 (15)
Semiconductor 388 (23)
Medical 265 (16)
PampE 167 (10)
Well Balanced Business Operation -Five Business Segments-
(Billions of Yen)
copy 2017 HORIBA Ltd All rights reserved 50
Market Shares
Market shares quoted are estimates by HORIBA
80 20 100
35
Emission Measurement Systems
57 30
Stack Gas Analyzers Automatic Blood Cell Counter plus CRP
Mass Flow Controllers Raman Spectrophotometers Gratings
Global Domestic
copy 2017 HORIBA Ltd All rights reserved 51
EU Japan
Asia Americas
33
26 18
23
Geographic Composition of Sales(2016)
HORIBA Worldwide
Sales of FY2016 1700 BJPY
The Number of Group Companies by region (As of December 31 2016)
America 9 Europe 23 Asia 17 (4 in Japan including HORIBA Ltd) Total 49
copy 2017 HORIBA Ltd All rights reserved 52
Japan 38
Other Asia 15
France 13
Germany 8
Other Europe 2 USA
10
Other Americas 3
7149
従業員数 2015年12月31日現在
2442
946
3761
UK 11
Employees by Region
Total Number of Employees (As of December 31 2016)
Total Asia 53
Total Europe 34
Total Americas 13
copy 2017 HORIBA Ltd All rights reserved 53 copy 2017 HORIBA Ltd All rights reserved 53
copy 2017 HORIBA Ltd All rights reserved 54
Danke
Grazie
Σας ευχαριστούμε
감사합니다
Obrigado
谢谢
ขอบคณครบ
ありがとうございました
धनयवाद
நனற
Cảm ơn
Dziękuję
Tack ska ni ha
Thank you
Merci
Gracias
Большое спасибо
スライド番号 1
Contents
Contents
スライド番号 4
Summary of 2016 Results
2016 full year results
2016 Results by Segment
Contents
2017 Market outlook
Exchange rate forecast for 2017
Forecast for 2017
Forecast for 2017 by segment
Contents
スライド番号 14
2016 Results and 2017 Forecast
Strategy for improving profitability
Regulatory trend in EMS (Emission Measurement System) and Operations in an emerging Market
ECT (HORIBA MIRA) Business
2016 Results and 2017 Forecast
Analysis technology for the environment
2016 Results and 2017 Forecast
Growth with New Brand and Service
2016 Results and 2017 Forecast
スライド番号 24
2016 Results and 2017 Forecast
Exploit new markets using HORIBA technology
Contents
Shareholder Return
Contents
スライド番号 30
スライド番号 31
スライド番号 32
Accelerate growth in water measuring business
Water measuring and analysisbusiness domain
Water measuring and analysisbusiness domain
Selected as one of New Diversity Management Selection 100 (by the Ministry of Economy Trade and Industry of Japan)
Enhance asset efficiency and maximize corporate value
Symbol of MLMAP2020
Contents
Trend of Market capitalization
Changed the accounting policy for revenue recognition
スライド番号 42
スライド番号 43
スライド番号 44
スライド番号 45
Contents
スライド番号 47
Business Segments
スライド番号 49
Market Shares
スライド番号 51
スライド番号 52
スライド番号 53
スライド番号 54
勘定科目
BS_CL12010
BS_CL12020
BS_CL12030
BS_FL21000
BS_FL23000
勘定科目名称
当座借越
短期借入金
1年内返済長期借入金
社債
長期借入金
HOR
0
(2000000000)
0
(10000000000)
0
日本 ニホン
ABX
(827350776)
(4016672108)
(534035942)
0
(1343663409)
欧州 オウシュウ
ASEC
0
(352000000)
0
0
(180000000)
日本 ニホン
HE
0
(1855530779)
0
0
0
欧州 オウシュウ
HIC
0
(1156081000)
(109236000)
0
(682725000)
米州 ベイシュウ
HIT
(99662290)
0
(200000000)
0
(300000000)
日本 ニホン
HSC
0
(20019305)
0
0
0
アジア
HST
0
(166375000)
0
0
0
アジア
JY
0
0
(9753688)
0
(105723687)
欧州 オウシュウ
会社間照合
0
(5047)
欧州 オウシュウ
会社間照合
200000000
日本 ニホン
会社間照合
480000000
日本 ニホン
会社間照合
2000000000
日本 ニホン
会社間照合
118647000
欧州 オウシュウ
会社間照合
175953553
欧州 オウシュウ
連結合計
(927013066)
(7272082686)
(653025630)
(10000000000)
(2132112096)
(99662290)
(352000000)
0
(10000000000)
0
日本 ニホン
(827350776)
(5577607381)
(543789630)
0
(1449387096)
欧州 オウシュウ
0
(1156081000)
(109236000)
0
(682725000)
米州 ベイシュウ
0
(186394305)
0
0
0
アジア
(927013066)
(7272082686)
(653025630)
(10000000000)
(2132112096)
2008
2009
2010
2011
2012
2013
2008
2008
2009
2009
2013
2013
2014
2014
2015
2015
2016
2016
短期借入金 タンキカリイレキン
8852
6618
5575
6684
5523
6606
現預金 ゲンヨキン
18267
21520
49246
51109
47859
51900
長期借入金 チョウキカリイレキン
2132
1730
1195
1291
2113
2576
短期 タンキ
8852
6618
6606
10832
12800
12400
社債 シャサイ
10000
10000
10000
10000
10000
15000
長期 チョウキ
2132
1730
2576
2209
16800
19200
現預金 ゲンヨキン
18267
21520
26958
28893
34685
42228
社債 シャサイ
10000
10000
15000
15000
15000
15000
流動比率 リュウドウヒリツ
2296
2524
2653
2806
2970
2690
自己資本比率 ジコシホンヒリツ
576
609
612
624
650
600
49246
6606
2576
15000
51109
10832
2209
15000
47859
12800
16800
15000
51900
12400
19200
15000
2013年実績 ネン ジッセキ
2014年実績 ネン ジッセキ
2015年計画 ネン ケイカク
増減
計画(GBM) ケイカク
発表案 ハッピョウ アン
vs 2014
売上高 ウリアゲ タカ
営業利益 エイギョウ リエキ
経常利益 ケイジョウ リエキ
当期純利益 トウキ ジュンリエキ
2013年 ネン
2014年 ネン
2015年 ネン
増減
実績
実績
計画(GBM) ケイカク
決定 ケッテイ
vs 2014
売上高 ウリアゲ タカ
営業利益 エイギョウ リエキ
経常利益 ケイジョウ リエキ
当期純利益 トウキ ジュンリエキ
営業利益率 エイギョウ リエキ リツ
2013実績 ジッセキ
2014年 ネン
増減
開示116 カイジ
実績 ジッセキ
vs 2013
売上高 ウリアゲ タカ
営業利益 エイギョウ リエキ
経常利益 ケイジョウ リエキ
当期純利益 トウキ ジュンリエキ
2015
2016
2017
Results
Forecast117
Results
vs 2015
vs Forecast117
Forecast
vs 2016
PPampE
148
153
134
-10
-12
146
+9
Intangibles
14
07
03
-75
-49
04
+11
Capital Investment
163
160
137
-15
-14
150
+9
Depreciation
61
65
68
+12
+5
72
+6
RampD
123
130
129
+5
-1
140
+8
(To net sales)
(7)
(8)
(8)
(8)
2014年 ネン
2015年 ネン
実績 ジッセキ
社内数値 シャナイ スウチ
発表案 ハッピョウ アン
上期 カミ キ
下期 シモキ
通期 ツウキ
上期 カミキ
下期 シモキ
通期 ツウキ
上期 カミ キ
下期 シモキ
通期 ツウキ
売上高 ウリアゲ ダカ
0
0
0
0
0
自動車 ジドウシャ
0
0
0
環境 カンキョウ
0
0
0
医用 イヨウ
0
0
0
半導体 ハンドウタイ
0
0
0
科学 カガク
0
0
0
営業利益 エイギョウ リエキ
0
0
0
0
0
自動車 ジドウシャ
0
0
0
環境 カンキョウ
0
0
0
医用 イヨウ
0
0
0
半導体 ハンドウタイ
0
0
0
科学 カガク
0
0
0
経常利益 ケイジョウ リエキ
0
0
当期純利益 トウキ ジュンリエキ
0
0
営業利益率 エイギョウ リエキ リツ
ERRORDIV0
ERRORDIV0
ERRORDIV0
ERRORDIV0
ERRORDIV0
ERRORDIV0
ERRORDIV0
ERRORDIV0
ERRORDIV0
自動車 ジドウシャ
ERRORDIV0
ERRORDIV0
ERRORDIV0
ERRORDIV0
ERRORDIV0
ERRORDIV0
ERRORDIV0
ERRORDIV0
ERRORDIV0
環境 カンキョウ
ERRORDIV0
ERRORDIV0
ERRORDIV0
ERRORDIV0
ERRORDIV0
ERRORDIV0
ERRORDIV0
ERRORDIV0
ERRORDIV0
医用 イヨウ
ERRORDIV0
ERRORDIV0
ERRORDIV0
ERRORDIV0
ERRORDIV0
ERRORDIV0
ERRORDIV0
ERRORDIV0
ERRORDIV0
半導体 ハンドウタイ
ERRORDIV0
ERRORDIV0
ERRORDIV0
ERRORDIV0
ERRORDIV0
ERRORDIV0
ERRORDIV0
ERRORDIV0
ERRORDIV0
科学 カガク
ERRORDIV0
ERRORDIV0
ERRORDIV0
ERRORDIV0
ERRORDIV0
ERRORDIV0
ERRORDIV0
ERRORDIV0
ERRORDIV0
受注実績 ジュチュウ ジッセキ
2013
2014
1Q
2Q
3Q
4Q
1Q
2Q
3Q
4Q
自動車
128
125
103
166
環境
39
38
41
40
医用
67
64
60
71
半導体
46
51
69
88
科学
53
61
61
77
合計
334
341
337
444
受注残 ジュチュウ ザン
2013
2014
1Q
2Q
3Q
4Q
1Q
2Q
3Q
4Q
自動車
314
335
325
314
環境
33
39
45
38
医用
30
27
24
23
半導体
20
15
25
31
科学
55
67
76
76
合計
454
486
497
484
受注実績 ジュチュウ ジッセキ
2013
2014
1Q
2Q
3Q
4Q
1Q
2Q
3Q
4Q
自動車
128
125
103
166
EMS
93
91
78
110
MCT
32
30
24
48
HIT
4
4
2
9
受注残 ジュチュウ ザン
2013
2014
推移 スイイ
1Q
2Q
3Q
4Q
1Q
2Q
3Q
4Q
自動車
314
335
325
314
EMS
173
188
195
177
MCT
135
142
125
128
HIT
5
5
4
7
売上高 ウリアゲ ダカ
営業利益 エイギョウ リエキ
2014
2015 計画 ケイカク
2014
2015 計画 ケイカク
実績 ジッセキ
社内数値 シャナイ スウチ
発表案① ハッピョウ アン
発表案② ハッピョウ アン
MLMAP2015年数値 ネン スウチ
実績 ジッセキ
社内数値 シャナイ スウチ
発表案① ハッピョウ アン
発表案② ハッピョウ アン
MLMAP2015年数値 ネン スウチ
vs 2014
vs 2014
対外発表 タイガイ ハッピョウ
社内数値 シャナイ スウチ
vs 2014
vs 2014
対外発表 タイガイ ハッピョウ
社内数値 シャナイ スウチ
自動車 ジドウシャ
環境 カンキョウ
医用 イヨウ
半導体 ハンドウタイ
科学 カガク
合計 ゴウケイ
営業利益 エイギョウ リエキ
2014
2015 計画 ケイカク
実績 ジッセキ
社内数値 シャナイ スウチ
発表案① ハッピョウ アン
発表案② ハッピョウ アン
MLMAP2015年数値 ネン スウチ
vs 2014
vs 2014
対外発表 タイガイ ハッピョウ
社内数値 シャナイ スウチ
自動車 ジドウシャ
環境 カンキョウ
医用 イヨウ
半導体 ハンドウタイ
科学 カガク
合計 ゴウケイ
売上高 ウリアゲ ダカ
営業利益 エイギョウ リエキ
2014
2015
2014
2015
実績 ジッセキ
社内数値 シャナイ スウチ
発表案 ハッピョウ アン
vs2014
実績 ジッセキ
社内数値 シャナイ スウチ
発表案 ハッピョウ アン
vs2014
自動車 ジドウシャ
環境 カンキョウ
医用 イヨウ
半導体 ハンドウタイ
科学 カガク
合計 ゴウケイ
2014
2015年計画 ネン ケイカク
実績 ジッセキ
社内数値 シャナイ スウチ
開示案① カイジ アン ハツアン
開示案② カイジ アン ハツアン
MLMAP2015年数値 ネン スウチ
市場 シジョウ
vs 2014
vs 2014
対外発表 タイガイ ハッピョウ
社内数値 シャナイ スウチ
8社平均 シャ ヘイキン
売上高 ウリアゲ タカ
営業利益 エイギョウ リエキ
経常利益 ケイジョウ リエキ
当期純利益 トウキ ジュンリエキ
営業利益率 エイギョウ リエキ リツ
ドル
ユーロ
配当(円1株) ハイトウ エン カブ
2014
2015
MLMAP2015年数値 ネン スウチ
市場 シジョウ
実績 ジッセキ
社内数値 シャナイ スウチ
発表案 ハッピョウ アン
vs2014
対外発表 タイガイ ハッピョウ
社内数値 シャナイ スウチ
8社平均 シャ ヘイキン
売上高 ウリアゲ タカ
営業利益 エイギョウ リエキ
経常利益 ケイジョウ リエキ
当期純利益 トウキ ジュンリエキ
営業利益率 エイギョウ リエキ リツ
ドル
ユーロ
配当(円1株) ハイトウ エン カブ
売上高 ウリアゲ ダカ
営業利益 エイギョウ リエキ
2013年 ネン
2014年 ネン
2013年 ネン
2014年 ネン
実績 ジッセキ
開示116 カイジ
実績 ジッセキ
増減vsv2013 ゾウゲン
実績 ジッセキ
開示116 カイジ
実績 ジッセキ
増減vsv2013 ゾウゲン
自動車 ジドウシャ
環境 カンキョウ
医用 イヨウ
半導体 ハンドウタイ
科学 カガク
合計 ゴウケイ
2013年 ネン
2014年 ネン
増減比較 ゾウゲン ヒカク
市場 シジョウ
実績 ジッセキ
開示(116) カイジ
実績(監査前) ジッセキ カンサ マエ
vs 13年 ネン
vs 開示 カイジ
8社平均 シャ ヘイキン
売上高 ウリアゲ タカ
営業利益 エイギョウ リエキ
経常利益 ケイジョウ リエキ
当期純利益 トウキ ジュンリエキ
営業利益率 エイギョウ リエキ リツ
配当 ハイトウ
配当性向 ハイトウ セイコウ
為替レート(累計)
ドル
ユーロ
2015
2016
Variation
Cash flows from operating activities
14770
15871
1101
Cash flows from investing activities
-30642
-10427
20214
Cash flows from financing activities
12843
-451
-13294
Cash and cash equivalents at end of year
47859
51940
4081
Free cash flows
-15872
5443
21315
Changed points
Original
Shipment base
New
The date of delivery or installation based on contractual arrangements
Applied timing
January 2016
Reason for change
Triggered by the introduction of a new ERP implementation to harmonize with international accounting standards
copy 2017 HORIBA Ltd All rights reserved 24
Open April 2017
Location Yongin-si Korea (Suburb of Seoul)
Function Engineering Production Sales and
Service of MFC for Korean market
Objective Strengthen Production Engineering
and Education capability
Investment for capacity expansion
Semi
HORIBA STECrsquos Aso Factory capacity expansion Amount 27bn yen Completion Nov 2017 (Plan) Target Increase in production capacity for
mass flow controllers (15 times larger space)
40
50
60
70
2010 2011 2012 2013 2014 2015 2016
HORIBA STEC Korea Ltd New office establishment
2016 57
Global market share of MFC
Extended area The first company to invest in capacity expansion in Kumamoto Prefecture after the earthquakes
Aso Factoryrsquos capacity expansion and the market share in mass flow controllers
Current
Overview HORIBA STEC Korea Ltd New Office
copy 2017 HORIBA Ltd All rights reserved 25
bull More applications for the private sector in Japan
bull Weak sales to academia in all regions bull New product release through integrating
technologies within HORIBA Group
Scientific
bull Firm sales to the private sector and weak sales to academia in Japan
Cutting-edge technology of HORIBA and HORIBA Jobin Yvon Close relationship with academia
MESA-50T SEM-CL
For a rare metal manufacturer
Software development for rare metal analysis
Customized chamber
Specialized in defect
characterization Applied Topcon technology
Collaboration with Raman Testing for protein and
drugs
INV-XploRA
Cutting-edge material development
High concentration cell Minute amount
measurement
New market creation and product development to meet customerrsquos needs
LA-960
Imaging CL device (released in Aug 2016) Convert defective images into high-accuracy images Characteristic distribution analysis of phosphor parts of LED
elements Accelerate RampD for the next-generation power devices
HORIBA HORIBA Jobin Yvon
Electron beam technology of Topcon
New product by integrating HORIBA Grouprsquos technologies
Materials for semiconductors Life science sector
Imaging Cathodoluminescence (CL)
Scientific
copy 2017 HORIBA Ltd All rights reserved 27
Contents
2016 Results
2017 Forecast
Business Segment Outline
Shareholder Return
MLMAP2020 [2016-2020] Progress Financial Data Corporate profile
copy 2017 HORIBA Ltd All rights reserved 28
2015 Results 70 yen per share + 2016 Results 85 yen per share 2017 Forecast 90 yen per share
- Dividend payment + Share buyback = 30 of Consolidated net profit to be targeted - Remaining earnings are retained internally for strategic investment (ie facilities MampA)
(Yen) Per-share dividend (from 2002 to 2017 Forecast)
Basic policy (since 2013)
Dividends and Share buybacks
(fore)
2015 Share buyback 218400 shares
about 10 billion yen
Record high for 7 years in a row
An Average total return ratio of last 3years 292
copy 2017 HORIBA Ltd All rights reserved 29
Contents
2016 Results
2017 Forecast
Business Segment Outline
Shareholder Return
MLMAP2020 [2016-2020] Progress Financial Data Corporate profile
HORIBA Stained Glass Project Lunch gatherings of working mothers Seminars on how to balance long-term care and work Workshop to improve work productivity
Selected as one of New Diversity Management Selection 100 (by the Ministry of Economy Trade and Industry of Japan)
Reasons for the award Corporate motto ldquoJoy and Funrdquo and the Stained Glass Project
Mr Saito executive vice president and Ms Moriguchi leader of Stained Glass Project at the award-receiving ceremony
copy 2017 HORIBA Ltd All rights reserved 37
Decided to introduce a new KPI to measure asset efficiency Indicator composed of ldquoOperating profitrdquo and ldquoWACCrdquo Applying unit Business segments and Group companies Strengthen PDCA cycle Efficient use of business assets and increase profit
Plan to prepare a budget to this project in 2018
Founded financial subsidiaries in the US and the UK Improve capital efficiency through group financing Strengthen financial management function in each region
Enhance asset efficiency and maximize corporate value
Improve asset efficiency amp
Accelerate business growth
Investment
Business Growth
Cash Generation
copy 2017 HORIBA Ltd All rights reserved 38
Symbol of MLMAP2020
Step out of the existing business fields and pursue further expansion Take a new perspective and overcome technologicalmarketorganization barriers
Be flexible think outside the box and move up to the next stage
ONE STEP AHEAD - To create a next stage of HORIBA -
copy 2017 HORIBA Ltd All rights reserved 39
Contents
2016 Results
2017 Forecast
Business Segment Outline
Shareholder Return
MLMAP2020 [2016-2020] Progress Financial Data Corporate profile
PPampE Investment to MIRA(30BJYP) Depreciation Goodwill of MIRA(04BJYP) Biwako factory (07BJYP) RampD Increased in Automotive Test System Business
Good will of MIRA eg hellip Amortization included
2017 Topics
PPampE Investment to MIRA(30BJYP) Expansion of Aso Factory(27BJYP)
Depreciation Goodwill of MIRA(04BJYP) Increase in MIRA and Test center invested in 2016 RampD Increase in Auto and PampE Business
Capital Investment Depreciation RampD (Billions of yen)
全社実績
セグ実績
全社予算
全社予算2案
セグ予算
セグ予算2案
受注_残
半期予想
設備投資
HOR単体実績
HOR単体予算
HOR単体上期予算
copy 2017 HORIBA Ltd All rights reserved 45
241 Bond
redemption in 2020
Current ratio
280
2014 254 60
Short 66
Cash1
492
Bonds 150
Long 25
Cash1
478
Bonds 150
Long 22 Short 108
2013 269 60
447
Cash1
511
Bonds 150
Long 168
Short 128
2015 229 55
Borrowed from JBIC2
151bn yen (2015)
Capital ratio
467
2016 237 55
Cash1
519
Bonds 150
Long 192
Short 124
Cash Balance (Billions of yen)
(Consolidated basis each end of the year) Total Loan Balance
Conclusion of liquidation of receivable contract with 2 banks Recent issuer rating RampI [A-] (July 2016) JCR [A] (August 2016)
1 CashhellipCash and Cash Equivalents at End of Period 2 JBIC Japan Bank for International Cooperation
Graph1
Sheet1
Sheet1
現預金
短期
長期
社債
Sheet1 (2)
tajikaABX =gtHIL
tajikaSTEC=gtHOR
copy 2017 HORIBA Ltd All rights reserved 46
Contents
2016 Results
2017 Forecast
Business Segment Outline
Shareholder Return
MLMAP2020 [2016-2020]Progress Financial Data Corporate profile
copy 2017 HORIBA Ltd All rights reserved 47
Head office Kyoto Japan Founded 1945 Incorporated 1953 CEO Atsushi Horiba Fiscal year end December 31
Atsushi Horiba Chairman President amp CEO
- Corporate motto -
To have interest and pride in our work to enjoy our lives
Corporate Profile
copy 2017 HORIBA Ltd All rights reserved 48
Medical In-Vitro Diagnostic (IVD) Systems Integration of HORIBA ABXrsquos Technology amp Marketing Know-How
Automotive Test Systems Emission Measurement Systems (EMS) Mechatronics Devices (MCT) Driving Control Systems (ITS) Engineering Consultancy amp Testing (ECT)
Business Segments
Process amp Environmental Environmental Systems Environmental Radiation Monitor Environmental Regulation amp Process Business
Semiconductor Mass Flow Controller In-situ Analysis Synergy among HORIBA HQ HORIBA STEC and HORIBA Jobin Yvonrsquos Technologies
Scientific Synergy of HORIBA and HORIBA Jobin Yvonrsquos Technologies Raman Grating and Fluorescence
copy 2017 HORIBA Ltd All rights reserved 49
Sales 1700 Billions of Yen
Business Composition of Sales
Automotive Test Systems
Process amp Environmental
Medical
Semiconductor
Scientific
Automotive 622 (36)
Scientific 257 (15)
Semiconductor 388 (23)
Medical 265 (16)
PampE 167 (10)
Well Balanced Business Operation -Five Business Segments-
(Billions of Yen)
copy 2017 HORIBA Ltd All rights reserved 50
Market Shares
Market shares quoted are estimates by HORIBA
80 20 100
35
Emission Measurement Systems
57 30
Stack Gas Analyzers Automatic Blood Cell Counter plus CRP
Mass Flow Controllers Raman Spectrophotometers Gratings
Global Domestic
copy 2017 HORIBA Ltd All rights reserved 51
EU Japan
Asia Americas
33
26 18
23
Geographic Composition of Sales(2016)
HORIBA Worldwide
Sales of FY2016 1700 BJPY
The Number of Group Companies by region (As of December 31 2016)
America 9 Europe 23 Asia 17 (4 in Japan including HORIBA Ltd) Total 49
copy 2017 HORIBA Ltd All rights reserved 52
Japan 38
Other Asia 15
France 13
Germany 8
Other Europe 2 USA
10
Other Americas 3
7149
従業員数 2015年12月31日現在
2442
946
3761
UK 11
Employees by Region
Total Number of Employees (As of December 31 2016)
Total Asia 53
Total Europe 34
Total Americas 13
copy 2017 HORIBA Ltd All rights reserved 53 copy 2017 HORIBA Ltd All rights reserved 53
copy 2017 HORIBA Ltd All rights reserved 54
Danke
Grazie
Σας ευχαριστούμε
감사합니다
Obrigado
谢谢
ขอบคณครบ
ありがとうございました
धनयवाद
நனற
Cảm ơn
Dziękuję
Tack ska ni ha
Thank you
Merci
Gracias
Большое спасибо
スライド番号 1
Contents
Contents
スライド番号 4
Summary of 2016 Results
2016 full year results
2016 Results by Segment
Contents
2017 Market outlook
Exchange rate forecast for 2017
Forecast for 2017
Forecast for 2017 by segment
Contents
スライド番号 14
2016 Results and 2017 Forecast
Strategy for improving profitability
Regulatory trend in EMS (Emission Measurement System) and Operations in an emerging Market
ECT (HORIBA MIRA) Business
2016 Results and 2017 Forecast
Analysis technology for the environment
2016 Results and 2017 Forecast
Growth with New Brand and Service
2016 Results and 2017 Forecast
スライド番号 24
2016 Results and 2017 Forecast
Exploit new markets using HORIBA technology
Contents
Shareholder Return
Contents
スライド番号 30
スライド番号 31
スライド番号 32
Accelerate growth in water measuring business
Water measuring and analysisbusiness domain
Water measuring and analysisbusiness domain
Selected as one of New Diversity Management Selection 100 (by the Ministry of Economy Trade and Industry of Japan)
Enhance asset efficiency and maximize corporate value
Symbol of MLMAP2020
Contents
Trend of Market capitalization
Changed the accounting policy for revenue recognition
スライド番号 42
スライド番号 43
スライド番号 44
スライド番号 45
Contents
スライド番号 47
Business Segments
スライド番号 49
Market Shares
スライド番号 51
スライド番号 52
スライド番号 53
スライド番号 54
勘定科目
BS_CL12010
BS_CL12020
BS_CL12030
BS_FL21000
BS_FL23000
勘定科目名称
当座借越
短期借入金
1年内返済長期借入金
社債
長期借入金
HOR
0
(2000000000)
0
(10000000000)
0
日本 ニホン
ABX
(827350776)
(4016672108)
(534035942)
0
(1343663409)
欧州 オウシュウ
ASEC
0
(352000000)
0
0
(180000000)
日本 ニホン
HE
0
(1855530779)
0
0
0
欧州 オウシュウ
HIC
0
(1156081000)
(109236000)
0
(682725000)
米州 ベイシュウ
HIT
(99662290)
0
(200000000)
0
(300000000)
日本 ニホン
HSC
0
(20019305)
0
0
0
アジア
HST
0
(166375000)
0
0
0
アジア
JY
0
0
(9753688)
0
(105723687)
欧州 オウシュウ
会社間照合
0
(5047)
欧州 オウシュウ
会社間照合
200000000
日本 ニホン
会社間照合
480000000
日本 ニホン
会社間照合
2000000000
日本 ニホン
会社間照合
118647000
欧州 オウシュウ
会社間照合
175953553
欧州 オウシュウ
連結合計
(927013066)
(7272082686)
(653025630)
(10000000000)
(2132112096)
(99662290)
(352000000)
0
(10000000000)
0
日本 ニホン
(827350776)
(5577607381)
(543789630)
0
(1449387096)
欧州 オウシュウ
0
(1156081000)
(109236000)
0
(682725000)
米州 ベイシュウ
0
(186394305)
0
0
0
アジア
(927013066)
(7272082686)
(653025630)
(10000000000)
(2132112096)
2008
2009
2010
2011
2012
2013
2008
2008
2009
2009
2013
2013
2014
2014
2015
2015
2016
2016
短期借入金 タンキカリイレキン
8852
6618
5575
6684
5523
6606
現預金 ゲンヨキン
18267
21520
49246
51109
47859
51900
長期借入金 チョウキカリイレキン
2132
1730
1195
1291
2113
2576
短期 タンキ
8852
6618
6606
10832
12800
12400
社債 シャサイ
10000
10000
10000
10000
10000
15000
長期 チョウキ
2132
1730
2576
2209
16800
19200
現預金 ゲンヨキン
18267
21520
26958
28893
34685
42228
社債 シャサイ
10000
10000
15000
15000
15000
15000
流動比率 リュウドウヒリツ
2296
2524
2653
2806
2970
2690
自己資本比率 ジコシホンヒリツ
576
609
612
624
650
600
49246
6606
2576
15000
51109
10832
2209
15000
47859
12800
16800
15000
51900
12400
19200
15000
2013年実績 ネン ジッセキ
2014年実績 ネン ジッセキ
2015年計画 ネン ケイカク
増減
計画(GBM) ケイカク
発表案 ハッピョウ アン
vs 2014
売上高 ウリアゲ タカ
営業利益 エイギョウ リエキ
経常利益 ケイジョウ リエキ
当期純利益 トウキ ジュンリエキ
2013年 ネン
2014年 ネン
2015年 ネン
増減
実績
実績
計画(GBM) ケイカク
決定 ケッテイ
vs 2014
売上高 ウリアゲ タカ
営業利益 エイギョウ リエキ
経常利益 ケイジョウ リエキ
当期純利益 トウキ ジュンリエキ
営業利益率 エイギョウ リエキ リツ
2013実績 ジッセキ
2014年 ネン
増減
開示116 カイジ
実績 ジッセキ
vs 2013
売上高 ウリアゲ タカ
営業利益 エイギョウ リエキ
経常利益 ケイジョウ リエキ
当期純利益 トウキ ジュンリエキ
2015
2016
2017
Results
Forecast117
Results
vs 2015
vs Forecast117
Forecast
vs 2016
PPampE
148
153
134
-10
-12
146
+9
Intangibles
14
07
03
-75
-49
04
+11
Capital Investment
163
160
137
-15
-14
150
+9
Depreciation
61
65
68
+12
+5
72
+6
RampD
123
130
129
+5
-1
140
+8
(To net sales)
(7)
(8)
(8)
(8)
2014年 ネン
2015年 ネン
実績 ジッセキ
社内数値 シャナイ スウチ
発表案 ハッピョウ アン
上期 カミ キ
下期 シモキ
通期 ツウキ
上期 カミキ
下期 シモキ
通期 ツウキ
上期 カミ キ
下期 シモキ
通期 ツウキ
売上高 ウリアゲ ダカ
0
0
0
0
0
自動車 ジドウシャ
0
0
0
環境 カンキョウ
0
0
0
医用 イヨウ
0
0
0
半導体 ハンドウタイ
0
0
0
科学 カガク
0
0
0
営業利益 エイギョウ リエキ
0
0
0
0
0
自動車 ジドウシャ
0
0
0
環境 カンキョウ
0
0
0
医用 イヨウ
0
0
0
半導体 ハンドウタイ
0
0
0
科学 カガク
0
0
0
経常利益 ケイジョウ リエキ
0
0
当期純利益 トウキ ジュンリエキ
0
0
営業利益率 エイギョウ リエキ リツ
ERRORDIV0
ERRORDIV0
ERRORDIV0
ERRORDIV0
ERRORDIV0
ERRORDIV0
ERRORDIV0
ERRORDIV0
ERRORDIV0
自動車 ジドウシャ
ERRORDIV0
ERRORDIV0
ERRORDIV0
ERRORDIV0
ERRORDIV0
ERRORDIV0
ERRORDIV0
ERRORDIV0
ERRORDIV0
環境 カンキョウ
ERRORDIV0
ERRORDIV0
ERRORDIV0
ERRORDIV0
ERRORDIV0
ERRORDIV0
ERRORDIV0
ERRORDIV0
ERRORDIV0
医用 イヨウ
ERRORDIV0
ERRORDIV0
ERRORDIV0
ERRORDIV0
ERRORDIV0
ERRORDIV0
ERRORDIV0
ERRORDIV0
ERRORDIV0
半導体 ハンドウタイ
ERRORDIV0
ERRORDIV0
ERRORDIV0
ERRORDIV0
ERRORDIV0
ERRORDIV0
ERRORDIV0
ERRORDIV0
ERRORDIV0
科学 カガク
ERRORDIV0
ERRORDIV0
ERRORDIV0
ERRORDIV0
ERRORDIV0
ERRORDIV0
ERRORDIV0
ERRORDIV0
ERRORDIV0
受注実績 ジュチュウ ジッセキ
2013
2014
1Q
2Q
3Q
4Q
1Q
2Q
3Q
4Q
自動車
128
125
103
166
環境
39
38
41
40
医用
67
64
60
71
半導体
46
51
69
88
科学
53
61
61
77
合計
334
341
337
444
受注残 ジュチュウ ザン
2013
2014
1Q
2Q
3Q
4Q
1Q
2Q
3Q
4Q
自動車
314
335
325
314
環境
33
39
45
38
医用
30
27
24
23
半導体
20
15
25
31
科学
55
67
76
76
合計
454
486
497
484
受注実績 ジュチュウ ジッセキ
2013
2014
1Q
2Q
3Q
4Q
1Q
2Q
3Q
4Q
自動車
128
125
103
166
EMS
93
91
78
110
MCT
32
30
24
48
HIT
4
4
2
9
受注残 ジュチュウ ザン
2013
2014
推移 スイイ
1Q
2Q
3Q
4Q
1Q
2Q
3Q
4Q
自動車
314
335
325
314
EMS
173
188
195
177
MCT
135
142
125
128
HIT
5
5
4
7
売上高 ウリアゲ ダカ
営業利益 エイギョウ リエキ
2014
2015 計画 ケイカク
2014
2015 計画 ケイカク
実績 ジッセキ
社内数値 シャナイ スウチ
発表案① ハッピョウ アン
発表案② ハッピョウ アン
MLMAP2015年数値 ネン スウチ
実績 ジッセキ
社内数値 シャナイ スウチ
発表案① ハッピョウ アン
発表案② ハッピョウ アン
MLMAP2015年数値 ネン スウチ
vs 2014
vs 2014
対外発表 タイガイ ハッピョウ
社内数値 シャナイ スウチ
vs 2014
vs 2014
対外発表 タイガイ ハッピョウ
社内数値 シャナイ スウチ
自動車 ジドウシャ
環境 カンキョウ
医用 イヨウ
半導体 ハンドウタイ
科学 カガク
合計 ゴウケイ
営業利益 エイギョウ リエキ
2014
2015 計画 ケイカク
実績 ジッセキ
社内数値 シャナイ スウチ
発表案① ハッピョウ アン
発表案② ハッピョウ アン
MLMAP2015年数値 ネン スウチ
vs 2014
vs 2014
対外発表 タイガイ ハッピョウ
社内数値 シャナイ スウチ
自動車 ジドウシャ
環境 カンキョウ
医用 イヨウ
半導体 ハンドウタイ
科学 カガク
合計 ゴウケイ
売上高 ウリアゲ ダカ
営業利益 エイギョウ リエキ
2014
2015
2014
2015
実績 ジッセキ
社内数値 シャナイ スウチ
発表案 ハッピョウ アン
vs2014
実績 ジッセキ
社内数値 シャナイ スウチ
発表案 ハッピョウ アン
vs2014
自動車 ジドウシャ
環境 カンキョウ
医用 イヨウ
半導体 ハンドウタイ
科学 カガク
合計 ゴウケイ
2014
2015年計画 ネン ケイカク
実績 ジッセキ
社内数値 シャナイ スウチ
開示案① カイジ アン ハツアン
開示案② カイジ アン ハツアン
MLMAP2015年数値 ネン スウチ
市場 シジョウ
vs 2014
vs 2014
対外発表 タイガイ ハッピョウ
社内数値 シャナイ スウチ
8社平均 シャ ヘイキン
売上高 ウリアゲ タカ
営業利益 エイギョウ リエキ
経常利益 ケイジョウ リエキ
当期純利益 トウキ ジュンリエキ
営業利益率 エイギョウ リエキ リツ
ドル
ユーロ
配当(円1株) ハイトウ エン カブ
2014
2015
MLMAP2015年数値 ネン スウチ
市場 シジョウ
実績 ジッセキ
社内数値 シャナイ スウチ
発表案 ハッピョウ アン
vs2014
対外発表 タイガイ ハッピョウ
社内数値 シャナイ スウチ
8社平均 シャ ヘイキン
売上高 ウリアゲ タカ
営業利益 エイギョウ リエキ
経常利益 ケイジョウ リエキ
当期純利益 トウキ ジュンリエキ
営業利益率 エイギョウ リエキ リツ
ドル
ユーロ
配当(円1株) ハイトウ エン カブ
売上高 ウリアゲ ダカ
営業利益 エイギョウ リエキ
2013年 ネン
2014年 ネン
2013年 ネン
2014年 ネン
実績 ジッセキ
開示116 カイジ
実績 ジッセキ
増減vsv2013 ゾウゲン
実績 ジッセキ
開示116 カイジ
実績 ジッセキ
増減vsv2013 ゾウゲン
自動車 ジドウシャ
環境 カンキョウ
医用 イヨウ
半導体 ハンドウタイ
科学 カガク
合計 ゴウケイ
2013年 ネン
2014年 ネン
増減比較 ゾウゲン ヒカク
市場 シジョウ
実績 ジッセキ
開示(116) カイジ
実績(監査前) ジッセキ カンサ マエ
vs 13年 ネン
vs 開示 カイジ
8社平均 シャ ヘイキン
売上高 ウリアゲ タカ
営業利益 エイギョウ リエキ
経常利益 ケイジョウ リエキ
当期純利益 トウキ ジュンリエキ
営業利益率 エイギョウ リエキ リツ
配当 ハイトウ
配当性向 ハイトウ セイコウ
為替レート(累計)
ドル
ユーロ
2015
2016
Variation
Cash flows from operating activities
14770
15871
1101
Cash flows from investing activities
-30642
-10427
20214
Cash flows from financing activities
12843
-451
-13294
Cash and cash equivalents at end of year
47859
51940
4081
Free cash flows
-15872
5443
21315
Changed points
Original
Shipment base
New
The date of delivery or installation based on contractual arrangements
Applied timing
January 2016
Reason for change
Triggered by the introduction of a new ERP implementation to harmonize with international accounting standards
copy 2017 HORIBA Ltd All rights reserved 26
Exploit new markets using HORIBA technology
Cutting-edge technology of HORIBA and HORIBA Jobin Yvon Close relationship with academia
MESA-50T SEM-CL
For a rare metal manufacturer
Software development for rare metal analysis
Customized chamber
Specialized in defect
characterization Applied Topcon technology
Collaboration with Raman Testing for protein and
drugs
INV-XploRA
Cutting-edge material development
High concentration cell Minute amount
measurement
New market creation and product development to meet customerrsquos needs
LA-960
Imaging CL device (released in Aug 2016) Convert defective images into high-accuracy images Characteristic distribution analysis of phosphor parts of LED
elements Accelerate RampD for the next-generation power devices
HORIBA HORIBA Jobin Yvon
Electron beam technology of Topcon
New product by integrating HORIBA Grouprsquos technologies
Materials for semiconductors Life science sector
Imaging Cathodoluminescence (CL)
Scientific
copy 2017 HORIBA Ltd All rights reserved 27
Contents
2016 Results
2017 Forecast
Business Segment Outline
Shareholder Return
MLMAP2020 [2016-2020] Progress Financial Data Corporate profile
copy 2017 HORIBA Ltd All rights reserved 28
2015 Results 70 yen per share + 2016 Results 85 yen per share 2017 Forecast 90 yen per share
- Dividend payment + Share buyback = 30 of Consolidated net profit to be targeted - Remaining earnings are retained internally for strategic investment (ie facilities MampA)
(Yen) Per-share dividend (from 2002 to 2017 Forecast)
Basic policy (since 2013)
Dividends and Share buybacks
(fore)
2015 Share buyback 218400 shares
about 10 billion yen
Record high for 7 years in a row
An Average total return ratio of last 3years 292
copy 2017 HORIBA Ltd All rights reserved 29
Contents
2016 Results
2017 Forecast
Business Segment Outline
Shareholder Return
MLMAP2020 [2016-2020] Progress Financial Data Corporate profile
HORIBA Stained Glass Project Lunch gatherings of working mothers Seminars on how to balance long-term care and work Workshop to improve work productivity
Selected as one of New Diversity Management Selection 100 (by the Ministry of Economy Trade and Industry of Japan)
Reasons for the award Corporate motto ldquoJoy and Funrdquo and the Stained Glass Project
Mr Saito executive vice president and Ms Moriguchi leader of Stained Glass Project at the award-receiving ceremony
copy 2017 HORIBA Ltd All rights reserved 37
Decided to introduce a new KPI to measure asset efficiency Indicator composed of ldquoOperating profitrdquo and ldquoWACCrdquo Applying unit Business segments and Group companies Strengthen PDCA cycle Efficient use of business assets and increase profit
Plan to prepare a budget to this project in 2018
Founded financial subsidiaries in the US and the UK Improve capital efficiency through group financing Strengthen financial management function in each region
Enhance asset efficiency and maximize corporate value
Improve asset efficiency amp
Accelerate business growth
Investment
Business Growth
Cash Generation
copy 2017 HORIBA Ltd All rights reserved 38
Symbol of MLMAP2020
Step out of the existing business fields and pursue further expansion Take a new perspective and overcome technologicalmarketorganization barriers
Be flexible think outside the box and move up to the next stage
ONE STEP AHEAD - To create a next stage of HORIBA -
copy 2017 HORIBA Ltd All rights reserved 39
Contents
2016 Results
2017 Forecast
Business Segment Outline
Shareholder Return
MLMAP2020 [2016-2020] Progress Financial Data Corporate profile
PPampE Investment to MIRA(30BJYP) Depreciation Goodwill of MIRA(04BJYP) Biwako factory (07BJYP) RampD Increased in Automotive Test System Business
Good will of MIRA eg hellip Amortization included
2017 Topics
PPampE Investment to MIRA(30BJYP) Expansion of Aso Factory(27BJYP)
Depreciation Goodwill of MIRA(04BJYP) Increase in MIRA and Test center invested in 2016 RampD Increase in Auto and PampE Business
Capital Investment Depreciation RampD (Billions of yen)
全社実績
セグ実績
全社予算
全社予算2案
セグ予算
セグ予算2案
受注_残
半期予想
設備投資
HOR単体実績
HOR単体予算
HOR単体上期予算
copy 2017 HORIBA Ltd All rights reserved 45
241 Bond
redemption in 2020
Current ratio
280
2014 254 60
Short 66
Cash1
492
Bonds 150
Long 25
Cash1
478
Bonds 150
Long 22 Short 108
2013 269 60
447
Cash1
511
Bonds 150
Long 168
Short 128
2015 229 55
Borrowed from JBIC2
151bn yen (2015)
Capital ratio
467
2016 237 55
Cash1
519
Bonds 150
Long 192
Short 124
Cash Balance (Billions of yen)
(Consolidated basis each end of the year) Total Loan Balance
Conclusion of liquidation of receivable contract with 2 banks Recent issuer rating RampI [A-] (July 2016) JCR [A] (August 2016)
1 CashhellipCash and Cash Equivalents at End of Period 2 JBIC Japan Bank for International Cooperation
Graph1
Sheet1
Sheet1
現預金
短期
長期
社債
Sheet1 (2)
tajikaABX =gtHIL
tajikaSTEC=gtHOR
copy 2017 HORIBA Ltd All rights reserved 46
Contents
2016 Results
2017 Forecast
Business Segment Outline
Shareholder Return
MLMAP2020 [2016-2020]Progress Financial Data Corporate profile
copy 2017 HORIBA Ltd All rights reserved 47
Head office Kyoto Japan Founded 1945 Incorporated 1953 CEO Atsushi Horiba Fiscal year end December 31
Atsushi Horiba Chairman President amp CEO
- Corporate motto -
To have interest and pride in our work to enjoy our lives
Corporate Profile
copy 2017 HORIBA Ltd All rights reserved 48
Medical In-Vitro Diagnostic (IVD) Systems Integration of HORIBA ABXrsquos Technology amp Marketing Know-How
Automotive Test Systems Emission Measurement Systems (EMS) Mechatronics Devices (MCT) Driving Control Systems (ITS) Engineering Consultancy amp Testing (ECT)
Business Segments
Process amp Environmental Environmental Systems Environmental Radiation Monitor Environmental Regulation amp Process Business
Semiconductor Mass Flow Controller In-situ Analysis Synergy among HORIBA HQ HORIBA STEC and HORIBA Jobin Yvonrsquos Technologies
Scientific Synergy of HORIBA and HORIBA Jobin Yvonrsquos Technologies Raman Grating and Fluorescence
copy 2017 HORIBA Ltd All rights reserved 49
Sales 1700 Billions of Yen
Business Composition of Sales
Automotive Test Systems
Process amp Environmental
Medical
Semiconductor
Scientific
Automotive 622 (36)
Scientific 257 (15)
Semiconductor 388 (23)
Medical 265 (16)
PampE 167 (10)
Well Balanced Business Operation -Five Business Segments-
(Billions of Yen)
copy 2017 HORIBA Ltd All rights reserved 50
Market Shares
Market shares quoted are estimates by HORIBA
80 20 100
35
Emission Measurement Systems
57 30
Stack Gas Analyzers Automatic Blood Cell Counter plus CRP
Mass Flow Controllers Raman Spectrophotometers Gratings
Global Domestic
copy 2017 HORIBA Ltd All rights reserved 51
EU Japan
Asia Americas
33
26 18
23
Geographic Composition of Sales(2016)
HORIBA Worldwide
Sales of FY2016 1700 BJPY
The Number of Group Companies by region (As of December 31 2016)
America 9 Europe 23 Asia 17 (4 in Japan including HORIBA Ltd) Total 49
copy 2017 HORIBA Ltd All rights reserved 52
Japan 38
Other Asia 15
France 13
Germany 8
Other Europe 2 USA
10
Other Americas 3
7149
従業員数 2015年12月31日現在
2442
946
3761
UK 11
Employees by Region
Total Number of Employees (As of December 31 2016)
Total Asia 53
Total Europe 34
Total Americas 13
copy 2017 HORIBA Ltd All rights reserved 53 copy 2017 HORIBA Ltd All rights reserved 53
copy 2017 HORIBA Ltd All rights reserved 54
Danke
Grazie
Σας ευχαριστούμε
감사합니다
Obrigado
谢谢
ขอบคณครบ
ありがとうございました
धनयवाद
நனற
Cảm ơn
Dziękuję
Tack ska ni ha
Thank you
Merci
Gracias
Большое спасибо
スライド番号 1
Contents
Contents
スライド番号 4
Summary of 2016 Results
2016 full year results
2016 Results by Segment
Contents
2017 Market outlook
Exchange rate forecast for 2017
Forecast for 2017
Forecast for 2017 by segment
Contents
スライド番号 14
2016 Results and 2017 Forecast
Strategy for improving profitability
Regulatory trend in EMS (Emission Measurement System) and Operations in an emerging Market
ECT (HORIBA MIRA) Business
2016 Results and 2017 Forecast
Analysis technology for the environment
2016 Results and 2017 Forecast
Growth with New Brand and Service
2016 Results and 2017 Forecast
スライド番号 24
2016 Results and 2017 Forecast
Exploit new markets using HORIBA technology
Contents
Shareholder Return
Contents
スライド番号 30
スライド番号 31
スライド番号 32
Accelerate growth in water measuring business
Water measuring and analysisbusiness domain
Water measuring and analysisbusiness domain
Selected as one of New Diversity Management Selection 100 (by the Ministry of Economy Trade and Industry of Japan)
Enhance asset efficiency and maximize corporate value
Symbol of MLMAP2020
Contents
Trend of Market capitalization
Changed the accounting policy for revenue recognition
スライド番号 42
スライド番号 43
スライド番号 44
スライド番号 45
Contents
スライド番号 47
Business Segments
スライド番号 49
Market Shares
スライド番号 51
スライド番号 52
スライド番号 53
スライド番号 54
勘定科目
BS_CL12010
BS_CL12020
BS_CL12030
BS_FL21000
BS_FL23000
勘定科目名称
当座借越
短期借入金
1年内返済長期借入金
社債
長期借入金
HOR
0
(2000000000)
0
(10000000000)
0
日本 ニホン
ABX
(827350776)
(4016672108)
(534035942)
0
(1343663409)
欧州 オウシュウ
ASEC
0
(352000000)
0
0
(180000000)
日本 ニホン
HE
0
(1855530779)
0
0
0
欧州 オウシュウ
HIC
0
(1156081000)
(109236000)
0
(682725000)
米州 ベイシュウ
HIT
(99662290)
0
(200000000)
0
(300000000)
日本 ニホン
HSC
0
(20019305)
0
0
0
アジア
HST
0
(166375000)
0
0
0
アジア
JY
0
0
(9753688)
0
(105723687)
欧州 オウシュウ
会社間照合
0
(5047)
欧州 オウシュウ
会社間照合
200000000
日本 ニホン
会社間照合
480000000
日本 ニホン
会社間照合
2000000000
日本 ニホン
会社間照合
118647000
欧州 オウシュウ
会社間照合
175953553
欧州 オウシュウ
連結合計
(927013066)
(7272082686)
(653025630)
(10000000000)
(2132112096)
(99662290)
(352000000)
0
(10000000000)
0
日本 ニホン
(827350776)
(5577607381)
(543789630)
0
(1449387096)
欧州 オウシュウ
0
(1156081000)
(109236000)
0
(682725000)
米州 ベイシュウ
0
(186394305)
0
0
0
アジア
(927013066)
(7272082686)
(653025630)
(10000000000)
(2132112096)
2008
2009
2010
2011
2012
2013
2008
2008
2009
2009
2013
2013
2014
2014
2015
2015
2016
2016
短期借入金 タンキカリイレキン
8852
6618
5575
6684
5523
6606
現預金 ゲンヨキン
18267
21520
49246
51109
47859
51900
長期借入金 チョウキカリイレキン
2132
1730
1195
1291
2113
2576
短期 タンキ
8852
6618
6606
10832
12800
12400
社債 シャサイ
10000
10000
10000
10000
10000
15000
長期 チョウキ
2132
1730
2576
2209
16800
19200
現預金 ゲンヨキン
18267
21520
26958
28893
34685
42228
社債 シャサイ
10000
10000
15000
15000
15000
15000
流動比率 リュウドウヒリツ
2296
2524
2653
2806
2970
2690
自己資本比率 ジコシホンヒリツ
576
609
612
624
650
600
49246
6606
2576
15000
51109
10832
2209
15000
47859
12800
16800
15000
51900
12400
19200
15000
2013年実績 ネン ジッセキ
2014年実績 ネン ジッセキ
2015年計画 ネン ケイカク
増減
計画(GBM) ケイカク
発表案 ハッピョウ アン
vs 2014
売上高 ウリアゲ タカ
営業利益 エイギョウ リエキ
経常利益 ケイジョウ リエキ
当期純利益 トウキ ジュンリエキ
2013年 ネン
2014年 ネン
2015年 ネン
増減
実績
実績
計画(GBM) ケイカク
決定 ケッテイ
vs 2014
売上高 ウリアゲ タカ
営業利益 エイギョウ リエキ
経常利益 ケイジョウ リエキ
当期純利益 トウキ ジュンリエキ
営業利益率 エイギョウ リエキ リツ
2013実績 ジッセキ
2014年 ネン
増減
開示116 カイジ
実績 ジッセキ
vs 2013
売上高 ウリアゲ タカ
営業利益 エイギョウ リエキ
経常利益 ケイジョウ リエキ
当期純利益 トウキ ジュンリエキ
2015
2016
2017
Results
Forecast117
Results
vs 2015
vs Forecast117
Forecast
vs 2016
PPampE
148
153
134
-10
-12
146
+9
Intangibles
14
07
03
-75
-49
04
+11
Capital Investment
163
160
137
-15
-14
150
+9
Depreciation
61
65
68
+12
+5
72
+6
RampD
123
130
129
+5
-1
140
+8
(To net sales)
(7)
(8)
(8)
(8)
2014年 ネン
2015年 ネン
実績 ジッセキ
社内数値 シャナイ スウチ
発表案 ハッピョウ アン
上期 カミ キ
下期 シモキ
通期 ツウキ
上期 カミキ
下期 シモキ
通期 ツウキ
上期 カミ キ
下期 シモキ
通期 ツウキ
売上高 ウリアゲ ダカ
0
0
0
0
0
自動車 ジドウシャ
0
0
0
環境 カンキョウ
0
0
0
医用 イヨウ
0
0
0
半導体 ハンドウタイ
0
0
0
科学 カガク
0
0
0
営業利益 エイギョウ リエキ
0
0
0
0
0
自動車 ジドウシャ
0
0
0
環境 カンキョウ
0
0
0
医用 イヨウ
0
0
0
半導体 ハンドウタイ
0
0
0
科学 カガク
0
0
0
経常利益 ケイジョウ リエキ
0
0
当期純利益 トウキ ジュンリエキ
0
0
営業利益率 エイギョウ リエキ リツ
ERRORDIV0
ERRORDIV0
ERRORDIV0
ERRORDIV0
ERRORDIV0
ERRORDIV0
ERRORDIV0
ERRORDIV0
ERRORDIV0
自動車 ジドウシャ
ERRORDIV0
ERRORDIV0
ERRORDIV0
ERRORDIV0
ERRORDIV0
ERRORDIV0
ERRORDIV0
ERRORDIV0
ERRORDIV0
環境 カンキョウ
ERRORDIV0
ERRORDIV0
ERRORDIV0
ERRORDIV0
ERRORDIV0
ERRORDIV0
ERRORDIV0
ERRORDIV0
ERRORDIV0
医用 イヨウ
ERRORDIV0
ERRORDIV0
ERRORDIV0
ERRORDIV0
ERRORDIV0
ERRORDIV0
ERRORDIV0
ERRORDIV0
ERRORDIV0
半導体 ハンドウタイ
ERRORDIV0
ERRORDIV0
ERRORDIV0
ERRORDIV0
ERRORDIV0
ERRORDIV0
ERRORDIV0
ERRORDIV0
ERRORDIV0
科学 カガク
ERRORDIV0
ERRORDIV0
ERRORDIV0
ERRORDIV0
ERRORDIV0
ERRORDIV0
ERRORDIV0
ERRORDIV0
ERRORDIV0
受注実績 ジュチュウ ジッセキ
2013
2014
1Q
2Q
3Q
4Q
1Q
2Q
3Q
4Q
自動車
128
125
103
166
環境
39
38
41
40
医用
67
64
60
71
半導体
46
51
69
88
科学
53
61
61
77
合計
334
341
337
444
受注残 ジュチュウ ザン
2013
2014
1Q
2Q
3Q
4Q
1Q
2Q
3Q
4Q
自動車
314
335
325
314
環境
33
39
45
38
医用
30
27
24
23
半導体
20
15
25
31
科学
55
67
76
76
合計
454
486
497
484
受注実績 ジュチュウ ジッセキ
2013
2014
1Q
2Q
3Q
4Q
1Q
2Q
3Q
4Q
自動車
128
125
103
166
EMS
93
91
78
110
MCT
32
30
24
48
HIT
4
4
2
9
受注残 ジュチュウ ザン
2013
2014
推移 スイイ
1Q
2Q
3Q
4Q
1Q
2Q
3Q
4Q
自動車
314
335
325
314
EMS
173
188
195
177
MCT
135
142
125
128
HIT
5
5
4
7
売上高 ウリアゲ ダカ
営業利益 エイギョウ リエキ
2014
2015 計画 ケイカク
2014
2015 計画 ケイカク
実績 ジッセキ
社内数値 シャナイ スウチ
発表案① ハッピョウ アン
発表案② ハッピョウ アン
MLMAP2015年数値 ネン スウチ
実績 ジッセキ
社内数値 シャナイ スウチ
発表案① ハッピョウ アン
発表案② ハッピョウ アン
MLMAP2015年数値 ネン スウチ
vs 2014
vs 2014
対外発表 タイガイ ハッピョウ
社内数値 シャナイ スウチ
vs 2014
vs 2014
対外発表 タイガイ ハッピョウ
社内数値 シャナイ スウチ
自動車 ジドウシャ
環境 カンキョウ
医用 イヨウ
半導体 ハンドウタイ
科学 カガク
合計 ゴウケイ
営業利益 エイギョウ リエキ
2014
2015 計画 ケイカク
実績 ジッセキ
社内数値 シャナイ スウチ
発表案① ハッピョウ アン
発表案② ハッピョウ アン
MLMAP2015年数値 ネン スウチ
vs 2014
vs 2014
対外発表 タイガイ ハッピョウ
社内数値 シャナイ スウチ
自動車 ジドウシャ
環境 カンキョウ
医用 イヨウ
半導体 ハンドウタイ
科学 カガク
合計 ゴウケイ
売上高 ウリアゲ ダカ
営業利益 エイギョウ リエキ
2014
2015
2014
2015
実績 ジッセキ
社内数値 シャナイ スウチ
発表案 ハッピョウ アン
vs2014
実績 ジッセキ
社内数値 シャナイ スウチ
発表案 ハッピョウ アン
vs2014
自動車 ジドウシャ
環境 カンキョウ
医用 イヨウ
半導体 ハンドウタイ
科学 カガク
合計 ゴウケイ
2014
2015年計画 ネン ケイカク
実績 ジッセキ
社内数値 シャナイ スウチ
開示案① カイジ アン ハツアン
開示案② カイジ アン ハツアン
MLMAP2015年数値 ネン スウチ
市場 シジョウ
vs 2014
vs 2014
対外発表 タイガイ ハッピョウ
社内数値 シャナイ スウチ
8社平均 シャ ヘイキン
売上高 ウリアゲ タカ
営業利益 エイギョウ リエキ
経常利益 ケイジョウ リエキ
当期純利益 トウキ ジュンリエキ
営業利益率 エイギョウ リエキ リツ
ドル
ユーロ
配当(円1株) ハイトウ エン カブ
2014
2015
MLMAP2015年数値 ネン スウチ
市場 シジョウ
実績 ジッセキ
社内数値 シャナイ スウチ
発表案 ハッピョウ アン
vs2014
対外発表 タイガイ ハッピョウ
社内数値 シャナイ スウチ
8社平均 シャ ヘイキン
売上高 ウリアゲ タカ
営業利益 エイギョウ リエキ
経常利益 ケイジョウ リエキ
当期純利益 トウキ ジュンリエキ
営業利益率 エイギョウ リエキ リツ
ドル
ユーロ
配当(円1株) ハイトウ エン カブ
売上高 ウリアゲ ダカ
営業利益 エイギョウ リエキ
2013年 ネン
2014年 ネン
2013年 ネン
2014年 ネン
実績 ジッセキ
開示116 カイジ
実績 ジッセキ
増減vsv2013 ゾウゲン
実績 ジッセキ
開示116 カイジ
実績 ジッセキ
増減vsv2013 ゾウゲン
自動車 ジドウシャ
環境 カンキョウ
医用 イヨウ
半導体 ハンドウタイ
科学 カガク
合計 ゴウケイ
2013年 ネン
2014年 ネン
増減比較 ゾウゲン ヒカク
市場 シジョウ
実績 ジッセキ
開示(116) カイジ
実績(監査前) ジッセキ カンサ マエ
vs 13年 ネン
vs 開示 カイジ
8社平均 シャ ヘイキン
売上高 ウリアゲ タカ
営業利益 エイギョウ リエキ
経常利益 ケイジョウ リエキ
当期純利益 トウキ ジュンリエキ
営業利益率 エイギョウ リエキ リツ
配当 ハイトウ
配当性向 ハイトウ セイコウ
為替レート(累計)
ドル
ユーロ
2015
2016
Variation
Cash flows from operating activities
14770
15871
1101
Cash flows from investing activities
-30642
-10427
20214
Cash flows from financing activities
12843
-451
-13294
Cash and cash equivalents at end of year
47859
51940
4081
Free cash flows
-15872
5443
21315
Changed points
Original
Shipment base
New
The date of delivery or installation based on contractual arrangements
Applied timing
January 2016
Reason for change
Triggered by the introduction of a new ERP implementation to harmonize with international accounting standards
copy 2017 HORIBA Ltd All rights reserved 31
Major policies
MLMAP2020 ldquoONE STEP AHEADrdquo
Applying HORIBA Technology in new business fields and new markets and becoming a true partner in analysis and measurement
Accelerating corporate growth by its Super Dream Team based on balanced management matrix organization and HORIBA Stained Glass Project
Improving capital efficiency to maximize corporate value
copy 2017 HORIBA Ltd All rights reserved 32
Actions for achieving MLMAP2020 targets
1 Re-organize the water measuring business to
accelerate growth
2 ldquoStained Glass Projectrdquo activities
3 Improvement in asset efficiency and maximizing
corporate value
Introduction of original KPIs to measure asset efficiency
Establishment of financial subsidiaries
copy 2017 HORIBA Ltd All rights reserved 33
Accelerate growth in water measuring business
40
60
100 115 120 132
200
2015 2016 2017 2020
Water
PampE Semi Scientific
(Billions of yen)
Integrate products and technology from all HORIBA affiliates and 3 segments(ScientificPampESemi) in all function including RampD production sales
Create the value only HORIBA can realize
Doubled sales in water measuring business 10bn yen 20bn yen
(Forecast)
Integrate water measuring resources to HORIBA Advanced Techno Ltd (Kyoto)
(Previous Accounting policy)
pH meter
Cover all water treatment processes Timely and precisely satisfy market demand Create water measurement network using IoT
(Plan)
Water quality analyzer
Chemical Concentration Monitor
PampE
Semi Sci
copy 2017 HORIBA Ltd All rights reserved 34
Water in nature (rivers lakes underground water)
Water-intake Discharge Recycling
Products
Semiconductor Petrochemical
Pharmaceutical Energy Medical
RampD Production Quality Regulations on discharged water
Industrial processes Sewage infrastructure
Water supply infrastructure
Industrial water
Industrial sewage
Water measuring and analysis business domain Water
Water measuringanalysis business domain Life Cycle of Water
Tap water
copy 2017 HORIBA Ltd All rights reserved 35
Water in nature (rivers lakes underground water)
Water-intake Discharge Recycling
Products
Semiconductor Petrochemical
Pharmaceutical Energy Medical
RampD Production Quality
Industrial processes Sewage infrastructure
Water supply infrastructure
Industrial water
Industrial sewage
Water measuring and analysis business domain Water
HORIBA Stained Glass Project Lunch gatherings of working mothers Seminars on how to balance long-term care and work Workshop to improve work productivity
Selected as one of New Diversity Management Selection 100 (by the Ministry of Economy Trade and Industry of Japan)
Reasons for the award Corporate motto ldquoJoy and Funrdquo and the Stained Glass Project
Mr Saito executive vice president and Ms Moriguchi leader of Stained Glass Project at the award-receiving ceremony
copy 2017 HORIBA Ltd All rights reserved 37
Decided to introduce a new KPI to measure asset efficiency Indicator composed of ldquoOperating profitrdquo and ldquoWACCrdquo Applying unit Business segments and Group companies Strengthen PDCA cycle Efficient use of business assets and increase profit
Plan to prepare a budget to this project in 2018
Founded financial subsidiaries in the US and the UK Improve capital efficiency through group financing Strengthen financial management function in each region
Enhance asset efficiency and maximize corporate value
Improve asset efficiency amp
Accelerate business growth
Investment
Business Growth
Cash Generation
copy 2017 HORIBA Ltd All rights reserved 38
Symbol of MLMAP2020
Step out of the existing business fields and pursue further expansion Take a new perspective and overcome technologicalmarketorganization barriers
Be flexible think outside the box and move up to the next stage
ONE STEP AHEAD - To create a next stage of HORIBA -
copy 2017 HORIBA Ltd All rights reserved 39
Contents
2016 Results
2017 Forecast
Business Segment Outline
Shareholder Return
MLMAP2020 [2016-2020] Progress Financial Data Corporate profile
PPampE Investment to MIRA(30BJYP) Depreciation Goodwill of MIRA(04BJYP) Biwako factory (07BJYP) RampD Increased in Automotive Test System Business
Good will of MIRA eg hellip Amortization included
2017 Topics
PPampE Investment to MIRA(30BJYP) Expansion of Aso Factory(27BJYP)
Depreciation Goodwill of MIRA(04BJYP) Increase in MIRA and Test center invested in 2016 RampD Increase in Auto and PampE Business
Capital Investment Depreciation RampD (Billions of yen)
全社実績
セグ実績
全社予算
全社予算2案
セグ予算
セグ予算2案
受注_残
半期予想
設備投資
HOR単体実績
HOR単体予算
HOR単体上期予算
copy 2017 HORIBA Ltd All rights reserved 45
241 Bond
redemption in 2020
Current ratio
280
2014 254 60
Short 66
Cash1
492
Bonds 150
Long 25
Cash1
478
Bonds 150
Long 22 Short 108
2013 269 60
447
Cash1
511
Bonds 150
Long 168
Short 128
2015 229 55
Borrowed from JBIC2
151bn yen (2015)
Capital ratio
467
2016 237 55
Cash1
519
Bonds 150
Long 192
Short 124
Cash Balance (Billions of yen)
(Consolidated basis each end of the year) Total Loan Balance
Conclusion of liquidation of receivable contract with 2 banks Recent issuer rating RampI [A-] (July 2016) JCR [A] (August 2016)
1 CashhellipCash and Cash Equivalents at End of Period 2 JBIC Japan Bank for International Cooperation
Graph1
Sheet1
Sheet1
現預金
短期
長期
社債
Sheet1 (2)
tajikaABX =gtHIL
tajikaSTEC=gtHOR
copy 2017 HORIBA Ltd All rights reserved 46
Contents
2016 Results
2017 Forecast
Business Segment Outline
Shareholder Return
MLMAP2020 [2016-2020]Progress Financial Data Corporate profile
copy 2017 HORIBA Ltd All rights reserved 47
Head office Kyoto Japan Founded 1945 Incorporated 1953 CEO Atsushi Horiba Fiscal year end December 31
Atsushi Horiba Chairman President amp CEO
- Corporate motto -
To have interest and pride in our work to enjoy our lives
Corporate Profile
copy 2017 HORIBA Ltd All rights reserved 48
Medical In-Vitro Diagnostic (IVD) Systems Integration of HORIBA ABXrsquos Technology amp Marketing Know-How
Automotive Test Systems Emission Measurement Systems (EMS) Mechatronics Devices (MCT) Driving Control Systems (ITS) Engineering Consultancy amp Testing (ECT)
Business Segments
Process amp Environmental Environmental Systems Environmental Radiation Monitor Environmental Regulation amp Process Business
Semiconductor Mass Flow Controller In-situ Analysis Synergy among HORIBA HQ HORIBA STEC and HORIBA Jobin Yvonrsquos Technologies
Scientific Synergy of HORIBA and HORIBA Jobin Yvonrsquos Technologies Raman Grating and Fluorescence
copy 2017 HORIBA Ltd All rights reserved 49
Sales 1700 Billions of Yen
Business Composition of Sales
Automotive Test Systems
Process amp Environmental
Medical
Semiconductor
Scientific
Automotive 622 (36)
Scientific 257 (15)
Semiconductor 388 (23)
Medical 265 (16)
PampE 167 (10)
Well Balanced Business Operation -Five Business Segments-
(Billions of Yen)
copy 2017 HORIBA Ltd All rights reserved 50
Market Shares
Market shares quoted are estimates by HORIBA
80 20 100
35
Emission Measurement Systems
57 30
Stack Gas Analyzers Automatic Blood Cell Counter plus CRP
Mass Flow Controllers Raman Spectrophotometers Gratings
Global Domestic
copy 2017 HORIBA Ltd All rights reserved 51
EU Japan
Asia Americas
33
26 18
23
Geographic Composition of Sales(2016)
HORIBA Worldwide
Sales of FY2016 1700 BJPY
The Number of Group Companies by region (As of December 31 2016)
America 9 Europe 23 Asia 17 (4 in Japan including HORIBA Ltd) Total 49
copy 2017 HORIBA Ltd All rights reserved 52
Japan 38
Other Asia 15
France 13
Germany 8
Other Europe 2 USA
10
Other Americas 3
7149
従業員数 2015年12月31日現在
2442
946
3761
UK 11
Employees by Region
Total Number of Employees (As of December 31 2016)
Total Asia 53
Total Europe 34
Total Americas 13
copy 2017 HORIBA Ltd All rights reserved 53 copy 2017 HORIBA Ltd All rights reserved 53
copy 2017 HORIBA Ltd All rights reserved 54
Danke
Grazie
Σας ευχαριστούμε
감사합니다
Obrigado
谢谢
ขอบคณครบ
ありがとうございました
धनयवाद
நனற
Cảm ơn
Dziękuję
Tack ska ni ha
Thank you
Merci
Gracias
Большое спасибо
スライド番号 1
Contents
Contents
スライド番号 4
Summary of 2016 Results
2016 full year results
2016 Results by Segment
Contents
2017 Market outlook
Exchange rate forecast for 2017
Forecast for 2017
Forecast for 2017 by segment
Contents
スライド番号 14
2016 Results and 2017 Forecast
Strategy for improving profitability
Regulatory trend in EMS (Emission Measurement System) and Operations in an emerging Market
ECT (HORIBA MIRA) Business
2016 Results and 2017 Forecast
Analysis technology for the environment
2016 Results and 2017 Forecast
Growth with New Brand and Service
2016 Results and 2017 Forecast
スライド番号 24
2016 Results and 2017 Forecast
Exploit new markets using HORIBA technology
Contents
Shareholder Return
Contents
スライド番号 30
スライド番号 31
スライド番号 32
Accelerate growth in water measuring business
Water measuring and analysisbusiness domain
Water measuring and analysisbusiness domain
Selected as one of New Diversity Management Selection 100 (by the Ministry of Economy Trade and Industry of Japan)
Enhance asset efficiency and maximize corporate value
Symbol of MLMAP2020
Contents
Trend of Market capitalization
Changed the accounting policy for revenue recognition
スライド番号 42
スライド番号 43
スライド番号 44
スライド番号 45
Contents
スライド番号 47
Business Segments
スライド番号 49
Market Shares
スライド番号 51
スライド番号 52
スライド番号 53
スライド番号 54
勘定科目
BS_CL12010
BS_CL12020
BS_CL12030
BS_FL21000
BS_FL23000
勘定科目名称
当座借越
短期借入金
1年内返済長期借入金
社債
長期借入金
HOR
0
(2000000000)
0
(10000000000)
0
日本 ニホン
ABX
(827350776)
(4016672108)
(534035942)
0
(1343663409)
欧州 オウシュウ
ASEC
0
(352000000)
0
0
(180000000)
日本 ニホン
HE
0
(1855530779)
0
0
0
欧州 オウシュウ
HIC
0
(1156081000)
(109236000)
0
(682725000)
米州 ベイシュウ
HIT
(99662290)
0
(200000000)
0
(300000000)
日本 ニホン
HSC
0
(20019305)
0
0
0
アジア
HST
0
(166375000)
0
0
0
アジア
JY
0
0
(9753688)
0
(105723687)
欧州 オウシュウ
会社間照合
0
(5047)
欧州 オウシュウ
会社間照合
200000000
日本 ニホン
会社間照合
480000000
日本 ニホン
会社間照合
2000000000
日本 ニホン
会社間照合
118647000
欧州 オウシュウ
会社間照合
175953553
欧州 オウシュウ
連結合計
(927013066)
(7272082686)
(653025630)
(10000000000)
(2132112096)
(99662290)
(352000000)
0
(10000000000)
0
日本 ニホン
(827350776)
(5577607381)
(543789630)
0
(1449387096)
欧州 オウシュウ
0
(1156081000)
(109236000)
0
(682725000)
米州 ベイシュウ
0
(186394305)
0
0
0
アジア
(927013066)
(7272082686)
(653025630)
(10000000000)
(2132112096)
2008
2009
2010
2011
2012
2013
2008
2008
2009
2009
2013
2013
2014
2014
2015
2015
2016
2016
短期借入金 タンキカリイレキン
8852
6618
5575
6684
5523
6606
現預金 ゲンヨキン
18267
21520
49246
51109
47859
51900
長期借入金 チョウキカリイレキン
2132
1730
1195
1291
2113
2576
短期 タンキ
8852
6618
6606
10832
12800
12400
社債 シャサイ
10000
10000
10000
10000
10000
15000
長期 チョウキ
2132
1730
2576
2209
16800
19200
現預金 ゲンヨキン
18267
21520
26958
28893
34685
42228
社債 シャサイ
10000
10000
15000
15000
15000
15000
流動比率 リュウドウヒリツ
2296
2524
2653
2806
2970
2690
自己資本比率 ジコシホンヒリツ
576
609
612
624
650
600
49246
6606
2576
15000
51109
10832
2209
15000
47859
12800
16800
15000
51900
12400
19200
15000
2013年実績 ネン ジッセキ
2014年実績 ネン ジッセキ
2015年計画 ネン ケイカク
増減
計画(GBM) ケイカク
発表案 ハッピョウ アン
vs 2014
売上高 ウリアゲ タカ
営業利益 エイギョウ リエキ
経常利益 ケイジョウ リエキ
当期純利益 トウキ ジュンリエキ
2013年 ネン
2014年 ネン
2015年 ネン
増減
実績
実績
計画(GBM) ケイカク
決定 ケッテイ
vs 2014
売上高 ウリアゲ タカ
営業利益 エイギョウ リエキ
経常利益 ケイジョウ リエキ
当期純利益 トウキ ジュンリエキ
営業利益率 エイギョウ リエキ リツ
2013実績 ジッセキ
2014年 ネン
増減
開示116 カイジ
実績 ジッセキ
vs 2013
売上高 ウリアゲ タカ
営業利益 エイギョウ リエキ
経常利益 ケイジョウ リエキ
当期純利益 トウキ ジュンリエキ
2015
2016
2017
Results
Forecast117
Results
vs 2015
vs Forecast117
Forecast
vs 2016
PPampE
148
153
134
-10
-12
146
+9
Intangibles
14
07
03
-75
-49
04
+11
Capital Investment
163
160
137
-15
-14
150
+9
Depreciation
61
65
68
+12
+5
72
+6
RampD
123
130
129
+5
-1
140
+8
(To net sales)
(7)
(8)
(8)
(8)
2014年 ネン
2015年 ネン
実績 ジッセキ
社内数値 シャナイ スウチ
発表案 ハッピョウ アン
上期 カミ キ
下期 シモキ
通期 ツウキ
上期 カミキ
下期 シモキ
通期 ツウキ
上期 カミ キ
下期 シモキ
通期 ツウキ
売上高 ウリアゲ ダカ
0
0
0
0
0
自動車 ジドウシャ
0
0
0
環境 カンキョウ
0
0
0
医用 イヨウ
0
0
0
半導体 ハンドウタイ
0
0
0
科学 カガク
0
0
0
営業利益 エイギョウ リエキ
0
0
0
0
0
自動車 ジドウシャ
0
0
0
環境 カンキョウ
0
0
0
医用 イヨウ
0
0
0
半導体 ハンドウタイ
0
0
0
科学 カガク
0
0
0
経常利益 ケイジョウ リエキ
0
0
当期純利益 トウキ ジュンリエキ
0
0
営業利益率 エイギョウ リエキ リツ
ERRORDIV0
ERRORDIV0
ERRORDIV0
ERRORDIV0
ERRORDIV0
ERRORDIV0
ERRORDIV0
ERRORDIV0
ERRORDIV0
自動車 ジドウシャ
ERRORDIV0
ERRORDIV0
ERRORDIV0
ERRORDIV0
ERRORDIV0
ERRORDIV0
ERRORDIV0
ERRORDIV0
ERRORDIV0
環境 カンキョウ
ERRORDIV0
ERRORDIV0
ERRORDIV0
ERRORDIV0
ERRORDIV0
ERRORDIV0
ERRORDIV0
ERRORDIV0
ERRORDIV0
医用 イヨウ
ERRORDIV0
ERRORDIV0
ERRORDIV0
ERRORDIV0
ERRORDIV0
ERRORDIV0
ERRORDIV0
ERRORDIV0
ERRORDIV0
半導体 ハンドウタイ
ERRORDIV0
ERRORDIV0
ERRORDIV0
ERRORDIV0
ERRORDIV0
ERRORDIV0
ERRORDIV0
ERRORDIV0
ERRORDIV0
科学 カガク
ERRORDIV0
ERRORDIV0
ERRORDIV0
ERRORDIV0
ERRORDIV0
ERRORDIV0
ERRORDIV0
ERRORDIV0
ERRORDIV0
受注実績 ジュチュウ ジッセキ
2013
2014
1Q
2Q
3Q
4Q
1Q
2Q
3Q
4Q
自動車
128
125
103
166
環境
39
38
41
40
医用
67
64
60
71
半導体
46
51
69
88
科学
53
61
61
77
合計
334
341
337
444
受注残 ジュチュウ ザン
2013
2014
1Q
2Q
3Q
4Q
1Q
2Q
3Q
4Q
自動車
314
335
325
314
環境
33
39
45
38
医用
30
27
24
23
半導体
20
15
25
31
科学
55
67
76
76
合計
454
486
497
484
受注実績 ジュチュウ ジッセキ
2013
2014
1Q
2Q
3Q
4Q
1Q
2Q
3Q
4Q
自動車
128
125
103
166
EMS
93
91
78
110
MCT
32
30
24
48
HIT
4
4
2
9
受注残 ジュチュウ ザン
2013
2014
推移 スイイ
1Q
2Q
3Q
4Q
1Q
2Q
3Q
4Q
自動車
314
335
325
314
EMS
173
188
195
177
MCT
135
142
125
128
HIT
5
5
4
7
売上高 ウリアゲ ダカ
営業利益 エイギョウ リエキ
2014
2015 計画 ケイカク
2014
2015 計画 ケイカク
実績 ジッセキ
社内数値 シャナイ スウチ
発表案① ハッピョウ アン
発表案② ハッピョウ アン
MLMAP2015年数値 ネン スウチ
実績 ジッセキ
社内数値 シャナイ スウチ
発表案① ハッピョウ アン
発表案② ハッピョウ アン
MLMAP2015年数値 ネン スウチ
vs 2014
vs 2014
対外発表 タイガイ ハッピョウ
社内数値 シャナイ スウチ
vs 2014
vs 2014
対外発表 タイガイ ハッピョウ
社内数値 シャナイ スウチ
自動車 ジドウシャ
環境 カンキョウ
医用 イヨウ
半導体 ハンドウタイ
科学 カガク
合計 ゴウケイ
営業利益 エイギョウ リエキ
2014
2015 計画 ケイカク
実績 ジッセキ
社内数値 シャナイ スウチ
発表案① ハッピョウ アン
発表案② ハッピョウ アン
MLMAP2015年数値 ネン スウチ
vs 2014
vs 2014
対外発表 タイガイ ハッピョウ
社内数値 シャナイ スウチ
自動車 ジドウシャ
環境 カンキョウ
医用 イヨウ
半導体 ハンドウタイ
科学 カガク
合計 ゴウケイ
売上高 ウリアゲ ダカ
営業利益 エイギョウ リエキ
2014
2015
2014
2015
実績 ジッセキ
社内数値 シャナイ スウチ
発表案 ハッピョウ アン
vs2014
実績 ジッセキ
社内数値 シャナイ スウチ
発表案 ハッピョウ アン
vs2014
自動車 ジドウシャ
環境 カンキョウ
医用 イヨウ
半導体 ハンドウタイ
科学 カガク
合計 ゴウケイ
2014
2015年計画 ネン ケイカク
実績 ジッセキ
社内数値 シャナイ スウチ
開示案① カイジ アン ハツアン
開示案② カイジ アン ハツアン
MLMAP2015年数値 ネン スウチ
市場 シジョウ
vs 2014
vs 2014
対外発表 タイガイ ハッピョウ
社内数値 シャナイ スウチ
8社平均 シャ ヘイキン
売上高 ウリアゲ タカ
営業利益 エイギョウ リエキ
経常利益 ケイジョウ リエキ
当期純利益 トウキ ジュンリエキ
営業利益率 エイギョウ リエキ リツ
ドル
ユーロ
配当(円1株) ハイトウ エン カブ
2014
2015
MLMAP2015年数値 ネン スウチ
市場 シジョウ
実績 ジッセキ
社内数値 シャナイ スウチ
発表案 ハッピョウ アン
vs2014
対外発表 タイガイ ハッピョウ
社内数値 シャナイ スウチ
8社平均 シャ ヘイキン
売上高 ウリアゲ タカ
営業利益 エイギョウ リエキ
経常利益 ケイジョウ リエキ
当期純利益 トウキ ジュンリエキ
営業利益率 エイギョウ リエキ リツ
ドル
ユーロ
配当(円1株) ハイトウ エン カブ
売上高 ウリアゲ ダカ
営業利益 エイギョウ リエキ
2013年 ネン
2014年 ネン
2013年 ネン
2014年 ネン
実績 ジッセキ
開示116 カイジ
実績 ジッセキ
増減vsv2013 ゾウゲン
実績 ジッセキ
開示116 カイジ
実績 ジッセキ
増減vsv2013 ゾウゲン
自動車 ジドウシャ
環境 カンキョウ
医用 イヨウ
半導体 ハンドウタイ
科学 カガク
合計 ゴウケイ
2013年 ネン
2014年 ネン
増減比較 ゾウゲン ヒカク
市場 シジョウ
実績 ジッセキ
開示(116) カイジ
実績(監査前) ジッセキ カンサ マエ
vs 13年 ネン
vs 開示 カイジ
8社平均 シャ ヘイキン
売上高 ウリアゲ タカ
営業利益 エイギョウ リエキ
経常利益 ケイジョウ リエキ
当期純利益 トウキ ジュンリエキ
営業利益率 エイギョウ リエキ リツ
配当 ハイトウ
配当性向 ハイトウ セイコウ
為替レート(累計)
ドル
ユーロ
2015
2016
Variation
Cash flows from operating activities
14770
15871
1101
Cash flows from investing activities
-30642
-10427
20214
Cash flows from financing activities
12843
-451
-13294
Cash and cash equivalents at end of year
47859
51940
4081
Free cash flows
-15872
5443
21315
Changed points
Original
Shipment base
New
The date of delivery or installation based on contractual arrangements
Applied timing
January 2016
Reason for change
Triggered by the introduction of a new ERP implementation to harmonize with international accounting standards
copy 2017 HORIBA Ltd All rights reserved 36
HORIBA Stained Glass Project Lunch gatherings of working mothers Seminars on how to balance long-term care and work Workshop to improve work productivity
Selected as one of New Diversity Management Selection 100 (by the Ministry of Economy Trade and Industry of Japan)
Reasons for the award Corporate motto ldquoJoy and Funrdquo and the Stained Glass Project
Mr Saito executive vice president and Ms Moriguchi leader of Stained Glass Project at the award-receiving ceremony
copy 2017 HORIBA Ltd All rights reserved 37
Decided to introduce a new KPI to measure asset efficiency Indicator composed of ldquoOperating profitrdquo and ldquoWACCrdquo Applying unit Business segments and Group companies Strengthen PDCA cycle Efficient use of business assets and increase profit
Plan to prepare a budget to this project in 2018
Founded financial subsidiaries in the US and the UK Improve capital efficiency through group financing Strengthen financial management function in each region
Enhance asset efficiency and maximize corporate value
Improve asset efficiency amp
Accelerate business growth
Investment
Business Growth
Cash Generation
copy 2017 HORIBA Ltd All rights reserved 38
Symbol of MLMAP2020
Step out of the existing business fields and pursue further expansion Take a new perspective and overcome technologicalmarketorganization barriers
Be flexible think outside the box and move up to the next stage
ONE STEP AHEAD - To create a next stage of HORIBA -
copy 2017 HORIBA Ltd All rights reserved 39
Contents
2016 Results
2017 Forecast
Business Segment Outline
Shareholder Return
MLMAP2020 [2016-2020] Progress Financial Data Corporate profile
PPampE Investment to MIRA(30BJYP) Depreciation Goodwill of MIRA(04BJYP) Biwako factory (07BJYP) RampD Increased in Automotive Test System Business
Good will of MIRA eg hellip Amortization included
2017 Topics
PPampE Investment to MIRA(30BJYP) Expansion of Aso Factory(27BJYP)
Depreciation Goodwill of MIRA(04BJYP) Increase in MIRA and Test center invested in 2016 RampD Increase in Auto and PampE Business
Capital Investment Depreciation RampD (Billions of yen)
全社実績
セグ実績
全社予算
全社予算2案
セグ予算
セグ予算2案
受注_残
半期予想
設備投資
HOR単体実績
HOR単体予算
HOR単体上期予算
copy 2017 HORIBA Ltd All rights reserved 45
241 Bond
redemption in 2020
Current ratio
280
2014 254 60
Short 66
Cash1
492
Bonds 150
Long 25
Cash1
478
Bonds 150
Long 22 Short 108
2013 269 60
447
Cash1
511
Bonds 150
Long 168
Short 128
2015 229 55
Borrowed from JBIC2
151bn yen (2015)
Capital ratio
467
2016 237 55
Cash1
519
Bonds 150
Long 192
Short 124
Cash Balance (Billions of yen)
(Consolidated basis each end of the year) Total Loan Balance
Conclusion of liquidation of receivable contract with 2 banks Recent issuer rating RampI [A-] (July 2016) JCR [A] (August 2016)
1 CashhellipCash and Cash Equivalents at End of Period 2 JBIC Japan Bank for International Cooperation
Graph1
Sheet1
Sheet1
現預金
短期
長期
社債
Sheet1 (2)
tajikaABX =gtHIL
tajikaSTEC=gtHOR
copy 2017 HORIBA Ltd All rights reserved 46
Contents
2016 Results
2017 Forecast
Business Segment Outline
Shareholder Return
MLMAP2020 [2016-2020]Progress Financial Data Corporate profile
copy 2017 HORIBA Ltd All rights reserved 47
Head office Kyoto Japan Founded 1945 Incorporated 1953 CEO Atsushi Horiba Fiscal year end December 31
Atsushi Horiba Chairman President amp CEO
- Corporate motto -
To have interest and pride in our work to enjoy our lives
Corporate Profile
copy 2017 HORIBA Ltd All rights reserved 48
Medical In-Vitro Diagnostic (IVD) Systems Integration of HORIBA ABXrsquos Technology amp Marketing Know-How
Automotive Test Systems Emission Measurement Systems (EMS) Mechatronics Devices (MCT) Driving Control Systems (ITS) Engineering Consultancy amp Testing (ECT)
Business Segments
Process amp Environmental Environmental Systems Environmental Radiation Monitor Environmental Regulation amp Process Business
Semiconductor Mass Flow Controller In-situ Analysis Synergy among HORIBA HQ HORIBA STEC and HORIBA Jobin Yvonrsquos Technologies
Scientific Synergy of HORIBA and HORIBA Jobin Yvonrsquos Technologies Raman Grating and Fluorescence
copy 2017 HORIBA Ltd All rights reserved 49
Sales 1700 Billions of Yen
Business Composition of Sales
Automotive Test Systems
Process amp Environmental
Medical
Semiconductor
Scientific
Automotive 622 (36)
Scientific 257 (15)
Semiconductor 388 (23)
Medical 265 (16)
PampE 167 (10)
Well Balanced Business Operation -Five Business Segments-
(Billions of Yen)
copy 2017 HORIBA Ltd All rights reserved 50
Market Shares
Market shares quoted are estimates by HORIBA
80 20 100
35
Emission Measurement Systems
57 30
Stack Gas Analyzers Automatic Blood Cell Counter plus CRP
Mass Flow Controllers Raman Spectrophotometers Gratings
Global Domestic
copy 2017 HORIBA Ltd All rights reserved 51
EU Japan
Asia Americas
33
26 18
23
Geographic Composition of Sales(2016)
HORIBA Worldwide
Sales of FY2016 1700 BJPY
The Number of Group Companies by region (As of December 31 2016)
America 9 Europe 23 Asia 17 (4 in Japan including HORIBA Ltd) Total 49
copy 2017 HORIBA Ltd All rights reserved 52
Japan 38
Other Asia 15
France 13
Germany 8
Other Europe 2 USA
10
Other Americas 3
7149
従業員数 2015年12月31日現在
2442
946
3761
UK 11
Employees by Region
Total Number of Employees (As of December 31 2016)
Total Asia 53
Total Europe 34
Total Americas 13
copy 2017 HORIBA Ltd All rights reserved 53 copy 2017 HORIBA Ltd All rights reserved 53
copy 2017 HORIBA Ltd All rights reserved 54
Danke
Grazie
Σας ευχαριστούμε
감사합니다
Obrigado
谢谢
ขอบคณครบ
ありがとうございました
धनयवाद
நனற
Cảm ơn
Dziękuję
Tack ska ni ha
Thank you
Merci
Gracias
Большое спасибо
スライド番号 1
Contents
Contents
スライド番号 4
Summary of 2016 Results
2016 full year results
2016 Results by Segment
Contents
2017 Market outlook
Exchange rate forecast for 2017
Forecast for 2017
Forecast for 2017 by segment
Contents
スライド番号 14
2016 Results and 2017 Forecast
Strategy for improving profitability
Regulatory trend in EMS (Emission Measurement System) and Operations in an emerging Market
ECT (HORIBA MIRA) Business
2016 Results and 2017 Forecast
Analysis technology for the environment
2016 Results and 2017 Forecast
Growth with New Brand and Service
2016 Results and 2017 Forecast
スライド番号 24
2016 Results and 2017 Forecast
Exploit new markets using HORIBA technology
Contents
Shareholder Return
Contents
スライド番号 30
スライド番号 31
スライド番号 32
Accelerate growth in water measuring business
Water measuring and analysisbusiness domain
Water measuring and analysisbusiness domain
Selected as one of New Diversity Management Selection 100 (by the Ministry of Economy Trade and Industry of Japan)
Enhance asset efficiency and maximize corporate value
Symbol of MLMAP2020
Contents
Trend of Market capitalization
Changed the accounting policy for revenue recognition
スライド番号 42
スライド番号 43
スライド番号 44
スライド番号 45
Contents
スライド番号 47
Business Segments
スライド番号 49
Market Shares
スライド番号 51
スライド番号 52
スライド番号 53
スライド番号 54
勘定科目
BS_CL12010
BS_CL12020
BS_CL12030
BS_FL21000
BS_FL23000
勘定科目名称
当座借越
短期借入金
1年内返済長期借入金
社債
長期借入金
HOR
0
(2000000000)
0
(10000000000)
0
日本 ニホン
ABX
(827350776)
(4016672108)
(534035942)
0
(1343663409)
欧州 オウシュウ
ASEC
0
(352000000)
0
0
(180000000)
日本 ニホン
HE
0
(1855530779)
0
0
0
欧州 オウシュウ
HIC
0
(1156081000)
(109236000)
0
(682725000)
米州 ベイシュウ
HIT
(99662290)
0
(200000000)
0
(300000000)
日本 ニホン
HSC
0
(20019305)
0
0
0
アジア
HST
0
(166375000)
0
0
0
アジア
JY
0
0
(9753688)
0
(105723687)
欧州 オウシュウ
会社間照合
0
(5047)
欧州 オウシュウ
会社間照合
200000000
日本 ニホン
会社間照合
480000000
日本 ニホン
会社間照合
2000000000
日本 ニホン
会社間照合
118647000
欧州 オウシュウ
会社間照合
175953553
欧州 オウシュウ
連結合計
(927013066)
(7272082686)
(653025630)
(10000000000)
(2132112096)
(99662290)
(352000000)
0
(10000000000)
0
日本 ニホン
(827350776)
(5577607381)
(543789630)
0
(1449387096)
欧州 オウシュウ
0
(1156081000)
(109236000)
0
(682725000)
米州 ベイシュウ
0
(186394305)
0
0
0
アジア
(927013066)
(7272082686)
(653025630)
(10000000000)
(2132112096)
2008
2009
2010
2011
2012
2013
2008
2008
2009
2009
2013
2013
2014
2014
2015
2015
2016
2016
短期借入金 タンキカリイレキン
8852
6618
5575
6684
5523
6606
現預金 ゲンヨキン
18267
21520
49246
51109
47859
51900
長期借入金 チョウキカリイレキン
2132
1730
1195
1291
2113
2576
短期 タンキ
8852
6618
6606
10832
12800
12400
社債 シャサイ
10000
10000
10000
10000
10000
15000
長期 チョウキ
2132
1730
2576
2209
16800
19200
現預金 ゲンヨキン
18267
21520
26958
28893
34685
42228
社債 シャサイ
10000
10000
15000
15000
15000
15000
流動比率 リュウドウヒリツ
2296
2524
2653
2806
2970
2690
自己資本比率 ジコシホンヒリツ
576
609
612
624
650
600
49246
6606
2576
15000
51109
10832
2209
15000
47859
12800
16800
15000
51900
12400
19200
15000
2013年実績 ネン ジッセキ
2014年実績 ネン ジッセキ
2015年計画 ネン ケイカク
増減
計画(GBM) ケイカク
発表案 ハッピョウ アン
vs 2014
売上高 ウリアゲ タカ
営業利益 エイギョウ リエキ
経常利益 ケイジョウ リエキ
当期純利益 トウキ ジュンリエキ
2013年 ネン
2014年 ネン
2015年 ネン
増減
実績
実績
計画(GBM) ケイカク
決定 ケッテイ
vs 2014
売上高 ウリアゲ タカ
営業利益 エイギョウ リエキ
経常利益 ケイジョウ リエキ
当期純利益 トウキ ジュンリエキ
営業利益率 エイギョウ リエキ リツ
2013実績 ジッセキ
2014年 ネン
増減
開示116 カイジ
実績 ジッセキ
vs 2013
売上高 ウリアゲ タカ
営業利益 エイギョウ リエキ
経常利益 ケイジョウ リエキ
当期純利益 トウキ ジュンリエキ
2015
2016
2017
Results
Forecast117
Results
vs 2015
vs Forecast117
Forecast
vs 2016
PPampE
148
153
134
-10
-12
146
+9
Intangibles
14
07
03
-75
-49
04
+11
Capital Investment
163
160
137
-15
-14
150
+9
Depreciation
61
65
68
+12
+5
72
+6
RampD
123
130
129
+5
-1
140
+8
(To net sales)
(7)
(8)
(8)
(8)
2014年 ネン
2015年 ネン
実績 ジッセキ
社内数値 シャナイ スウチ
発表案 ハッピョウ アン
上期 カミ キ
下期 シモキ
通期 ツウキ
上期 カミキ
下期 シモキ
通期 ツウキ
上期 カミ キ
下期 シモキ
通期 ツウキ
売上高 ウリアゲ ダカ
0
0
0
0
0
自動車 ジドウシャ
0
0
0
環境 カンキョウ
0
0
0
医用 イヨウ
0
0
0
半導体 ハンドウタイ
0
0
0
科学 カガク
0
0
0
営業利益 エイギョウ リエキ
0
0
0
0
0
自動車 ジドウシャ
0
0
0
環境 カンキョウ
0
0
0
医用 イヨウ
0
0
0
半導体 ハンドウタイ
0
0
0
科学 カガク
0
0
0
経常利益 ケイジョウ リエキ
0
0
当期純利益 トウキ ジュンリエキ
0
0
営業利益率 エイギョウ リエキ リツ
ERRORDIV0
ERRORDIV0
ERRORDIV0
ERRORDIV0
ERRORDIV0
ERRORDIV0
ERRORDIV0
ERRORDIV0
ERRORDIV0
自動車 ジドウシャ
ERRORDIV0
ERRORDIV0
ERRORDIV0
ERRORDIV0
ERRORDIV0
ERRORDIV0
ERRORDIV0
ERRORDIV0
ERRORDIV0
環境 カンキョウ
ERRORDIV0
ERRORDIV0
ERRORDIV0
ERRORDIV0
ERRORDIV0
ERRORDIV0
ERRORDIV0
ERRORDIV0
ERRORDIV0
医用 イヨウ
ERRORDIV0
ERRORDIV0
ERRORDIV0
ERRORDIV0
ERRORDIV0
ERRORDIV0
ERRORDIV0
ERRORDIV0
ERRORDIV0
半導体 ハンドウタイ
ERRORDIV0
ERRORDIV0
ERRORDIV0
ERRORDIV0
ERRORDIV0
ERRORDIV0
ERRORDIV0
ERRORDIV0
ERRORDIV0
科学 カガク
ERRORDIV0
ERRORDIV0
ERRORDIV0
ERRORDIV0
ERRORDIV0
ERRORDIV0
ERRORDIV0
ERRORDIV0
ERRORDIV0
受注実績 ジュチュウ ジッセキ
2013
2014
1Q
2Q
3Q
4Q
1Q
2Q
3Q
4Q
自動車
128
125
103
166
環境
39
38
41
40
医用
67
64
60
71
半導体
46
51
69
88
科学
53
61
61
77
合計
334
341
337
444
受注残 ジュチュウ ザン
2013
2014
1Q
2Q
3Q
4Q
1Q
2Q
3Q
4Q
自動車
314
335
325
314
環境
33
39
45
38
医用
30
27
24
23
半導体
20
15
25
31
科学
55
67
76
76
合計
454
486
497
484
受注実績 ジュチュウ ジッセキ
2013
2014
1Q
2Q
3Q
4Q
1Q
2Q
3Q
4Q
自動車
128
125
103
166
EMS
93
91
78
110
MCT
32
30
24
48
HIT
4
4
2
9
受注残 ジュチュウ ザン
2013
2014
推移 スイイ
1Q
2Q
3Q
4Q
1Q
2Q
3Q
4Q
自動車
314
335
325
314
EMS
173
188
195
177
MCT
135
142
125
128
HIT
5
5
4
7
売上高 ウリアゲ ダカ
営業利益 エイギョウ リエキ
2014
2015 計画 ケイカク
2014
2015 計画 ケイカク
実績 ジッセキ
社内数値 シャナイ スウチ
発表案① ハッピョウ アン
発表案② ハッピョウ アン
MLMAP2015年数値 ネン スウチ
実績 ジッセキ
社内数値 シャナイ スウチ
発表案① ハッピョウ アン
発表案② ハッピョウ アン
MLMAP2015年数値 ネン スウチ
vs 2014
vs 2014
対外発表 タイガイ ハッピョウ
社内数値 シャナイ スウチ
vs 2014
vs 2014
対外発表 タイガイ ハッピョウ
社内数値 シャナイ スウチ
自動車 ジドウシャ
環境 カンキョウ
医用 イヨウ
半導体 ハンドウタイ
科学 カガク
合計 ゴウケイ
営業利益 エイギョウ リエキ
2014
2015 計画 ケイカク
実績 ジッセキ
社内数値 シャナイ スウチ
発表案① ハッピョウ アン
発表案② ハッピョウ アン
MLMAP2015年数値 ネン スウチ
vs 2014
vs 2014
対外発表 タイガイ ハッピョウ
社内数値 シャナイ スウチ
自動車 ジドウシャ
環境 カンキョウ
医用 イヨウ
半導体 ハンドウタイ
科学 カガク
合計 ゴウケイ
売上高 ウリアゲ ダカ
営業利益 エイギョウ リエキ
2014
2015
2014
2015
実績 ジッセキ
社内数値 シャナイ スウチ
発表案 ハッピョウ アン
vs2014
実績 ジッセキ
社内数値 シャナイ スウチ
発表案 ハッピョウ アン
vs2014
自動車 ジドウシャ
環境 カンキョウ
医用 イヨウ
半導体 ハンドウタイ
科学 カガク
合計 ゴウケイ
2014
2015年計画 ネン ケイカク
実績 ジッセキ
社内数値 シャナイ スウチ
開示案① カイジ アン ハツアン
開示案② カイジ アン ハツアン
MLMAP2015年数値 ネン スウチ
市場 シジョウ
vs 2014
vs 2014
対外発表 タイガイ ハッピョウ
社内数値 シャナイ スウチ
8社平均 シャ ヘイキン
売上高 ウリアゲ タカ
営業利益 エイギョウ リエキ
経常利益 ケイジョウ リエキ
当期純利益 トウキ ジュンリエキ
営業利益率 エイギョウ リエキ リツ
ドル
ユーロ
配当(円1株) ハイトウ エン カブ
2014
2015
MLMAP2015年数値 ネン スウチ
市場 シジョウ
実績 ジッセキ
社内数値 シャナイ スウチ
発表案 ハッピョウ アン
vs2014
対外発表 タイガイ ハッピョウ
社内数値 シャナイ スウチ
8社平均 シャ ヘイキン
売上高 ウリアゲ タカ
営業利益 エイギョウ リエキ
経常利益 ケイジョウ リエキ
当期純利益 トウキ ジュンリエキ
営業利益率 エイギョウ リエキ リツ
ドル
ユーロ
配当(円1株) ハイトウ エン カブ
売上高 ウリアゲ ダカ
営業利益 エイギョウ リエキ
2013年 ネン
2014年 ネン
2013年 ネン
2014年 ネン
実績 ジッセキ
開示116 カイジ
実績 ジッセキ
増減vsv2013 ゾウゲン
実績 ジッセキ
開示116 カイジ
実績 ジッセキ
増減vsv2013 ゾウゲン
自動車 ジドウシャ
環境 カンキョウ
医用 イヨウ
半導体 ハンドウタイ
科学 カガク
合計 ゴウケイ
2013年 ネン
2014年 ネン
増減比較 ゾウゲン ヒカク
市場 シジョウ
実績 ジッセキ
開示(116) カイジ
実績(監査前) ジッセキ カンサ マエ
vs 13年 ネン
vs 開示 カイジ
8社平均 シャ ヘイキン
売上高 ウリアゲ タカ
営業利益 エイギョウ リエキ
経常利益 ケイジョウ リエキ
当期純利益 トウキ ジュンリエキ
営業利益率 エイギョウ リエキ リツ
配当 ハイトウ
配当性向 ハイトウ セイコウ
為替レート(累計)
ドル
ユーロ
2015
2016
Variation
Cash flows from operating activities
14770
15871
1101
Cash flows from investing activities
-30642
-10427
20214
Cash flows from financing activities
12843
-451
-13294
Cash and cash equivalents at end of year
47859
51940
4081
Free cash flows
-15872
5443
21315
Changed points
Original
Shipment base
New
The date of delivery or installation based on contractual arrangements
Applied timing
January 2016
Reason for change
Triggered by the introduction of a new ERP implementation to harmonize with international accounting standards
copy 2017 HORIBA Ltd All rights reserved 41
Changed the accounting policy for revenue recognition
(New)
(Original)
2014 2015 2016
Not installed Not arrived
Installed Delivered
Changed points Original Shipment baseNew The date of delivery or installation based on contractual
arrangementsApplied timing January 2016Reason for change Triggered by the introduction of a new ERP implementation to
harmonize with international accounting standardsAs of February 10 2016 audit procedures for this change has not finished yet
Installed Delivered
Not installed Not arrived
Sheet1
copy 2017 HORIBA Ltd All rights reserved 42
Decrease of Operating profit -1642
Exchange impact -3191
Expenses impact -2806
Increase Sales amount
+12426
Increase Cost of
goods sales -8071
Exchange impact
for Gross profit
-6675
Other expenses increase -1574
2015 Results
RampD cost increase -1231
18499
2016 Results
Exchange impact for Expenses +3484
20142
+4354
Operating profit analysis ( vs 2015 ) (Millions of Yen)
Sales impact Decrease sales cost ratio
2015 results are restated numbers The same shall apply hereinafter(same in following slide)
copy 2017 HORIBA Ltd All rights reserved 43
2015 2016 Variation
Cash flows from operating activities 14770 15871 1101
Cash flows from investing activities -30642 -10427 20214
Cash flows from financing activities 12843 -451 -13294
PPampE Investment to MIRA(30BJYP) Depreciation Goodwill of MIRA(04BJYP) Biwako factory (07BJYP) RampD Increased in Automotive Test System Business
Good will of MIRA eg hellip Amortization included
2017 Topics
PPampE Investment to MIRA(30BJYP) Expansion of Aso Factory(27BJYP)
Depreciation Goodwill of MIRA(04BJYP) Increase in MIRA and Test center invested in 2016 RampD Increase in Auto and PampE Business
Capital Investment Depreciation RampD (Billions of yen)
全社実績
セグ実績
全社予算
全社予算2案
セグ予算
セグ予算2案
受注_残
半期予想
設備投資
HOR単体実績
HOR単体予算
HOR単体上期予算
copy 2017 HORIBA Ltd All rights reserved 45
241 Bond
redemption in 2020
Current ratio
280
2014 254 60
Short 66
Cash1
492
Bonds 150
Long 25
Cash1
478
Bonds 150
Long 22 Short 108
2013 269 60
447
Cash1
511
Bonds 150
Long 168
Short 128
2015 229 55
Borrowed from JBIC2
151bn yen (2015)
Capital ratio
467
2016 237 55
Cash1
519
Bonds 150
Long 192
Short 124
Cash Balance (Billions of yen)
(Consolidated basis each end of the year) Total Loan Balance
Conclusion of liquidation of receivable contract with 2 banks Recent issuer rating RampI [A-] (July 2016) JCR [A] (August 2016)
1 CashhellipCash and Cash Equivalents at End of Period 2 JBIC Japan Bank for International Cooperation
Graph1
Sheet1
Sheet1
現預金
短期
長期
社債
Sheet1 (2)
tajikaABX =gtHIL
tajikaSTEC=gtHOR
copy 2017 HORIBA Ltd All rights reserved 46
Contents
2016 Results
2017 Forecast
Business Segment Outline
Shareholder Return
MLMAP2020 [2016-2020]Progress Financial Data Corporate profile
copy 2017 HORIBA Ltd All rights reserved 47
Head office Kyoto Japan Founded 1945 Incorporated 1953 CEO Atsushi Horiba Fiscal year end December 31
Atsushi Horiba Chairman President amp CEO
- Corporate motto -
To have interest and pride in our work to enjoy our lives
Corporate Profile
copy 2017 HORIBA Ltd All rights reserved 48
Medical In-Vitro Diagnostic (IVD) Systems Integration of HORIBA ABXrsquos Technology amp Marketing Know-How
Automotive Test Systems Emission Measurement Systems (EMS) Mechatronics Devices (MCT) Driving Control Systems (ITS) Engineering Consultancy amp Testing (ECT)
Business Segments
Process amp Environmental Environmental Systems Environmental Radiation Monitor Environmental Regulation amp Process Business
Semiconductor Mass Flow Controller In-situ Analysis Synergy among HORIBA HQ HORIBA STEC and HORIBA Jobin Yvonrsquos Technologies
Scientific Synergy of HORIBA and HORIBA Jobin Yvonrsquos Technologies Raman Grating and Fluorescence
copy 2017 HORIBA Ltd All rights reserved 49
Sales 1700 Billions of Yen
Business Composition of Sales
Automotive Test Systems
Process amp Environmental
Medical
Semiconductor
Scientific
Automotive 622 (36)
Scientific 257 (15)
Semiconductor 388 (23)
Medical 265 (16)
PampE 167 (10)
Well Balanced Business Operation -Five Business Segments-
(Billions of Yen)
copy 2017 HORIBA Ltd All rights reserved 50
Market Shares
Market shares quoted are estimates by HORIBA
80 20 100
35
Emission Measurement Systems
57 30
Stack Gas Analyzers Automatic Blood Cell Counter plus CRP
Mass Flow Controllers Raman Spectrophotometers Gratings
Global Domestic
copy 2017 HORIBA Ltd All rights reserved 51
EU Japan
Asia Americas
33
26 18
23
Geographic Composition of Sales(2016)
HORIBA Worldwide
Sales of FY2016 1700 BJPY
The Number of Group Companies by region (As of December 31 2016)
America 9 Europe 23 Asia 17 (4 in Japan including HORIBA Ltd) Total 49
copy 2017 HORIBA Ltd All rights reserved 52
Japan 38
Other Asia 15
France 13
Germany 8
Other Europe 2 USA
10
Other Americas 3
7149
従業員数 2015年12月31日現在
2442
946
3761
UK 11
Employees by Region
Total Number of Employees (As of December 31 2016)
Total Asia 53
Total Europe 34
Total Americas 13
copy 2017 HORIBA Ltd All rights reserved 53 copy 2017 HORIBA Ltd All rights reserved 53
copy 2017 HORIBA Ltd All rights reserved 54
Danke
Grazie
Σας ευχαριστούμε
감사합니다
Obrigado
谢谢
ขอบคณครบ
ありがとうございました
धनयवाद
நனற
Cảm ơn
Dziękuję
Tack ska ni ha
Thank you
Merci
Gracias
Большое спасибо
スライド番号 1
Contents
Contents
スライド番号 4
Summary of 2016 Results
2016 full year results
2016 Results by Segment
Contents
2017 Market outlook
Exchange rate forecast for 2017
Forecast for 2017
Forecast for 2017 by segment
Contents
スライド番号 14
2016 Results and 2017 Forecast
Strategy for improving profitability
Regulatory trend in EMS (Emission Measurement System) and Operations in an emerging Market
ECT (HORIBA MIRA) Business
2016 Results and 2017 Forecast
Analysis technology for the environment
2016 Results and 2017 Forecast
Growth with New Brand and Service
2016 Results and 2017 Forecast
スライド番号 24
2016 Results and 2017 Forecast
Exploit new markets using HORIBA technology
Contents
Shareholder Return
Contents
スライド番号 30
スライド番号 31
スライド番号 32
Accelerate growth in water measuring business
Water measuring and analysisbusiness domain
Water measuring and analysisbusiness domain
Selected as one of New Diversity Management Selection 100 (by the Ministry of Economy Trade and Industry of Japan)
Enhance asset efficiency and maximize corporate value
Symbol of MLMAP2020
Contents
Trend of Market capitalization
Changed the accounting policy for revenue recognition
スライド番号 42
スライド番号 43
スライド番号 44
スライド番号 45
Contents
スライド番号 47
Business Segments
スライド番号 49
Market Shares
スライド番号 51
スライド番号 52
スライド番号 53
スライド番号 54
勘定科目
BS_CL12010
BS_CL12020
BS_CL12030
BS_FL21000
BS_FL23000
勘定科目名称
当座借越
短期借入金
1年内返済長期借入金
社債
長期借入金
HOR
0
(2000000000)
0
(10000000000)
0
日本 ニホン
ABX
(827350776)
(4016672108)
(534035942)
0
(1343663409)
欧州 オウシュウ
ASEC
0
(352000000)
0
0
(180000000)
日本 ニホン
HE
0
(1855530779)
0
0
0
欧州 オウシュウ
HIC
0
(1156081000)
(109236000)
0
(682725000)
米州 ベイシュウ
HIT
(99662290)
0
(200000000)
0
(300000000)
日本 ニホン
HSC
0
(20019305)
0
0
0
アジア
HST
0
(166375000)
0
0
0
アジア
JY
0
0
(9753688)
0
(105723687)
欧州 オウシュウ
会社間照合
0
(5047)
欧州 オウシュウ
会社間照合
200000000
日本 ニホン
会社間照合
480000000
日本 ニホン
会社間照合
2000000000
日本 ニホン
会社間照合
118647000
欧州 オウシュウ
会社間照合
175953553
欧州 オウシュウ
連結合計
(927013066)
(7272082686)
(653025630)
(10000000000)
(2132112096)
(99662290)
(352000000)
0
(10000000000)
0
日本 ニホン
(827350776)
(5577607381)
(543789630)
0
(1449387096)
欧州 オウシュウ
0
(1156081000)
(109236000)
0
(682725000)
米州 ベイシュウ
0
(186394305)
0
0
0
アジア
(927013066)
(7272082686)
(653025630)
(10000000000)
(2132112096)
2008
2009
2010
2011
2012
2013
2008
2008
2009
2009
2013
2013
2014
2014
2015
2015
2016
2016
短期借入金 タンキカリイレキン
8852
6618
5575
6684
5523
6606
現預金 ゲンヨキン
18267
21520
49246
51109
47859
51900
長期借入金 チョウキカリイレキン
2132
1730
1195
1291
2113
2576
短期 タンキ
8852
6618
6606
10832
12800
12400
社債 シャサイ
10000
10000
10000
10000
10000
15000
長期 チョウキ
2132
1730
2576
2209
16800
19200
現預金 ゲンヨキン
18267
21520
26958
28893
34685
42228
社債 シャサイ
10000
10000
15000
15000
15000
15000
流動比率 リュウドウヒリツ
2296
2524
2653
2806
2970
2690
自己資本比率 ジコシホンヒリツ
576
609
612
624
650
600
49246
6606
2576
15000
51109
10832
2209
15000
47859
12800
16800
15000
51900
12400
19200
15000
2013年実績 ネン ジッセキ
2014年実績 ネン ジッセキ
2015年計画 ネン ケイカク
増減
計画(GBM) ケイカク
発表案 ハッピョウ アン
vs 2014
売上高 ウリアゲ タカ
営業利益 エイギョウ リエキ
経常利益 ケイジョウ リエキ
当期純利益 トウキ ジュンリエキ
2013年 ネン
2014年 ネン
2015年 ネン
増減
実績
実績
計画(GBM) ケイカク
決定 ケッテイ
vs 2014
売上高 ウリアゲ タカ
営業利益 エイギョウ リエキ
経常利益 ケイジョウ リエキ
当期純利益 トウキ ジュンリエキ
営業利益率 エイギョウ リエキ リツ
2013実績 ジッセキ
2014年 ネン
増減
開示116 カイジ
実績 ジッセキ
vs 2013
売上高 ウリアゲ タカ
営業利益 エイギョウ リエキ
経常利益 ケイジョウ リエキ
当期純利益 トウキ ジュンリエキ
2015
2016
2017
Results
Forecast117
Results
vs 2015
vs Forecast117
Forecast
vs 2016
PPampE
148
153
134
-10
-12
146
+9
Intangibles
14
07
03
-75
-49
04
+11
Capital Investment
163
160
137
-15
-14
150
+9
Depreciation
61
65
68
+12
+5
72
+6
RampD
123
130
129
+5
-1
140
+8
(To net sales)
(7)
(8)
(8)
(8)
2014年 ネン
2015年 ネン
実績 ジッセキ
社内数値 シャナイ スウチ
発表案 ハッピョウ アン
上期 カミ キ
下期 シモキ
通期 ツウキ
上期 カミキ
下期 シモキ
通期 ツウキ
上期 カミ キ
下期 シモキ
通期 ツウキ
売上高 ウリアゲ ダカ
0
0
0
0
0
自動車 ジドウシャ
0
0
0
環境 カンキョウ
0
0
0
医用 イヨウ
0
0
0
半導体 ハンドウタイ
0
0
0
科学 カガク
0
0
0
営業利益 エイギョウ リエキ
0
0
0
0
0
自動車 ジドウシャ
0
0
0
環境 カンキョウ
0
0
0
医用 イヨウ
0
0
0
半導体 ハンドウタイ
0
0
0
科学 カガク
0
0
0
経常利益 ケイジョウ リエキ
0
0
当期純利益 トウキ ジュンリエキ
0
0
営業利益率 エイギョウ リエキ リツ
ERRORDIV0
ERRORDIV0
ERRORDIV0
ERRORDIV0
ERRORDIV0
ERRORDIV0
ERRORDIV0
ERRORDIV0
ERRORDIV0
自動車 ジドウシャ
ERRORDIV0
ERRORDIV0
ERRORDIV0
ERRORDIV0
ERRORDIV0
ERRORDIV0
ERRORDIV0
ERRORDIV0
ERRORDIV0
環境 カンキョウ
ERRORDIV0
ERRORDIV0
ERRORDIV0
ERRORDIV0
ERRORDIV0
ERRORDIV0
ERRORDIV0
ERRORDIV0
ERRORDIV0
医用 イヨウ
ERRORDIV0
ERRORDIV0
ERRORDIV0
ERRORDIV0
ERRORDIV0
ERRORDIV0
ERRORDIV0
ERRORDIV0
ERRORDIV0
半導体 ハンドウタイ
ERRORDIV0
ERRORDIV0
ERRORDIV0
ERRORDIV0
ERRORDIV0
ERRORDIV0
ERRORDIV0
ERRORDIV0
ERRORDIV0
科学 カガク
ERRORDIV0
ERRORDIV0
ERRORDIV0
ERRORDIV0
ERRORDIV0
ERRORDIV0
ERRORDIV0
ERRORDIV0
ERRORDIV0
受注実績 ジュチュウ ジッセキ
2013
2014
1Q
2Q
3Q
4Q
1Q
2Q
3Q
4Q
自動車
128
125
103
166
環境
39
38
41
40
医用
67
64
60
71
半導体
46
51
69
88
科学
53
61
61
77
合計
334
341
337
444
受注残 ジュチュウ ザン
2013
2014
1Q
2Q
3Q
4Q
1Q
2Q
3Q
4Q
自動車
314
335
325
314
環境
33
39
45
38
医用
30
27
24
23
半導体
20
15
25
31
科学
55
67
76
76
合計
454
486
497
484
受注実績 ジュチュウ ジッセキ
2013
2014
1Q
2Q
3Q
4Q
1Q
2Q
3Q
4Q
自動車
128
125
103
166
EMS
93
91
78
110
MCT
32
30
24
48
HIT
4
4
2
9
受注残 ジュチュウ ザン
2013
2014
推移 スイイ
1Q
2Q
3Q
4Q
1Q
2Q
3Q
4Q
自動車
314
335
325
314
EMS
173
188
195
177
MCT
135
142
125
128
HIT
5
5
4
7
売上高 ウリアゲ ダカ
営業利益 エイギョウ リエキ
2014
2015 計画 ケイカク
2014
2015 計画 ケイカク
実績 ジッセキ
社内数値 シャナイ スウチ
発表案① ハッピョウ アン
発表案② ハッピョウ アン
MLMAP2015年数値 ネン スウチ
実績 ジッセキ
社内数値 シャナイ スウチ
発表案① ハッピョウ アン
発表案② ハッピョウ アン
MLMAP2015年数値 ネン スウチ
vs 2014
vs 2014
対外発表 タイガイ ハッピョウ
社内数値 シャナイ スウチ
vs 2014
vs 2014
対外発表 タイガイ ハッピョウ
社内数値 シャナイ スウチ
自動車 ジドウシャ
環境 カンキョウ
医用 イヨウ
半導体 ハンドウタイ
科学 カガク
合計 ゴウケイ
営業利益 エイギョウ リエキ
2014
2015 計画 ケイカク
実績 ジッセキ
社内数値 シャナイ スウチ
発表案① ハッピョウ アン
発表案② ハッピョウ アン
MLMAP2015年数値 ネン スウチ
vs 2014
vs 2014
対外発表 タイガイ ハッピョウ
社内数値 シャナイ スウチ
自動車 ジドウシャ
環境 カンキョウ
医用 イヨウ
半導体 ハンドウタイ
科学 カガク
合計 ゴウケイ
売上高 ウリアゲ ダカ
営業利益 エイギョウ リエキ
2014
2015
2014
2015
実績 ジッセキ
社内数値 シャナイ スウチ
発表案 ハッピョウ アン
vs2014
実績 ジッセキ
社内数値 シャナイ スウチ
発表案 ハッピョウ アン
vs2014
自動車 ジドウシャ
環境 カンキョウ
医用 イヨウ
半導体 ハンドウタイ
科学 カガク
合計 ゴウケイ
2014
2015年計画 ネン ケイカク
実績 ジッセキ
社内数値 シャナイ スウチ
開示案① カイジ アン ハツアン
開示案② カイジ アン ハツアン
MLMAP2015年数値 ネン スウチ
市場 シジョウ
vs 2014
vs 2014
対外発表 タイガイ ハッピョウ
社内数値 シャナイ スウチ
8社平均 シャ ヘイキン
売上高 ウリアゲ タカ
営業利益 エイギョウ リエキ
経常利益 ケイジョウ リエキ
当期純利益 トウキ ジュンリエキ
営業利益率 エイギョウ リエキ リツ
ドル
ユーロ
配当(円1株) ハイトウ エン カブ
2014
2015
MLMAP2015年数値 ネン スウチ
市場 シジョウ
実績 ジッセキ
社内数値 シャナイ スウチ
発表案 ハッピョウ アン
vs2014
対外発表 タイガイ ハッピョウ
社内数値 シャナイ スウチ
8社平均 シャ ヘイキン
売上高 ウリアゲ タカ
営業利益 エイギョウ リエキ
経常利益 ケイジョウ リエキ
当期純利益 トウキ ジュンリエキ
営業利益率 エイギョウ リエキ リツ
ドル
ユーロ
配当(円1株) ハイトウ エン カブ
売上高 ウリアゲ ダカ
営業利益 エイギョウ リエキ
2013年 ネン
2014年 ネン
2013年 ネン
2014年 ネン
実績 ジッセキ
開示116 カイジ
実績 ジッセキ
増減vsv2013 ゾウゲン
実績 ジッセキ
開示116 カイジ
実績 ジッセキ
増減vsv2013 ゾウゲン
自動車 ジドウシャ
環境 カンキョウ
医用 イヨウ
半導体 ハンドウタイ
科学 カガク
合計 ゴウケイ
2013年 ネン
2014年 ネン
増減比較 ゾウゲン ヒカク
市場 シジョウ
実績 ジッセキ
開示(116) カイジ
実績(監査前) ジッセキ カンサ マエ
vs 13年 ネン
vs 開示 カイジ
8社平均 シャ ヘイキン
売上高 ウリアゲ タカ
営業利益 エイギョウ リエキ
経常利益 ケイジョウ リエキ
当期純利益 トウキ ジュンリエキ
営業利益率 エイギョウ リエキ リツ
配当 ハイトウ
配当性向 ハイトウ セイコウ
為替レート(累計)
ドル
ユーロ
2015
2016
Variation
Cash flows from operating activities
14770
15871
1101
Cash flows from investing activities
-30642
-10427
20214
Cash flows from financing activities
12843
-451
-13294
Cash and cash equivalents at end of year
47859
51940
4081
Free cash flows
-15872
5443
21315
Changed points
Original
Shipment base
New
The date of delivery or installation based on contractual arrangements
Applied timing
January 2016
Reason for change
Triggered by the introduction of a new ERP implementation to harmonize with international accounting standards
copy 2017 HORIBA Ltd All rights reserved 42
Decrease of Operating profit -1642
Exchange impact -3191
Expenses impact -2806
Increase Sales amount
+12426
Increase Cost of
goods sales -8071
Exchange impact
for Gross profit
-6675
Other expenses increase -1574
2015 Results
RampD cost increase -1231
18499
2016 Results
Exchange impact for Expenses +3484
20142
+4354
Operating profit analysis ( vs 2015 ) (Millions of Yen)
Sales impact Decrease sales cost ratio
2015 results are restated numbers The same shall apply hereinafter(same in following slide)
copy 2017 HORIBA Ltd All rights reserved 43
2015 2016 Variation
Cash flows from operating activities 14770 15871 1101
Cash flows from investing activities -30642 -10427 20214
Cash flows from financing activities 12843 -451 -13294
PPampE Investment to MIRA(30BJYP) Depreciation Goodwill of MIRA(04BJYP) Biwako factory (07BJYP) RampD Increased in Automotive Test System Business
Good will of MIRA eg hellip Amortization included
2017 Topics
PPampE Investment to MIRA(30BJYP) Expansion of Aso Factory(27BJYP)
Depreciation Goodwill of MIRA(04BJYP) Increase in MIRA and Test center invested in 2016 RampD Increase in Auto and PampE Business
Capital Investment Depreciation RampD (Billions of yen)
全社実績
セグ実績
全社予算
全社予算2案
セグ予算
セグ予算2案
受注_残
半期予想
設備投資
HOR単体実績
HOR単体予算
HOR単体上期予算
copy 2017 HORIBA Ltd All rights reserved 45
241 Bond
redemption in 2020
Current ratio
280
2014 254 60
Short 66
Cash1
492
Bonds 150
Long 25
Cash1
478
Bonds 150
Long 22 Short 108
2013 269 60
447
Cash1
511
Bonds 150
Long 168
Short 128
2015 229 55
Borrowed from JBIC2
151bn yen (2015)
Capital ratio
467
2016 237 55
Cash1
519
Bonds 150
Long 192
Short 124
Cash Balance (Billions of yen)
(Consolidated basis each end of the year) Total Loan Balance
Conclusion of liquidation of receivable contract with 2 banks Recent issuer rating RampI [A-] (July 2016) JCR [A] (August 2016)
1 CashhellipCash and Cash Equivalents at End of Period 2 JBIC Japan Bank for International Cooperation
Graph1
Sheet1
Sheet1
現預金
短期
長期
社債
Sheet1 (2)
tajikaABX =gtHIL
tajikaSTEC=gtHOR
copy 2017 HORIBA Ltd All rights reserved 46
Contents
2016 Results
2017 Forecast
Business Segment Outline
Shareholder Return
MLMAP2020 [2016-2020]Progress Financial Data Corporate profile
copy 2017 HORIBA Ltd All rights reserved 47
Head office Kyoto Japan Founded 1945 Incorporated 1953 CEO Atsushi Horiba Fiscal year end December 31
Atsushi Horiba Chairman President amp CEO
- Corporate motto -
To have interest and pride in our work to enjoy our lives
Corporate Profile
copy 2017 HORIBA Ltd All rights reserved 48
Medical In-Vitro Diagnostic (IVD) Systems Integration of HORIBA ABXrsquos Technology amp Marketing Know-How
Automotive Test Systems Emission Measurement Systems (EMS) Mechatronics Devices (MCT) Driving Control Systems (ITS) Engineering Consultancy amp Testing (ECT)
Business Segments
Process amp Environmental Environmental Systems Environmental Radiation Monitor Environmental Regulation amp Process Business
Semiconductor Mass Flow Controller In-situ Analysis Synergy among HORIBA HQ HORIBA STEC and HORIBA Jobin Yvonrsquos Technologies
Scientific Synergy of HORIBA and HORIBA Jobin Yvonrsquos Technologies Raman Grating and Fluorescence
copy 2017 HORIBA Ltd All rights reserved 49
Sales 1700 Billions of Yen
Business Composition of Sales
Automotive Test Systems
Process amp Environmental
Medical
Semiconductor
Scientific
Automotive 622 (36)
Scientific 257 (15)
Semiconductor 388 (23)
Medical 265 (16)
PampE 167 (10)
Well Balanced Business Operation -Five Business Segments-
(Billions of Yen)
copy 2017 HORIBA Ltd All rights reserved 50
Market Shares
Market shares quoted are estimates by HORIBA
80 20 100
35
Emission Measurement Systems
57 30
Stack Gas Analyzers Automatic Blood Cell Counter plus CRP
Mass Flow Controllers Raman Spectrophotometers Gratings
Global Domestic
copy 2017 HORIBA Ltd All rights reserved 51
EU Japan
Asia Americas
33
26 18
23
Geographic Composition of Sales(2016)
HORIBA Worldwide
Sales of FY2016 1700 BJPY
The Number of Group Companies by region (As of December 31 2016)
America 9 Europe 23 Asia 17 (4 in Japan including HORIBA Ltd) Total 49
copy 2017 HORIBA Ltd All rights reserved 52
Japan 38
Other Asia 15
France 13
Germany 8
Other Europe 2 USA
10
Other Americas 3
7149
従業員数 2015年12月31日現在
2442
946
3761
UK 11
Employees by Region
Total Number of Employees (As of December 31 2016)
Total Asia 53
Total Europe 34
Total Americas 13
copy 2017 HORIBA Ltd All rights reserved 53 copy 2017 HORIBA Ltd All rights reserved 53
copy 2017 HORIBA Ltd All rights reserved 54
Danke
Grazie
Σας ευχαριστούμε
감사합니다
Obrigado
谢谢
ขอบคณครบ
ありがとうございました
धनयवाद
நனற
Cảm ơn
Dziękuję
Tack ska ni ha
Thank you
Merci
Gracias
Большое спасибо
スライド番号 1
Contents
Contents
スライド番号 4
Summary of 2016 Results
2016 full year results
2016 Results by Segment
Contents
2017 Market outlook
Exchange rate forecast for 2017
Forecast for 2017
Forecast for 2017 by segment
Contents
スライド番号 14
2016 Results and 2017 Forecast
Strategy for improving profitability
Regulatory trend in EMS (Emission Measurement System) and Operations in an emerging Market
ECT (HORIBA MIRA) Business
2016 Results and 2017 Forecast
Analysis technology for the environment
2016 Results and 2017 Forecast
Growth with New Brand and Service
2016 Results and 2017 Forecast
スライド番号 24
2016 Results and 2017 Forecast
Exploit new markets using HORIBA technology
Contents
Shareholder Return
Contents
スライド番号 30
スライド番号 31
スライド番号 32
Accelerate growth in water measuring business
Water measuring and analysisbusiness domain
Water measuring and analysisbusiness domain
Selected as one of New Diversity Management Selection 100 (by the Ministry of Economy Trade and Industry of Japan)
Enhance asset efficiency and maximize corporate value
Symbol of MLMAP2020
Contents
Trend of Market capitalization
Changed the accounting policy for revenue recognition
スライド番号 42
スライド番号 43
スライド番号 44
スライド番号 45
Contents
スライド番号 47
Business Segments
スライド番号 49
Market Shares
スライド番号 51
スライド番号 52
スライド番号 53
スライド番号 54
勘定科目
BS_CL12010
BS_CL12020
BS_CL12030
BS_FL21000
BS_FL23000
勘定科目名称
当座借越
短期借入金
1年内返済長期借入金
社債
長期借入金
HOR
0
(2000000000)
0
(10000000000)
0
日本 ニホン
ABX
(827350776)
(4016672108)
(534035942)
0
(1343663409)
欧州 オウシュウ
ASEC
0
(352000000)
0
0
(180000000)
日本 ニホン
HE
0
(1855530779)
0
0
0
欧州 オウシュウ
HIC
0
(1156081000)
(109236000)
0
(682725000)
米州 ベイシュウ
HIT
(99662290)
0
(200000000)
0
(300000000)
日本 ニホン
HSC
0
(20019305)
0
0
0
アジア
HST
0
(166375000)
0
0
0
アジア
JY
0
0
(9753688)
0
(105723687)
欧州 オウシュウ
会社間照合
0
(5047)
欧州 オウシュウ
会社間照合
200000000
日本 ニホン
会社間照合
480000000
日本 ニホン
会社間照合
2000000000
日本 ニホン
会社間照合
118647000
欧州 オウシュウ
会社間照合
175953553
欧州 オウシュウ
連結合計
(927013066)
(7272082686)
(653025630)
(10000000000)
(2132112096)
(99662290)
(352000000)
0
(10000000000)
0
日本 ニホン
(827350776)
(5577607381)
(543789630)
0
(1449387096)
欧州 オウシュウ
0
(1156081000)
(109236000)
0
(682725000)
米州 ベイシュウ
0
(186394305)
0
0
0
アジア
(927013066)
(7272082686)
(653025630)
(10000000000)
(2132112096)
2008
2009
2010
2011
2012
2013
2008
2008
2009
2009
2013
2013
2014
2014
2015
2015
2016
2016
短期借入金 タンキカリイレキン
8852
6618
5575
6684
5523
6606
現預金 ゲンヨキン
18267
21520
49246
51109
47859
51900
長期借入金 チョウキカリイレキン
2132
1730
1195
1291
2113
2576
短期 タンキ
8852
6618
6606
10832
12800
12400
社債 シャサイ
10000
10000
10000
10000
10000
15000
長期 チョウキ
2132
1730
2576
2209
16800
19200
現預金 ゲンヨキン
18267
21520
26958
28893
34685
42228
社債 シャサイ
10000
10000
15000
15000
15000
15000
流動比率 リュウドウヒリツ
2296
2524
2653
2806
2970
2690
自己資本比率 ジコシホンヒリツ
576
609
612
624
650
600
49246
6606
2576
15000
51109
10832
2209
15000
47859
12800
16800
15000
51900
12400
19200
15000
2013年実績 ネン ジッセキ
2014年実績 ネン ジッセキ
2015年計画 ネン ケイカク
増減
計画(GBM) ケイカク
発表案 ハッピョウ アン
vs 2014
売上高 ウリアゲ タカ
営業利益 エイギョウ リエキ
経常利益 ケイジョウ リエキ
当期純利益 トウキ ジュンリエキ
2013年 ネン
2014年 ネン
2015年 ネン
増減
実績
実績
計画(GBM) ケイカク
決定 ケッテイ
vs 2014
売上高 ウリアゲ タカ
営業利益 エイギョウ リエキ
経常利益 ケイジョウ リエキ
当期純利益 トウキ ジュンリエキ
営業利益率 エイギョウ リエキ リツ
2013実績 ジッセキ
2014年 ネン
増減
開示116 カイジ
実績 ジッセキ
vs 2013
売上高 ウリアゲ タカ
営業利益 エイギョウ リエキ
経常利益 ケイジョウ リエキ
当期純利益 トウキ ジュンリエキ
2015
2016
2017
Results
Forecast117
Results
vs 2015
vs Forecast117
Forecast
vs 2016
PPampE
148
153
134
-10
-12
146
+9
Intangibles
14
07
03
-75
-49
04
+11
Capital Investment
163
160
137
-15
-14
150
+9
Depreciation
61
65
68
+12
+5
72
+6
RampD
123
130
129
+5
-1
140
+8
(To net sales)
(7)
(8)
(8)
(8)
2014年 ネン
2015年 ネン
実績 ジッセキ
社内数値 シャナイ スウチ
発表案 ハッピョウ アン
上期 カミ キ
下期 シモキ
通期 ツウキ
上期 カミキ
下期 シモキ
通期 ツウキ
上期 カミ キ
下期 シモキ
通期 ツウキ
売上高 ウリアゲ ダカ
0
0
0
0
0
自動車 ジドウシャ
0
0
0
環境 カンキョウ
0
0
0
医用 イヨウ
0
0
0
半導体 ハンドウタイ
0
0
0
科学 カガク
0
0
0
営業利益 エイギョウ リエキ
0
0
0
0
0
自動車 ジドウシャ
0
0
0
環境 カンキョウ
0
0
0
医用 イヨウ
0
0
0
半導体 ハンドウタイ
0
0
0
科学 カガク
0
0
0
経常利益 ケイジョウ リエキ
0
0
当期純利益 トウキ ジュンリエキ
0
0
営業利益率 エイギョウ リエキ リツ
ERRORDIV0
ERRORDIV0
ERRORDIV0
ERRORDIV0
ERRORDIV0
ERRORDIV0
ERRORDIV0
ERRORDIV0
ERRORDIV0
自動車 ジドウシャ
ERRORDIV0
ERRORDIV0
ERRORDIV0
ERRORDIV0
ERRORDIV0
ERRORDIV0
ERRORDIV0
ERRORDIV0
ERRORDIV0
環境 カンキョウ
ERRORDIV0
ERRORDIV0
ERRORDIV0
ERRORDIV0
ERRORDIV0
ERRORDIV0
ERRORDIV0
ERRORDIV0
ERRORDIV0
医用 イヨウ
ERRORDIV0
ERRORDIV0
ERRORDIV0
ERRORDIV0
ERRORDIV0
ERRORDIV0
ERRORDIV0
ERRORDIV0
ERRORDIV0
半導体 ハンドウタイ
ERRORDIV0
ERRORDIV0
ERRORDIV0
ERRORDIV0
ERRORDIV0
ERRORDIV0
ERRORDIV0
ERRORDIV0
ERRORDIV0
科学 カガク
ERRORDIV0
ERRORDIV0
ERRORDIV0
ERRORDIV0
ERRORDIV0
ERRORDIV0
ERRORDIV0
ERRORDIV0
ERRORDIV0
受注実績 ジュチュウ ジッセキ
2013
2014
1Q
2Q
3Q
4Q
1Q
2Q
3Q
4Q
自動車
128
125
103
166
環境
39
38
41
40
医用
67
64
60
71
半導体
46
51
69
88
科学
53
61
61
77
合計
334
341
337
444
受注残 ジュチュウ ザン
2013
2014
1Q
2Q
3Q
4Q
1Q
2Q
3Q
4Q
自動車
314
335
325
314
環境
33
39
45
38
医用
30
27
24
23
半導体
20
15
25
31
科学
55
67
76
76
合計
454
486
497
484
受注実績 ジュチュウ ジッセキ
2013
2014
1Q
2Q
3Q
4Q
1Q
2Q
3Q
4Q
自動車
128
125
103
166
EMS
93
91
78
110
MCT
32
30
24
48
HIT
4
4
2
9
受注残 ジュチュウ ザン
2013
2014
推移 スイイ
1Q
2Q
3Q
4Q
1Q
2Q
3Q
4Q
自動車
314
335
325
314
EMS
173
188
195
177
MCT
135
142
125
128
HIT
5
5
4
7
売上高 ウリアゲ ダカ
営業利益 エイギョウ リエキ
2014
2015 計画 ケイカク
2014
2015 計画 ケイカク
実績 ジッセキ
社内数値 シャナイ スウチ
発表案① ハッピョウ アン
発表案② ハッピョウ アン
MLMAP2015年数値 ネン スウチ
実績 ジッセキ
社内数値 シャナイ スウチ
発表案① ハッピョウ アン
発表案② ハッピョウ アン
MLMAP2015年数値 ネン スウチ
vs 2014
vs 2014
対外発表 タイガイ ハッピョウ
社内数値 シャナイ スウチ
vs 2014
vs 2014
対外発表 タイガイ ハッピョウ
社内数値 シャナイ スウチ
自動車 ジドウシャ
環境 カンキョウ
医用 イヨウ
半導体 ハンドウタイ
科学 カガク
合計 ゴウケイ
営業利益 エイギョウ リエキ
2014
2015 計画 ケイカク
実績 ジッセキ
社内数値 シャナイ スウチ
発表案① ハッピョウ アン
発表案② ハッピョウ アン
MLMAP2015年数値 ネン スウチ
vs 2014
vs 2014
対外発表 タイガイ ハッピョウ
社内数値 シャナイ スウチ
自動車 ジドウシャ
環境 カンキョウ
医用 イヨウ
半導体 ハンドウタイ
科学 カガク
合計 ゴウケイ
売上高 ウリアゲ ダカ
営業利益 エイギョウ リエキ
2014
2015
2014
2015
実績 ジッセキ
社内数値 シャナイ スウチ
発表案 ハッピョウ アン
vs2014
実績 ジッセキ
社内数値 シャナイ スウチ
発表案 ハッピョウ アン
vs2014
自動車 ジドウシャ
環境 カンキョウ
医用 イヨウ
半導体 ハンドウタイ
科学 カガク
合計 ゴウケイ
2014
2015年計画 ネン ケイカク
実績 ジッセキ
社内数値 シャナイ スウチ
開示案① カイジ アン ハツアン
開示案② カイジ アン ハツアン
MLMAP2015年数値 ネン スウチ
市場 シジョウ
vs 2014
vs 2014
対外発表 タイガイ ハッピョウ
社内数値 シャナイ スウチ
8社平均 シャ ヘイキン
売上高 ウリアゲ タカ
営業利益 エイギョウ リエキ
経常利益 ケイジョウ リエキ
当期純利益 トウキ ジュンリエキ
営業利益率 エイギョウ リエキ リツ
ドル
ユーロ
配当(円1株) ハイトウ エン カブ
2014
2015
MLMAP2015年数値 ネン スウチ
市場 シジョウ
実績 ジッセキ
社内数値 シャナイ スウチ
発表案 ハッピョウ アン
vs2014
対外発表 タイガイ ハッピョウ
社内数値 シャナイ スウチ
8社平均 シャ ヘイキン
売上高 ウリアゲ タカ
営業利益 エイギョウ リエキ
経常利益 ケイジョウ リエキ
当期純利益 トウキ ジュンリエキ
営業利益率 エイギョウ リエキ リツ
ドル
ユーロ
配当(円1株) ハイトウ エン カブ
売上高 ウリアゲ ダカ
営業利益 エイギョウ リエキ
2013年 ネン
2014年 ネン
2013年 ネン
2014年 ネン
実績 ジッセキ
開示116 カイジ
実績 ジッセキ
増減vsv2013 ゾウゲン
実績 ジッセキ
開示116 カイジ
実績 ジッセキ
増減vsv2013 ゾウゲン
自動車 ジドウシャ
環境 カンキョウ
医用 イヨウ
半導体 ハンドウタイ
科学 カガク
合計 ゴウケイ
2013年 ネン
2014年 ネン
増減比較 ゾウゲン ヒカク
市場 シジョウ
実績 ジッセキ
開示(116) カイジ
実績(監査前) ジッセキ カンサ マエ
vs 13年 ネン
vs 開示 カイジ
8社平均 シャ ヘイキン
売上高 ウリアゲ タカ
営業利益 エイギョウ リエキ
経常利益 ケイジョウ リエキ
当期純利益 トウキ ジュンリエキ
営業利益率 エイギョウ リエキ リツ
配当 ハイトウ
配当性向 ハイトウ セイコウ
為替レート(累計)
ドル
ユーロ
2015
2016
Variation
Cash flows from operating activities
14770
15871
1101
Cash flows from investing activities
-30642
-10427
20214
Cash flows from financing activities
12843
-451
-13294
Cash and cash equivalents at end of year
47859
51940
4081
Free cash flows
-15872
5443
21315
copy 2017 HORIBA Ltd All rights reserved 43
2015 2016 Variation
Cash flows from operating activities 14770 15871 1101
Cash flows from investing activities -30642 -10427 20214
Cash flows from financing activities 12843 -451 -13294
PPampE Investment to MIRA(30BJYP) Depreciation Goodwill of MIRA(04BJYP) Biwako factory (07BJYP) RampD Increased in Automotive Test System Business
Good will of MIRA eg hellip Amortization included
2017 Topics
PPampE Investment to MIRA(30BJYP) Expansion of Aso Factory(27BJYP)
Depreciation Goodwill of MIRA(04BJYP) Increase in MIRA and Test center invested in 2016 RampD Increase in Auto and PampE Business
Capital Investment Depreciation RampD (Billions of yen)
全社実績
セグ実績
全社予算
全社予算2案
セグ予算
セグ予算2案
受注_残
半期予想
設備投資
HOR単体実績
HOR単体予算
HOR単体上期予算
copy 2017 HORIBA Ltd All rights reserved 45
241 Bond
redemption in 2020
Current ratio
280
2014 254 60
Short 66
Cash1
492
Bonds 150
Long 25
Cash1
478
Bonds 150
Long 22 Short 108
2013 269 60
447
Cash1
511
Bonds 150
Long 168
Short 128
2015 229 55
Borrowed from JBIC2
151bn yen (2015)
Capital ratio
467
2016 237 55
Cash1
519
Bonds 150
Long 192
Short 124
Cash Balance (Billions of yen)
(Consolidated basis each end of the year) Total Loan Balance
Conclusion of liquidation of receivable contract with 2 banks Recent issuer rating RampI [A-] (July 2016) JCR [A] (August 2016)
1 CashhellipCash and Cash Equivalents at End of Period 2 JBIC Japan Bank for International Cooperation
Graph1
Sheet1
Sheet1
現預金
短期
長期
社債
Sheet1 (2)
tajikaABX =gtHIL
tajikaSTEC=gtHOR
copy 2017 HORIBA Ltd All rights reserved 46
Contents
2016 Results
2017 Forecast
Business Segment Outline
Shareholder Return
MLMAP2020 [2016-2020]Progress Financial Data Corporate profile
copy 2017 HORIBA Ltd All rights reserved 47
Head office Kyoto Japan Founded 1945 Incorporated 1953 CEO Atsushi Horiba Fiscal year end December 31
Atsushi Horiba Chairman President amp CEO
- Corporate motto -
To have interest and pride in our work to enjoy our lives
Corporate Profile
copy 2017 HORIBA Ltd All rights reserved 48
Medical In-Vitro Diagnostic (IVD) Systems Integration of HORIBA ABXrsquos Technology amp Marketing Know-How
Automotive Test Systems Emission Measurement Systems (EMS) Mechatronics Devices (MCT) Driving Control Systems (ITS) Engineering Consultancy amp Testing (ECT)
Business Segments
Process amp Environmental Environmental Systems Environmental Radiation Monitor Environmental Regulation amp Process Business
Semiconductor Mass Flow Controller In-situ Analysis Synergy among HORIBA HQ HORIBA STEC and HORIBA Jobin Yvonrsquos Technologies
Scientific Synergy of HORIBA and HORIBA Jobin Yvonrsquos Technologies Raman Grating and Fluorescence
copy 2017 HORIBA Ltd All rights reserved 49
Sales 1700 Billions of Yen
Business Composition of Sales
Automotive Test Systems
Process amp Environmental
Medical
Semiconductor
Scientific
Automotive 622 (36)
Scientific 257 (15)
Semiconductor 388 (23)
Medical 265 (16)
PampE 167 (10)
Well Balanced Business Operation -Five Business Segments-
(Billions of Yen)
copy 2017 HORIBA Ltd All rights reserved 50
Market Shares
Market shares quoted are estimates by HORIBA
80 20 100
35
Emission Measurement Systems
57 30
Stack Gas Analyzers Automatic Blood Cell Counter plus CRP
Mass Flow Controllers Raman Spectrophotometers Gratings
Global Domestic
copy 2017 HORIBA Ltd All rights reserved 51
EU Japan
Asia Americas
33
26 18
23
Geographic Composition of Sales(2016)
HORIBA Worldwide
Sales of FY2016 1700 BJPY
The Number of Group Companies by region (As of December 31 2016)
America 9 Europe 23 Asia 17 (4 in Japan including HORIBA Ltd) Total 49
copy 2017 HORIBA Ltd All rights reserved 52
Japan 38
Other Asia 15
France 13
Germany 8
Other Europe 2 USA
10
Other Americas 3
7149
従業員数 2015年12月31日現在
2442
946
3761
UK 11
Employees by Region
Total Number of Employees (As of December 31 2016)
Total Asia 53
Total Europe 34
Total Americas 13
copy 2017 HORIBA Ltd All rights reserved 53 copy 2017 HORIBA Ltd All rights reserved 53
copy 2017 HORIBA Ltd All rights reserved 54
Danke
Grazie
Σας ευχαριστούμε
감사합니다
Obrigado
谢谢
ขอบคณครบ
ありがとうございました
धनयवाद
நனற
Cảm ơn
Dziękuję
Tack ska ni ha
Thank you
Merci
Gracias
Большое спасибо
スライド番号 1
Contents
Contents
スライド番号 4
Summary of 2016 Results
2016 full year results
2016 Results by Segment
Contents
2017 Market outlook
Exchange rate forecast for 2017
Forecast for 2017
Forecast for 2017 by segment
Contents
スライド番号 14
2016 Results and 2017 Forecast
Strategy for improving profitability
Regulatory trend in EMS (Emission Measurement System) and Operations in an emerging Market
ECT (HORIBA MIRA) Business
2016 Results and 2017 Forecast
Analysis technology for the environment
2016 Results and 2017 Forecast
Growth with New Brand and Service
2016 Results and 2017 Forecast
スライド番号 24
2016 Results and 2017 Forecast
Exploit new markets using HORIBA technology
Contents
Shareholder Return
Contents
スライド番号 30
スライド番号 31
スライド番号 32
Accelerate growth in water measuring business
Water measuring and analysisbusiness domain
Water measuring and analysisbusiness domain
Selected as one of New Diversity Management Selection 100 (by the Ministry of Economy Trade and Industry of Japan)
Enhance asset efficiency and maximize corporate value
Symbol of MLMAP2020
Contents
Trend of Market capitalization
Changed the accounting policy for revenue recognition
スライド番号 42
スライド番号 43
スライド番号 44
スライド番号 45
Contents
スライド番号 47
Business Segments
スライド番号 49
Market Shares
スライド番号 51
スライド番号 52
スライド番号 53
スライド番号 54
勘定科目
BS_CL12010
BS_CL12020
BS_CL12030
BS_FL21000
BS_FL23000
勘定科目名称
当座借越
短期借入金
1年内返済長期借入金
社債
長期借入金
HOR
0
(2000000000)
0
(10000000000)
0
日本 ニホン
ABX
(827350776)
(4016672108)
(534035942)
0
(1343663409)
欧州 オウシュウ
ASEC
0
(352000000)
0
0
(180000000)
日本 ニホン
HE
0
(1855530779)
0
0
0
欧州 オウシュウ
HIC
0
(1156081000)
(109236000)
0
(682725000)
米州 ベイシュウ
HIT
(99662290)
0
(200000000)
0
(300000000)
日本 ニホン
HSC
0
(20019305)
0
0
0
アジア
HST
0
(166375000)
0
0
0
アジア
JY
0
0
(9753688)
0
(105723687)
欧州 オウシュウ
会社間照合
0
(5047)
欧州 オウシュウ
会社間照合
200000000
日本 ニホン
会社間照合
480000000
日本 ニホン
会社間照合
2000000000
日本 ニホン
会社間照合
118647000
欧州 オウシュウ
会社間照合
175953553
欧州 オウシュウ
連結合計
(927013066)
(7272082686)
(653025630)
(10000000000)
(2132112096)
(99662290)
(352000000)
0
(10000000000)
0
日本 ニホン
(827350776)
(5577607381)
(543789630)
0
(1449387096)
欧州 オウシュウ
0
(1156081000)
(109236000)
0
(682725000)
米州 ベイシュウ
0
(186394305)
0
0
0
アジア
(927013066)
(7272082686)
(653025630)
(10000000000)
(2132112096)
2008
2009
2010
2011
2012
2013
2008
2008
2009
2009
2013
2013
2014
2014
2015
2015
2016
2016
短期借入金 タンキカリイレキン
8852
6618
5575
6684
5523
6606
現預金 ゲンヨキン
18267
21520
49246
51109
47859
51900
長期借入金 チョウキカリイレキン
2132
1730
1195
1291
2113
2576
短期 タンキ
8852
6618
6606
10832
12800
12400
社債 シャサイ
10000
10000
10000
10000
10000
15000
長期 チョウキ
2132
1730
2576
2209
16800
19200
現預金 ゲンヨキン
18267
21520
26958
28893
34685
42228
社債 シャサイ
10000
10000
15000
15000
15000
15000
流動比率 リュウドウヒリツ
2296
2524
2653
2806
2970
2690
自己資本比率 ジコシホンヒリツ
576
609
612
624
650
600
49246
6606
2576
15000
51109
10832
2209
15000
47859
12800
16800
15000
51900
12400
19200
15000
2013年実績 ネン ジッセキ
2014年実績 ネン ジッセキ
2015年計画 ネン ケイカク
増減
計画(GBM) ケイカク
発表案 ハッピョウ アン
vs 2014
売上高 ウリアゲ タカ
営業利益 エイギョウ リエキ
経常利益 ケイジョウ リエキ
当期純利益 トウキ ジュンリエキ
2013年 ネン
2014年 ネン
2015年 ネン
増減
実績
実績
計画(GBM) ケイカク
決定 ケッテイ
vs 2014
売上高 ウリアゲ タカ
営業利益 エイギョウ リエキ
経常利益 ケイジョウ リエキ
当期純利益 トウキ ジュンリエキ
営業利益率 エイギョウ リエキ リツ
2013実績 ジッセキ
2014年 ネン
増減
開示116 カイジ
実績 ジッセキ
vs 2013
売上高 ウリアゲ タカ
営業利益 エイギョウ リエキ
経常利益 ケイジョウ リエキ
当期純利益 トウキ ジュンリエキ
2015
2016
2017
Results
Forecast117
Results
vs 2015
vs Forecast117
Forecast
vs 2016
PPampE
148
153
134
-10
-12
146
+9
Intangibles
14
07
03
-75
-49
04
+11
Capital Investment
163
160
137
-15
-14
150
+9
Depreciation
61
65
68
+12
+5
72
+6
RampD
123
130
129
+5
-1
140
+8
(To net sales)
(7)
(8)
(8)
(8)
2014年 ネン
2015年 ネン
実績 ジッセキ
社内数値 シャナイ スウチ
発表案 ハッピョウ アン
上期 カミ キ
下期 シモキ
通期 ツウキ
上期 カミキ
下期 シモキ
通期 ツウキ
上期 カミ キ
下期 シモキ
通期 ツウキ
売上高 ウリアゲ ダカ
0
0
0
0
0
自動車 ジドウシャ
0
0
0
環境 カンキョウ
0
0
0
医用 イヨウ
0
0
0
半導体 ハンドウタイ
0
0
0
科学 カガク
0
0
0
営業利益 エイギョウ リエキ
0
0
0
0
0
自動車 ジドウシャ
0
0
0
環境 カンキョウ
0
0
0
医用 イヨウ
0
0
0
半導体 ハンドウタイ
0
0
0
科学 カガク
0
0
0
経常利益 ケイジョウ リエキ
0
0
当期純利益 トウキ ジュンリエキ
0
0
営業利益率 エイギョウ リエキ リツ
ERRORDIV0
ERRORDIV0
ERRORDIV0
ERRORDIV0
ERRORDIV0
ERRORDIV0
ERRORDIV0
ERRORDIV0
ERRORDIV0
自動車 ジドウシャ
ERRORDIV0
ERRORDIV0
ERRORDIV0
ERRORDIV0
ERRORDIV0
ERRORDIV0
ERRORDIV0
ERRORDIV0
ERRORDIV0
環境 カンキョウ
ERRORDIV0
ERRORDIV0
ERRORDIV0
ERRORDIV0
ERRORDIV0
ERRORDIV0
ERRORDIV0
ERRORDIV0
ERRORDIV0
医用 イヨウ
ERRORDIV0
ERRORDIV0
ERRORDIV0
ERRORDIV0
ERRORDIV0
ERRORDIV0
ERRORDIV0
ERRORDIV0
ERRORDIV0
半導体 ハンドウタイ
ERRORDIV0
ERRORDIV0
ERRORDIV0
ERRORDIV0
ERRORDIV0
ERRORDIV0
ERRORDIV0
ERRORDIV0
ERRORDIV0
科学 カガク
ERRORDIV0
ERRORDIV0
ERRORDIV0
ERRORDIV0
ERRORDIV0
ERRORDIV0
ERRORDIV0
ERRORDIV0
ERRORDIV0
受注実績 ジュチュウ ジッセキ
2013
2014
1Q
2Q
3Q
4Q
1Q
2Q
3Q
4Q
自動車
128
125
103
166
環境
39
38
41
40
医用
67
64
60
71
半導体
46
51
69
88
科学
53
61
61
77
合計
334
341
337
444
受注残 ジュチュウ ザン
2013
2014
1Q
2Q
3Q
4Q
1Q
2Q
3Q
4Q
自動車
314
335
325
314
環境
33
39
45
38
医用
30
27
24
23
半導体
20
15
25
31
科学
55
67
76
76
合計
454
486
497
484
受注実績 ジュチュウ ジッセキ
2013
2014
1Q
2Q
3Q
4Q
1Q
2Q
3Q
4Q
自動車
128
125
103
166
EMS
93
91
78
110
MCT
32
30
24
48
HIT
4
4
2
9
受注残 ジュチュウ ザン
2013
2014
推移 スイイ
1Q
2Q
3Q
4Q
1Q
2Q
3Q
4Q
自動車
314
335
325
314
EMS
173
188
195
177
MCT
135
142
125
128
HIT
5
5
4
7
売上高 ウリアゲ ダカ
営業利益 エイギョウ リエキ
2014
2015 計画 ケイカク
2014
2015 計画 ケイカク
実績 ジッセキ
社内数値 シャナイ スウチ
発表案① ハッピョウ アン
発表案② ハッピョウ アン
MLMAP2015年数値 ネン スウチ
実績 ジッセキ
社内数値 シャナイ スウチ
発表案① ハッピョウ アン
発表案② ハッピョウ アン
MLMAP2015年数値 ネン スウチ
vs 2014
vs 2014
対外発表 タイガイ ハッピョウ
社内数値 シャナイ スウチ
vs 2014
vs 2014
対外発表 タイガイ ハッピョウ
社内数値 シャナイ スウチ
自動車 ジドウシャ
環境 カンキョウ
医用 イヨウ
半導体 ハンドウタイ
科学 カガク
合計 ゴウケイ
営業利益 エイギョウ リエキ
2014
2015 計画 ケイカク
実績 ジッセキ
社内数値 シャナイ スウチ
発表案① ハッピョウ アン
発表案② ハッピョウ アン
MLMAP2015年数値 ネン スウチ
vs 2014
vs 2014
対外発表 タイガイ ハッピョウ
社内数値 シャナイ スウチ
自動車 ジドウシャ
環境 カンキョウ
医用 イヨウ
半導体 ハンドウタイ
科学 カガク
合計 ゴウケイ
売上高 ウリアゲ ダカ
営業利益 エイギョウ リエキ
2014
2015
2014
2015
実績 ジッセキ
社内数値 シャナイ スウチ
発表案 ハッピョウ アン
vs2014
実績 ジッセキ
社内数値 シャナイ スウチ
発表案 ハッピョウ アン
vs2014
自動車 ジドウシャ
環境 カンキョウ
医用 イヨウ
半導体 ハンドウタイ
科学 カガク
合計 ゴウケイ
2014
2015年計画 ネン ケイカク
実績 ジッセキ
社内数値 シャナイ スウチ
開示案① カイジ アン ハツアン
開示案② カイジ アン ハツアン
MLMAP2015年数値 ネン スウチ
市場 シジョウ
vs 2014
vs 2014
対外発表 タイガイ ハッピョウ
社内数値 シャナイ スウチ
8社平均 シャ ヘイキン
売上高 ウリアゲ タカ
営業利益 エイギョウ リエキ
経常利益 ケイジョウ リエキ
当期純利益 トウキ ジュンリエキ
営業利益率 エイギョウ リエキ リツ
ドル
ユーロ
配当(円1株) ハイトウ エン カブ
2014
2015
MLMAP2015年数値 ネン スウチ
市場 シジョウ
実績 ジッセキ
社内数値 シャナイ スウチ
発表案 ハッピョウ アン
vs2014
対外発表 タイガイ ハッピョウ
社内数値 シャナイ スウチ
8社平均 シャ ヘイキン
売上高 ウリアゲ タカ
営業利益 エイギョウ リエキ
経常利益 ケイジョウ リエキ
当期純利益 トウキ ジュンリエキ
営業利益率 エイギョウ リエキ リツ
ドル
ユーロ
配当(円1株) ハイトウ エン カブ
売上高 ウリアゲ ダカ
営業利益 エイギョウ リエキ
2013年 ネン
2014年 ネン
2013年 ネン
2014年 ネン
実績 ジッセキ
開示116 カイジ
実績 ジッセキ
増減vsv2013 ゾウゲン
実績 ジッセキ
開示116 カイジ
実績 ジッセキ
増減vsv2013 ゾウゲン
自動車 ジドウシャ
環境 カンキョウ
医用 イヨウ
半導体 ハンドウタイ
科学 カガク
合計 ゴウケイ
2013年 ネン
2014年 ネン
増減比較 ゾウゲン ヒカク
市場 シジョウ
実績 ジッセキ
開示(116) カイジ
実績(監査前) ジッセキ カンサ マエ
vs 13年 ネン
vs 開示 カイジ
8社平均 シャ ヘイキン
売上高 ウリアゲ タカ
営業利益 エイギョウ リエキ
経常利益 ケイジョウ リエキ
当期純利益 トウキ ジュンリエキ
営業利益率 エイギョウ リエキ リツ
配当 ハイトウ
配当性向 ハイトウ セイコウ
為替レート(累計)
ドル
ユーロ
copy 2017 HORIBA Ltd All rights reserved 45
241 Bond
redemption in 2020
Current ratio
280
2014 254 60
Short 66
Cash1
492
Bonds 150
Long 25
Cash1
478
Bonds 150
Long 22 Short 108
2013 269 60
447
Cash1
511
Bonds 150
Long 168
Short 128
2015 229 55
Borrowed from JBIC2
151bn yen (2015)
Capital ratio
467
2016 237 55
Cash1
519
Bonds 150
Long 192
Short 124
Cash Balance (Billions of yen)
(Consolidated basis each end of the year) Total Loan Balance
Conclusion of liquidation of receivable contract with 2 banks Recent issuer rating RampI [A-] (July 2016) JCR [A] (August 2016)
1 CashhellipCash and Cash Equivalents at End of Period 2 JBIC Japan Bank for International Cooperation
Graph1
Sheet1
Sheet1
現預金
短期
長期
社債
Sheet1 (2)
tajikaABX =gtHIL
tajikaSTEC=gtHOR
copy 2017 HORIBA Ltd All rights reserved 46
Contents
2016 Results
2017 Forecast
Business Segment Outline
Shareholder Return
MLMAP2020 [2016-2020]Progress Financial Data Corporate profile
copy 2017 HORIBA Ltd All rights reserved 47
Head office Kyoto Japan Founded 1945 Incorporated 1953 CEO Atsushi Horiba Fiscal year end December 31
Atsushi Horiba Chairman President amp CEO
- Corporate motto -
To have interest and pride in our work to enjoy our lives
Corporate Profile
copy 2017 HORIBA Ltd All rights reserved 48
Medical In-Vitro Diagnostic (IVD) Systems Integration of HORIBA ABXrsquos Technology amp Marketing Know-How
Automotive Test Systems Emission Measurement Systems (EMS) Mechatronics Devices (MCT) Driving Control Systems (ITS) Engineering Consultancy amp Testing (ECT)
Business Segments
Process amp Environmental Environmental Systems Environmental Radiation Monitor Environmental Regulation amp Process Business
Semiconductor Mass Flow Controller In-situ Analysis Synergy among HORIBA HQ HORIBA STEC and HORIBA Jobin Yvonrsquos Technologies
Scientific Synergy of HORIBA and HORIBA Jobin Yvonrsquos Technologies Raman Grating and Fluorescence
copy 2017 HORIBA Ltd All rights reserved 49
Sales 1700 Billions of Yen
Business Composition of Sales
Automotive Test Systems
Process amp Environmental
Medical
Semiconductor
Scientific
Automotive 622 (36)
Scientific 257 (15)
Semiconductor 388 (23)
Medical 265 (16)
PampE 167 (10)
Well Balanced Business Operation -Five Business Segments-
(Billions of Yen)
copy 2017 HORIBA Ltd All rights reserved 50
Market Shares
Market shares quoted are estimates by HORIBA
80 20 100
35
Emission Measurement Systems
57 30
Stack Gas Analyzers Automatic Blood Cell Counter plus CRP
Mass Flow Controllers Raman Spectrophotometers Gratings
Global Domestic
copy 2017 HORIBA Ltd All rights reserved 51
EU Japan
Asia Americas
33
26 18
23
Geographic Composition of Sales(2016)
HORIBA Worldwide
Sales of FY2016 1700 BJPY
The Number of Group Companies by region (As of December 31 2016)
America 9 Europe 23 Asia 17 (4 in Japan including HORIBA Ltd) Total 49
copy 2017 HORIBA Ltd All rights reserved 52
Japan 38
Other Asia 15
France 13
Germany 8
Other Europe 2 USA
10
Other Americas 3
7149
従業員数 2015年12月31日現在
2442
946
3761
UK 11
Employees by Region
Total Number of Employees (As of December 31 2016)
Total Asia 53
Total Europe 34
Total Americas 13
copy 2017 HORIBA Ltd All rights reserved 53 copy 2017 HORIBA Ltd All rights reserved 53
copy 2017 HORIBA Ltd All rights reserved 54
Danke
Grazie
Σας ευχαριστούμε
감사합니다
Obrigado
谢谢
ขอบคณครบ
ありがとうございました
धनयवाद
நனற
Cảm ơn
Dziękuję
Tack ska ni ha
Thank you
Merci
Gracias
Большое спасибо
スライド番号 1
Contents
Contents
スライド番号 4
Summary of 2016 Results
2016 full year results
2016 Results by Segment
Contents
2017 Market outlook
Exchange rate forecast for 2017
Forecast for 2017
Forecast for 2017 by segment
Contents
スライド番号 14
2016 Results and 2017 Forecast
Strategy for improving profitability
Regulatory trend in EMS (Emission Measurement System) and Operations in an emerging Market
ECT (HORIBA MIRA) Business
2016 Results and 2017 Forecast
Analysis technology for the environment
2016 Results and 2017 Forecast
Growth with New Brand and Service
2016 Results and 2017 Forecast
スライド番号 24
2016 Results and 2017 Forecast
Exploit new markets using HORIBA technology
Contents
Shareholder Return
Contents
スライド番号 30
スライド番号 31
スライド番号 32
Accelerate growth in water measuring business
Water measuring and analysisbusiness domain
Water measuring and analysisbusiness domain
Selected as one of New Diversity Management Selection 100 (by the Ministry of Economy Trade and Industry of Japan)
Enhance asset efficiency and maximize corporate value
Symbol of MLMAP2020
Contents
Trend of Market capitalization
Changed the accounting policy for revenue recognition
スライド番号 42
スライド番号 43
スライド番号 44
スライド番号 45
Contents
スライド番号 47
Business Segments
スライド番号 49
Market Shares
スライド番号 51
スライド番号 52
スライド番号 53
スライド番号 54
勘定科目
BS_CL12010
BS_CL12020
BS_CL12030
BS_FL21000
BS_FL23000
勘定科目名称
当座借越
短期借入金
1年内返済長期借入金
社債
長期借入金
HOR
0
(2000000000)
0
(10000000000)
0
日本 ニホン
ABX
(827350776)
(4016672108)
(534035942)
0
(1343663409)
欧州 オウシュウ
ASEC
0
(352000000)
0
0
(180000000)
日本 ニホン
HE
0
(1855530779)
0
0
0
欧州 オウシュウ
HIC
0
(1156081000)
(109236000)
0
(682725000)
米州 ベイシュウ
HIT
(99662290)
0
(200000000)
0
(300000000)
日本 ニホン
HSC
0
(20019305)
0
0
0
アジア
HST
0
(166375000)
0
0
0
アジア
JY
0
0
(9753688)
0
(105723687)
欧州 オウシュウ
会社間照合
0
(5047)
欧州 オウシュウ
会社間照合
200000000
日本 ニホン
会社間照合
480000000
日本 ニホン
会社間照合
2000000000
日本 ニホン
会社間照合
118647000
欧州 オウシュウ
会社間照合
175953553
欧州 オウシュウ
連結合計
(927013066)
(7272082686)
(653025630)
(10000000000)
(2132112096)
(99662290)
(352000000)
0
(10000000000)
0
日本 ニホン
(827350776)
(5577607381)
(543789630)
0
(1449387096)
欧州 オウシュウ
0
(1156081000)
(109236000)
0
(682725000)
米州 ベイシュウ
0
(186394305)
0
0
0
アジア
(927013066)
(7272082686)
(653025630)
(10000000000)
(2132112096)
2008
2009
2010
2011
2012
2013
2008
2008
2009
2009
2013
2013
2014
2014
2015
2015
2016
2016
短期借入金 タンキカリイレキン
8852
6618
5575
6684
5523
6606
現預金 ゲンヨキン
18267
21520
49246
51109
47859
51900
長期借入金 チョウキカリイレキン
2132
1730
1195
1291
2113
2576
短期 タンキ
8852
6618
6606
10832
12800
12400
社債 シャサイ
10000
10000
10000
10000
10000
15000
長期 チョウキ
2132
1730
2576
2209
16800
19200
現預金 ゲンヨキン
18267
21520
26958
28893
34685
42228
社債 シャサイ
10000
10000
15000
15000
15000
15000
流動比率 リュウドウヒリツ
2296
2524
2653
2806
2970
2690
自己資本比率 ジコシホンヒリツ
576
609
612
624
650
600
49246
6606
2576
15000
51109
10832
2209
15000
47859
12800
16800
15000
51900
12400
19200
15000
Sheet1
Sheet1
現預金
短期
長期
社債
Sheet1 (2)
tajikaABX =gtHIL
tajikaSTEC=gtHOR
copy 2017 HORIBA Ltd All rights reserved 46
Contents
2016 Results
2017 Forecast
Business Segment Outline
Shareholder Return
MLMAP2020 [2016-2020]Progress Financial Data Corporate profile
copy 2017 HORIBA Ltd All rights reserved 47
Head office Kyoto Japan Founded 1945 Incorporated 1953 CEO Atsushi Horiba Fiscal year end December 31
Atsushi Horiba Chairman President amp CEO
- Corporate motto -
To have interest and pride in our work to enjoy our lives
Corporate Profile
copy 2017 HORIBA Ltd All rights reserved 48
Medical In-Vitro Diagnostic (IVD) Systems Integration of HORIBA ABXrsquos Technology amp Marketing Know-How
Automotive Test Systems Emission Measurement Systems (EMS) Mechatronics Devices (MCT) Driving Control Systems (ITS) Engineering Consultancy amp Testing (ECT)
Business Segments
Process amp Environmental Environmental Systems Environmental Radiation Monitor Environmental Regulation amp Process Business
Semiconductor Mass Flow Controller In-situ Analysis Synergy among HORIBA HQ HORIBA STEC and HORIBA Jobin Yvonrsquos Technologies
Scientific Synergy of HORIBA and HORIBA Jobin Yvonrsquos Technologies Raman Grating and Fluorescence
copy 2017 HORIBA Ltd All rights reserved 49
Sales 1700 Billions of Yen
Business Composition of Sales
Automotive Test Systems
Process amp Environmental
Medical
Semiconductor
Scientific
Automotive 622 (36)
Scientific 257 (15)
Semiconductor 388 (23)
Medical 265 (16)
PampE 167 (10)
Well Balanced Business Operation -Five Business Segments-
(Billions of Yen)
copy 2017 HORIBA Ltd All rights reserved 50
Market Shares
Market shares quoted are estimates by HORIBA
80 20 100
35
Emission Measurement Systems
57 30
Stack Gas Analyzers Automatic Blood Cell Counter plus CRP
Mass Flow Controllers Raman Spectrophotometers Gratings
Global Domestic
copy 2017 HORIBA Ltd All rights reserved 51
EU Japan
Asia Americas
33
26 18
23
Geographic Composition of Sales(2016)
HORIBA Worldwide
Sales of FY2016 1700 BJPY
The Number of Group Companies by region (As of December 31 2016)
America 9 Europe 23 Asia 17 (4 in Japan including HORIBA Ltd) Total 49
copy 2017 HORIBA Ltd All rights reserved 52
Japan 38
Other Asia 15
France 13
Germany 8
Other Europe 2 USA
10
Other Americas 3
7149
従業員数 2015年12月31日現在
2442
946
3761
UK 11
Employees by Region
Total Number of Employees (As of December 31 2016)
Total Asia 53
Total Europe 34
Total Americas 13
copy 2017 HORIBA Ltd All rights reserved 53 copy 2017 HORIBA Ltd All rights reserved 53
copy 2017 HORIBA Ltd All rights reserved 54
Danke
Grazie
Σας ευχαριστούμε
감사합니다
Obrigado
谢谢
ขอบคณครบ
ありがとうございました
धनयवाद
நனற
Cảm ơn
Dziękuję
Tack ska ni ha
Thank you
Merci
Gracias
Большое спасибо
スライド番号 1
Contents
Contents
スライド番号 4
Summary of 2016 Results
2016 full year results
2016 Results by Segment
Contents
2017 Market outlook
Exchange rate forecast for 2017
Forecast for 2017
Forecast for 2017 by segment
Contents
スライド番号 14
2016 Results and 2017 Forecast
Strategy for improving profitability
Regulatory trend in EMS (Emission Measurement System) and Operations in an emerging Market
ECT (HORIBA MIRA) Business
2016 Results and 2017 Forecast
Analysis technology for the environment
2016 Results and 2017 Forecast
Growth with New Brand and Service
2016 Results and 2017 Forecast
スライド番号 24
2016 Results and 2017 Forecast
Exploit new markets using HORIBA technology
Contents
Shareholder Return
Contents
スライド番号 30
スライド番号 31
スライド番号 32
Accelerate growth in water measuring business
Water measuring and analysisbusiness domain
Water measuring and analysisbusiness domain
Selected as one of New Diversity Management Selection 100 (by the Ministry of Economy Trade and Industry of Japan)
Enhance asset efficiency and maximize corporate value
Symbol of MLMAP2020
Contents
Trend of Market capitalization
Changed the accounting policy for revenue recognition
スライド番号 42
スライド番号 43
スライド番号 44
スライド番号 45
Contents
スライド番号 47
Business Segments
スライド番号 49
Market Shares
スライド番号 51
スライド番号 52
スライド番号 53
スライド番号 54
勘定科目
BS_CL12010
BS_CL12020
BS_CL12030
BS_FL21000
BS_FL23000
勘定科目名称
当座借越
短期借入金
1年内返済長期借入金
社債
長期借入金
HOR
0
(2000000000)
0
(10000000000)
0
日本 ニホン
ABX
(827350776)
(4016672108)
(534035942)
0
(1343663409)
欧州 オウシュウ
ASEC
0
(352000000)
0
0
(180000000)
日本 ニホン
HE
0
(1855530779)
0
0
0
欧州 オウシュウ
HIC
0
(1156081000)
(109236000)
0
(682725000)
米州 ベイシュウ
HIT
(99662290)
0
(200000000)
0
(300000000)
日本 ニホン
HSC
0
(20019305)
0
0
0
アジア
HST
0
(166375000)
0
0
0
アジア
JY
0
0
(9753688)
0
(105723687)
欧州 オウシュウ
会社間照合
0
(5047)
欧州 オウシュウ
会社間照合
200000000
日本 ニホン
会社間照合
480000000
日本 ニホン
会社間照合
2000000000
日本 ニホン
会社間照合
118647000
欧州 オウシュウ
会社間照合
175953553
欧州 オウシュウ
連結合計
(927013066)
(7272082686)
(653025630)
(10000000000)
(2132112096)
(99662290)
(352000000)
0
(10000000000)
0
日本 ニホン
(827350776)
(5577607381)
(543789630)
0
(1449387096)
欧州 オウシュウ
0
(1156081000)
(109236000)
0
(682725000)
米州 ベイシュウ
0
(186394305)
0
0
0
アジア
(927013066)
(7272082686)
(653025630)
(10000000000)
(2132112096)
2008
2009
2010
2011
2012
2013
2008
2008
2009
2009
2013
2013
2014
2014
2015
2015
2016
2016
短期借入金 タンキカリイレキン
8852
6618
5575
6684
5523
6606
現預金 ゲンヨキン
18267
21520
49246
51109
47859
51900
長期借入金 チョウキカリイレキン
2132
1730
1195
1291
2113
2576
短期 タンキ
8852
6618
6606
10832
12800
12400
社債 シャサイ
10000
10000
10000
10000
10000
15000
長期 チョウキ
2132
1730
2576
2209
16800
19200
現預金 ゲンヨキン
18267
21520
26958
28893
34685
42228
社債 シャサイ
10000
10000
15000
15000
15000
15000
流動比率 リュウドウヒリツ
2296
2524
2653
2806
2970
2690
自己資本比率 ジコシホンヒリツ
576
609
612
624
650
600
Sheet1
現預金
短期
長期
社債
Sheet1 (2)
tajikaABX =gtHIL
tajikaSTEC=gtHOR
copy 2017 HORIBA Ltd All rights reserved 46
Contents
2016 Results
2017 Forecast
Business Segment Outline
Shareholder Return
MLMAP2020 [2016-2020]Progress Financial Data Corporate profile
copy 2017 HORIBA Ltd All rights reserved 47
Head office Kyoto Japan Founded 1945 Incorporated 1953 CEO Atsushi Horiba Fiscal year end December 31
Atsushi Horiba Chairman President amp CEO
- Corporate motto -
To have interest and pride in our work to enjoy our lives
Corporate Profile
copy 2017 HORIBA Ltd All rights reserved 48
Medical In-Vitro Diagnostic (IVD) Systems Integration of HORIBA ABXrsquos Technology amp Marketing Know-How
Automotive Test Systems Emission Measurement Systems (EMS) Mechatronics Devices (MCT) Driving Control Systems (ITS) Engineering Consultancy amp Testing (ECT)
Business Segments
Process amp Environmental Environmental Systems Environmental Radiation Monitor Environmental Regulation amp Process Business
Semiconductor Mass Flow Controller In-situ Analysis Synergy among HORIBA HQ HORIBA STEC and HORIBA Jobin Yvonrsquos Technologies
Scientific Synergy of HORIBA and HORIBA Jobin Yvonrsquos Technologies Raman Grating and Fluorescence
copy 2017 HORIBA Ltd All rights reserved 49
Sales 1700 Billions of Yen
Business Composition of Sales
Automotive Test Systems
Process amp Environmental
Medical
Semiconductor
Scientific
Automotive 622 (36)
Scientific 257 (15)
Semiconductor 388 (23)
Medical 265 (16)
PampE 167 (10)
Well Balanced Business Operation -Five Business Segments-
(Billions of Yen)
copy 2017 HORIBA Ltd All rights reserved 50
Market Shares
Market shares quoted are estimates by HORIBA
80 20 100
35
Emission Measurement Systems
57 30
Stack Gas Analyzers Automatic Blood Cell Counter plus CRP
Mass Flow Controllers Raman Spectrophotometers Gratings
Global Domestic
copy 2017 HORIBA Ltd All rights reserved 51
EU Japan
Asia Americas
33
26 18
23
Geographic Composition of Sales(2016)
HORIBA Worldwide
Sales of FY2016 1700 BJPY
The Number of Group Companies by region (As of December 31 2016)
America 9 Europe 23 Asia 17 (4 in Japan including HORIBA Ltd) Total 49
copy 2017 HORIBA Ltd All rights reserved 52
Japan 38
Other Asia 15
France 13
Germany 8
Other Europe 2 USA
10
Other Americas 3
7149
従業員数 2015年12月31日現在
2442
946
3761
UK 11
Employees by Region
Total Number of Employees (As of December 31 2016)
Total Asia 53
Total Europe 34
Total Americas 13
copy 2017 HORIBA Ltd All rights reserved 53 copy 2017 HORIBA Ltd All rights reserved 53
copy 2017 HORIBA Ltd All rights reserved 54
Danke
Grazie
Σας ευχαριστούμε
감사합니다
Obrigado
谢谢
ขอบคณครบ
ありがとうございました
धनयवाद
நனற
Cảm ơn
Dziękuję
Tack ska ni ha
Thank you
Merci
Gracias
Большое спасибо
スライド番号 1
Contents
Contents
スライド番号 4
Summary of 2016 Results
2016 full year results
2016 Results by Segment
Contents
2017 Market outlook
Exchange rate forecast for 2017
Forecast for 2017
Forecast for 2017 by segment
Contents
スライド番号 14
2016 Results and 2017 Forecast
Strategy for improving profitability
Regulatory trend in EMS (Emission Measurement System) and Operations in an emerging Market
ECT (HORIBA MIRA) Business
2016 Results and 2017 Forecast
Analysis technology for the environment
2016 Results and 2017 Forecast
Growth with New Brand and Service
2016 Results and 2017 Forecast
スライド番号 24
2016 Results and 2017 Forecast
Exploit new markets using HORIBA technology
Contents
Shareholder Return
Contents
スライド番号 30
スライド番号 31
スライド番号 32
Accelerate growth in water measuring business
Water measuring and analysisbusiness domain
Water measuring and analysisbusiness domain
Selected as one of New Diversity Management Selection 100 (by the Ministry of Economy Trade and Industry of Japan)
Enhance asset efficiency and maximize corporate value
Symbol of MLMAP2020
Contents
Trend of Market capitalization
Changed the accounting policy for revenue recognition
スライド番号 42
スライド番号 43
スライド番号 44
スライド番号 45
Contents
スライド番号 47
Business Segments
スライド番号 49
Market Shares
スライド番号 51
スライド番号 52
スライド番号 53
スライド番号 54
勘定科目
BS_CL12010
BS_CL12020
BS_CL12030
BS_FL21000
BS_FL23000
勘定科目名称
当座借越
短期借入金
1年内返済長期借入金
社債
長期借入金
HOR
0
(2000000000)
0
(10000000000)
0
日本 ニホン
ABX
(827350776)
(4016672108)
(534035942)
0
(1343663409)
欧州 オウシュウ
ASEC
0
(352000000)
0
0
(180000000)
日本 ニホン
HE
0
(1855530779)
0
0
0
欧州 オウシュウ
HIC
0
(1156081000)
(109236000)
0
(682725000)
米州 ベイシュウ
HIT
(99662290)
0
(200000000)
0
(300000000)
日本 ニホン
HSC
0
(20019305)
0
0
0
アジア
HST
0
(166375000)
0
0
0
アジア
JY
0
0
(9753688)
0
(105723687)
欧州 オウシュウ
会社間照合
0
(5047)
欧州 オウシュウ
会社間照合
200000000
日本 ニホン
会社間照合
480000000
日本 ニホン
会社間照合
2000000000
日本 ニホン
会社間照合
118647000
欧州 オウシュウ
会社間照合
175953553
欧州 オウシュウ
連結合計
(927013066)
(7272082686)
(653025630)
(10000000000)
(2132112096)
(99662290)
(352000000)
0
(10000000000)
0
日本 ニホン
(827350776)
(5577607381)
(543789630)
0
(1449387096)
欧州 オウシュウ
0
(1156081000)
(109236000)
0
(682725000)
米州 ベイシュウ
0
(186394305)
0
0
0
アジア
(927013066)
(7272082686)
(653025630)
(10000000000)
(2132112096)
copy 2017 HORIBA Ltd All rights reserved 46
Contents
2016 Results
2017 Forecast
Business Segment Outline
Shareholder Return
MLMAP2020 [2016-2020]Progress Financial Data Corporate profile
copy 2017 HORIBA Ltd All rights reserved 47
Head office Kyoto Japan Founded 1945 Incorporated 1953 CEO Atsushi Horiba Fiscal year end December 31
Atsushi Horiba Chairman President amp CEO
- Corporate motto -
To have interest and pride in our work to enjoy our lives
Corporate Profile
copy 2017 HORIBA Ltd All rights reserved 48
Medical In-Vitro Diagnostic (IVD) Systems Integration of HORIBA ABXrsquos Technology amp Marketing Know-How
Automotive Test Systems Emission Measurement Systems (EMS) Mechatronics Devices (MCT) Driving Control Systems (ITS) Engineering Consultancy amp Testing (ECT)
Business Segments
Process amp Environmental Environmental Systems Environmental Radiation Monitor Environmental Regulation amp Process Business
Semiconductor Mass Flow Controller In-situ Analysis Synergy among HORIBA HQ HORIBA STEC and HORIBA Jobin Yvonrsquos Technologies
Scientific Synergy of HORIBA and HORIBA Jobin Yvonrsquos Technologies Raman Grating and Fluorescence
copy 2017 HORIBA Ltd All rights reserved 49
Sales 1700 Billions of Yen
Business Composition of Sales
Automotive Test Systems
Process amp Environmental
Medical
Semiconductor
Scientific
Automotive 622 (36)
Scientific 257 (15)
Semiconductor 388 (23)
Medical 265 (16)
PampE 167 (10)
Well Balanced Business Operation -Five Business Segments-
(Billions of Yen)
copy 2017 HORIBA Ltd All rights reserved 50
Market Shares
Market shares quoted are estimates by HORIBA
80 20 100
35
Emission Measurement Systems
57 30
Stack Gas Analyzers Automatic Blood Cell Counter plus CRP
Mass Flow Controllers Raman Spectrophotometers Gratings
Global Domestic
copy 2017 HORIBA Ltd All rights reserved 51
EU Japan
Asia Americas
33
26 18
23
Geographic Composition of Sales(2016)
HORIBA Worldwide
Sales of FY2016 1700 BJPY
The Number of Group Companies by region (As of December 31 2016)
America 9 Europe 23 Asia 17 (4 in Japan including HORIBA Ltd) Total 49
copy 2017 HORIBA Ltd All rights reserved 52
Japan 38
Other Asia 15
France 13
Germany 8
Other Europe 2 USA
10
Other Americas 3
7149
従業員数 2015年12月31日現在
2442
946
3761
UK 11
Employees by Region
Total Number of Employees (As of December 31 2016)
Total Asia 53
Total Europe 34
Total Americas 13
copy 2017 HORIBA Ltd All rights reserved 53 copy 2017 HORIBA Ltd All rights reserved 53
copy 2017 HORIBA Ltd All rights reserved 54
Danke
Grazie
Σας ευχαριστούμε
감사합니다
Obrigado
谢谢
ขอบคณครบ
ありがとうございました
धनयवाद
நனற
Cảm ơn
Dziękuję
Tack ska ni ha
Thank you
Merci
Gracias
Большое спасибо
スライド番号 1
Contents
Contents
スライド番号 4
Summary of 2016 Results
2016 full year results
2016 Results by Segment
Contents
2017 Market outlook
Exchange rate forecast for 2017
Forecast for 2017
Forecast for 2017 by segment
Contents
スライド番号 14
2016 Results and 2017 Forecast
Strategy for improving profitability
Regulatory trend in EMS (Emission Measurement System) and Operations in an emerging Market
ECT (HORIBA MIRA) Business
2016 Results and 2017 Forecast
Analysis technology for the environment
2016 Results and 2017 Forecast
Growth with New Brand and Service
2016 Results and 2017 Forecast
スライド番号 24
2016 Results and 2017 Forecast
Exploit new markets using HORIBA technology
Contents
Shareholder Return
Contents
スライド番号 30
スライド番号 31
スライド番号 32
Accelerate growth in water measuring business
Water measuring and analysisbusiness domain
Water measuring and analysisbusiness domain
Selected as one of New Diversity Management Selection 100 (by the Ministry of Economy Trade and Industry of Japan)
Enhance asset efficiency and maximize corporate value
Symbol of MLMAP2020
Contents
Trend of Market capitalization
Changed the accounting policy for revenue recognition
スライド番号 42
スライド番号 43
スライド番号 44
スライド番号 45
Contents
スライド番号 47
Business Segments
スライド番号 49
Market Shares
スライド番号 51
スライド番号 52
スライド番号 53
スライド番号 54
copy 2017 HORIBA Ltd All rights reserved 54
Danke
Grazie
Σας ευχαριστούμε
감사합니다
Obrigado
谢谢
ขอบคณครบ
ありがとうございました
धनयवाद
நனற
Cảm ơn
Dziękuję
Tack ska ni ha
Thank you
Merci
Gracias
Большое спасибо
スライド番号 1
Contents
Contents
スライド番号 4
Summary of 2016 Results
2016 full year results
2016 Results by Segment
Contents
2017 Market outlook
Exchange rate forecast for 2017
Forecast for 2017
Forecast for 2017 by segment
Contents
スライド番号 14
2016 Results and 2017 Forecast
Strategy for improving profitability
Regulatory trend in EMS (Emission Measurement System) and Operations in an emerging Market
ECT (HORIBA MIRA) Business
2016 Results and 2017 Forecast
Analysis technology for the environment
2016 Results and 2017 Forecast
Growth with New Brand and Service
2016 Results and 2017 Forecast
スライド番号 24
2016 Results and 2017 Forecast
Exploit new markets using HORIBA technology
Contents
Shareholder Return
Contents
スライド番号 30
スライド番号 31
スライド番号 32
Accelerate growth in water measuring business
Water measuring and analysisbusiness domain
Water measuring and analysisbusiness domain
Selected as one of New Diversity Management Selection 100 (by the Ministry of Economy Trade and Industry of Japan)
Enhance asset efficiency and maximize corporate value
Symbol of MLMAP2020
Contents
Trend of Market capitalization
Changed the accounting policy for revenue recognition
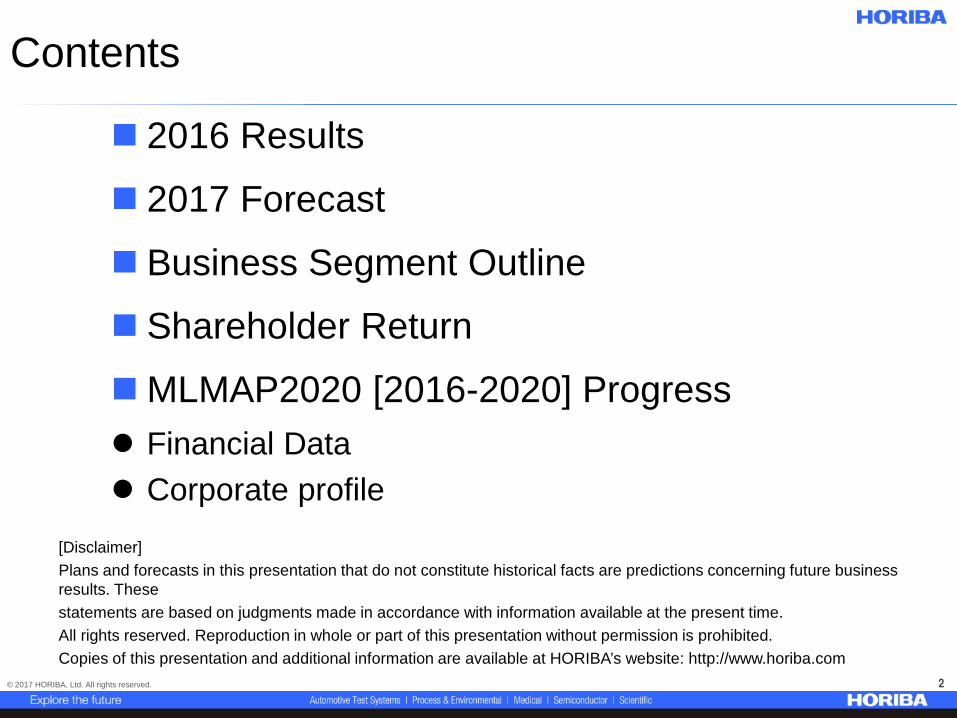
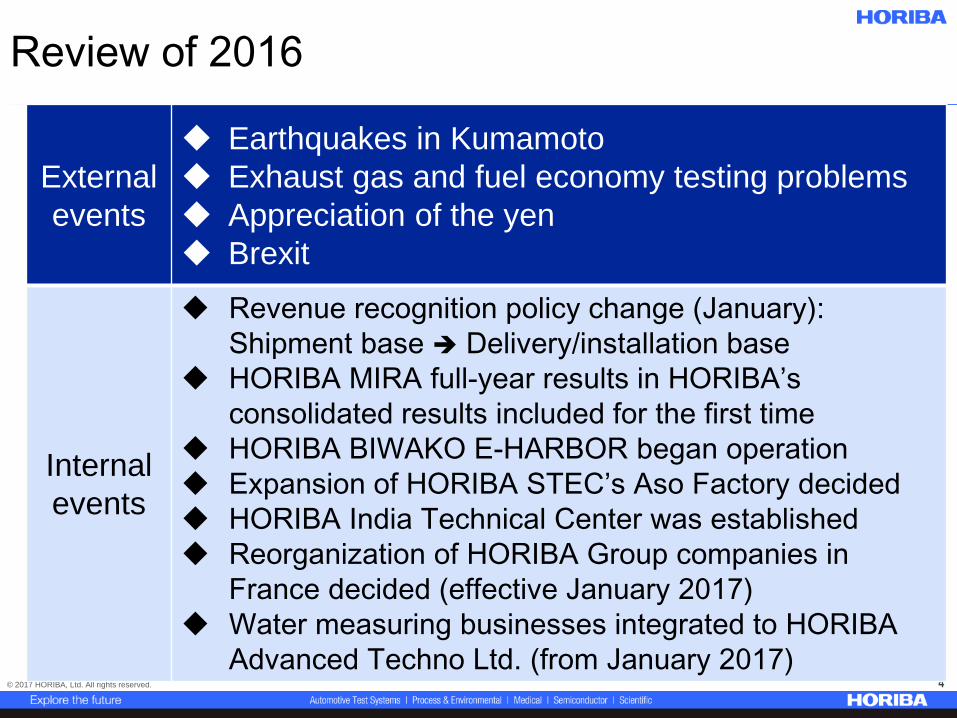
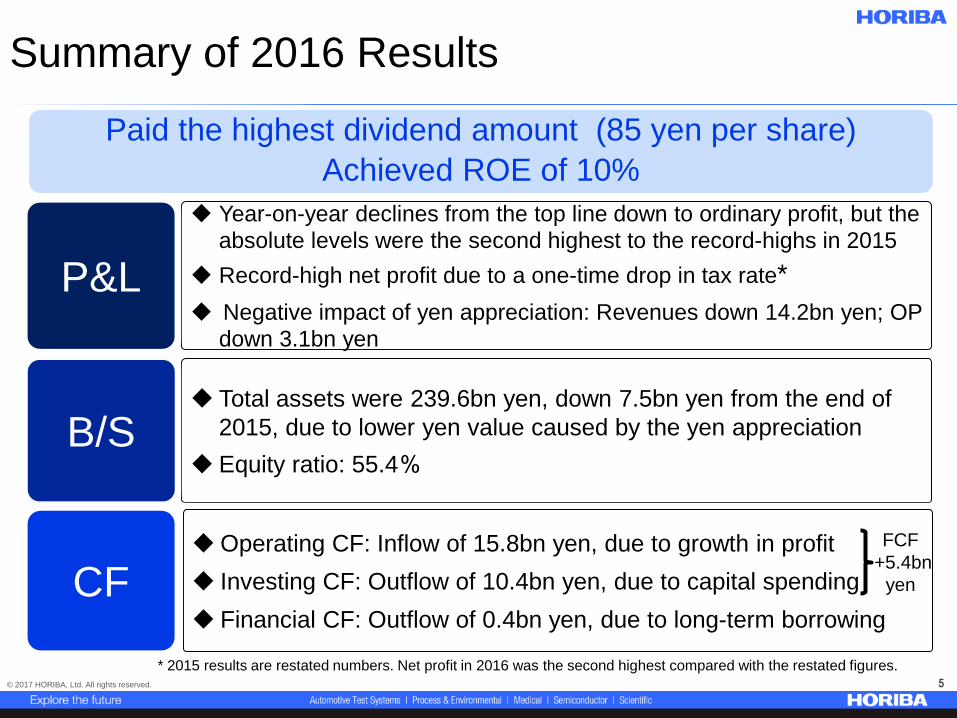
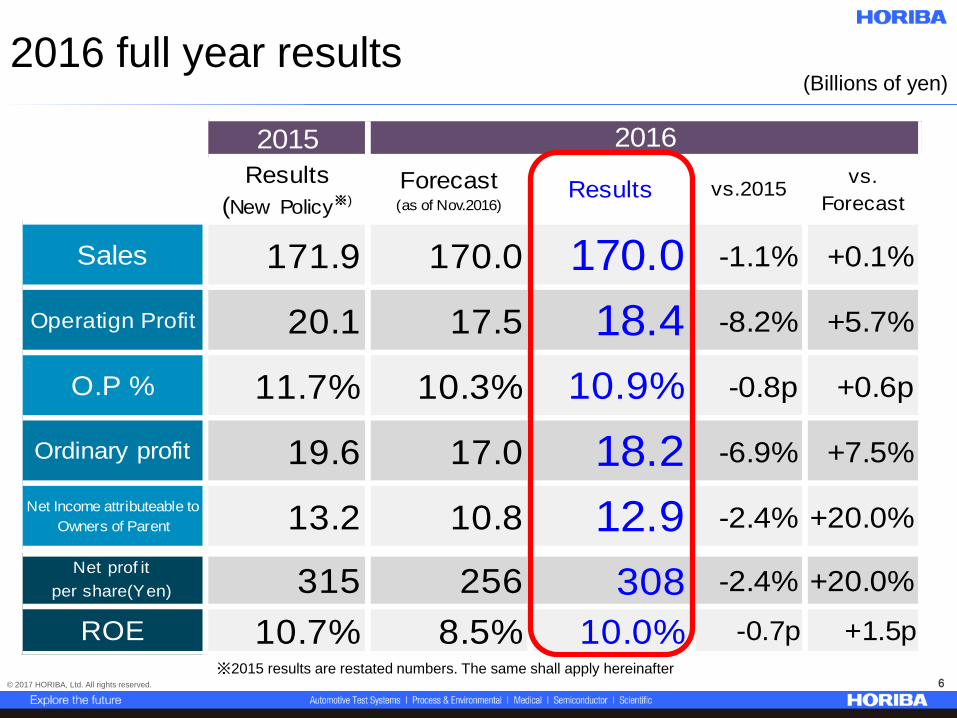
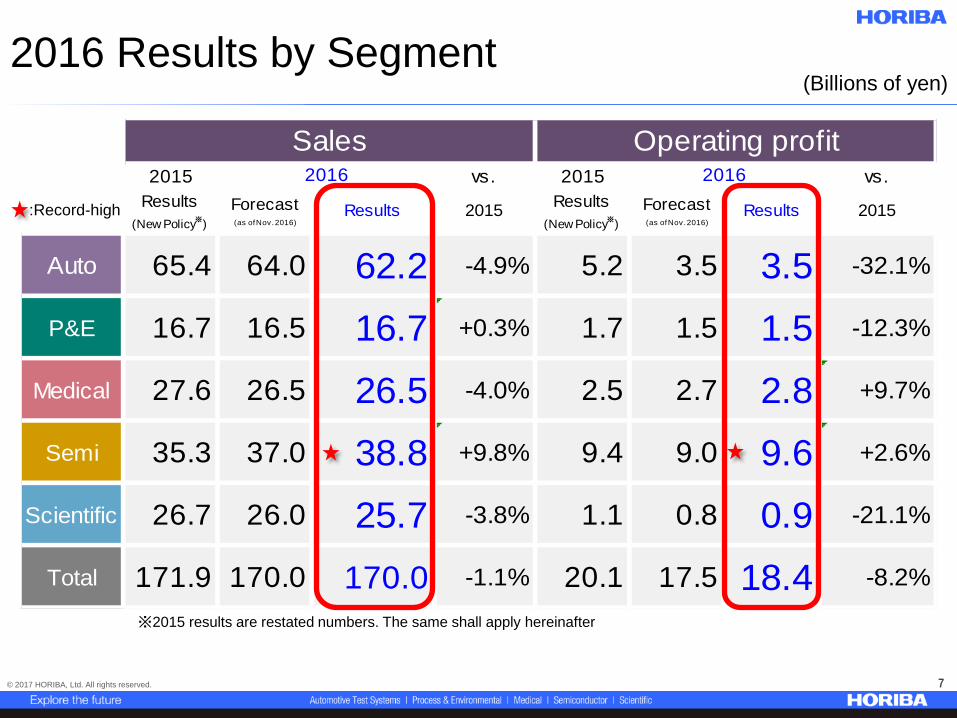
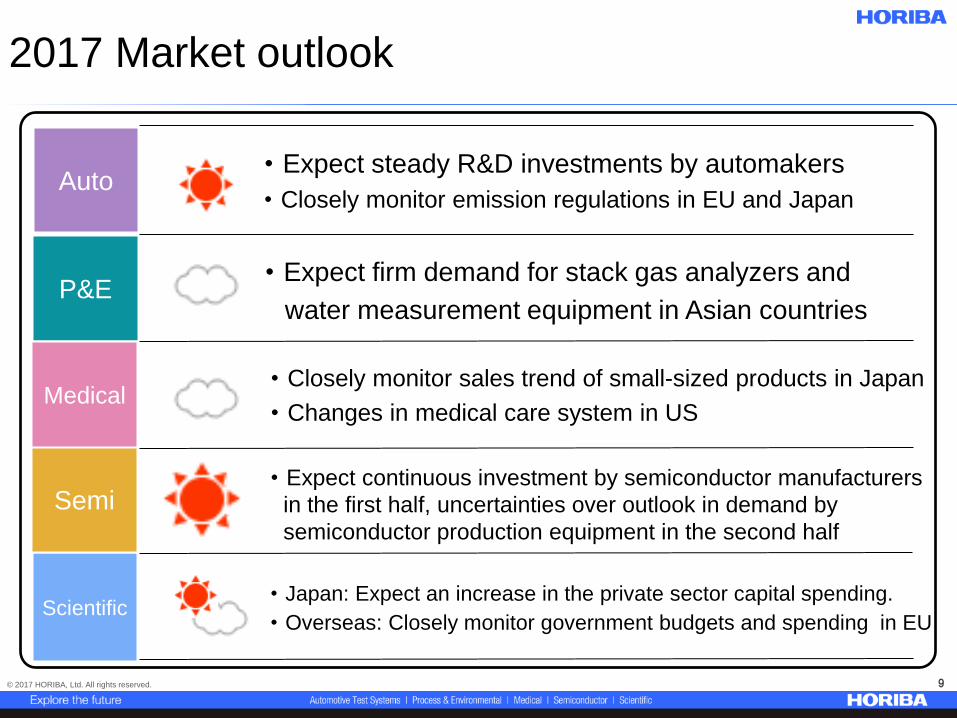
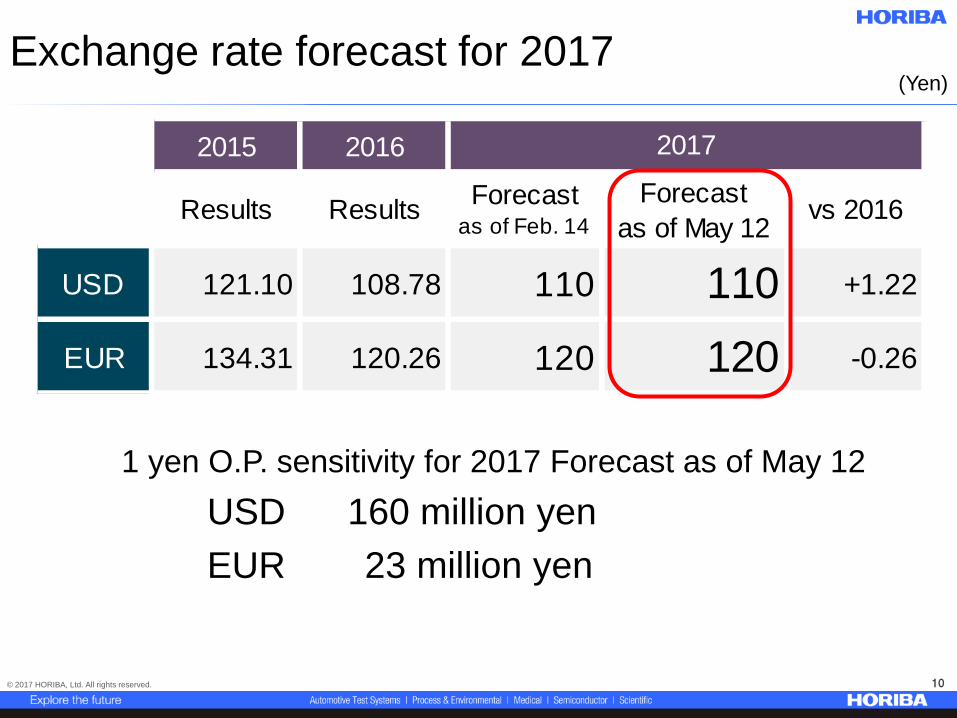
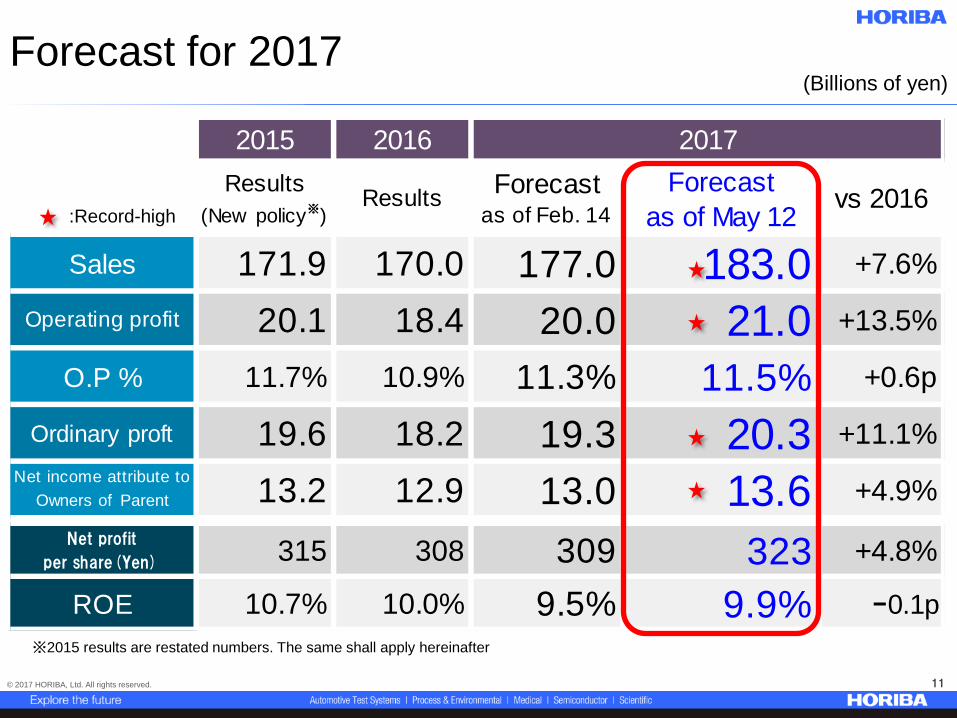
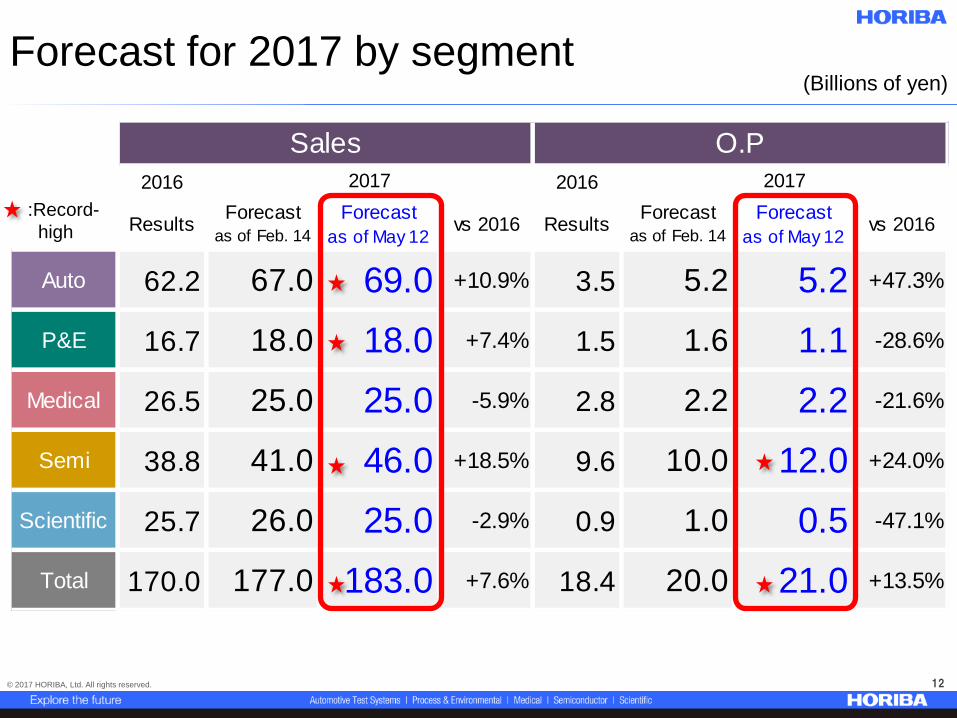

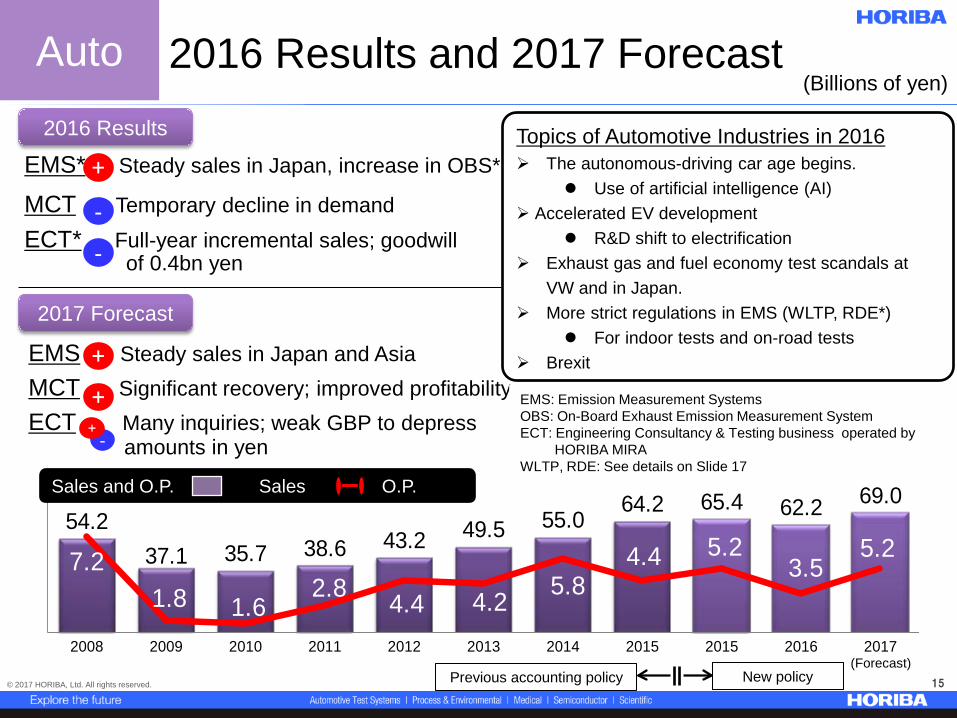
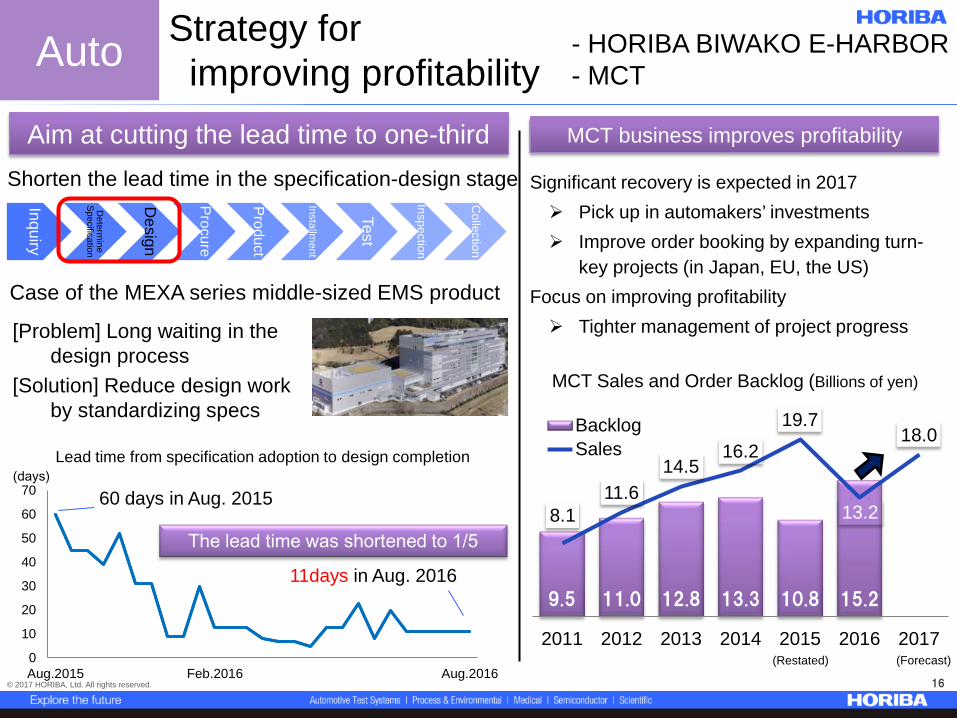
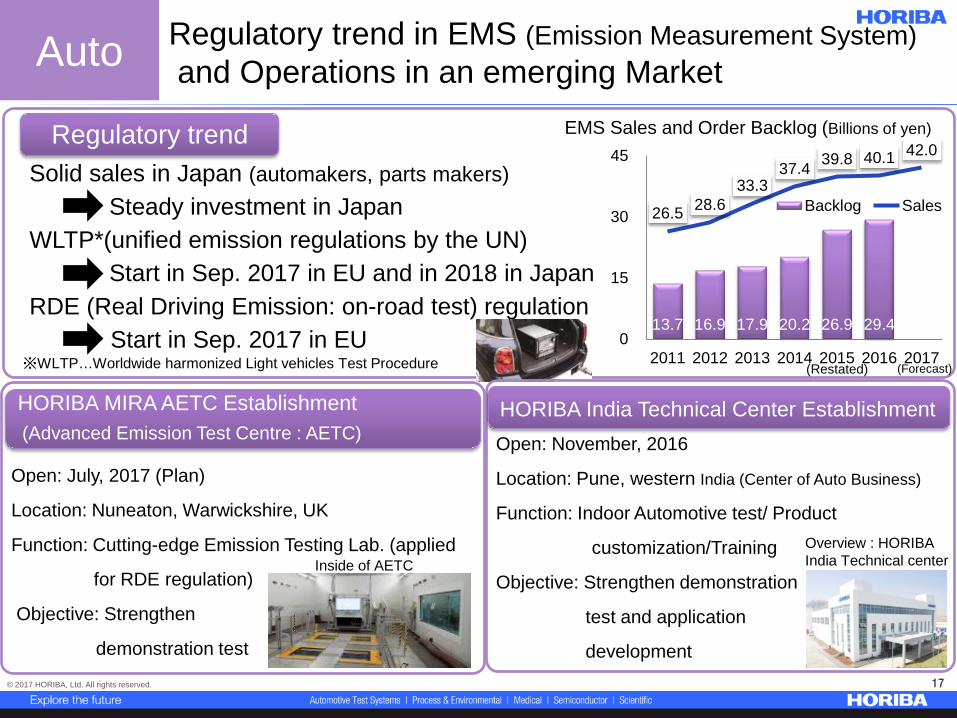
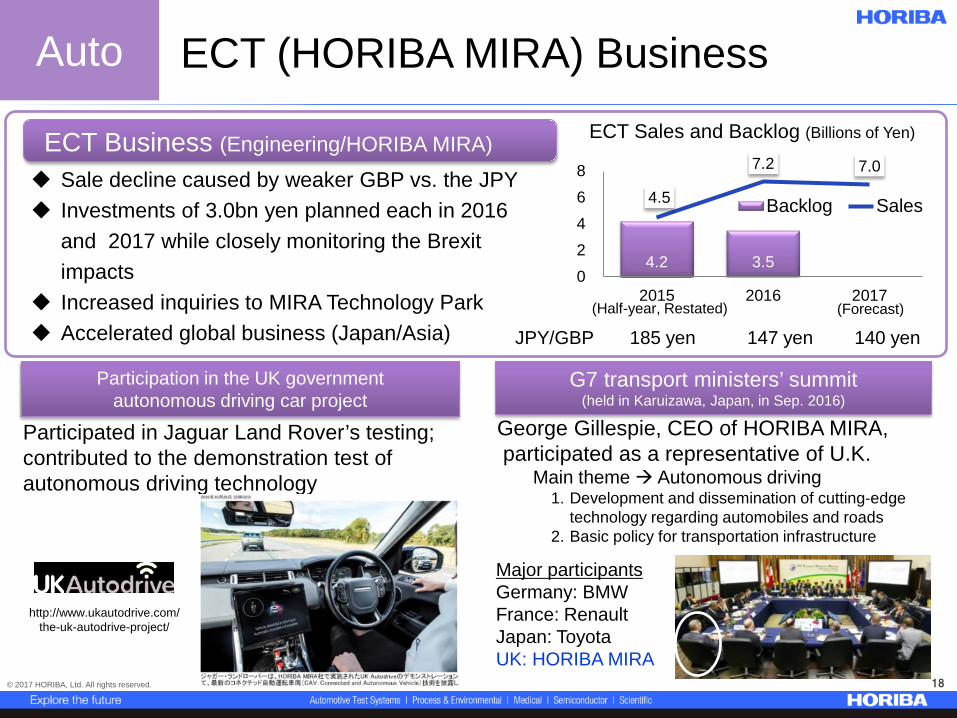
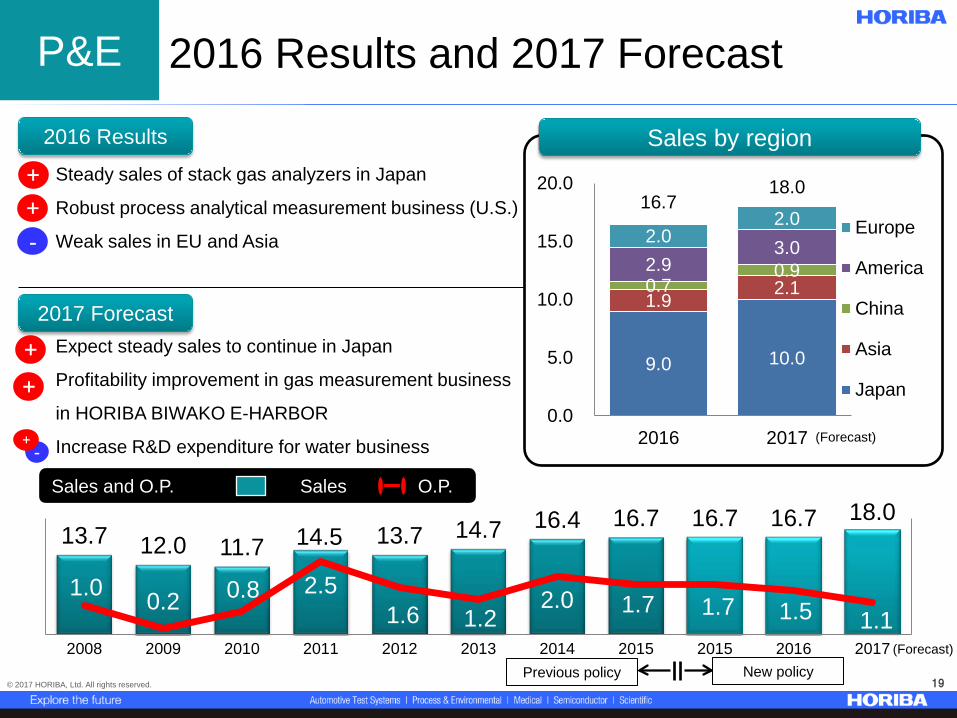
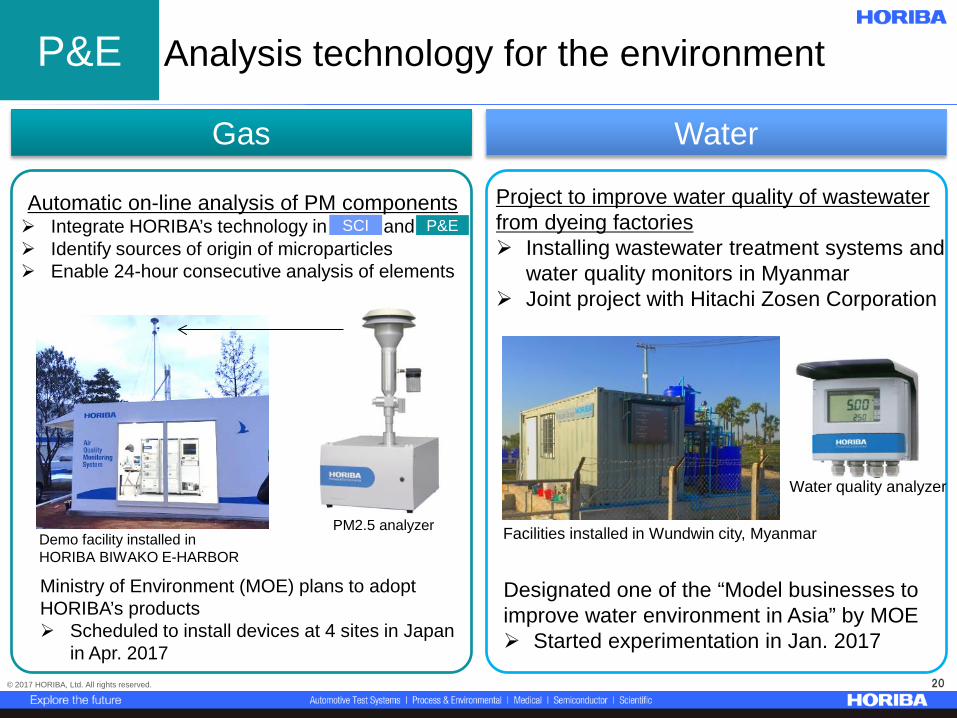
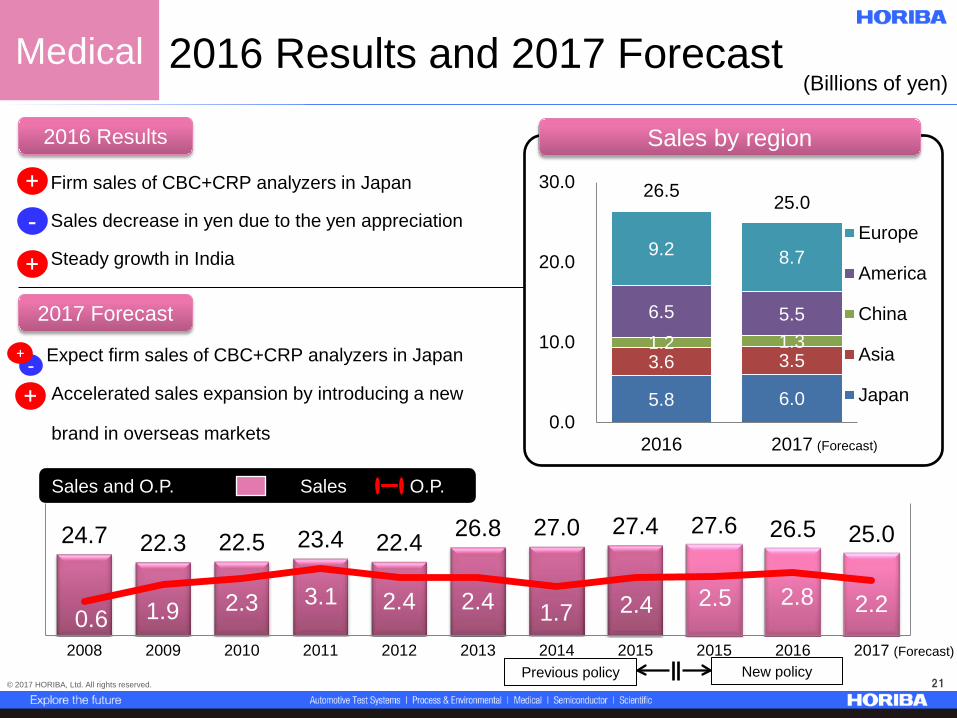
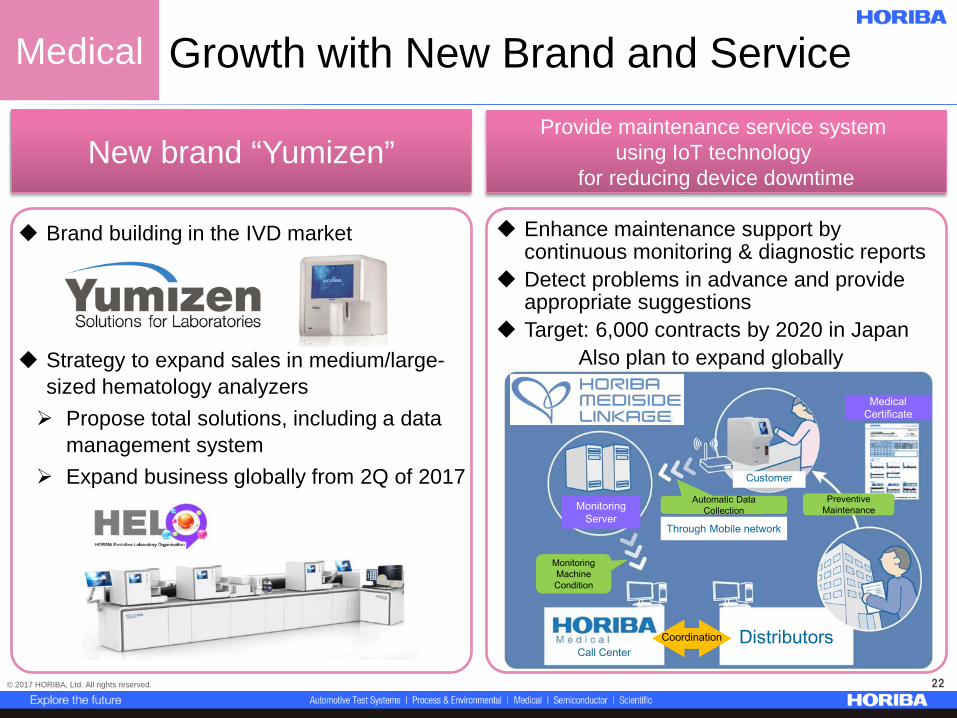
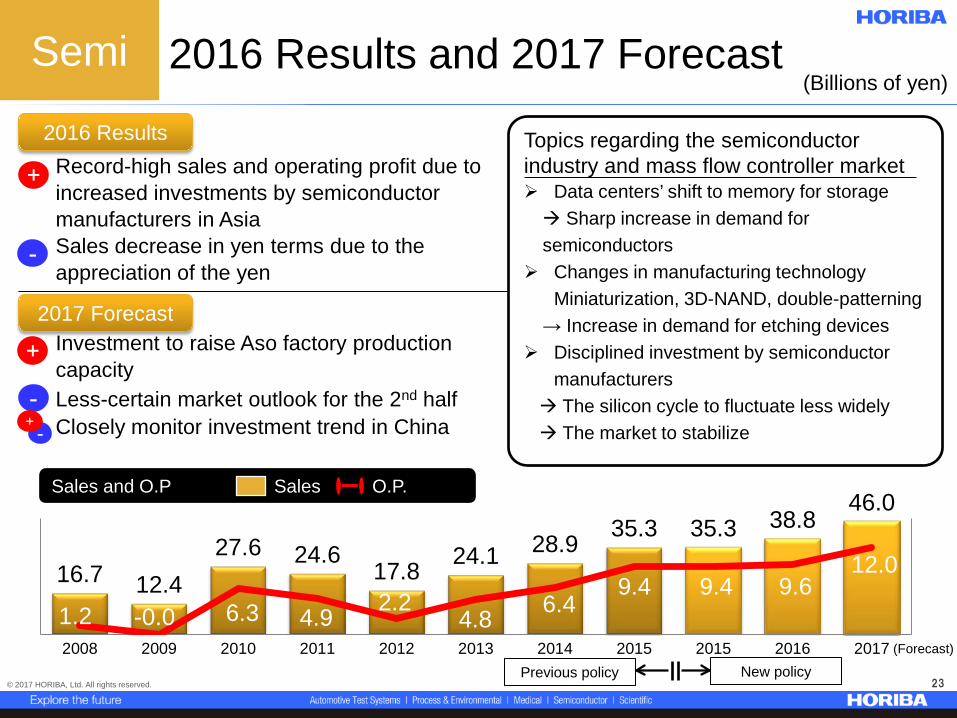
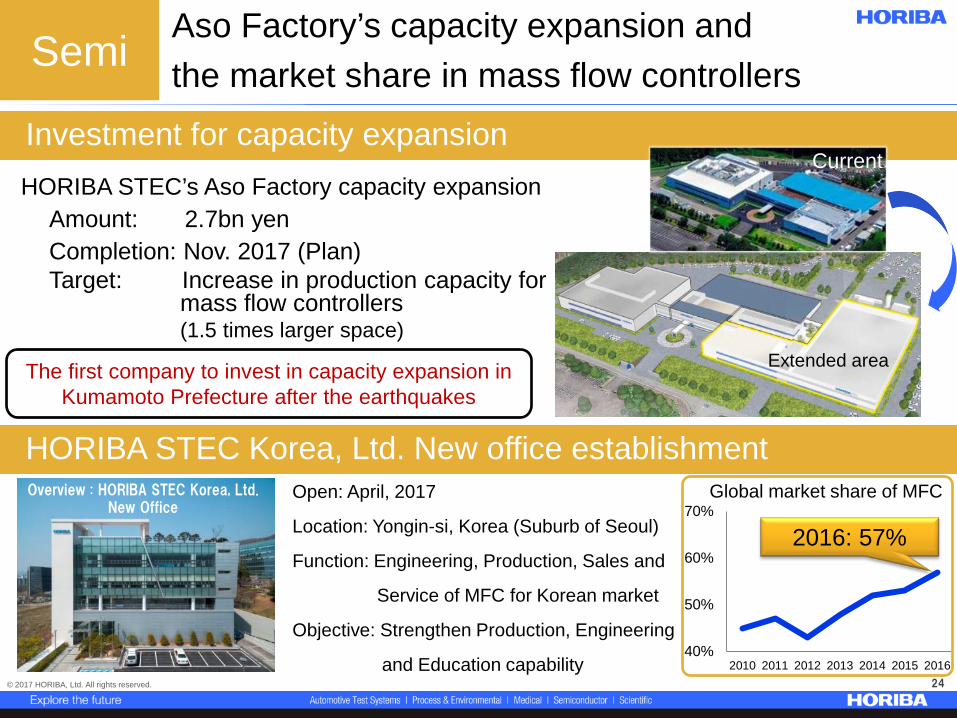
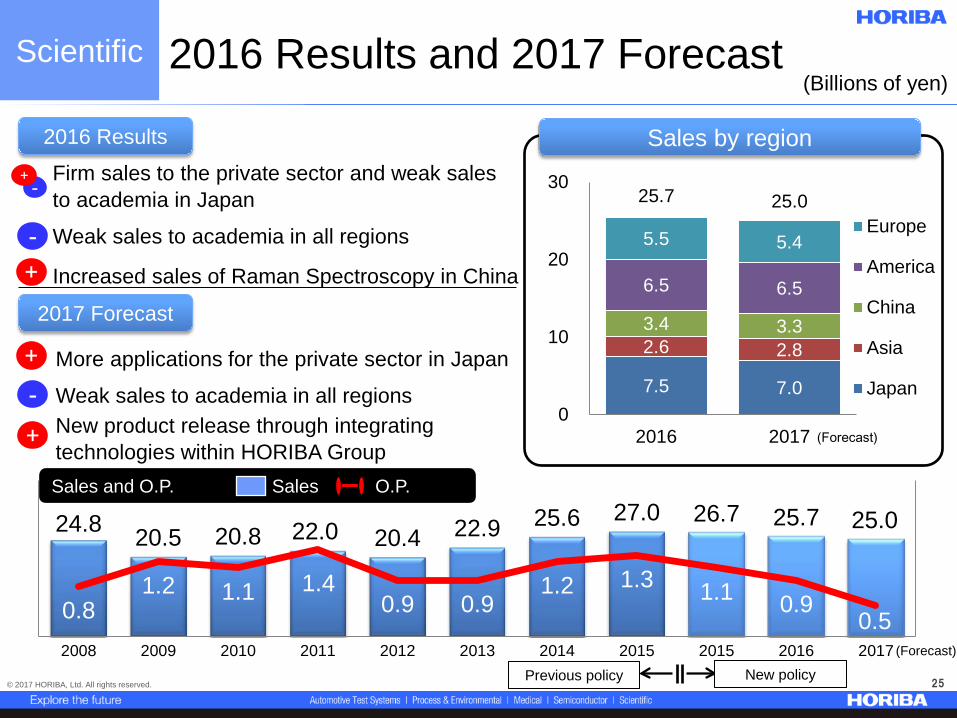
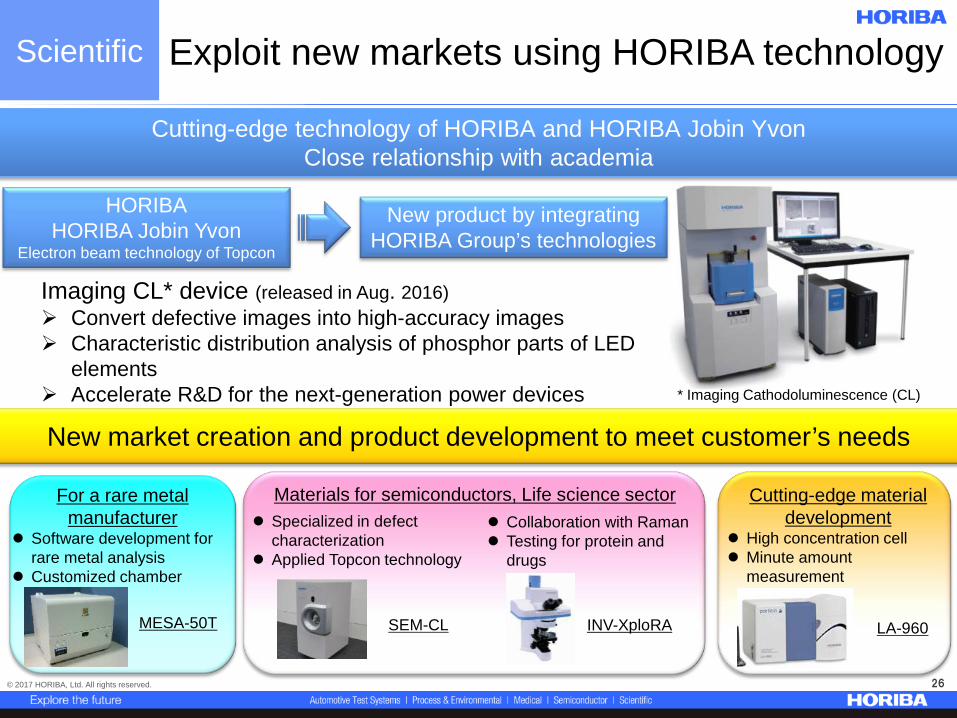
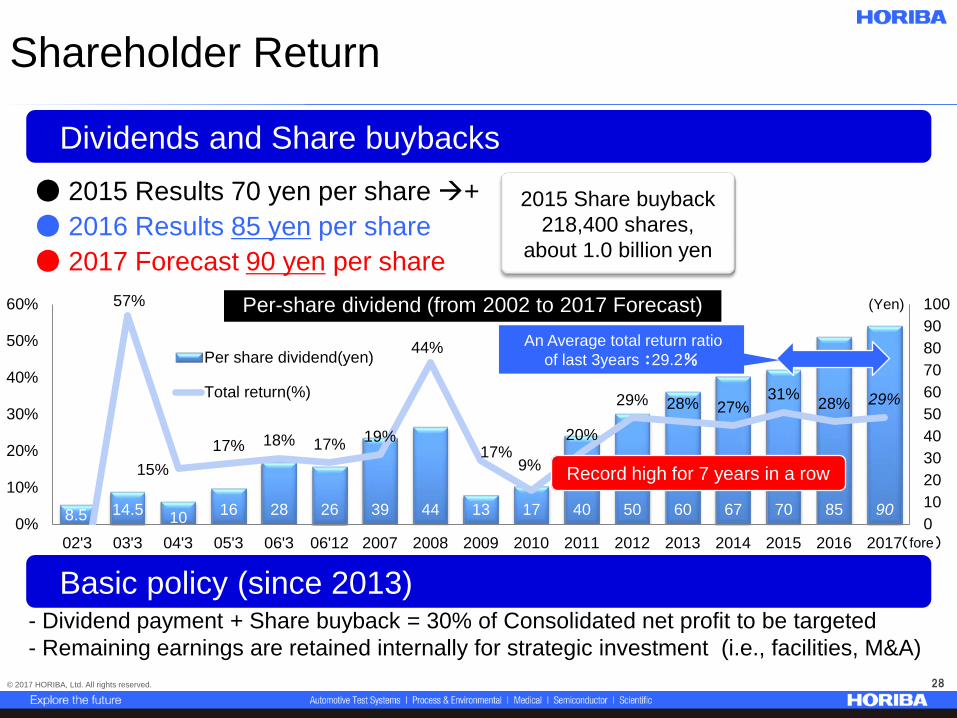
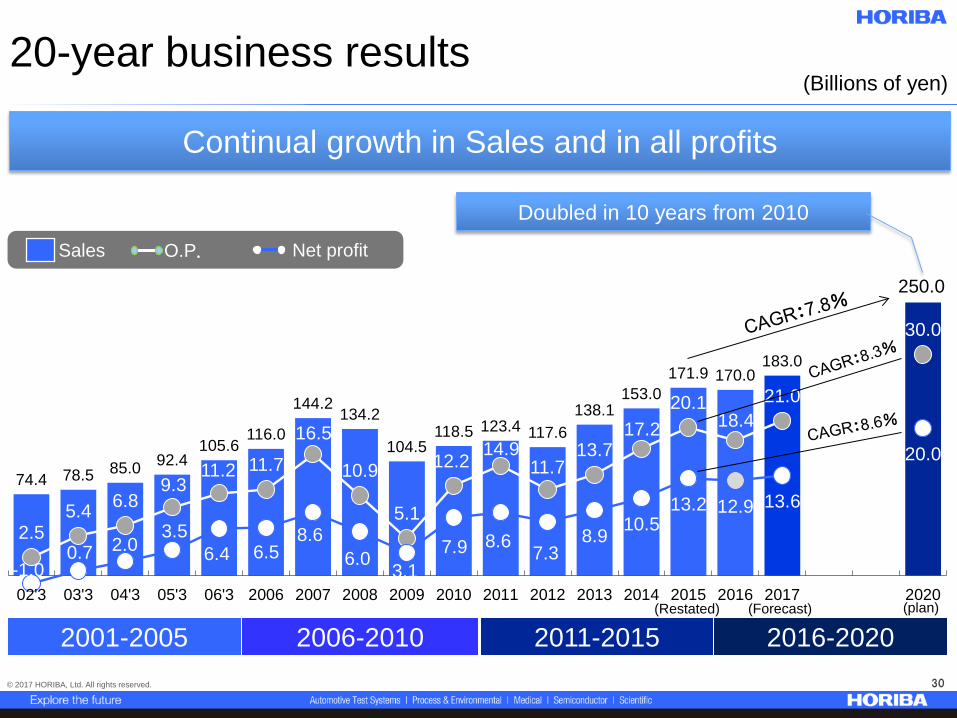

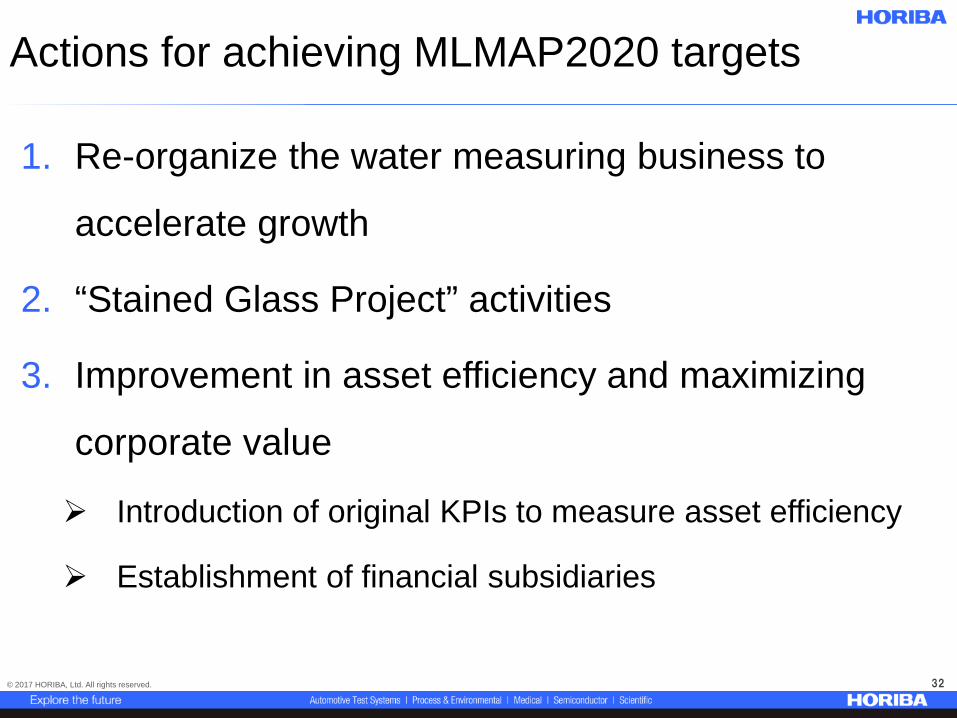
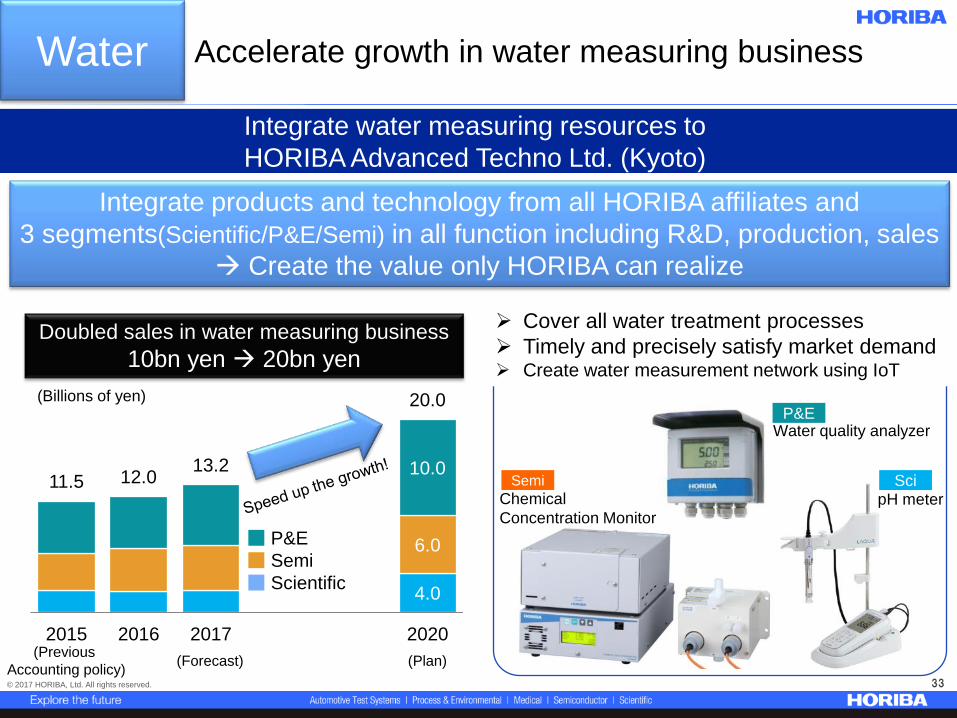
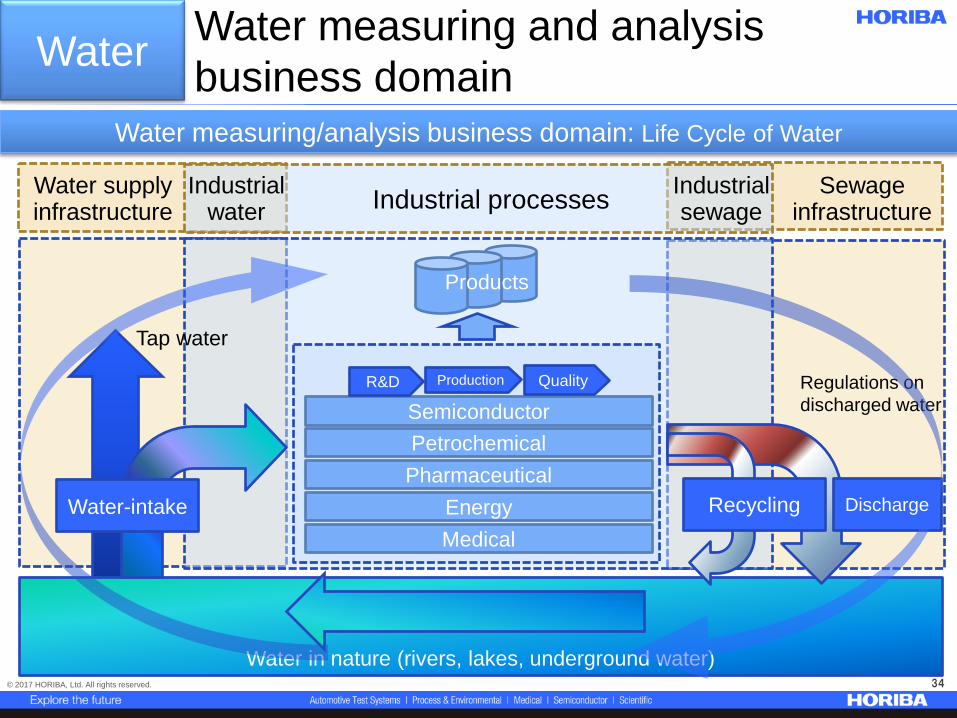
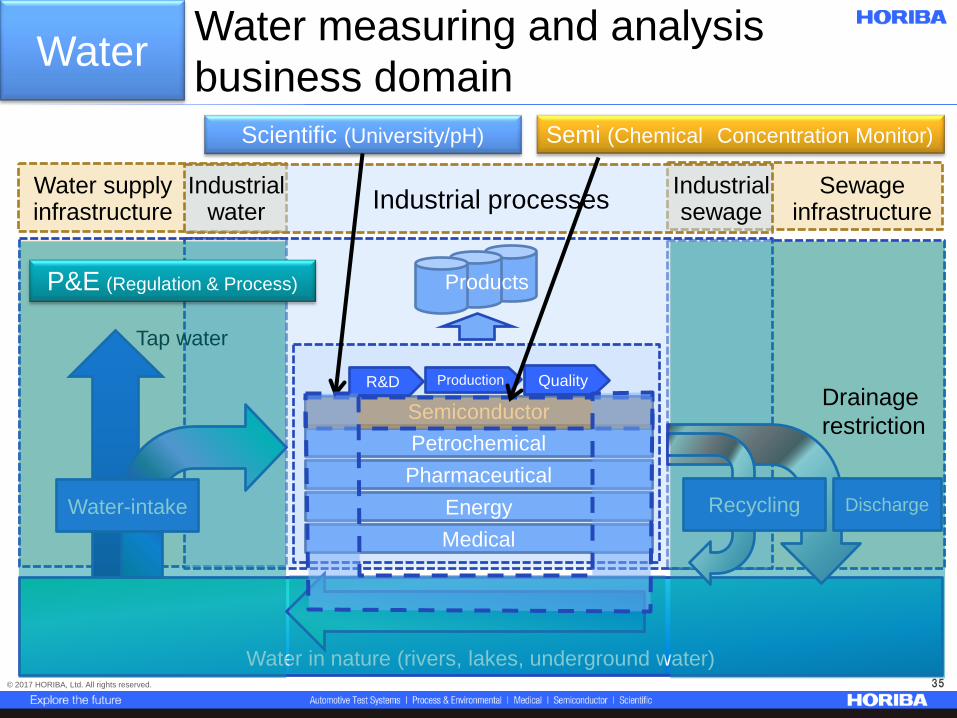
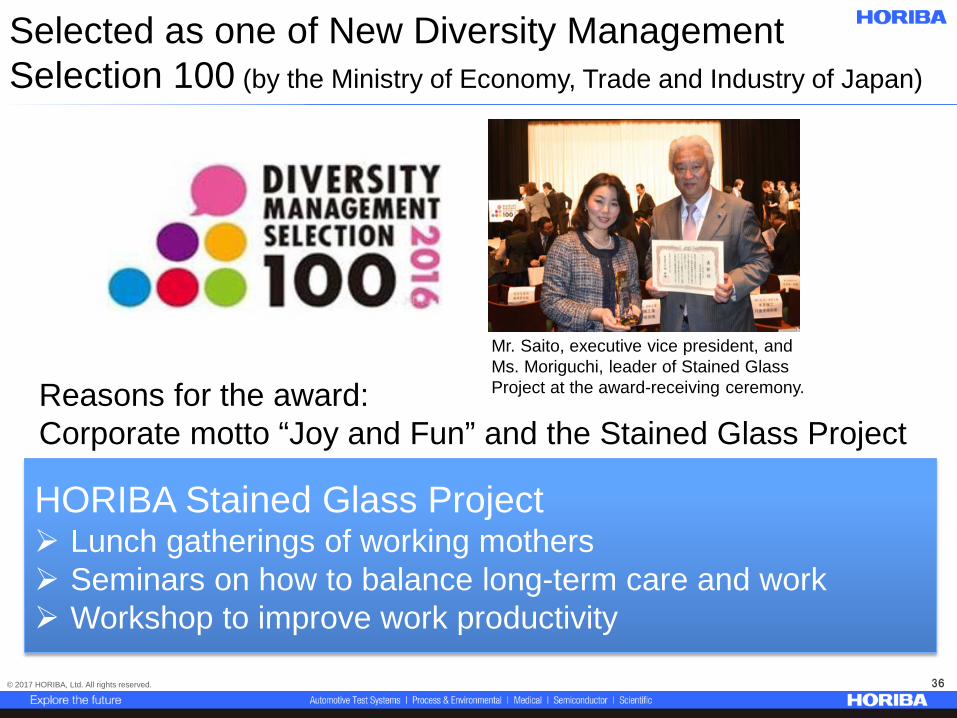
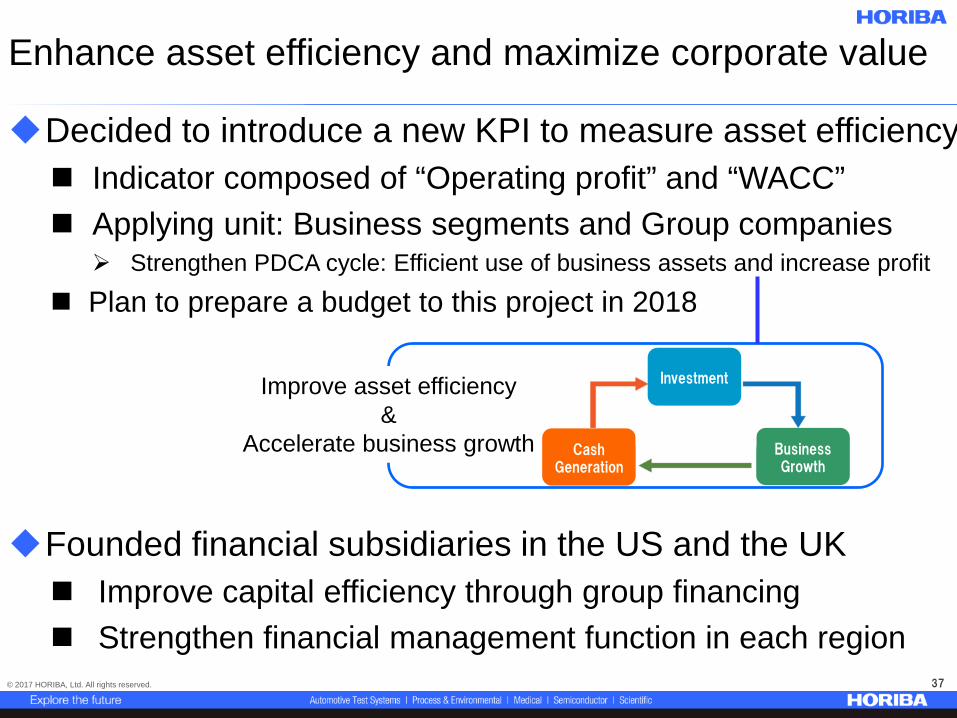
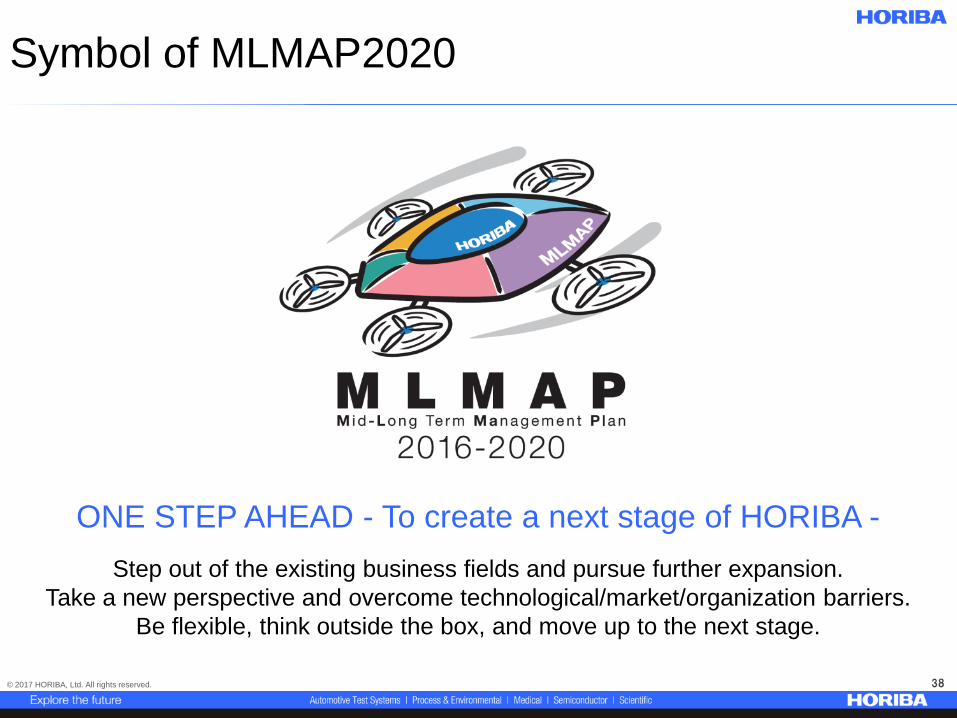
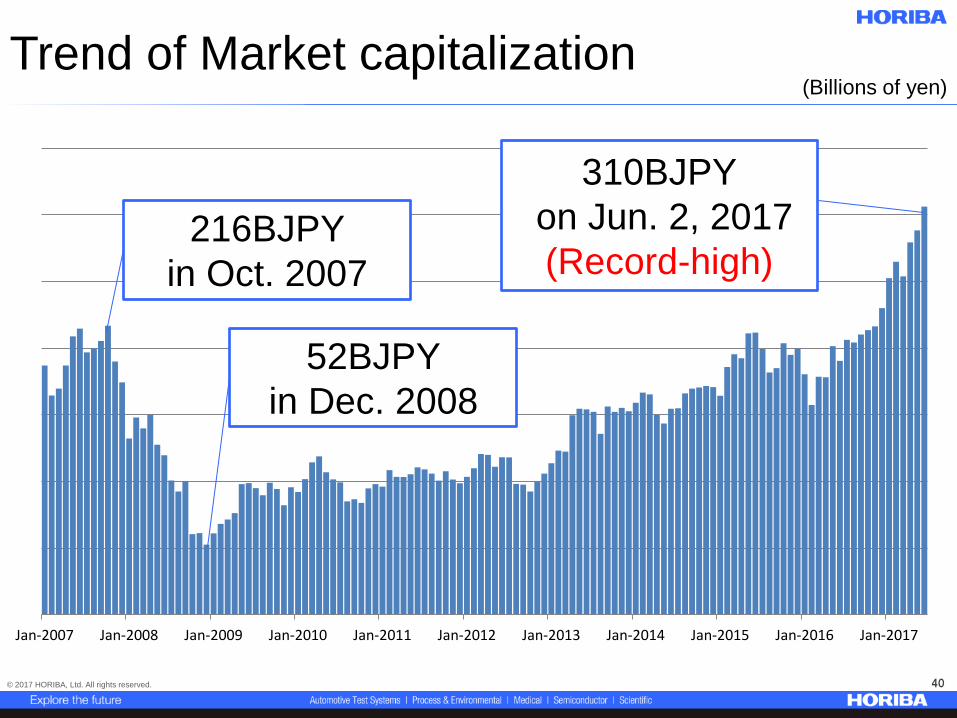
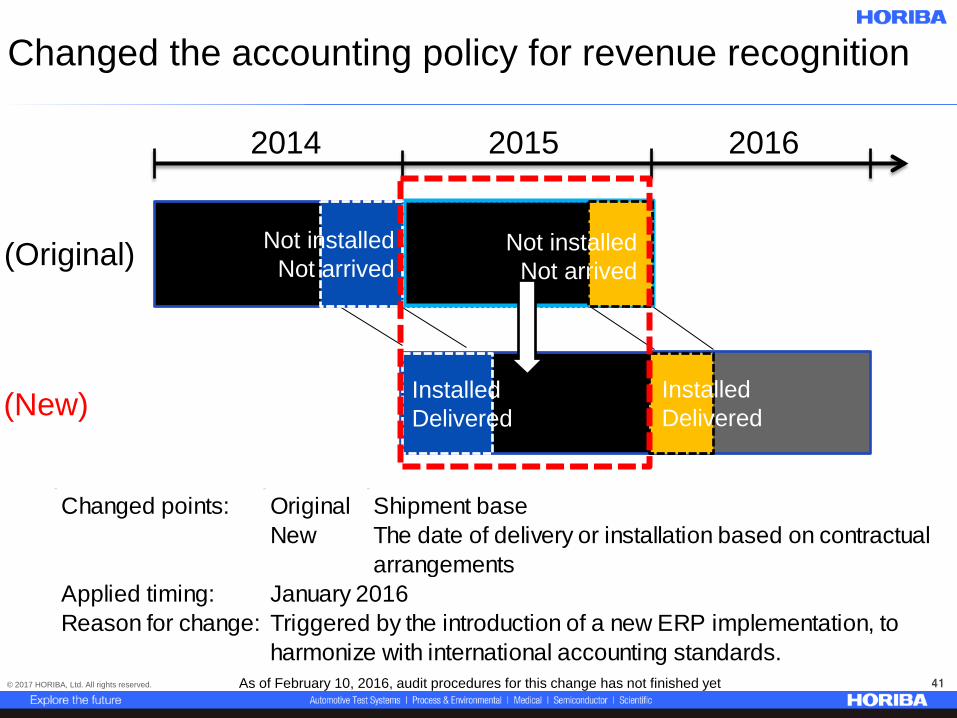
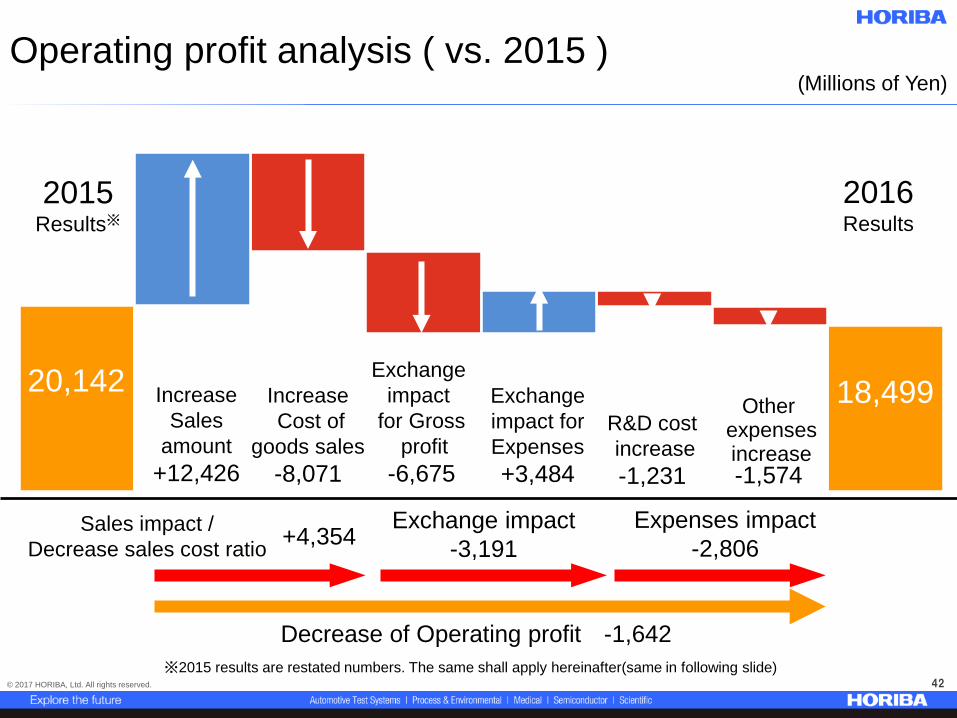
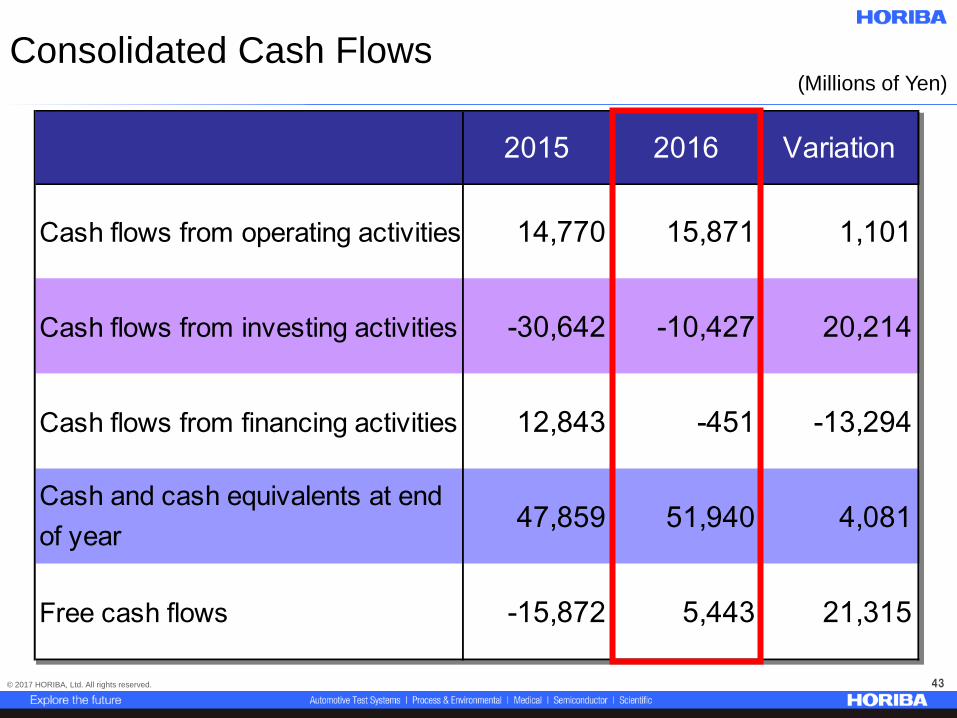
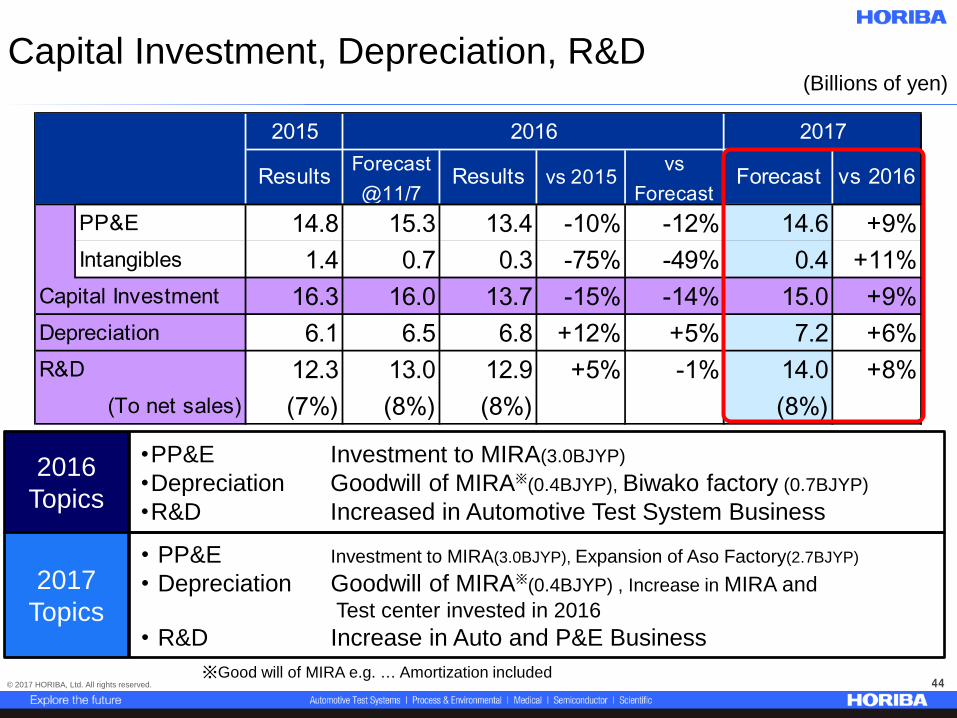
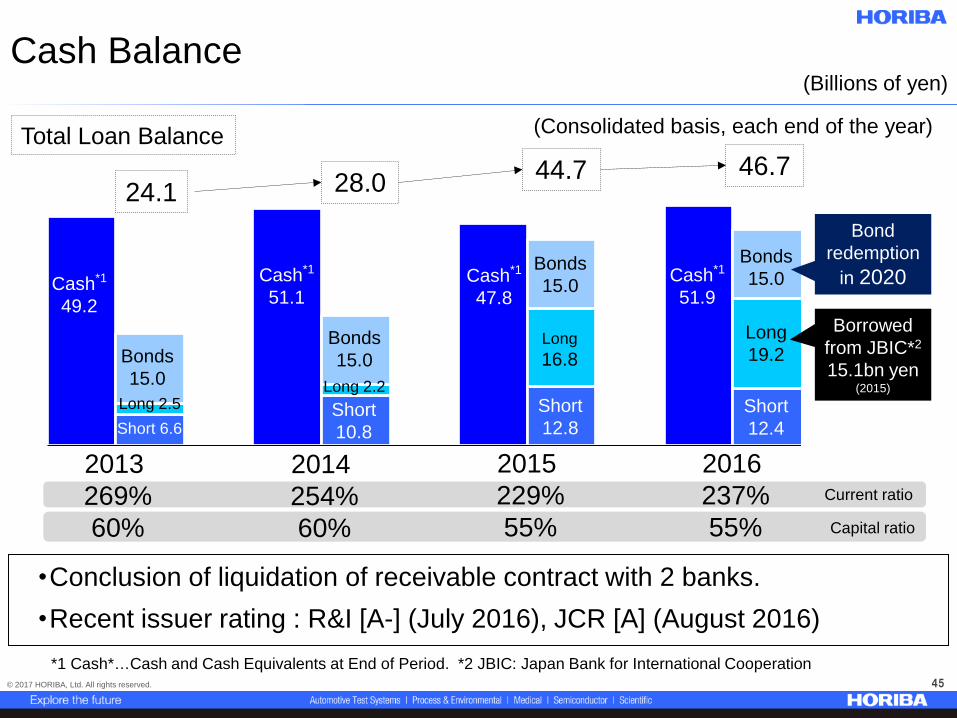
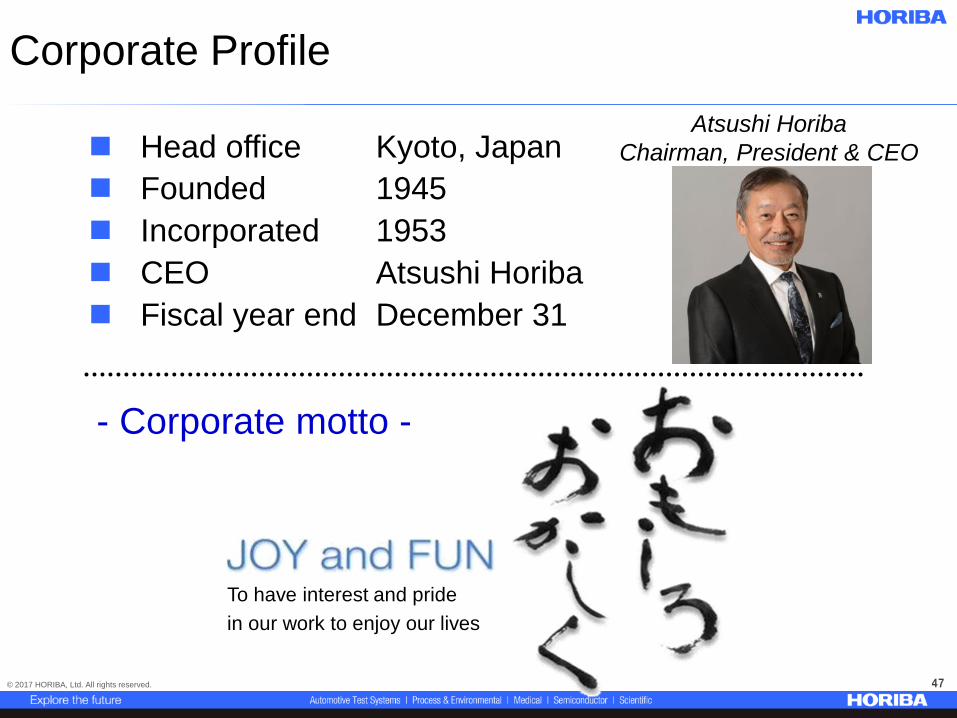
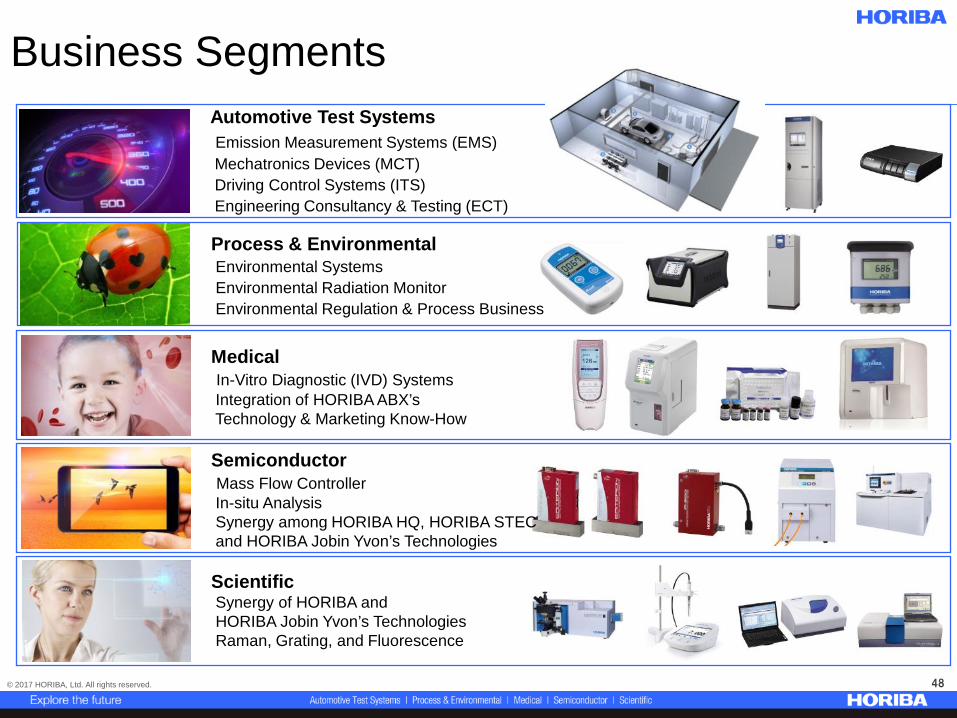
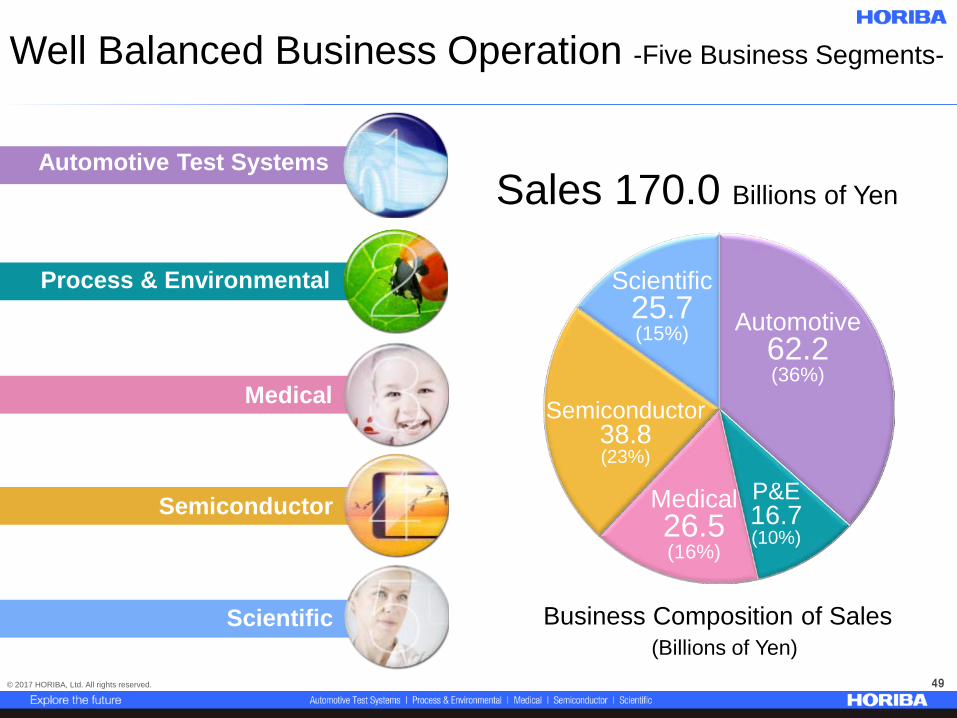
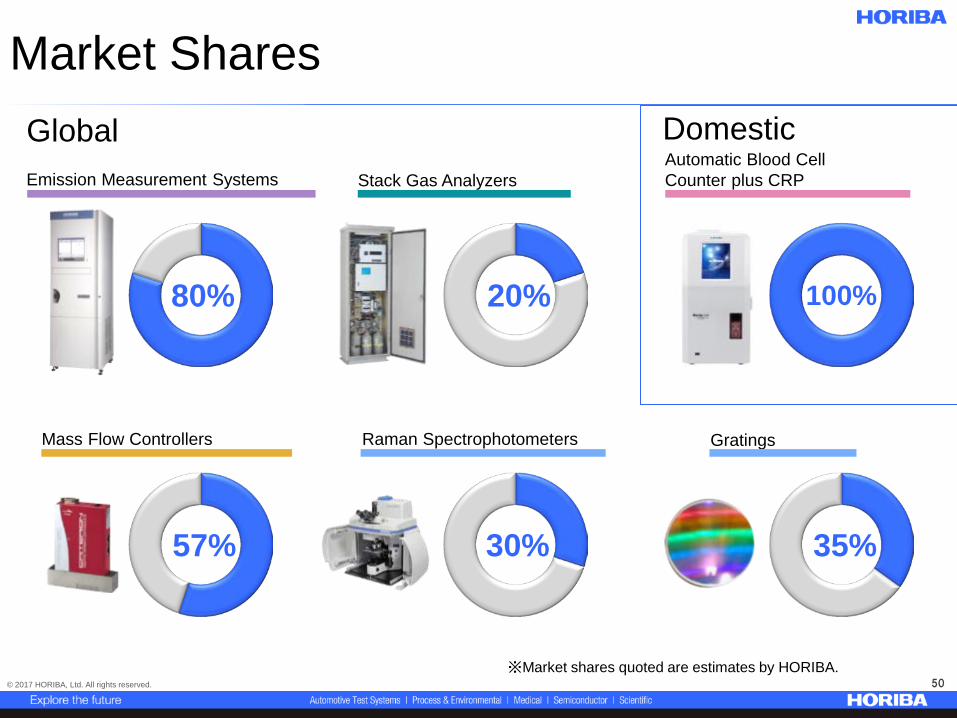
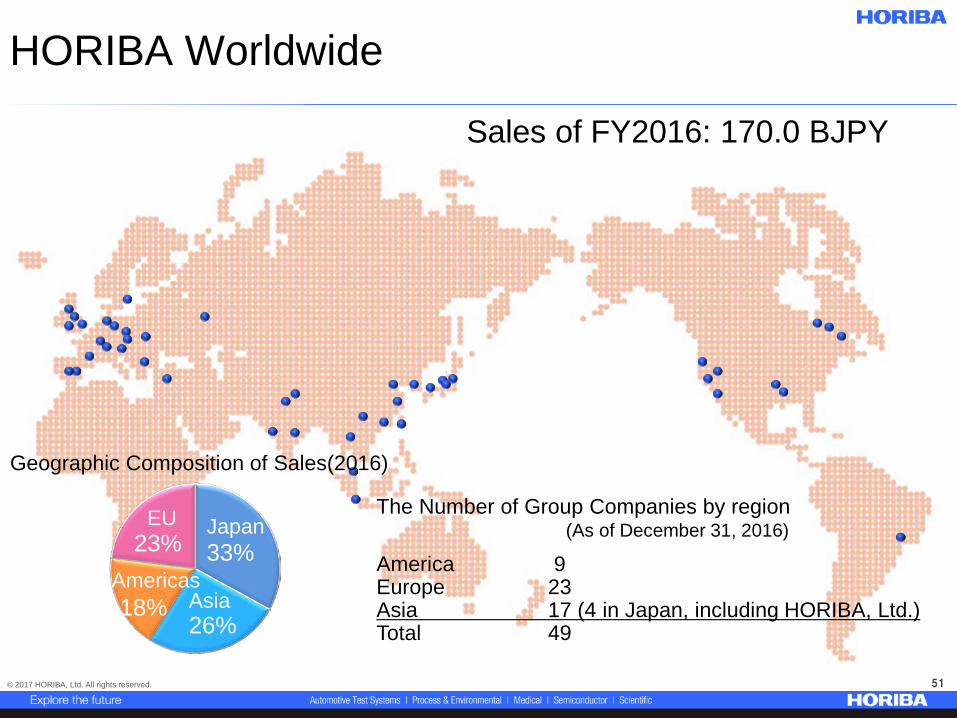
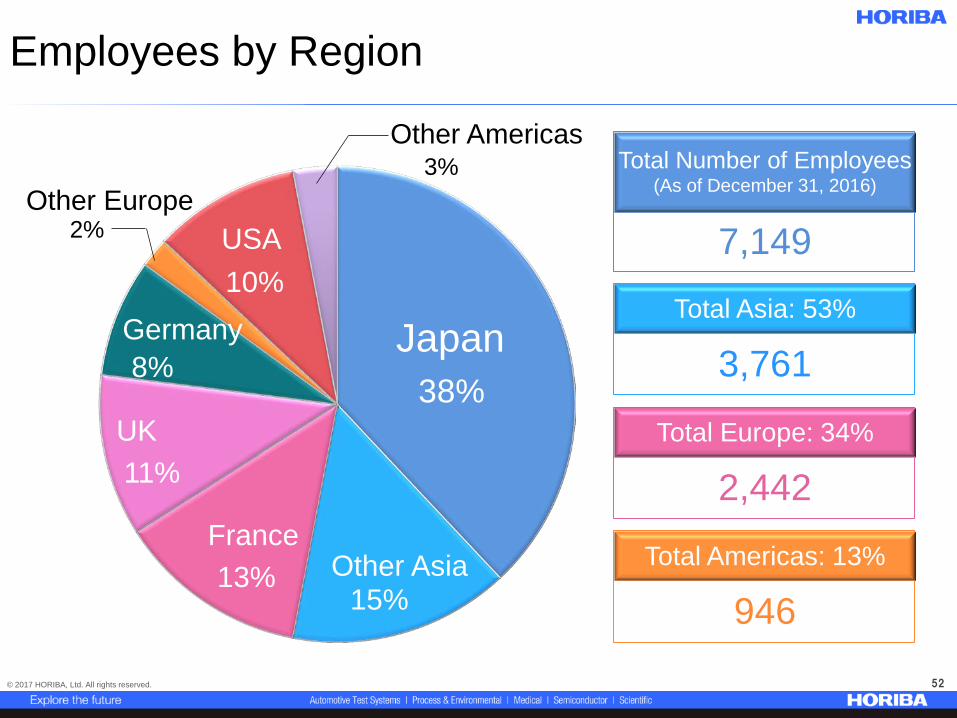


![WELCOM TO OGOTO ONSEN · 2018. 3. 28. · ⑥ Yunoyado Komorebi [077-579-8585] ⑦ Biwako Grand Hotel / Kyo-oumi [077-579-2111] ⑧ Biwako Ryokusuitei [0120-026-417] ⑨ Satoyu Mukashibanashi](https://img.pdfslide.us/doc/110x75/60a5de1a33a2f1028e3e545a/welcom-to-ogoto-onsen-2018-3-28-a-yunoyado-komorebi-077-579-8585-a-biwako.jpg)