Embed Size (px)
Citation preview
Summary
1997 Economic Census
Arts, Entertainment, and Recreation
Subject Series
1997Issued April 2001
EC97S71S-SM
U.S. Department of CommerceEconomics and Statistics Administration
U.S. CENSUS BUREAU

Many persons participated in the variousactivities of the 1997 Economic Census forthe Arts, Entertainment, and Recreationsector.
Service Sector Statistics Division preparedthis report. Bobby E. Russell, AssistantChief for Census Programs, was respon-sible for the overall planning, manage-ment, and coordination. Planning andimplementation were under the directionof Jack B. Moody, Chief, Service CensusBranch assisted by Jack R. Drago,Kirk K. Degler, Cynthia M. Wrenn-Yorker, and Susan G. Baker. Primarystaff assistance was provided by Kim A.Casey, Eric E. Cotter, Brett J. Creech,Karen M. Dennison, Julie A. Ishman,Christine M. Joseph, Robin A. Justice,Joyce M. Kiessling, John J. Manning,Kamatha Marbury, Mary E. Myrick,Shawna J. Orzechowski, Joy P.Pierson, Dawn E. Rosser, Tara E.Swanson, Jennifer N. Thorne, andBrent M. Williams.
Mathematical and statistical techniques aswell as the coverage operations were pro-vided by Carl A. Konschnik, AssistantChief for Research and Methodology,assisted by Carol S. King, Chief, Statisti-cal Methods Branch, and Jock R. Black,Chief, Program Research and DevelopmentBranch, with staff assistance fromMaria C. Cruz and David L. Kinyon.
The Economic Planning and CoordinationDivision provided overall planning andreview of many operations and the com-puter processing procedures. Shirin A.Ahmed, Assistant Chief for Post-CollectionProcessing, was responsible for edit proce-dures and designing the interactive ana-lytical software. Design and specificationswere prepared under the supervision ofDennis L. Shoemaker, Chief, Census Pro-cessing Branch, assisted by John D.Ward. Primary staff assistance was pro-vided by Sonya P. Curcio, Richard W.Graham, and Cheryl E. Merkle.
The Economic Product Team, with primarycontributions from Andrew W. Hait andJennifer E. Lins, was responsible for thedevelopment of the system to disseminate1997 Economic Census reports.
The staff of the National Processing Center,Judith N. Petty, Chief, performed mailoutpreparation and receipt operations, clericaland analytical review activities, and dataentry.
The Geography Division staff developedgeographic coding procedures and associ-ated computer programs.
The Economic Statistical Methods and Pro-gramming Division, Charles P. PautlerJr., Chief, developed and coordinated thecomputer processing systems. Martin S.Harahush, Assistant Chief for Quinquen-nial Programs, was responsible for designand implementation of the computer sys-tems. Robert S. Jewett, Barbara L.Lambert, and Edward F. Johnson pro-vided special computer programming.William C. Wester, Chief, ServicesBranch, assisted by Jay L. Norris whosupervised the preparation of the com-puter programs. Additional programmingassistance was provided by Leatrice D.Hines, Sarah J. Presley, Jacqueline V.Sellers, and Michael A. Sendelbach.
Computer Services Division, Debra D.Williams, Chief, performed the computerprocessing.
Kim D. Ottenstein and Margaret A.Smith of the Administrative and CustomerServices Division, Walter C. Odom,Chief, provided publications and printingmanagement, graphics design and compo-sition, and editorial review for print andelectronic media. General direction andproduction management were provided byMichael G. Garland, Assistant DivisionChief, and Gary J. Lauffer, Chief, Publica-tions Services Branch.
Special acknowledgment is also due themany businesses whose cooperation hascontributed to the publication of thesedata.
ACKNOWLEDGMENTS

Summary
1997 Economic Census
Arts, Entertainment, and Recreation
Subject Series
1997Issued April 2001
EC97S71S-SM
U.S. Department of CommerceDonald L. Evans,
Secretary
Economicsand Statistics
AdministrationJ. Lee Price,
Acting Under Secretary forEconomic Affairs
U.S. CENSUS BUREAUWilliam G. Barron, Jr.,
Acting Director

Paula J. Schneider,Principal Associate Directorfor Programs
Frederick T. Knickerbocker,Associate Directorfor Economic Programs
Thomas L. Mesenbourg,Assistant Directorfor Economic Programs
Bobby E. Russell,Acting Chief, Service SectorStatistics Division
ECONOMICS
AND STATISTICS
ADMINISTRATION
Economicsand StatisticsAdministration
J. Lee Price,Acting Under Secretaryfor Economic Affairs
U.S. CENSUS BUREAU
William G. Barron, Jr.,Acting Director
William G. Barron, Jr.,Deputy Director

CONTENTS
Introduction to the Economic Census 1...........................
Arts, Entertainment, and Recreation 5............................
TABLES
Geographic Area Series
1a. Summary Statistics for Firms Subject to Federal Income Taxfor the United States: 1997 7.............................
1b. Summary Statistics for Firms Exempt From Federal IncomeTax for the United States: 1997 9.........................
Sources of Receipts or Revenue
2a. Major Sources of Receipts From Customers for Firms Subjectto Federal Income Tax for the United States: 1997 10.........
2b. Major Sources of Revenue From Customers for Firms ExemptFrom Federal Income Tax for the United States: 1997 32......
Establishment and Firm Size
3a. Concentration by Largest Firms Subject to Federal IncomeTax: 1997 45............................................
3b. Concentration by Largest Firms Exempt From Federal IncomeTax: 1997 53............................................
APPENDIXES
A. Explanation of Terms A–1....................................
B. NAICS Codes, Titles, and Descriptions B–1....................
C. Coverage and Methodology C–1..............................
D. Geographic Notes ~~......................................
E. Metropolitan Areas ~~......................................
Availability of Data Insideback
cover
...........................................
~~ Not applicable for this report.
Note: This summary report is a compilation of selected tables from the1997 Arts, Entertainment, and Recreation Geographic Area Series, Sources ofReceipts or Revenue, and Establishment and Firm Size reports.
ARTS, ENTERTAINMENT, & RECREATIONmSUBJECT SERIES SUMMARY iiiU.S. Census Bureau, 1997 Economic Census Apr. 30, 2001

Introduction to the Economic Census
PURPOSES AND USES OF THE ECONOMIC CENSUS
The economic census is the major source of facts aboutthe structure and functioning of the Nation’s economy. Itprovides essential information for government, business,industry, and the general public. Title 13 of the UnitedStates Code (Sections 131, 191, and 224) directs the Cen-sus Bureau to take the economic census every 5 years,covering years ending in 2 and 7.
The economic census furnishes an important part of theframework for such composite measures as the grossdomestic product estimates, input/output measures, pro-duction and price indexes, and other statistical series thatmeasure short-term changes in economic conditions. Spe-cific uses of economic census data include the following:
• Policymaking agencies of the Federal Government usethe data to monitor economic activity and assess theeffectiveness of policies.
• State and local governments use the data to assessbusiness activities and tax bases within their jurisdic-tions and to develop programs to attract business.
• Trade associations study trends in their own and com-peting industries, which allows them to keep their mem-bers informed of market changes.
• Individual businesses use the data to locate potentialmarkets and to analyze their own production and salesperformance relative to industry or area averages.
ALL-NEW INDUSTRY CLASSIFICATIONS
Data from the 1997 Economic Census are published pri-marily on the basis of the North American Industry Classi-fication System (NAICS), unlike earlier censuses, whichwere published according to the Standard Industrial Classi-fication (SIC) system. NAICS is in the process of beingadopted in the United States, Canada, and Mexico. Mosteconomic census reports cover one of the following NAICSsectors:
21 Mining22 Utilities23 Construction31-33 Manufacturing42 Wholesale Trade44-45 Retail Trade48-49 Transportation and Warehousing51 Information
52 Finance and Insurance53 Real Estate and Rental and Leasing54 Professional, Scientific, and Technical
Services55 Management of Companies and Enterprises56 Administrative and Support and Waste
Management and Remediation Services61 Educational Services62 Health Care and Social Assistance71 Arts, Entertainment, and Recreation72 Accommodation and Foodservices81 Other Services (except Public Administration)
(Not listed above are the Agriculture, Forestry, Fishing, andHunting sector (NAICS 11), partially covered by the censusof agriculture conducted by the U.S. Department of Agri-culture, and the Public Administration sector (NAICS 92),covered by the census of governments conducted by theCensus Bureau.)
The 20 NAICS sectors are subdivided into 96 subsectors(three-digit codes), 313 industry groups (four-digit codes),and, as implemented in the United States, 1170 industries(five- and six-digit codes).
RELATIONSHIP TO SIC
While many of the individual NAICS industries corre-spond directly to industries as defined under the SIC sys-tem, most of the higher level groupings do not. Particularcare should be taken in comparing data for retail trade,wholesale trade, and manufacturing, which are sectortitles used in both NAICS and SIC, but cover somewhat dif-ferent groups of industries. The industry definitions dis-cuss the relationships between NAICS and SIC industries.Where changes are significant, it will not be possible toconstruct time series that include data for points bothbefore and after 1997.
For 1997, data for auxiliary establishments (those func-tioning primarily to manage, service, or support the activi-ties of their company’s operating establishments, such asa central administrative office or warehouse) will not beincluded in the sector-specific reports. These data will bepublished separately.
GEOGRAPHIC AREA CODING
Accurate and complete information on the physicallocation of each establishment is required to tabulate thecensus data for the states, metropolitan areas (MAs), coun-ties, parishes, and corporate municipalities including cit-ies, towns, villages, and boroughs. Respondents were
INTRODUCTION 11997 ECONOMIC CENSUS
U.S. Census Bureau, 1997 Economic Census
required to report their physical location (street address,municipality, county, and state) if it differed from theirmailing address. For establishments not surveyed by mail(and those single-establishment companies that did notprovide acceptable information on physical location), loca-tion information from Internal Revenue Service tax formsis used as a basis for coding.
BASIS OF REPORTING
The economic census is conducted on an establishmentbasis. A company operating at more than one location isrequired to file a separate report for each store, factory,shop, or other location. Each establishment is assigned aseparate industry classification based on its primary activ-ity and not that of its parent company.
DOLLAR VALUES
All dollar values presented are expressed in current dol-lars; i.e., 1997 data are expressed in 1997 dollars, and1992 data, in 1992 dollars. Consequently, when makingcomparisons with prior years, users of the data shouldconsider the changes in prices that have occurred.
All dollar values are shown in thousands of dollars.
AVAILABILITY OF ADDITIONAL DATA
Reports in Print and Electronic Media
All results of the 1997 Economic Census are availableon the Census Bureau Internet site (www.census.gov) andon compact discs (CD-ROM) for sale by the Census Bureau.Unlike previous censuses, only selected highlights arepublished in printed reports. For more information, includ-ing a description of electronic and printed reports beingissued, see the Internet site, or write to U.S. CensusBureau, Washington, DC 20233-8300, or call CustomerServices at 301-457-4100.
Special Tabulations
Special tabulations of data collected in the 1997 Eco-nomic Census may be obtained, depending on availabilityof time and personnel, in electronic or tabular form. Thedata will be summaries subject to the same rules prohibit-ing disclosure of confidential information (including name,address, kind of business, or other data for individualbusiness establishments or companies) that govern theregular publications.
Special tabulations are prepared on a cost basis. Arequest for a cost estimate, as well as exact specificationson the type and format of the data to be provided, shouldbe directed to the Chief of the division named below, U.S.Census Bureau, Washington, DC 20233-8300. To discuss aspecial tabulation before submitting specifications, callthe appropriate division:
Manufacturing and Construction Division 301-457-4673Service Sector Statistics Division 301-457-2668
HISTORICAL INFORMATION
The economic census has been taken as an integratedprogram at 5-year intervals since 1967 and before that for1954, 1958, and 1963. Prior to that time, individual com-ponents of the economic census were taken separately atvarying intervals.
The economic census traces its beginnings to the 1810Decennial Census, when questions on manufacturing wereincluded with those for population. Coverage of economicactivities was expanded for the 1840 Decennial Censusand subsequent censuses to include mining and somecommercial activities. The 1905 Manufactures Census wasthe first time a census was taken apart from the regulardecennial population census. Censuses covering retail andwholesale trade and construction industries were added in1930, as were some covering service trades in 1933. Cen-suses of construction, manufacturing, and the other busi-ness service censuses were suspended during World WarII.
The 1954 Economic Census was the first census to befully integrated: providing comparable census data acrosseconomic sectors, using consistent time periods, con-cepts, definitions, classifications, and reporting units. Itwas the first census to be taken by mail, using lists offirms provided by the administrative records of other Fed-eral agencies. Since 1963, administrative records alsohave been used to provide basic statistics for very smallfirms, reducing or eliminating the need to send them cen-sus questionnaires.
The range of industries covered in the economic cen-suses expanded between 1967 and 1992. The census ofconstruction industries began on a regular basis in 1967,and the scope of service industries, introduced in 1933,was broadened in 1967, 1977, and 1987. While a fewtransportation industries were covered as early as 1963, itwas not until 1992 that the census broadened to includeall of transportation, communications, and utilities. Alsonew for 1992 was coverage of financial, insurance, andreal estate industries. With these additions, the economiccensus and the separate census of governments and cen-sus of agriculture collectively covered roughly 98 percentof all economic activity.
Printed statistical reports from the 1992 and earliercensuses provide historical figures for the study of long-term time series and are available in some large libraries.All of the census reports printed since 1967 are still avail-able for sale on microfiche from the Census Bureau.CD-ROMs issued from the 1987 and 1992 Economic Cen-suses contain databases including nearly all data pub-lished in print, plus additional statistics, such as ZIP Codestatistics, published only on CD-ROM.
2 INTRODUCTION 1997 ECONOMIC CENSUS
U.S. Census Bureau, 1997 Economic Census

SOURCES FOR MORE INFORMATION
More information about the scope, coverage, classifica-tion system, data items, and publications for each of theeconomic censuses and related surveys is published in theGuide to the 1997 Economic Census and Related Statisticsat www.census.gov/econguide. More information on themethodology, procedures, and history of the censuses willbe published in the History of the 1997 Economic Censusat www.census.gov/econ/www/history.html.
ABBREVIATIONS AND SYMBOLS
The following abbreviations and symbols are used withthe 1997 Economic Census data:
A Standard error of 100 percent or more.D Withheld to avoid disclosing data of individual
companies; data are included in higher leveltotals.
F Exceeds 100 percent because data includeestablishments with payroll exceeding rev-enue.
N Not available or not comparable.Q Revenue not collected at this level of detail for
multiestablishment firms.S Withheld because estimates did not meet
publication standards.
V Represents less than 50 vehicles or .05percent.
X Not applicable.Y Disclosure withheld because of insufficient
coverage of merchandise lines.Z Less than half the unit shown.a 0 to 19 employees.b 20 to 99 employees.c 100 to 249 employees.e 250 to 499 employees.f 500 to 999 employees.g 1,000 to 2,499 employees.h 2,500 to 4,999 employees.i 5,000 to 9,999 employees.j 10,000 to 24,999 employees.k 25,000 to 49,999 employees.l 50,000 to 99,999 employees.m 100,000 employees or more.p 10 to 19 percent estimated.q 20 to 29 percent estimated.r Revised.s Sampling error exceeds 40 percent.nec Not elsewhere classified.nsk Not specified by kind.– Represents zero (page image/print only).(CC) Consolidated city.(IC) Independent city.
INTRODUCTION 31997 ECONOMIC CENSUS
U.S. Census Bureau, 1997 Economic Census

This page is intentionally blank.
4 INTRODUCTION 1997 ECONOMIC CENSUS
U.S. Census Bureau, 1997 Economic Census

Arts, Entertainment, and Recreation
SCOPE
The Arts, Entertainment, and Recreation sector (sector71) of the 1997 Economic Census includes a wide range ofestablishments that operate facilities or provide servicesto meet varied cultural, entertainment, and recreationalinterests of their patrons. This sector comprises (1) estab-lishments that are involved in producing, promoting, orparticipating in live performances, events, or exhibitsintended for public viewing; (2) establishments that pre-serve and exhibit objects and sites of historical, cultural,or educational interest; and (3) establishments that oper-ate facilities or provide services that enable patrons to par-ticipate in recreational activities or pursue amusement,hobby, and leisure time interests.
Some establishments that provide cultural, entertain-ment, or recreational facilities and services are classifiedin other sectors. Excluded from this sector are: (1) estab-lishments that provide both accommodations and recre-ational facilities, such as hunting and fishing camps andresort and casino hotels are classified in Subsector 721,Accommodation; (2) restaurants and night clubs that pro-vide live entertainment in addition to the sale of food andbeverages are classified in Subsector 722, Foodservicesand Drinking Places; (3) motion picture theaters, librariesand archives, and publishers of newspapers, magazines,books, periodicals, and computer software are classified inSector 51, Information; and (4) establishments using trans-portation equipment to provide recreational and entertain-ment services, such as those operating sightseeing buses,dinner cruises, or helicopter rides are classified in Subsec-tor 487, Scenic and Sightseeing Transportation.
Data for this sector are shown for establishments offirms subject to Federal income tax and separately offirms which are exempt from Federal income tax underprovisions of the Internal Revenue Code.
Many of the ‘‘kinds of business or operation’’ includedin this sector are not thought of as commercial businessesand the terms (such as ‘‘business,’’ ‘‘establishment,’’ and‘‘firm’’) used to describe them may not be descriptive ofsuch services. However, these terms are applied to all‘‘kinds of business or operation’’ in order to maintain con-formity in the measures of the production and delivery ofgoods and services and in the presentation of data.
The basic tabulations for this sector do not include datafor establishments which are auxiliary (primary function isproviding a service, such as warehousing or bookkeeping)to service establishments within the same organization.Data for auxiliaries are presented separately.
GENERAL
A list of reports that provide statistics on sector 71 fol-lows.
Geographic area reports. There is a separate report foreach state, the District of Columbia, and the United States.For establishments of firms subject to Federal income tax,each state report presents general statistics on number ofestablishments, receipts, payroll, and employment by kindof business for the state, metropolitan areas (MAs), coun-ties, and places with 2,500 inhabitants or more. Greaterkind-of-business detail is shown for larger areas. Forestablishments of firms exempt from Federal income tax,each state report presents statistics on number of estab-lishments, revenue, expenses, payroll, and employmentby kind of business, for the state and MAs. Greater kind-of-business detail is shown for larger areas.
The United States report presents data for the UnitedStates as a whole for establishments with payroll of firmssubject to Federal income tax, as well as those exemptfrom Federal income tax, for detailed kind-of-businessclassifications.
Sources of receipts or revenue report. This reportpresents sources of receipts or revenue data for establish-ments with payroll by kind of business. Data are pre-sented for the United States and states.
Establishment and firm size (including legal form oforganization) report. This report presentsreceipts/revenue, payroll, and employment data for theUnited States by receipts/revenue size, by employmentsize, and by legal form of organization for establishments;and receipts/revenue size (including concentration bylargest firms), by employment size, and by number ofestablishments operated (single units and multiunits) forfirms.
Miscellaneous subjects report. This report presentsdata for establishments with payroll for a variety ofindustry-specific questions. Presentation of data varies bykind of business.
ZIP Code report. This report presents data for establish-ments with payroll by United States ZIP Code.
GEOGRAPHIC AREAS COVERED
The level of geographic detail varies by report. Datamay be presented for:
ARTS, ENTERTAINMENT, & RECREATION 51997 ECONOMIC CENSUS
U.S. Census Bureau, 1997 Economic Census
1. The United States as a whole.
2. States and the District of Columbia.
3. Consolidated metropolitan statistical areas (CMSAs)and primary metropolitan statistical areas (PMSAs)defined by the Office of Management and Budget(OMB) as of June 30, 1997. A CMSA is an area used tofacilitate the presentation and analysis of data forlarge concentrations of metropolitan populations. Itincludes two or more contiguous PMSAs which have apopulation of at least 1,000,000 (according to the1990 Census of Population or subsequent special cen-sus) and which meet specific criteria of urban charac-ter and of social and economic integration.
4. Metropolitan statistical areas (MSAs) defined by theOMB as of June 30, 1997. An MSA is an integrated eco-nomic and social unit with a population nucleus of atleast 50,000 inhabitants (according to the 1990 Cen-sus of Population or subsequent special census). EachMSA consists of one or more counties meeting stan-dards of metropolitan character. In New England, citiesand towns rather than counties are the componentgeographic units.
5. Areas within the state outside metropolitan areas(MAs).
6. Counties and county equivalents defined as of January1, 1997. Counties are the primary divisions of states,except in Louisiana where they are called parishes andin Alaska where they are called boroughs and censusareas. Maryland, Missouri, Nevada, and Virginia haveone place or more that is independent of any countyorganization and constitutes primary divisions of theirstates. These places are treated as counties and asplaces.
7. Consolidated cities defined as of January 1, 1997.Consolidated cities are consolidated governmentswhich consist of separately incorporated municipali-ties.
8. Municipalities of 2,500 inhabitants or more defined asof January 1, 1997. These are areas of significant
population incorporated as cities, boroughs, villages,or towns according to the 1990 Census of Populationor subsequent special census. For the economic cen-sus, boroughs and census areas in Alaska and bor-oughs in New York are not included in this category.
9. Special economic urban areas (SEUAs), which includetownships in Michigan, New Jersey, and Pennsylvania,and towns in New York, Wisconsin, and the six NewEngland states with 10,000 inhabitants or more(according to the 1990 Census of Population or subse-quent special census).
COMPARABILITY OF THE 1992 AND 1997 CENSUSES
The 1997 Economic Census is the first census topresent data based on the new North American IndustryClassification System (NAICS). Previous census data werepresented according to the Standard Industrial Classifica-tion (SIC) system developed some 60 years ago. Due tothis change, comparability between census years may belimited. Comparative statistics will be included as part ofthe Core Business Statistics Reports.
DISCLOSURE
In accordance with Federal law governing censusreports (Title 13 of the United States Code), no data arepublished that would disclose the operations of an indi-vidual establishment or business. However, the number ofestablishments in a kind-of-business classification is notconsidered a disclosure; therefore, this information maybe released even though other information is withheld.
AVAILABILITY OF MORE FREQUENT ECONOMICDATA
The Census Bureau conducts the Service Annual Survey(SAS) each year. This survey, while providing more fre-quent observations, yields less kind-of-business and geo-graphic detail than the economic census. In addition, theCounty Business Patterns program offers annual statisticson the number of establishments, employment, and pay-roll classified by industry within each county.
6 ARTS, ENTERTAINMENT, & RECREATION 1997 ECONOMIC CENSUS
U.S. Census Bureau, 1997 Economic Census

Table 1a. Summary Statistics for Firms Subject to Federal Income Tax for the United States:1997
[Includes only establishments with payroll. For meaning of abbreviations and symbols, see introductory text. For explanation of terms, see Appendix A]
NAICScode Geographic area and kind of business
Percent of receiptsm
Establish~ments
(number)Receipts($1,000)
Annual payroll($1,000)
First~quarterpayroll
($1,000)
Paidemployees
for payperiod
includingMarch 12(number)
Fromadminis~
trativerecords1 Estimated2
UNITED STATES
71 Arts, entertainment, & recreation r79 636.............................r85 088 464 r26 103 856 r5 617 788 r1 207 373 r13.5 r6.0
711 Performing arts, spectator sports, & related industries 25 942..................... 32 743 586 12 834 362 2 653 922 235 926 11.8 4.5
7111 Performing arts companies 5 883........................................... 5 271 542 1 452 152 271 512 51 802 14.1 5.471111 Theater companies & dinner theaters 1 600................................ 2 344 240 593 790 127 135 26 488 11.0 5.1711110 Theater companies & dinner theaters 1 600.............................. 2 344 240 593 790 127 135 26 488 11.0 5.17111101 Opera companies 23............................................. D D D c D D7111102 Theater companies 1 393........................................... 2 043 181 502 901 108 258 19 157 11.7 5.67111103 Dinner theaters 184............................................... D D D i D D
71112 Dance companies 159................................................. 109 384 35 272 7 638 2 349 25.2 9.9711120 Dance companies 159............................................... 109 384 35 272 7 638 2 349 25.2 9.9
71113 Musical groups & artists 3 369........................................... 2 172 497 635 040 91 888 16 354 17.3 5.5711130 Musical groups & artists 3 369......................................... 2 172 497 635 040 91 888 16 354 17.3 5.57111301 Symphony orchestras & chamber music organizations 107............. 40 022 15 438 1 908 628 45.3 11.17111309 Other music groups & artists 3 262................................... 2 132 475 619 602 89 980 15 726 16.8 5.4
71119 Other performing arts companies 755................................... 645 421 188 050 44 851 6 611 13.0 5.1711190 Other performing arts companies 755................................. 645 421 188 050 44 851 6 611 13.0 5.17111901 Circuses 70..................................................... 268 351 56 393 13 684 1 861 4.9 .37111909 Other performing arts companies (except circuses) 685................ 377 070 131 657 31 167 4 750 18.8 8.6
7112 Spectator sports 3 881.................................................... 13 656 033 6 151 215 1 374 222 92 393 6.0 2.671121 Spectator sports 3 881.................................................. 13 656 033 6 151 215 1 374 222 92 393 6.0 2.6711211 Sports teams & clubs 483............................................ 7 808 684 4 922 390 1 114 533 33 330 2.5 1.77112111 Football clubs 45................................................ 2 503 339 1 656 478 382 473 4 107 – .37112112 Baseball clubs 194................................................ 2 296 558 1 425 319 135 620 14 410 7.1 3.47112119 Other professional sports clubs 244................................. 3 008 787 1 840 593 596 440 14 813 1.2 1.6711212 Racetracks 807..................................................... 4 142 020 797 261 173 543 44 880 5.3 2.57112121 Dog racetrack operation 56....................................... 796 069 148 173 36 997 11 212 2.3 1.17112122 Auto racetrack operation 590....................................... 897 600 120 176 22 215 6 267 12.5 3.67112123 Horse racetrack operation 161..................................... 2 448 351 528 912 114 331 27 401 3.5 2.5711219 Other spectator sports 2 591........................................... 1 705 329 431 564 86 146 14 183 23.6 7.07112191 Professional athletes 569.......................................... 302 751 83 227 12 583 1 540 32.7 4.37112192 Racing (except racetrack operation) 2 022............................. 1 402 578 348 337 73 563 12 643 21.7 7.6
7113 Promoters of performing arts, sports, & similar events 2 633................... 5 045 093 1 052 645 232 997 51 411 10.9 7.371131 Promoters of performing arts, sports, & similar events w/facility 557......... 1 548 106 418 885 97 610 25 713 5.3 6.3711310 Promoters of performing arts, sports, & similar events w/facility 557....... 1 548 106 418 885 97 610 25 713 5.3 6.3
71132 Promoters of performing arts, sports, & similar events w/o facil 2 076......... 3 496 987 633 760 135 387 25 698 13.4 7.7711320 Promoters of performing arts, sports, & similar events w/o facil 2 076....... 3 496 987 633 760 135 387 25 698 13.4 7.7
7114 Agents/managers for artists, athletes, & other public figures 2 532.............. 2 409 918 910 844 195 732 13 239 15.1 4.171141 Agents/managers for artists, athletes, & other public figures 2 532............ 2 409 918 910 844 195 732 13 239 15.1 4.1711410 Agents/managers for artists, athletes, & other public figures 2 532.......... 2 409 918 910 844 195 732 13 239 15.1 4.1
7115 Independent artists, writers, & performers 11 013.............................. 6 361 000 3 267 506 579 459 27 081 21.7 5.871151 Independent artists, writers, & performers 11 013............................ 6 361 000 3 267 506 579 459 27 081 21.7 5.8711510 Independent artists, writers, & performers 11 013.......................... 6 361 000 3 267 506 579 459 27 081 21.7 5.8
712 Museums, historical sites, & similar institutions 787........................... 483 683 122 404 24 387 7 281 23.4 7.1
7121 Museums, historical sites, & similar institutions 787......................... 483 683 122 404 24 387 7 281 23.4 7.171211 Museums 426........................................................ 259 215 52 692 11 230 2 975 27.7 8.7712110 Museums 426...................................................... 259 215 52 692 11 230 2 975 27.7 8.7
71212 Historical sites 78.................................................... 27 462 9 307 1 662 927 33.4 9.0712120 Historical sites 78.................................................. 27 462 9 307 1 662 927 33.4 9.0
71213 Zoos & botanical gardens 117.......................................... 96 915 28 900 5 845 1 645 18.8 4.6712130 Zoos & botanical gardens 117........................................ 96 915 28 900 5 845 1 645 18.8 4.6
71219 Nature parks & other similar institutions 166.............................. 100 091 31 505 5 650 1 734 14.2 4.9712190 Nature parks & other similar institutions 166............................ 100 091 31 505 5 650 1 734 14.2 4.9
713 Amusement, gambling, & recreation industries r52 907............................r51 861 195 r13 147 090 r2 939 479 r964 166 r14.6 r6.9
7131 Amusement parks & arcades 3 344......................................... 8 418 476 1 961 871 396 359 138 930 4.6 2.971311 Amusement & theme parks 607........................................ 7 171 677 1 690 386 337 225 110 789 1.4 1.1713110 Amusement & theme parks 607...................................... 7 171 677 1 690 386 337 225 110 789 1.4 1.17131101 Waterparks 157.................................................. 342 958 79 296 9 767 3 995 7.5 2.67131102 Amusement parks (except waterparks) 450.......................... 6 828 719 1 611 090 327 458 106 794 1.1 1.0
71312 Amusement arcades 2 737.............................................. 1 246 799 271 485 59 134 28 141 23.2 13.2713120 Amusement arcades 2 737............................................ 1 246 799 271 485 59 134 28 141 23.2 13.2
7132 Gambling industries r2 099.................................................r15 541 569 r3 221 864 r771 576 r168 532 r2.3 r6.6
71321 Casinos (except casino hotels) 447..................................... 10 186 070 2 304 710 549 935 115 210 .9 5.5713210 Casinos (except casino hotels) 447................................... 10 186 070 2 304 710 549 935 115 210 .9 5.5
71329 Other gambling industries r1 652..........................................r5 355 499 r917 154 r221 641 r53 322 r5.0 r8.6
713290 Other gambling industries r1 652........................................r5 355 499 r917 154 r221 641 r53 322 r5.0 r8.6
7132901 Slot machine operators r327........................................r1 618 475 r293 039 r67 670 r15 346 r3.6 r6.8
7132902 Lottery, bingo, bookie, & other betting operation 1 325.................. 3 737 024 624 115 153 971 37 976 5.6 9.3
See footnotes at end of table.
ARTS, ENTERTAINMENT, & RECREATIONmSUBJECT SERIES SUMMARY 7U.S. Census Bureau, 1997 Economic Census Apr. 30, 2001

Table 1a. Summary Statistics for Firms Subject to Federal Income Tax for the United States:1997mCon.
[Includes only establishments with payroll. For meaning of abbreviations and symbols, see introductory text. For explanation of terms, see Appendix A]
NAICScode Geographic area and kind of business
Percent of receiptsm
Establish~ments
(number)Receipts($1,000)
Annual payroll($1,000)
First~quarterpayroll
($1,000)
Paidemployees
for payperiod
includingMarch 12(number)
Fromadminis~
trativerecords1 Estimated2
UNITED STATESmCon.
71 Arts, entertainment, & recreationmCon.
713 Amusement, gambling, & recreation industriesmCon.
7139 Other amusement & recreation services 47 464............................... 27 901 150 7 963 355 1 771 544 656 704 24.4 8.371391 Golf courses & country clubs 8 546....................................... 8 636 921 2 731 863 516 430 160 118 20.6 7.1713910 Golf courses & country clubs 8 546..................................... 8 636 921 2 731 863 516 430 160 118 20.6 7.1
71392 Skiing facilities 379................................................... 1 340 813 431 147 166 775 58 513 5.0 4.6713920 Skiing facilities 379................................................. 1 340 813 431 147 166 775 58 513 5.0 4.6
71393 Marinas 4 217......................................................... 2 541 481 516 589 102 145 22 765 30.6 6.5713930 Marinas 4 217....................................................... 2 541 481 516 589 102 145 22 765 30.6 6.5
71394 Fitness & recreational sports centers 16 604................................ 7 944 954 2 405 043 562 933 256 397 24.6 10.6713940 Fitness & recreational sports centers 16 604.............................. 7 944 954 2 405 043 562 933 256 397 24.6 10.67139404 Ice skating rinks 381.............................................. 298 737 78 587 19 552 8 870 20.2 7.27139405 Roller skating rinks 1 611............................................ 416 339 111 912 28 316 19 416 34.7 7.1
71395 Bowling centers 5 590.................................................. 2 820 685 821 044 213 889 88 044 22.8 6.9713950 Bowling centers 5 590................................................ 2 820 685 821 044 213 889 88 044 22.8 6.9
71399 All other amusement & recreation industries 12 128.......................... 4 616 296 1 057 669 209 372 70 867 34.1 9.8713990 All other amusement & recreation industries 12 128........................ 4 616 296 1 057 669 209 372 70 867 34.1 9.87139901 Dance studios & halls 293......................................... 91 068 26 303 5 839 2 663 28.2 5.47139902 Concession operators of amusement devices & rides 1 072.............. 364 054 84 290 12 688 5 967 31.5 8.97139904 Miniature golf courses 1 041......................................... 307 886 72 833 12 432 5 326 29.9 4.37139905 Coin~operated amusement devices (except slot machine operation) 2 668. 1 705 888 342 156 78 275 18 907 27.7 7.8
1Includes receipts information obtained from administrative records of other Federal agencies.2Includes receipts information which was imputed based on historic company ratios or administrative records, or on industry averages.
8 SUMMARY ARTS, ENTERTAINMENT, & RECREATIONmSUBJECT SERIESU.S. Census Bureau, 1997 Economic Census Apr. 30, 2001

Table 1b. Summary Statistics for Firms Exempt From Federal Income Tax for the United States:1997
[Includes only establishments with payroll. For meaning of abbreviations and symbols, see introductory text. For explanation of terms, see Appendix A]
NAICScode Geographic area and kind of business
Percent of revenuem
Establish~ments
(number)Revenue($1,000)
Expenses($1,000)
Annual payroll($1,000)
First~quarterpayroll
($1,000)
Paidemployees
for payperiod
includingMarch 12(number)
Fromadminis~
trativerecords1 Estimated2
UNITED STATES
71 Arts, entertainment, & recreation 19 463............. 19 626 564 17 645 582 6 683 417 1 466 590 380 287 14.5 3.7
711 Performing arts, spectator sports, & related industries 4 624..... 4 875 904 4 579 571 1 621 537 392 820 90 831 6.3 3.5
7111 Performing arts companies 3 316.......................... 3 298 514 3 118 529 1 273 094 312 889 70 201 4.6 3.271111 Theater companies & dinner theaters 1 647............... 1 775 964 1 664 849 630 617 152 172 32 806 4.4 3.7711110 Theater companies & dinner theaters 1 647............. 1 775 964 1 664 849 630 617 152 172 32 806 4.4 3.77111101 Opera companies 147............................ 593 608 537 233 235 218 60 120 9 400 .7 .87111102 Theater companies 1 500........................... 1 182 356 1 127 616 395 399 92 052 23 406 6.3 5.1
71112 Dance companies 371................................ 323 306 317 462 131 019 32 486 6 821 4.0 2.8711120 Dance companies 371.............................. 323 306 317 462 131 019 32 486 6 821 4.0 2.8
71113 Musical groups & artists 1 211........................... 1 154 012 1 092 508 498 783 125 431 29 768 4.7 2.6711130 Musical groups & artists 1 211......................... 1 154 012 1 092 508 498 783 125 431 29 768 4.7 2.67111301 Symphony orchestras & chamber music
organizations 698............................... 1 038 206 984 338 466 868 118 076 26 975 3.9 1.37111309 Other music groups & artists 513................... 115 806 108 170 31 915 7 355 2 793 11.9 13.8
71119 Other performing arts companies 87................... 45 232 43 710 12 675 2 800 806 11.4 5.8711190 Other performing arts companies 87................. 45 232 43 710 12 675 2 800 806 11.4 5.87111901 Circuses 17.................................... 20 697 19 659 6 538 1 508 342 4.7 .77111909 Other performing arts companies (except
circuses) 70................................... 24 535 24 051 6 137 1 292 464 17.0 10.1
7113 Promoters of performing arts, sports, & similar events 1 308... 1 577 390 1 461 042 348 443 79 931 20 630 10.0 3.971131 Promoters of performing arts, sports, & similar events
w/facility 371........................................ 846 172 771 397 225 315 53 523 13 589 4.9 1.8711310 Promoters of performing arts, sports, & similar
events w/facility 371............................... 846 172 771 397 225 315 53 523 13 589 4.9 1.8
71132 Promoters of performing arts, sports, & similar eventsw/o facil 937........................................ 731 218 689 645 123 128 26 408 7 041 15.9 6.4
711320 Promoters of performing arts, sports, & similarevents w/o facil 937............................... 731 218 689 645 123 128 26 408 7 041 15.9 6.4
712 Museums, historical sites, & similar institutions 4 793........... 6 280 306 4 926 604 1 714 749 399 471 84 495 15.0 3.0
7121 Museums, historical sites, & similar institutions 4 793......... 6 280 306 4 926 604 1 714 749 399 471 84 495 15.0 3.071211 Museums 3 434....................................... 4 529 209 3 491 330 1 212 493 286 063 60 122 16.7 3.1712110 Museums 3 434..................................... 4 529 209 3 491 330 1 212 493 286 063 60 122 16.7 3.1
71212 Historical sites 814................................... 342 606 291 306 101 489 22 234 6 757 27.1 4.8712120 Historical sites 814................................. 342 606 291 306 101 489 22 234 6 757 27.1 4.8
71213 Zoos & botanical gardens 269.......................... 1 279 021 1 036 467 364 274 83 051 15 727 5.5 1.7712130 Zoos & botanical gardens 269........................ 1 279 021 1 036 467 364 274 83 051 15 727 5.5 1.7
71219 Nature parks & other similar institutions 276............. 129 470 107 501 36 493 8 123 1 889 18.0 7.4712190 Nature parks & other similar institutions 276........... 129 470 107 501 36 493 8 123 1 889 18.0 7.4
713 Amusement, gambling, & recreation industries 10 046........... 8 470 354 8 139 407 3 347 131 674 299 204 961 18.8 4.5
7139 Other amusement & recreation services 10 046............... 8 470 354 8 139 407 3 347 131 674 299 204 961 18.8 4.571391 Golf courses & country clubs 3 212....................... 5 582 855 5 451 398 2 291 482 455 103 115 960 12.9 2.3713910 Golf courses & country clubs 3 212..................... 5 582 855 5 451 398 2 291 482 455 103 115 960 12.9 2.3
71394 Fitness & recreational sports centers 4 679................ 2 217 294 2 079 495 858 762 178 147 75 706 28.7 7.5713940 Fitness & recreational sports centers 4 679.............. 2 217 294 2 079 495 858 762 178 147 75 706 28.7 7.5
71399 All other amusement & recreation industries 2 155......... 670 205 608 514 196 887 41 049 13 295 35.5 12.3713990 All other amusement & recreation industries 2 155....... 670 205 608 514 196 887 41 049 13 295 35.5 12.3
1Includes revenue information obtained from administrative records of other Federal agencies.2Includes revenue information which was imputed based on historic company ratios or administrative records, or on industry averages.
ARTS, ENTERTAINMENT, & RECREATIONmSUBJECT SERIES SUMMARY 9U.S. Census Bureau, 1997 Economic Census Apr. 30, 2001

Table 2a. Major Sources of Receipts From Customers for Firms Subject to Federal Income Taxfor the United States: 1997
[Includes only establishments with payroll. For meaning of abbreviations and symbols, see introductory text. For explanation of terms, see Appendix A]
NAICS codeand
RL codeKind of business and sources of receipts
Establishments(number)
Receipts1
($1,000)
Receipts from specifiedreceipt lines as percent of
total receipts1
Receipts of establishmentsreporting sources ofreceipts as percent
of total receipts
71 Arts, entertainment, & recreation r79 636...........................r85 088 464 100.0 X
711 Performing arts, spectator sports, & related industries 25 942....... 32 743 586 100.0 73.5
3450 Membership dues and fees 394........................................ 61 704 .2 X5500 Admissions, including sports teams’ total receipts for admissions to
home games (not including admission taxes) 4 987........................ 8 845 832 27.0 X5530 Sports teams only: Report club’s share of admissions for games away
from home 59...................................................... 236 088 .7 X5550 Contract fees from providing entertainment 11 622.......................... 6 773 768 20.7 X5600 Commissions or fees from representation (e.g., from sports or artists’
agents or managers, or event promoters) 3 730........................... 2 717 404 8.3 X
5650 Rental fees for the use of facilities, such as stadiums, or arenas, ortheaters 1 246........................................................ 401 131 1.2 X
5670 This establishment’s share of receipts from concessions or amusementmachines not operated by this establishment 876........................ 297 008 .9 X
5700 Racetrack’s share of receipts from parimutuel betting (not including thestate’s share of such receipts) 207..................................... 2 052 914 6.3 X
5750 Gaming receipts 138.................................................. 469 900 1.4 X5800 Amusement machines operated by this establishment (except slot
machines and other gaming machines) 152............................. 28 743 .1 X
5850 Radio and television income 324....................................... 2 523 853 7.7 X5900 Advertising (including endorsement fees) 2 635............................ 1 717 855 5.2 X7200 Sales of programs 1 144................................................ 188 105 .6 X8500 Food and beverage sales 2 054.......................................... 732 894 2.2 X8600 Merchandise sales 3 586................................................ 655 105 2.0 X
8940 All other receipts 9 050................................................. 5 041 280 15.4 X
7111 Performing arts companies 5 883................................ 5 271 542 100.0 69.2
3450 Membership dues and fees 213........................................ 20 040 .4 X5500 Admissions, including sports teams’ total receipts for admissions to
home games (not including admission taxes) 1 645........................ 2 384 063 45.2 X5550 Contract fees from providing entertainment 4 258.......................... 2 202 868 41.8 X5600 Commissions or fees from representation (e.g., from sports or artists’
agents or managers, or event promoters) 155........................... 21 711 .4 X5650 Rental fees for the use of facilities, such as stadiums, or arenas, or
theaters 238........................................................ 35 977 .7 X
5670 This establishment’s share of receipts from concessions or amusementmachines not operated by this establishment 130........................ 10 397 .2 X
5800 Amusement machines operated by this establishment (except slotmachines and other gaming machines) 14............................. 284 Z X
5900 Advertising (including endorsement fees) 222............................ 23 256 .4 X7200 Sales of programs 90................................................ 9 288 .2 X
8500 Food and beverage sales 572.......................................... 160 564 3.0 69.28501 Sales of food and nonalcoholic beverages 545......................... 112 594 2.1 X8502 Sales of alcoholic beverages 276..................................... 47 970 .9 X
8600 Merchandise sales 1 129................................................ 146 274 2.8 66.68628 Sales of other merchandise 1 129...................................... 146 274 2.8 X
8940 All other receipts 1 156................................................. 256 820 4.9 66.58974 All other receipts 1 156............................................... 256 820 4.9 X
71111 Theater companies & dinner theaters 1 600....................... 2 344 240 100.0 72.4
3450 Membership dues and fees 61........................................ 9 115 .4 X5500 Admissions, including sports teams’ total receipts for admissions to
home games (not including admission taxes) 1 005........................ 1 776 503 75.8 X5550 Contract fees from providing entertainment 633.......................... 298 553 12.7 X5600 Commissions or fees from representation (e.g., from sports or artists’
agents or managers, or event promoters) 39........................... 8 848 .4 X5650 Rental fees for the use of facilities, such as stadiums, or arenas, or
theaters 133........................................................ 19 551 .8 X
5670 This establishment’s share of receipts from concessions or amusementmachines not operated by this establishment 60........................ 2 385 .1 X
5900 Advertising (including endorsement fees) 89............................ 3 082 .1 X7200 Sales of programs 52................................................ 6 468 .3 X
8500 Food and beverage sales 420.......................................... 123 878 5.3 72.48501 Sales of food and nonalcoholic beverages 404......................... 90 213 3.8 X8502 Sales of alcoholic beverages 228..................................... 33 665 1.4 X
8600 Merchandise sales 285................................................ 26 164 1.1 70.48628 Sales of other merchandise 285...................................... 26 164 1.1 X
8940 All other receipts 356................................................. 69 693 3.0 69.18974 All other receipts 356............................................... 69 693 3.0 X
711110 Theater companies & dinner theaters 1 600....................... 2 344 240 100.0 72.4
3450 Membership dues and fees 61........................................ 9 115 .4 X5500 Admissions, including sports teams’ total receipts for admissions to
home games (not including admission taxes) 1 005........................ 1 776 503 75.8 X5550 Contract fees from providing entertainment 633.......................... 298 553 12.7 X5600 Commissions or fees from representation (e.g., from sports or artists’
agents or managers, or event promoters) 39........................... 8 848 .4 X5650 Rental fees for the use of facilities, such as stadiums, or arenas, or
theaters 133........................................................ 19 551 .8 X
5670 This establishment’s share of receipts from concessions or amusementmachines not operated by this establishment 60........................ 2 385 .1 X
5900 Advertising (including endorsement fees) 89............................ 3 082 .1 X7200 Sales of programs 52................................................ 6 468 .3 X
8500 Food and beverage sales 420.......................................... 123 878 5.3 72.48501 Sales of food and nonalcoholic beverages 404......................... 90 213 3.8 X8502 Sales of alcoholic beverages 228..................................... 33 665 1.4 X
8600 Merchandise sales 285................................................ 26 164 1.1 70.48628 Sales of other merchandise 285...................................... 26 164 1.1 X
See footnotes at end of table.
10 SUMMARY ARTS, ENTERTAINMENT, & RECREATIONmSUBJECT SERIESU.S. Census Bureau, 1997 Economic Census Apr. 30, 2001

Table 2a. Major Sources of Receipts From Customers for Firms Subject to Federal Income Taxfor the United States: 1997mCon.
[Includes only establishments with payroll. For meaning of abbreviations and symbols, see introductory text. For explanation of terms, see Appendix A]
NAICS codeand
RL codeKind of business and sources of receipts
Establishments(number)
Receipts1
($1,000)
Receipts from specifiedreceipt lines as percent of
total receipts1
Receipts of establishmentsreporting sources ofreceipts as percent
of total receipts
711110 Theater companies & dinner theatersmCon.
8940 All other receipts 356................................................. 69 693 3.0 69.18974 All other receipts 356............................................... 69 693 3.0 X
7111101 Opera companies 23......................................... D D D
5500 Admissions, including sports teams’ total receipts for admissions tohome games (not including admission taxes) 6........................ D D X
5550 Contract fees from providing entertainment 19.......................... D D X
7111102 Theater companies 1 393........................................ 2 043 181 100.0 72.7
3450 Membership dues and fees 56........................................ 8 742 .4 X5500 Admissions, including sports teams’ total receipts for admissions to
home games (not including admission taxes) 815........................ 1 580 649 77.4 X5550 Contract fees from providing entertainment 605.......................... 295 774 14.5 X5600 Commissions or fees from representation (e.g., from sports or artists’
agents or managers, or event promoters) 39........................... 8 848 .4 X5650 Rental fees for the use of facilities, such as stadiums, or arenas, or
theaters 113........................................................ 18 907 .9 X
5670 This establishment’s share of receipts from concessions or amusementmachines not operated by this establishment 50........................ 2 363 .1 X
5900 Advertising (including endorsement fees) 82............................ 3 027 .1 X7200 Sales of programs 46................................................ 6 464 .3 X
8500 Food and beverage sales 263.......................................... 36 712 1.8 72.78501 Sales of food and nonalcoholic beverages 253......................... 25 408 1.2 X8502 Sales of alcoholic beverages 88..................................... 11 304 .6 X
8600 Merchandise sales 228................................................ 18 354 .9 70.68628 Sales of other merchandise 228...................................... 18 354 .9 X
8940 All other receipts 314................................................. 63 341 3.1 69.08974 All other receipts 314............................................... 63 341 3.1 X
7111103 Dinner theaters 184........................................... D D D
5500 Admissions, including sports teams’ total receipts for admissions tohome games (not including admission taxes) 184........................ D D X
5550 Contract fees from providing entertainment 9.......................... D D X5650 Rental fees for the use of facilities, such as stadiums, or arenas, or
theaters 20........................................................ D D X5670 This establishment’s share of receipts from concessions or amusement
machines not operated by this establishment 10........................ D D X
8500 Food and beverage sales 152.......................................... D D D8501 Sales of food and nonalcoholic beverages 146......................... D D X8502 Sales of alcoholic beverages 136..................................... D D X
8600 Merchandise sales 52................................................ D D D8628 Sales of other merchandise 52...................................... D D X
8940 All other receipts 38................................................. D D D8974 All other receipts 38............................................... D D X
71112 Dance companies 159......................................... 109 384 100.0 60.4
3450 Membership dues and fees 31........................................ 1 594 1.5 X5500 Admissions, including sports teams’ total receipts for admissions to
home games (not including admission taxes) 74........................ 49 280 45.1 X5550 Contract fees from providing entertainment 73.......................... 34 019 31.1 X5600 Commissions or fees from representation (e.g., from sports or artists’
agents or managers, or event promoters) 9........................... 2 566 2.3 X5650 Rental fees for the use of facilities, such as stadiums, or arenas, or
theaters 11........................................................ 1 731 1.6 X5900 Advertising (including endorsement fees) 7............................ 603 .6 X
8500 Food and beverage sales 18.......................................... 7 681 7.0 60.48501 Sales of food and nonalcoholic beverages 18......................... 2 880 2.6 X
8600 Merchandise sales 41................................................ 2 269 2.1 59.28628 Sales of other merchandise 41...................................... 2 269 2.1 X
8940 All other receipts 27................................................. 9 620 8.8 60.48974 All other receipts 27............................................... 9 620 8.8 X
711120 Dance companies 159......................................... 109 384 100.0 60.4
3450 Membership dues and fees 31........................................ 1 594 1.5 X5500 Admissions, including sports teams’ total receipts for admissions to
home games (not including admission taxes) 74........................ 49 280 45.1 X5550 Contract fees from providing entertainment 73.......................... 34 019 31.1 X5600 Commissions or fees from representation (e.g., from sports or artists’
agents or managers, or event promoters) 9........................... 2 566 2.3 X5650 Rental fees for the use of facilities, such as stadiums, or arenas, or
theaters 11........................................................ 1 731 1.6 X5900 Advertising (including endorsement fees) 7............................ 603 .6 X
8500 Food and beverage sales 18.......................................... 7 681 7.0 60.48501 Sales of food and nonalcoholic beverages 18......................... 2 880 2.6 X
8600 Merchandise sales 41................................................ 2 269 2.1 59.28628 Sales of other merchandise 41...................................... 2 269 2.1 X
8940 All other receipts 27................................................. 9 620 8.8 60.48974 All other receipts 27............................................... 9 620 8.8 X
71113 Musical groups & artists 3 369................................... 2 172 497 100.0 65.2
3450 Membership dues and fees 86........................................ 2 215 .1 X5500 Admissions, including sports teams’ total receipts for admissions to
home games (not including admission taxes) 378........................ 215 303 9.9 X5550 Contract fees from providing entertainment 2 964.......................... 1 653 128 76.1 X5600 Commissions or fees from representation (e.g., from sports or artists’
agents or managers, or event promoters) 94........................... 10 061 .5 X5650 Rental fees for the use of facilities, such as stadiums, or arenas, or
theaters 59........................................................ 5 329 .2 X
See footnotes at end of table.
ARTS, ENTERTAINMENT, & RECREATIONmSUBJECT SERIES SUMMARY 11U.S. Census Bureau, 1997 Economic Census Apr. 30, 2001
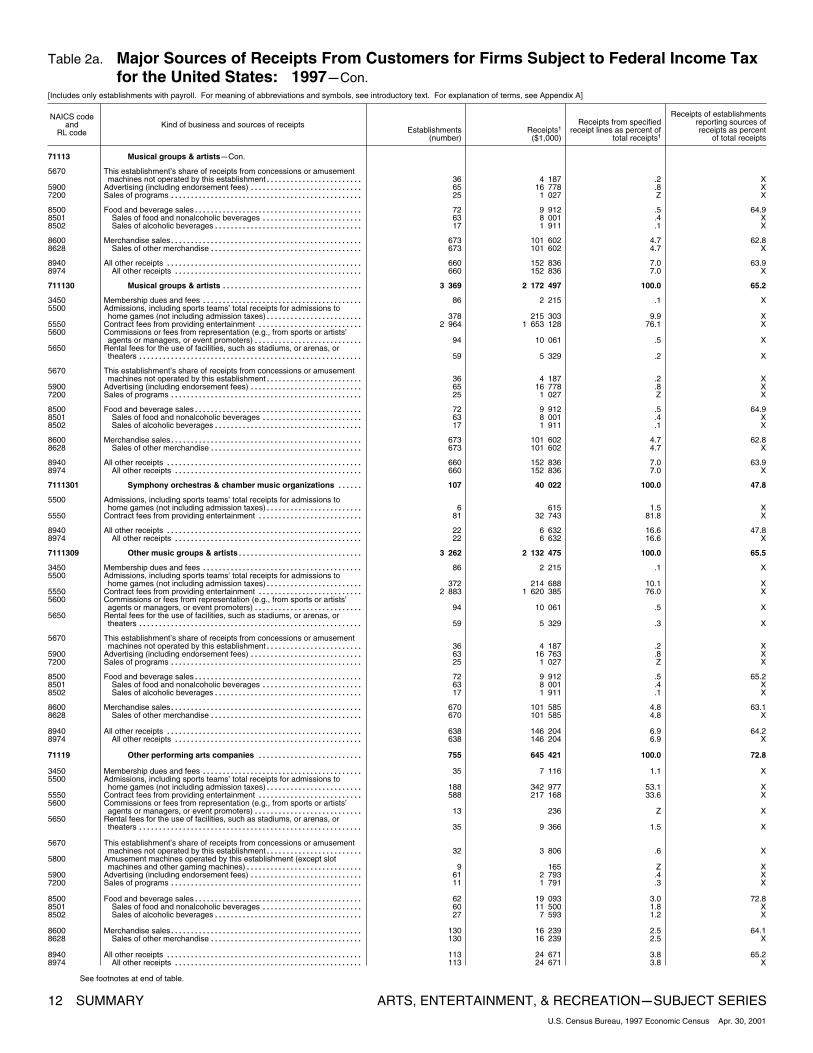
Table 2a. Major Sources of Receipts From Customers for Firms Subject to Federal Income Taxfor the United States: 1997mCon.
[Includes only establishments with payroll. For meaning of abbreviations and symbols, see introductory text. For explanation of terms, see Appendix A]
NAICS codeand
RL codeKind of business and sources of receipts
Establishments(number)
Receipts1
($1,000)
Receipts from specifiedreceipt lines as percent of
total receipts1
Receipts of establishmentsreporting sources ofreceipts as percent
of total receipts
71113 Musical groups & artistsmCon.
5670 This establishment’s share of receipts from concessions or amusementmachines not operated by this establishment 36........................ 4 187 .2 X
5900 Advertising (including endorsement fees) 65............................ 16 778 .8 X7200 Sales of programs 25................................................ 1 027 Z X
8500 Food and beverage sales 72.......................................... 9 912 .5 64.98501 Sales of food and nonalcoholic beverages 63......................... 8 001 .4 X8502 Sales of alcoholic beverages 17..................................... 1 911 .1 X
8600 Merchandise sales 673................................................ 101 602 4.7 62.88628 Sales of other merchandise 673...................................... 101 602 4.7 X
8940 All other receipts 660................................................. 152 836 7.0 63.98974 All other receipts 660............................................... 152 836 7.0 X
711130 Musical groups & artists 3 369................................... 2 172 497 100.0 65.2
3450 Membership dues and fees 86........................................ 2 215 .1 X5500 Admissions, including sports teams’ total receipts for admissions to
home games (not including admission taxes) 378........................ 215 303 9.9 X5550 Contract fees from providing entertainment 2 964.......................... 1 653 128 76.1 X5600 Commissions or fees from representation (e.g., from sports or artists’
agents or managers, or event promoters) 94........................... 10 061 .5 X5650 Rental fees for the use of facilities, such as stadiums, or arenas, or
theaters 59........................................................ 5 329 .2 X
5670 This establishment’s share of receipts from concessions or amusementmachines not operated by this establishment 36........................ 4 187 .2 X
5900 Advertising (including endorsement fees) 65............................ 16 778 .8 X7200 Sales of programs 25................................................ 1 027 Z X
8500 Food and beverage sales 72.......................................... 9 912 .5 64.98501 Sales of food and nonalcoholic beverages 63......................... 8 001 .4 X8502 Sales of alcoholic beverages 17..................................... 1 911 .1 X
8600 Merchandise sales 673................................................ 101 602 4.7 62.88628 Sales of other merchandise 673...................................... 101 602 4.7 X
8940 All other receipts 660................................................. 152 836 7.0 63.98974 All other receipts 660............................................... 152 836 7.0 X
7111301 Symphony orchestras & chamber music organizations 107...... 40 022 100.0 47.8
5500 Admissions, including sports teams’ total receipts for admissions tohome games (not including admission taxes) 6........................ 615 1.5 X
5550 Contract fees from providing entertainment 81.......................... 32 743 81.8 X
8940 All other receipts 22................................................. 6 632 16.6 47.88974 All other receipts 22............................................... 6 632 16.6 X
7111309 Other music groups & artists 3 262............................... 2 132 475 100.0 65.5
3450 Membership dues and fees 86........................................ 2 215 .1 X5500 Admissions, including sports teams’ total receipts for admissions to
home games (not including admission taxes) 372........................ 214 688 10.1 X5550 Contract fees from providing entertainment 2 883.......................... 1 620 385 76.0 X5600 Commissions or fees from representation (e.g., from sports or artists’
agents or managers, or event promoters) 94........................... 10 061 .5 X5650 Rental fees for the use of facilities, such as stadiums, or arenas, or
theaters 59........................................................ 5 329 .3 X
5670 This establishment’s share of receipts from concessions or amusementmachines not operated by this establishment 36........................ 4 187 .2 X
5900 Advertising (including endorsement fees) 63............................ 16 763 .8 X7200 Sales of programs 25................................................ 1 027 Z X
8500 Food and beverage sales 72.......................................... 9 912 .5 65.28501 Sales of food and nonalcoholic beverages 63......................... 8 001 .4 X8502 Sales of alcoholic beverages 17..................................... 1 911 .1 X
8600 Merchandise sales 670................................................ 101 585 4.8 63.18628 Sales of other merchandise 670...................................... 101 585 4.8 X
8940 All other receipts 638................................................. 146 204 6.9 64.28974 All other receipts 638............................................... 146 204 6.9 X
71119 Other performing arts companies 755.......................... 645 421 100.0 72.8
3450 Membership dues and fees 35........................................ 7 116 1.1 X5500 Admissions, including sports teams’ total receipts for admissions to
home games (not including admission taxes) 188........................ 342 977 53.1 X5550 Contract fees from providing entertainment 588.......................... 217 168 33.6 X5600 Commissions or fees from representation (e.g., from sports or artists’
agents or managers, or event promoters) 13........................... 236 Z X5650 Rental fees for the use of facilities, such as stadiums, or arenas, or
theaters 35........................................................ 9 366 1.5 X
5670 This establishment’s share of receipts from concessions or amusementmachines not operated by this establishment 32........................ 3 806 .6 X
5800 Amusement machines operated by this establishment (except slotmachines and other gaming machines) 9............................. 165 Z X
5900 Advertising (including endorsement fees) 61............................ 2 793 .4 X7200 Sales of programs 11................................................ 1 791 .3 X
8500 Food and beverage sales 62.......................................... 19 093 3.0 72.88501 Sales of food and nonalcoholic beverages 60......................... 11 500 1.8 X8502 Sales of alcoholic beverages 27..................................... 7 593 1.2 X
8600 Merchandise sales 130................................................ 16 239 2.5 64.18628 Sales of other merchandise 130...................................... 16 239 2.5 X
8940 All other receipts 113................................................. 24 671 3.8 65.28974 All other receipts 113............................................... 24 671 3.8 X
See footnotes at end of table.
12 SUMMARY ARTS, ENTERTAINMENT, & RECREATIONmSUBJECT SERIESU.S. Census Bureau, 1997 Economic Census Apr. 30, 2001

Table 2a. Major Sources of Receipts From Customers for Firms Subject to Federal Income Taxfor the United States: 1997mCon.
[Includes only establishments with payroll. For meaning of abbreviations and symbols, see introductory text. For explanation of terms, see Appendix A]
NAICS codeand
RL codeKind of business and sources of receipts
Establishments(number)
Receipts1
($1,000)
Receipts from specifiedreceipt lines as percent of
total receipts1
Receipts of establishmentsreporting sources ofreceipts as percent
of total receipts
711190 Other performing arts companies 755.......................... 645 421 100.0 72.8
3450 Membership dues and fees 35........................................ 7 116 1.1 X5500 Admissions, including sports teams’ total receipts for admissions to
home games (not including admission taxes) 188........................ 342 977 53.1 X5550 Contract fees from providing entertainment 588.......................... 217 168 33.6 X5600 Commissions or fees from representation (e.g., from sports or artists’
agents or managers, or event promoters) 13........................... 236 Z X5650 Rental fees for the use of facilities, such as stadiums, or arenas, or
theaters 35........................................................ 9 366 1.5 X
5670 This establishment’s share of receipts from concessions or amusementmachines not operated by this establishment 32........................ 3 806 .6 X
5800 Amusement machines operated by this establishment (except slotmachines and other gaming machines) 9............................. 165 Z X
5900 Advertising (including endorsement fees) 61............................ 2 793 .4 X7200 Sales of programs 11................................................ 1 791 .3 X
8500 Food and beverage sales 62.......................................... 19 093 3.0 72.88501 Sales of food and nonalcoholic beverages 60......................... 11 500 1.8 X8502 Sales of alcoholic beverages 27..................................... 7 593 1.2 X
8600 Merchandise sales 130................................................ 16 239 2.5 64.18628 Sales of other merchandise 130...................................... 16 239 2.5 X
8940 All other receipts 113................................................. 24 671 3.8 65.28974 All other receipts 113............................................... 24 671 3.8 X
7111901 Circuses 70.................................................. 268 351 100.0 81.8
5500 Admissions, including sports teams’ total receipts for admissions tohome games (not including admission taxes) 49........................ 228 971 85.3 X
5550 Contract fees from providing entertainment 22.......................... 24 823 9.3 X
8500 Food and beverage sales 10.......................................... 3 771 1.4 81.88501 Sales of food and nonalcoholic beverages 10......................... 3 771 1.4 X
8600 Merchandise sales 21................................................ 9 965 3.7 32.58628 Sales of other merchandise 21...................................... 9 965 3.7 X
8940 All other receipts 12................................................. 737 .3 11.98974 All other receipts 12............................................... 737 .3 X
7111909 Other performing arts companies (except circuses) 685.......... 377 070 100.0 66.4
3450 Membership dues and fees 35........................................ 7 116 1.9 X5500 Admissions, including sports teams’ total receipts for admissions to
home games (not including admission taxes) 139........................ 114 006 30.2 X5550 Contract fees from providing entertainment 566.......................... 192 345 51.0 X5600 Commissions or fees from representation (e.g., from sports or artists’
agents or managers, or event promoters) 13........................... 236 .1 X5650 Rental fees for the use of facilities, such as stadiums, or arenas, or
theaters 35........................................................ 9 366 2.5 X
5670 This establishment’s share of receipts from concessions or amusementmachines not operated by this establishment 32........................ 3 806 1.0 X
5800 Amusement machines operated by this establishment (except slotmachines and other gaming machines) 6............................. 91 Z X
5900 Advertising (including endorsement fees) 60............................ 2 783 .7 X7200 Sales of programs 11................................................ 1 791 .5 X
8500 Food and beverage sales 52.......................................... 15 322 4.1 66.48501 Sales of food and nonalcoholic beverages 50......................... 7 729 2.1 X8502 Sales of alcoholic beverages 27..................................... 7 593 2.0 X
8600 Merchandise sales 109................................................ 6 274 1.7 66.48628 Sales of other merchandise 109...................................... 6 274 1.7 X
8940 All other receipts 101................................................. 23 934 6.3 65.28974 All other receipts 101............................................... 23 934 6.3 X
7112 Spectator sports 3 881.......................................... 13 656 033 100.0 83.9
5500 Admissions, including sports teams’ total receipts for admissions tohome games (not including admission taxes) 1 341........................ 3 911 478 28.6 X
5530 Sports teams only: Report club’s share of admissions for games awayfrom home 59...................................................... 236 088 1.7 X
5600 Commissions or fees from representation (e.g., from sports or artists’agents or managers, or event promoters) 449........................... 239 909 1.8 X
5650 Rental fees for the use of facilities, such as stadiums, or arenas, ortheaters 467........................................................ 192 967 1.4 X
5670 This establishment’s share of receipts from concessions or amusementmachines not operated by this establishment 393........................ 224 807 1.6 X
5700 Racetrack’s share of receipts from parimutuel betting (not including thestate’s share of such receipts) 207..................................... 2 052 914 15.0 X
5750 Gaming receipts 138.................................................. 469 900 3.4 X5800 Amusement machines operated by this establishment (except slot
machines and other gaming machines) 59............................. 19 418 .1 X5850 Radio and television income 324....................................... 2 523 853 18.5 X5900 Advertising (including endorsement fees) 1 252............................ 1 138 838 8.3 X7200 Sales of programs 613................................................ 96 463 .7 X
8500 Food and beverage sales 801.......................................... 284 126 2.1 82.28501 Sales of food and nonalcoholic beverages 768......................... 222 321 1.6 X8502 Sales of alcoholic beverages 382..................................... 61 802 .5 X
8600 Merchandise sales 1 041................................................ 222 359 1.6 82.08629 Sales of other merchandise 1 041...................................... 222 359 1.6 X
8940 All other receipts 2 805................................................. 2 042 911 15.0 81.78975 All other receipts 2 805............................................... 2 042 911 15.0 X
See footnotes at end of table.
ARTS, ENTERTAINMENT, & RECREATIONmSUBJECT SERIES SUMMARY 13U.S. Census Bureau, 1997 Economic Census Apr. 30, 2001

Table 2a. Major Sources of Receipts From Customers for Firms Subject to Federal Income Taxfor the United States: 1997mCon.
[Includes only establishments with payroll. For meaning of abbreviations and symbols, see introductory text. For explanation of terms, see Appendix A]
NAICS codeand
RL codeKind of business and sources of receipts
Establishments(number)
Receipts1
($1,000)
Receipts from specifiedreceipt lines as percent of
total receipts1
Receipts of establishmentsreporting sources ofreceipts as percent
of total receipts
71121 Spectator sports 3 881.......................................... 13 656 033 100.0 83.9
5500 Admissions, including sports teams’ total receipts for admissions tohome games (not including admission taxes) 1 341........................ 3 911 478 28.6 X
5530 Sports teams only: Report club’s share of admissions for games awayfrom home 59...................................................... 236 088 1.7 X
5600 Commissions or fees from representation (e.g., from sports or artists’agents or managers, or event promoters) 449........................... 239 909 1.8 X
5650 Rental fees for the use of facilities, such as stadiums, or arenas, ortheaters 467........................................................ 192 967 1.4 X
5670 This establishment’s share of receipts from concessions or amusementmachines not operated by this establishment 393........................ 224 807 1.6 X
5700 Racetrack’s share of receipts from parimutuel betting (not including thestate’s share of such receipts) 207..................................... 2 052 914 15.0 X
5750 Gaming receipts 138.................................................. 469 900 3.4 X5800 Amusement machines operated by this establishment (except slot
machines and other gaming machines) 59............................. 19 418 .1 X5850 Radio and television income 324....................................... 2 523 853 18.5 X5900 Advertising (including endorsement fees) 1 252............................ 1 138 838 8.3 X7200 Sales of programs 613................................................ 96 463 .7 X
8500 Food and beverage sales 801.......................................... 284 126 2.1 82.28501 Sales of food and nonalcoholic beverages 768......................... 222 321 1.6 X8502 Sales of alcoholic beverages 382..................................... 61 802 .5 X
8600 Merchandise sales 1 041................................................ 222 359 1.6 82.08629 Sales of other merchandise 1 041...................................... 222 359 1.6 X
8940 All other receipts 2 805................................................. 2 042 911 15.0 81.78975 All other receipts 2 805............................................... 2 042 911 15.0 X
711211 Sports teams & clubs 483...................................... 7 808 684 100.0 86.9
5500 Admissions, including sports teams’ total receipts for admissions tohome games (not including admission taxes) 464........................ 3 177 190 40.7 X
5530 Sports teams only: Report club’s share of admissions for games awayfrom home 59...................................................... 236 088 3.0 X
5600 Commissions or fees from representation (e.g., from sports or artists’agents or managers, or event promoters) 15........................... 6 656 .1 X
5650 Rental fees for the use of facilities, such as stadiums, or arenas, ortheaters 93........................................................ 75 689 1.0 X
5670 This establishment’s share of receipts from concessions or amusementmachines not operated by this establishment 156........................ 189 059 2.4 X
5750 Gaming receipts 19.................................................. 20 413 .3 X5800 Amusement machines operated by this establishment (except slot
machines and other gaming machines) 35............................. 1 427 Z X5850 Radio and television income 210....................................... 2 459 636 31.5 X5900 Advertising (including endorsement fees) 409............................ 633 047 8.1 X7200 Sales of programs 263................................................ 25 587 .3 X
8500 Food and beverage sales 196.......................................... 104 560 1.3 85.28501 Sales of food and nonalcoholic beverages 190......................... 88 923 1.1 X8502 Sales of alcoholic beverages 86..................................... 15 635 .2 X
8600 Merchandise sales 348................................................ 142 573 1.8 85.48629 Sales of other merchandise 348...................................... 142 573 1.8 X
8940 All other receipts 355................................................. 736 759 9.4 84.88975 All other receipts 355............................................... 736 759 9.4 X
7112111 Football clubs 45............................................. 2 503 339 100.0 89.4
5500 Admissions, including sports teams’ total receipts for admissions tohome games (not including admission taxes) 45........................ 724 558 28.9 X
5530 Sports teams only: Report club’s share of admissions for games awayfrom home 32...................................................... 215 650 8.6 X
5650 Rental fees for the use of facilities, such as stadiums, or arenas, ortheaters 11........................................................ 42 889 1.7 X
5670 This establishment’s share of receipts from concessions or amusementmachines not operated by this establishment 18........................ 15 641 .6 X
5850 Radio and television income 35....................................... 1 200 930 48.0 X5900 Advertising (including endorsement fees) 28............................ 63 957 2.6 X7200 Sales of programs 27................................................ 4 958 .2 X
8500 Food and beverage sales 11.......................................... 6 769 .3 89.48501 Sales of food and nonalcoholic beverages 11......................... 6 369 .3 X
8600 Merchandise sales 19................................................ 14 058 .6 89.48629 Sales of other merchandise 19...................................... 14 058 .6 X
8940 All other receipts 42................................................. 213 929 8.5 89.48975 All other receipts 42............................................... 213 929 8.5 X
7112112 Baseball clubs 194............................................ 2 296 558 100.0 90.0
5500 Admissions, including sports teams’ total receipts for admissions tohome games (not including admission taxes) 194........................ 938 802 40.9 X
5650 Rental fees for the use of facilities, such as stadiums, or arenas, ortheaters 33........................................................ 13 262 .6 X
5670 This establishment’s share of receipts from concessions or amusementmachines not operated by this establishment 84........................ 145 467 6.3 X
5800 Amusement machines operated by this establishment (except slotmachines and other gaming machines) 31............................. 1 384 .1 X
5850 Radio and television income 98....................................... 494 470 21.5 X5900 Advertising (including endorsement fees) 186............................ 225 659 9.8 X7200 Sales of programs 138................................................ 12 346 .5 X
8500 Food and beverage sales 120.......................................... 80 571 3.5 88.38501 Sales of food and nonalcoholic beverages 116......................... 69 004 3.0 X8502 Sales of alcoholic beverages 69..................................... 11 567 .5 X
8600 Merchandise sales 146................................................ 64 069 2.8 88.88629 Sales of other merchandise 146...................................... 64 069 2.8 X
8940 All other receipts 155................................................. 307 737 13.4 89.08975 All other receipts 155............................................... 307 737 13.4 X
See footnotes at end of table.
14 SUMMARY ARTS, ENTERTAINMENT, & RECREATIONmSUBJECT SERIESU.S. Census Bureau, 1997 Economic Census Apr. 30, 2001

Table 2a. Major Sources of Receipts From Customers for Firms Subject to Federal Income Taxfor the United States: 1997mCon.
[Includes only establishments with payroll. For meaning of abbreviations and symbols, see introductory text. For explanation of terms, see Appendix A]
NAICS codeand
RL codeKind of business and sources of receipts
Establishments(number)
Receipts1
($1,000)
Receipts from specifiedreceipt lines as percent of
total receipts1
Receipts of establishmentsreporting sources ofreceipts as percent
of total receipts
7112119 Other professional sports clubs 244............................ 3 008 787 100.0 82.6
5500 Admissions, including sports teams’ total receipts for admissions tohome games (not including admission taxes) 225........................ 1 513 830 50.3 X
5530 Sports teams only: Report club’s share of admissions for games awayfrom home 22...................................................... 10 033 .3 X
5600 Commissions or fees from representation (e.g., from sports or artists’agents or managers, or event promoters) 10........................... 5 440 .2 X
5650 Rental fees for the use of facilities, such as stadiums, or arenas, ortheaters 49........................................................ 19 538 .6 X
5670 This establishment’s share of receipts from concessions or amusementmachines not operated by this establishment 54........................ 27 951 .9 X
5750 Gaming receipts 17.................................................. 19 243 .6 X5850 Radio and television income 77....................................... 764 236 25.4 X5900 Advertising (including endorsement fees) 195............................ 343 431 11.4 X7200 Sales of programs 98................................................ 8 283 .3 X
8500 Food and beverage sales 65.......................................... 17 220 .6 79.58501 Sales of food and nonalcoholic beverages 63......................... 13 550 .5 X8502 Sales of alcoholic beverages 16..................................... 3 668 .1 X
8600 Merchandise sales 183................................................ 64 446 2.1 80.08629 Sales of other merchandise 183...................................... 64 446 2.1 X
8940 All other receipts 158................................................. 215 093 7.1 77.98975 All other receipts 158............................................... 215 093 7.1 X
711212 Racetracks 807................................................ 4 142 020 100.0 85.7
5500 Admissions, including sports teams’ total receipts for admissions tohome games (not including admission taxes) 751........................ 700 576 16.9 X
5600 Commissions or fees from representation (e.g., from sports or artists’agents or managers, or event promoters) 73........................... 20 871 .5 X
5650 Rental fees for the use of facilities, such as stadiums, or arenas, ortheaters 318........................................................ 109 180 2.6 X
5670 This establishment’s share of receipts from concessions or amusementmachines not operated by this establishment 186........................ 34 468 .8 X
5700 Racetrack’s share of receipts from parimutuel betting (not including thestate’s share of such receipts) 207..................................... 2 052 914 49.6 X
5750 Gaming receipts 32.................................................. 436 972 10.6 X5800 Amusement machines operated by this establishment (except slot
machines and other gaming machines) 21............................. 17 908 .4 X5850 Radio and television income 77....................................... 59 141 1.4 X5900 Advertising (including endorsement fees) 401............................ 85 088 2.1 X7200 Sales of programs 340................................................ 70 629 1.7 X
8500 Food and beverage sales 538.......................................... 176 461 4.3 84.08501 Sales of food and nonalcoholic beverages 536......................... 131 714 3.2 X8502 Sales of alcoholic beverages 264..................................... 44 747 1.1 X
8600 Merchandise sales 361................................................ 39 803 1.0 83.28629 Sales of other merchandise 361...................................... 39 803 1.0 X
8940 All other receipts 479................................................. 338 009 8.2 83.78975 All other receipts 479............................................... 338 009 8.2 X
7112121 Dog racetrack operation 56................................... 796 069 100.0 99.4
5500 Admissions, including sports teams’ total receipts for admissions tohome games (not including admission taxes) 45........................ 51 730 6.5 X
5650 Rental fees for the use of facilities, such as stadiums, or arenas, ortheaters 14........................................................ 6 557 .8 X
5670 This establishment’s share of receipts from concessions or amusementmachines not operated by this establishment 18........................ 5 333 .7 X
5700 Racetrack’s share of receipts from parimutuel betting (not including thestate’s share of such receipts) 53..................................... 480 160 60.3 X
5750 Gaming receipts 8.................................................. 171 608 21.6 X7200 Sales of programs 44................................................ 12 159 1.5 X
8500 Food and beverage sales 30.......................................... 35 840 4.5 99.48501 Sales of food and nonalcoholic beverages 30......................... 23 035 2.9 X8502 Sales of alcoholic beverages 29..................................... 12 805 1.6 X
8600 Merchandise sales 17................................................ 1 839 .2 99.48629 Sales of other merchandise 17...................................... 1 839 .2 X
8940 All other receipts 47................................................. 12 794 1.6 98.28975 All other receipts 47............................................... 12 794 1.6 X
7112122 Auto racetrack operation 590.................................. 897 600 100.0 76.9
5500 Admissions, including sports teams’ total receipts for admissions tohome games (not including admission taxes) 571........................ 527 643 58.8 X
5600 Commissions or fees from representation (e.g., from sports or artists’agents or managers, or event promoters) 66........................... 11 412 1.3 X
5650 Rental fees for the use of facilities, such as stadiums, or arenas, ortheaters 240........................................................ 67 416 7.5 X
5670 This establishment’s share of receipts from concessions or amusementmachines not operated by this establishment 113........................ 11 413 1.3 X
5800 Amusement machines operated by this establishment (except slotmachines and other gaming machines) 6............................. 80 Z X
5850 Radio and television income 64....................................... 48 940 5.5 X5900 Advertising (including endorsement fees) 338............................ 69 871 7.8 X7200 Sales of programs 165................................................ 8 679 1.0 X
8500 Food and beverage sales 407.......................................... 52 113 5.8 76.48501 Sales of food and nonalcoholic beverages 405......................... 45 359 5.1 X8502 Sales of alcoholic beverages 156..................................... 6 754 .8 X
8600 Merchandise sales 288................................................ 25 673 2.9 76.48629 Sales of other merchandise 288...................................... 25 673 2.9 X
8940 All other receipts 305................................................. 73 139 8.1 76.48975 All other receipts 305............................................... 73 139 8.1 X
See footnotes at end of table.
ARTS, ENTERTAINMENT, & RECREATIONmSUBJECT SERIES SUMMARY 15U.S. Census Bureau, 1997 Economic Census Apr. 30, 2001
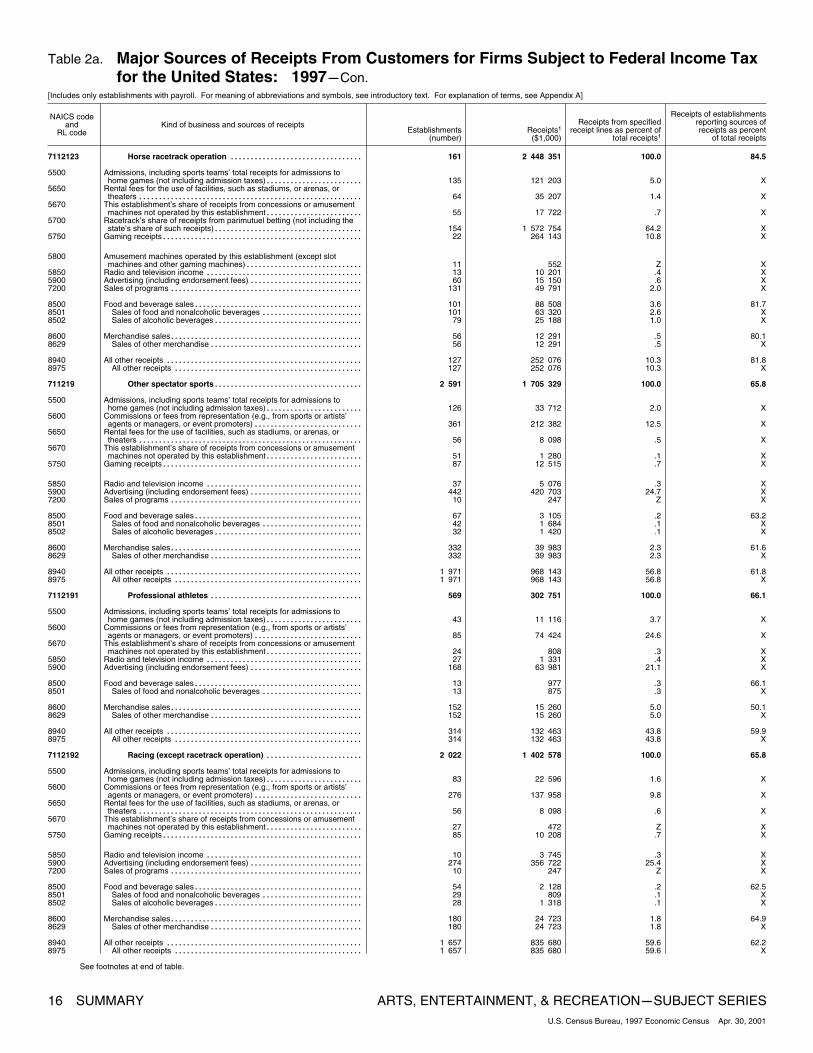
Table 2a. Major Sources of Receipts From Customers for Firms Subject to Federal Income Taxfor the United States: 1997mCon.
[Includes only establishments with payroll. For meaning of abbreviations and symbols, see introductory text. For explanation of terms, see Appendix A]
NAICS codeand
RL codeKind of business and sources of receipts
Establishments(number)
Receipts1
($1,000)
Receipts from specifiedreceipt lines as percent of
total receipts1
Receipts of establishmentsreporting sources ofreceipts as percent
of total receipts
7112123 Horse racetrack operation 161................................. 2 448 351 100.0 84.5
5500 Admissions, including sports teams’ total receipts for admissions tohome games (not including admission taxes) 135........................ 121 203 5.0 X
5650 Rental fees for the use of facilities, such as stadiums, or arenas, ortheaters 64........................................................ 35 207 1.4 X
5670 This establishment’s share of receipts from concessions or amusementmachines not operated by this establishment 55........................ 17 722 .7 X
5700 Racetrack’s share of receipts from parimutuel betting (not including thestate’s share of such receipts) 154..................................... 1 572 754 64.2 X
5750 Gaming receipts 22.................................................. 264 143 10.8 X
5800 Amusement machines operated by this establishment (except slotmachines and other gaming machines) 11............................. 552 Z X
5850 Radio and television income 13....................................... 10 201 .4 X5900 Advertising (including endorsement fees) 60............................ 15 150 .6 X7200 Sales of programs 131................................................ 49 791 2.0 X
8500 Food and beverage sales 101.......................................... 88 508 3.6 81.78501 Sales of food and nonalcoholic beverages 101......................... 63 320 2.6 X8502 Sales of alcoholic beverages 79..................................... 25 188 1.0 X
8600 Merchandise sales 56................................................ 12 291 .5 80.18629 Sales of other merchandise 56...................................... 12 291 .5 X
8940 All other receipts 127................................................. 252 076 10.3 81.88975 All other receipts 127............................................... 252 076 10.3 X
711219 Other spectator sports 2 591..................................... 1 705 329 100.0 65.8
5500 Admissions, including sports teams’ total receipts for admissions tohome games (not including admission taxes) 126........................ 33 712 2.0 X
5600 Commissions or fees from representation (e.g., from sports or artists’agents or managers, or event promoters) 361........................... 212 382 12.5 X
5650 Rental fees for the use of facilities, such as stadiums, or arenas, ortheaters 56........................................................ 8 098 .5 X
5670 This establishment’s share of receipts from concessions or amusementmachines not operated by this establishment 51........................ 1 280 .1 X
5750 Gaming receipts 87.................................................. 12 515 .7 X
5850 Radio and television income 37....................................... 5 076 .3 X5900 Advertising (including endorsement fees) 442............................ 420 703 24.7 X7200 Sales of programs 10................................................ 247 Z X
8500 Food and beverage sales 67.......................................... 3 105 .2 63.28501 Sales of food and nonalcoholic beverages 42......................... 1 684 .1 X8502 Sales of alcoholic beverages 32..................................... 1 420 .1 X
8600 Merchandise sales 332................................................ 39 983 2.3 61.68629 Sales of other merchandise 332...................................... 39 983 2.3 X
8940 All other receipts 1 971................................................. 968 143 56.8 61.88975 All other receipts 1 971............................................... 968 143 56.8 X
7112191 Professional athletes 569...................................... 302 751 100.0 66.1
5500 Admissions, including sports teams’ total receipts for admissions tohome games (not including admission taxes) 43........................ 11 116 3.7 X
5600 Commissions or fees from representation (e.g., from sports or artists’agents or managers, or event promoters) 85........................... 74 424 24.6 X
5670 This establishment’s share of receipts from concessions or amusementmachines not operated by this establishment 24........................ 808 .3 X
5850 Radio and television income 27....................................... 1 331 .4 X5900 Advertising (including endorsement fees) 168............................ 63 981 21.1 X
8500 Food and beverage sales 13.......................................... 977 .3 66.18501 Sales of food and nonalcoholic beverages 13......................... 875 .3 X
8600 Merchandise sales 152................................................ 15 260 5.0 50.18629 Sales of other merchandise 152...................................... 15 260 5.0 X
8940 All other receipts 314................................................. 132 463 43.8 59.98975 All other receipts 314............................................... 132 463 43.8 X
7112192 Racing (except racetrack operation) 2 022........................ 1 402 578 100.0 65.8
5500 Admissions, including sports teams’ total receipts for admissions tohome games (not including admission taxes) 83........................ 22 596 1.6 X
5600 Commissions or fees from representation (e.g., from sports or artists’agents or managers, or event promoters) 276........................... 137 958 9.8 X
5650 Rental fees for the use of facilities, such as stadiums, or arenas, ortheaters 56........................................................ 8 098 .6 X
5670 This establishment’s share of receipts from concessions or amusementmachines not operated by this establishment 27........................ 472 Z X
5750 Gaming receipts 85.................................................. 10 208 .7 X
5850 Radio and television income 10....................................... 3 745 .3 X5900 Advertising (including endorsement fees) 274............................ 356 722 25.4 X7200 Sales of programs 10................................................ 247 Z X
8500 Food and beverage sales 54.......................................... 2 128 .2 62.58501 Sales of food and nonalcoholic beverages 29......................... 809 .1 X8502 Sales of alcoholic beverages 28..................................... 1 318 .1 X
8600 Merchandise sales 180................................................ 24 723 1.8 64.98629 Sales of other merchandise 180...................................... 24 723 1.8 X
8940 All other receipts 1 657................................................. 835 680 59.6 62.28975 All other receipts 1 657............................................... 835 680 59.6 X
See footnotes at end of table.
16 SUMMARY ARTS, ENTERTAINMENT, & RECREATIONmSUBJECT SERIESU.S. Census Bureau, 1997 Economic Census Apr. 30, 2001
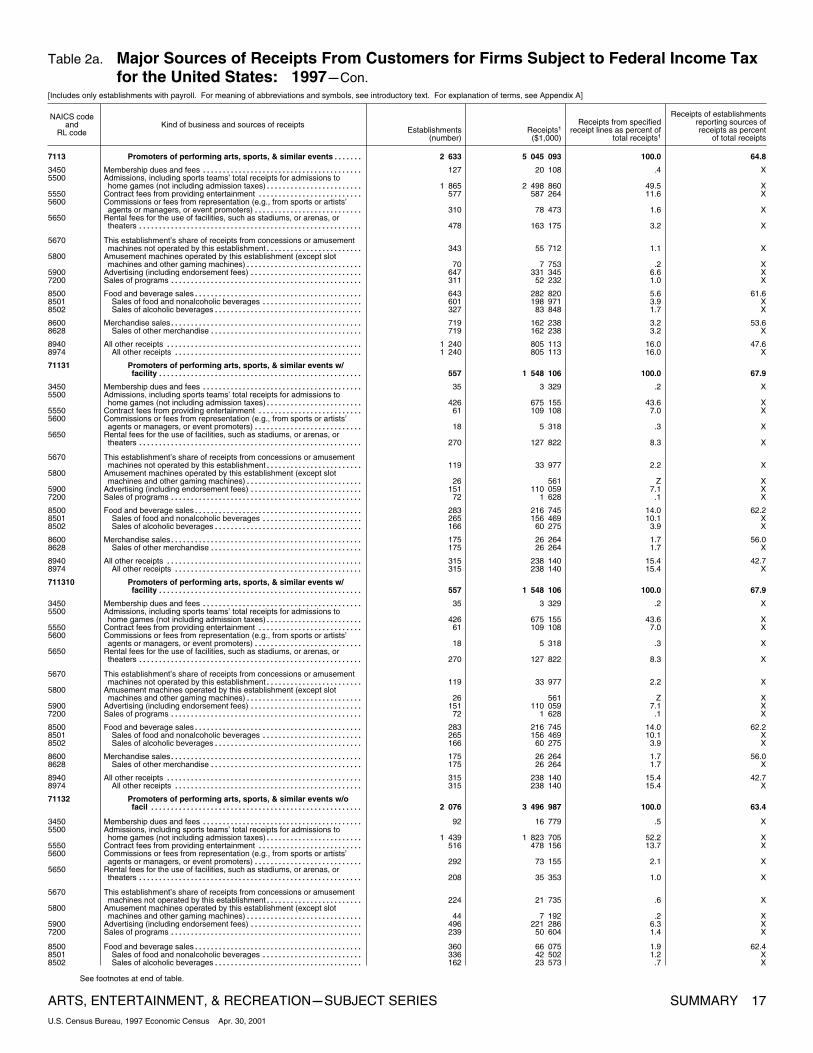
Table 2a. Major Sources of Receipts From Customers for Firms Subject to Federal Income Taxfor the United States: 1997mCon.
[Includes only establishments with payroll. For meaning of abbreviations and symbols, see introductory text. For explanation of terms, see Appendix A]
NAICS codeand
RL codeKind of business and sources of receipts
Establishments(number)
Receipts1
($1,000)
Receipts from specifiedreceipt lines as percent of
total receipts1
Receipts of establishmentsreporting sources ofreceipts as percent
of total receipts
7113 Promoters of performing arts, sports, & similar events 2 633....... 5 045 093 100.0 64.8
3450 Membership dues and fees 127........................................ 20 108 .4 X5500 Admissions, including sports teams’ total receipts for admissions to
home games (not including admission taxes) 1 865........................ 2 498 860 49.5 X5550 Contract fees from providing entertainment 577.......................... 587 264 11.6 X5600 Commissions or fees from representation (e.g., from sports or artists’
agents or managers, or event promoters) 310........................... 78 473 1.6 X5650 Rental fees for the use of facilities, such as stadiums, or arenas, or
theaters 478........................................................ 163 175 3.2 X
5670 This establishment’s share of receipts from concessions or amusementmachines not operated by this establishment 343........................ 55 712 1.1 X
5800 Amusement machines operated by this establishment (except slotmachines and other gaming machines) 70............................. 7 753 .2 X
5900 Advertising (including endorsement fees) 647............................ 331 345 6.6 X7200 Sales of programs 311................................................ 52 232 1.0 X
8500 Food and beverage sales 643.......................................... 282 820 5.6 61.68501 Sales of food and nonalcoholic beverages 601......................... 198 971 3.9 X8502 Sales of alcoholic beverages 327..................................... 83 848 1.7 X
8600 Merchandise sales 719................................................ 162 238 3.2 53.68628 Sales of other merchandise 719...................................... 162 238 3.2 X
8940 All other receipts 1 240................................................. 805 113 16.0 47.68974 All other receipts 1 240............................................... 805 113 16.0 X
71131 Promoters of performing arts, sports, & similar events w/facility 557................................................... 1 548 106 100.0 67.9
3450 Membership dues and fees 35........................................ 3 329 .2 X5500 Admissions, including sports teams’ total receipts for admissions to
home games (not including admission taxes) 426........................ 675 155 43.6 X5550 Contract fees from providing entertainment 61.......................... 109 108 7.0 X5600 Commissions or fees from representation (e.g., from sports or artists’
agents or managers, or event promoters) 18........................... 5 318 .3 X5650 Rental fees for the use of facilities, such as stadiums, or arenas, or
theaters 270........................................................ 127 822 8.3 X
5670 This establishment’s share of receipts from concessions or amusementmachines not operated by this establishment 119........................ 33 977 2.2 X
5800 Amusement machines operated by this establishment (except slotmachines and other gaming machines) 26............................. 561 Z X
5900 Advertising (including endorsement fees) 151............................ 110 059 7.1 X7200 Sales of programs 72................................................ 1 628 .1 X
8500 Food and beverage sales 283.......................................... 216 745 14.0 62.28501 Sales of food and nonalcoholic beverages 265......................... 156 469 10.1 X8502 Sales of alcoholic beverages 166..................................... 60 275 3.9 X
8600 Merchandise sales 175................................................ 26 264 1.7 56.08628 Sales of other merchandise 175...................................... 26 264 1.7 X
8940 All other receipts 315................................................. 238 140 15.4 42.78974 All other receipts 315............................................... 238 140 15.4 X
711310 Promoters of performing arts, sports, & similar events w/facility 557................................................... 1 548 106 100.0 67.9
3450 Membership dues and fees 35........................................ 3 329 .2 X5500 Admissions, including sports teams’ total receipts for admissions to
home games (not including admission taxes) 426........................ 675 155 43.6 X5550 Contract fees from providing entertainment 61.......................... 109 108 7.0 X5600 Commissions or fees from representation (e.g., from sports or artists’
agents or managers, or event promoters) 18........................... 5 318 .3 X5650 Rental fees for the use of facilities, such as stadiums, or arenas, or
theaters 270........................................................ 127 822 8.3 X
5670 This establishment’s share of receipts from concessions or amusementmachines not operated by this establishment 119........................ 33 977 2.2 X
5800 Amusement machines operated by this establishment (except slotmachines and other gaming machines) 26............................. 561 Z X
5900 Advertising (including endorsement fees) 151............................ 110 059 7.1 X7200 Sales of programs 72................................................ 1 628 .1 X
8500 Food and beverage sales 283.......................................... 216 745 14.0 62.28501 Sales of food and nonalcoholic beverages 265......................... 156 469 10.1 X8502 Sales of alcoholic beverages 166..................................... 60 275 3.9 X
8600 Merchandise sales 175................................................ 26 264 1.7 56.08628 Sales of other merchandise 175...................................... 26 264 1.7 X
8940 All other receipts 315................................................. 238 140 15.4 42.78974 All other receipts 315............................................... 238 140 15.4 X
71132 Promoters of performing arts, sports, & similar events w/ofacil 2 076..................................................... 3 496 987 100.0 63.4
3450 Membership dues and fees 92........................................ 16 779 .5 X5500 Admissions, including sports teams’ total receipts for admissions to
home games (not including admission taxes) 1 439........................ 1 823 705 52.2 X5550 Contract fees from providing entertainment 516.......................... 478 156 13.7 X5600 Commissions or fees from representation (e.g., from sports or artists’
agents or managers, or event promoters) 292........................... 73 155 2.1 X5650 Rental fees for the use of facilities, such as stadiums, or arenas, or
theaters 208........................................................ 35 353 1.0 X
5670 This establishment’s share of receipts from concessions or amusementmachines not operated by this establishment 224........................ 21 735 .6 X
5800 Amusement machines operated by this establishment (except slotmachines and other gaming machines) 44............................. 7 192 .2 X
5900 Advertising (including endorsement fees) 496............................ 221 286 6.3 X7200 Sales of programs 239................................................ 50 604 1.4 X
8500 Food and beverage sales 360.......................................... 66 075 1.9 62.48501 Sales of food and nonalcoholic beverages 336......................... 42 502 1.2 X8502 Sales of alcoholic beverages 162..................................... 23 573 .7 X
See footnotes at end of table.
ARTS, ENTERTAINMENT, & RECREATIONmSUBJECT SERIES SUMMARY 17U.S. Census Bureau, 1997 Economic Census Apr. 30, 2001
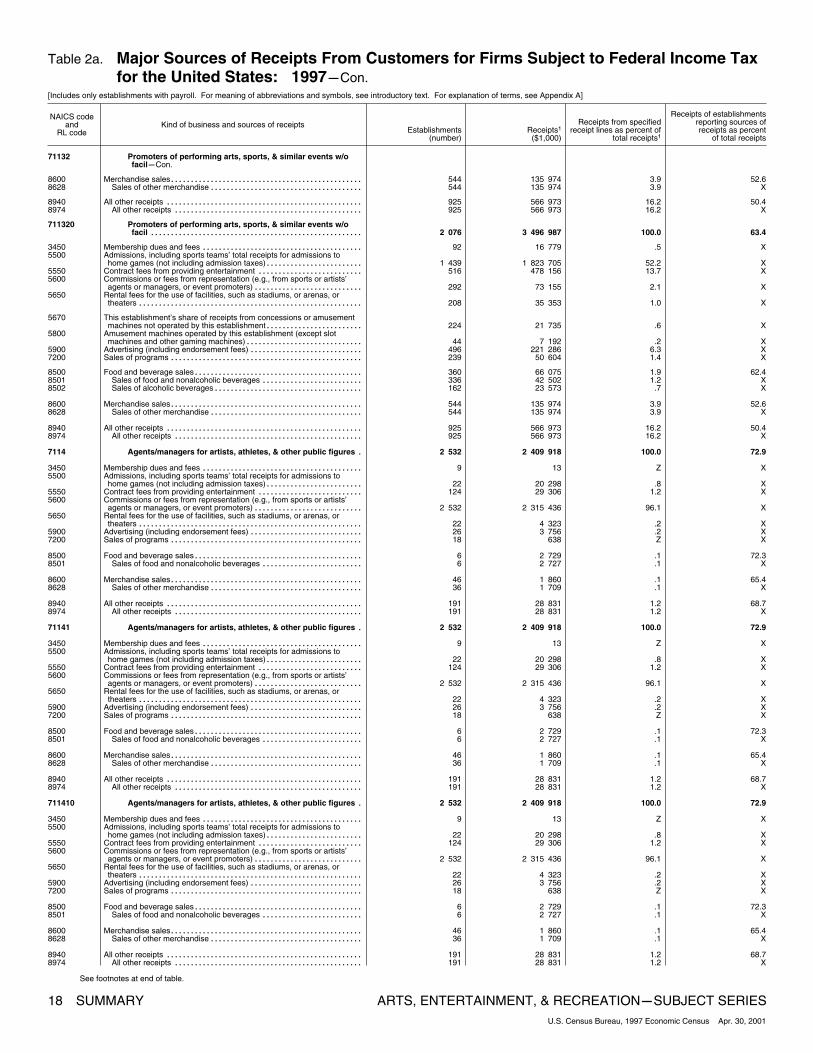
Table 2a. Major Sources of Receipts From Customers for Firms Subject to Federal Income Taxfor the United States: 1997mCon.
[Includes only establishments with payroll. For meaning of abbreviations and symbols, see introductory text. For explanation of terms, see Appendix A]
NAICS codeand
RL codeKind of business and sources of receipts
Establishments(number)
Receipts1
($1,000)
Receipts from specifiedreceipt lines as percent of
total receipts1
Receipts of establishmentsreporting sources ofreceipts as percent
of total receipts
71132 Promoters of performing arts, sports, & similar events w/ofacilmCon.
8600 Merchandise sales 544................................................ 135 974 3.9 52.68628 Sales of other merchandise 544...................................... 135 974 3.9 X
8940 All other receipts 925................................................. 566 973 16.2 50.48974 All other receipts 925............................................... 566 973 16.2 X
711320 Promoters of performing arts, sports, & similar events w/ofacil 2 076..................................................... 3 496 987 100.0 63.4
3450 Membership dues and fees 92........................................ 16 779 .5 X5500 Admissions, including sports teams’ total receipts for admissions to
home games (not including admission taxes) 1 439........................ 1 823 705 52.2 X5550 Contract fees from providing entertainment 516.......................... 478 156 13.7 X5600 Commissions or fees from representation (e.g., from sports or artists’
agents or managers, or event promoters) 292........................... 73 155 2.1 X5650 Rental fees for the use of facilities, such as stadiums, or arenas, or
theaters 208........................................................ 35 353 1.0 X
5670 This establishment’s share of receipts from concessions or amusementmachines not operated by this establishment 224........................ 21 735 .6 X
5800 Amusement machines operated by this establishment (except slotmachines and other gaming machines) 44............................. 7 192 .2 X
5900 Advertising (including endorsement fees) 496............................ 221 286 6.3 X7200 Sales of programs 239................................................ 50 604 1.4 X
8500 Food and beverage sales 360.......................................... 66 075 1.9 62.48501 Sales of food and nonalcoholic beverages 336......................... 42 502 1.2 X8502 Sales of alcoholic beverages 162..................................... 23 573 .7 X
8600 Merchandise sales 544................................................ 135 974 3.9 52.68628 Sales of other merchandise 544...................................... 135 974 3.9 X
8940 All other receipts 925................................................. 566 973 16.2 50.48974 All other receipts 925............................................... 566 973 16.2 X
7114 Agents/managers for artists, athletes, & other public figures 2 532. 2 409 918 100.0 72.9
3450 Membership dues and fees 9........................................ 13 Z X5500 Admissions, including sports teams’ total receipts for admissions to
home games (not including admission taxes) 22........................ 20 298 .8 X5550 Contract fees from providing entertainment 124.......................... 29 306 1.2 X5600 Commissions or fees from representation (e.g., from sports or artists’
agents or managers, or event promoters) 2 532........................... 2 315 436 96.1 X5650 Rental fees for the use of facilities, such as stadiums, or arenas, or
theaters 22........................................................ 4 323 .2 X5900 Advertising (including endorsement fees) 26............................ 3 756 .2 X7200 Sales of programs 18................................................ 638 Z X
8500 Food and beverage sales 6.......................................... 2 729 .1 72.38501 Sales of food and nonalcoholic beverages 6......................... 2 727 .1 X
8600 Merchandise sales 46................................................ 1 860 .1 65.48628 Sales of other merchandise 36...................................... 1 709 .1 X
8940 All other receipts 191................................................. 28 831 1.2 68.78974 All other receipts 191............................................... 28 831 1.2 X
71141 Agents/managers for artists, athletes, & other public figures 2 532. 2 409 918 100.0 72.9
3450 Membership dues and fees 9........................................ 13 Z X5500 Admissions, including sports teams’ total receipts for admissions to
home games (not including admission taxes) 22........................ 20 298 .8 X5550 Contract fees from providing entertainment 124.......................... 29 306 1.2 X5600 Commissions or fees from representation (e.g., from sports or artists’
agents or managers, or event promoters) 2 532........................... 2 315 436 96.1 X5650 Rental fees for the use of facilities, such as stadiums, or arenas, or
theaters 22........................................................ 4 323 .2 X5900 Advertising (including endorsement fees) 26............................ 3 756 .2 X7200 Sales of programs 18................................................ 638 Z X
8500 Food and beverage sales 6.......................................... 2 729 .1 72.38501 Sales of food and nonalcoholic beverages 6......................... 2 727 .1 X
8600 Merchandise sales 46................................................ 1 860 .1 65.48628 Sales of other merchandise 36...................................... 1 709 .1 X
8940 All other receipts 191................................................. 28 831 1.2 68.78974 All other receipts 191............................................... 28 831 1.2 X
711410 Agents/managers for artists, athletes, & other public figures 2 532. 2 409 918 100.0 72.9
3450 Membership dues and fees 9........................................ 13 Z X5500 Admissions, including sports teams’ total receipts for admissions to
home games (not including admission taxes) 22........................ 20 298 .8 X5550 Contract fees from providing entertainment 124.......................... 29 306 1.2 X5600 Commissions or fees from representation (e.g., from sports or artists’
agents or managers, or event promoters) 2 532........................... 2 315 436 96.1 X5650 Rental fees for the use of facilities, such as stadiums, or arenas, or
theaters 22........................................................ 4 323 .2 X5900 Advertising (including endorsement fees) 26............................ 3 756 .2 X7200 Sales of programs 18................................................ 638 Z X
8500 Food and beverage sales 6.......................................... 2 729 .1 72.38501 Sales of food and nonalcoholic beverages 6......................... 2 727 .1 X
8600 Merchandise sales 46................................................ 1 860 .1 65.48628 Sales of other merchandise 36...................................... 1 709 .1 X
8940 All other receipts 191................................................. 28 831 1.2 68.78974 All other receipts 191............................................... 28 831 1.2 X
See footnotes at end of table.
18 SUMMARY ARTS, ENTERTAINMENT, & RECREATIONmSUBJECT SERIESU.S. Census Bureau, 1997 Economic Census Apr. 30, 2001
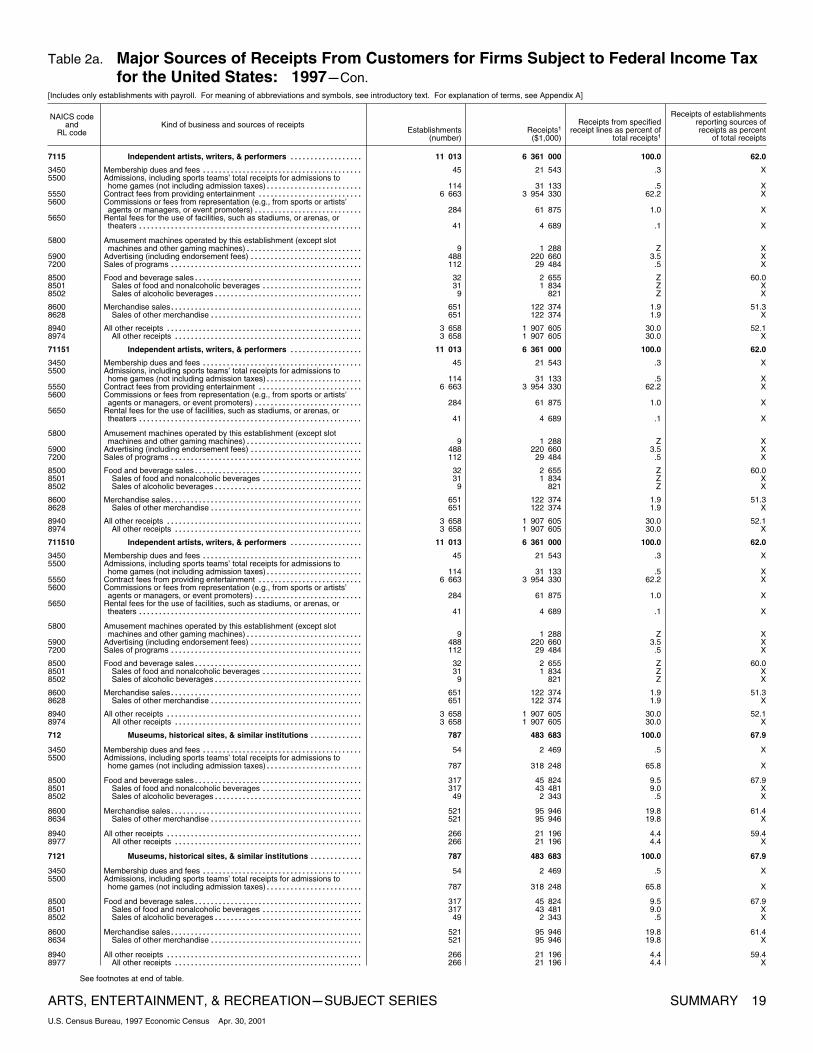
Table 2a. Major Sources of Receipts From Customers for Firms Subject to Federal Income Taxfor the United States: 1997mCon.
[Includes only establishments with payroll. For meaning of abbreviations and symbols, see introductory text. For explanation of terms, see Appendix A]
NAICS codeand
RL codeKind of business and sources of receipts
Establishments(number)
Receipts1
($1,000)
Receipts from specifiedreceipt lines as percent of
total receipts1
Receipts of establishmentsreporting sources ofreceipts as percent
of total receipts
7115 Independent artists, writers, & performers 11 013.................. 6 361 000 100.0 62.0
3450 Membership dues and fees 45........................................ 21 543 .3 X5500 Admissions, including sports teams’ total receipts for admissions to
home games (not including admission taxes) 114........................ 31 133 .5 X5550 Contract fees from providing entertainment 6 663.......................... 3 954 330 62.2 X5600 Commissions or fees from representation (e.g., from sports or artists’
agents or managers, or event promoters) 284........................... 61 875 1.0 X5650 Rental fees for the use of facilities, such as stadiums, or arenas, or
theaters 41........................................................ 4 689 .1 X
5800 Amusement machines operated by this establishment (except slotmachines and other gaming machines) 9............................. 1 288 Z X
5900 Advertising (including endorsement fees) 488............................ 220 660 3.5 X7200 Sales of programs 112................................................ 29 484 .5 X
8500 Food and beverage sales 32.......................................... 2 655 Z 60.08501 Sales of food and nonalcoholic beverages 31......................... 1 834 Z X8502 Sales of alcoholic beverages 9..................................... 821 Z X
8600 Merchandise sales 651................................................ 122 374 1.9 51.38628 Sales of other merchandise 651...................................... 122 374 1.9 X
8940 All other receipts 3 658................................................. 1 907 605 30.0 52.18974 All other receipts 3 658............................................... 1 907 605 30.0 X
71151 Independent artists, writers, & performers 11 013.................. 6 361 000 100.0 62.0
3450 Membership dues and fees 45........................................ 21 543 .3 X5500 Admissions, including sports teams’ total receipts for admissions to
home games (not including admission taxes) 114........................ 31 133 .5 X5550 Contract fees from providing entertainment 6 663.......................... 3 954 330 62.2 X5600 Commissions or fees from representation (e.g., from sports or artists’
agents or managers, or event promoters) 284........................... 61 875 1.0 X5650 Rental fees for the use of facilities, such as stadiums, or arenas, or
theaters 41........................................................ 4 689 .1 X
5800 Amusement machines operated by this establishment (except slotmachines and other gaming machines) 9............................. 1 288 Z X
5900 Advertising (including endorsement fees) 488............................ 220 660 3.5 X7200 Sales of programs 112................................................ 29 484 .5 X
8500 Food and beverage sales 32.......................................... 2 655 Z 60.08501 Sales of food and nonalcoholic beverages 31......................... 1 834 Z X8502 Sales of alcoholic beverages 9..................................... 821 Z X
8600 Merchandise sales 651................................................ 122 374 1.9 51.38628 Sales of other merchandise 651...................................... 122 374 1.9 X
8940 All other receipts 3 658................................................. 1 907 605 30.0 52.18974 All other receipts 3 658............................................... 1 907 605 30.0 X
711510 Independent artists, writers, & performers 11 013.................. 6 361 000 100.0 62.0
3450 Membership dues and fees 45........................................ 21 543 .3 X5500 Admissions, including sports teams’ total receipts for admissions to
home games (not including admission taxes) 114........................ 31 133 .5 X5550 Contract fees from providing entertainment 6 663.......................... 3 954 330 62.2 X5600 Commissions or fees from representation (e.g., from sports or artists’
agents or managers, or event promoters) 284........................... 61 875 1.0 X5650 Rental fees for the use of facilities, such as stadiums, or arenas, or
theaters 41........................................................ 4 689 .1 X
5800 Amusement machines operated by this establishment (except slotmachines and other gaming machines) 9............................. 1 288 Z X
5900 Advertising (including endorsement fees) 488............................ 220 660 3.5 X7200 Sales of programs 112................................................ 29 484 .5 X
8500 Food and beverage sales 32.......................................... 2 655 Z 60.08501 Sales of food and nonalcoholic beverages 31......................... 1 834 Z X8502 Sales of alcoholic beverages 9..................................... 821 Z X
8600 Merchandise sales 651................................................ 122 374 1.9 51.38628 Sales of other merchandise 651...................................... 122 374 1.9 X
8940 All other receipts 3 658................................................. 1 907 605 30.0 52.18974 All other receipts 3 658............................................... 1 907 605 30.0 X
712 Museums, historical sites, & similar institutions 787............. 483 683 100.0 67.9
3450 Membership dues and fees 54........................................ 2 469 .5 X5500 Admissions, including sports teams’ total receipts for admissions to
home games (not including admission taxes) 787........................ 318 248 65.8 X
8500 Food and beverage sales 317.......................................... 45 824 9.5 67.98501 Sales of food and nonalcoholic beverages 317......................... 43 481 9.0 X8502 Sales of alcoholic beverages 49..................................... 2 343 .5 X
8600 Merchandise sales 521................................................ 95 946 19.8 61.48634 Sales of other merchandise 521...................................... 95 946 19.8 X
8940 All other receipts 266................................................. 21 196 4.4 59.48977 All other receipts 266............................................... 21 196 4.4 X
7121 Museums, historical sites, & similar institutions 787............. 483 683 100.0 67.9
3450 Membership dues and fees 54........................................ 2 469 .5 X5500 Admissions, including sports teams’ total receipts for admissions to
home games (not including admission taxes) 787........................ 318 248 65.8 X
8500 Food and beverage sales 317.......................................... 45 824 9.5 67.98501 Sales of food and nonalcoholic beverages 317......................... 43 481 9.0 X8502 Sales of alcoholic beverages 49..................................... 2 343 .5 X
8600 Merchandise sales 521................................................ 95 946 19.8 61.48634 Sales of other merchandise 521...................................... 95 946 19.8 X
8940 All other receipts 266................................................. 21 196 4.4 59.48977 All other receipts 266............................................... 21 196 4.4 X
See footnotes at end of table.
ARTS, ENTERTAINMENT, & RECREATIONmSUBJECT SERIES SUMMARY 19U.S. Census Bureau, 1997 Economic Census Apr. 30, 2001

Table 2a. Major Sources of Receipts From Customers for Firms Subject to Federal Income Taxfor the United States: 1997mCon.
[Includes only establishments with payroll. For meaning of abbreviations and symbols, see introductory text. For explanation of terms, see Appendix A]
NAICS codeand
RL codeKind of business and sources of receipts
Establishments(number)
Receipts1
($1,000)
Receipts from specifiedreceipt lines as percent of
total receipts1
Receipts of establishmentsreporting sources ofreceipts as percent
of total receipts
71211 Museums 426................................................. 259 215 100.0 59.5
3450 Membership dues and fees 39........................................ 2 021 .8 X5500 Admissions, including sports teams’ total receipts for admissions to
home games (not including admission taxes) 426........................ 156 060 60.2 X
8500 Food and beverage sales 114.......................................... 28 564 11.0 59.58501 Sales of food and nonalcoholic beverages 114......................... 26 649 10.3 X8502 Sales of alcoholic beverages 27..................................... 1 915 .7 X
8600 Merchandise sales 300................................................ 63 077 24.3 55.78634 Sales of other merchandise 300...................................... 63 077 24.3 X
8940 All other receipts 129................................................. 9 493 3.7 55.38977 All other receipts 129............................................... 9 493 3.7 X
712110 Museums 426................................................. 259 215 100.0 59.5
3450 Membership dues and fees 39........................................ 2 021 .8 X5500 Admissions, including sports teams’ total receipts for admissions to
home games (not including admission taxes) 426........................ 156 060 60.2 X
8500 Food and beverage sales 114.......................................... 28 564 11.0 59.58501 Sales of food and nonalcoholic beverages 114......................... 26 649 10.3 X8502 Sales of alcoholic beverages 27..................................... 1 915 .7 X
8600 Merchandise sales 300................................................ 63 077 24.3 55.78634 Sales of other merchandise 300...................................... 63 077 24.3 X
8940 All other receipts 129................................................. 9 493 3.7 55.38977 All other receipts 129............................................... 9 493 3.7 X
71212 Historical sites 78............................................ 27 462 100.0 63.3
5500 Admissions, including sports teams’ total receipts for admissions tohome games (not including admission taxes) 78........................ 21 319 77.6 X
8500 Food and beverage sales 16.......................................... 2 238 8.1 63.38501 Sales of food and nonalcoholic beverages 16......................... 2 091 7.6 X8502 Sales of alcoholic beverages 7..................................... 147 .5 X
8600 Merchandise sales 22................................................ 2 564 9.3 63.38634 Sales of other merchandise 22...................................... 2 564 9.3 X
8940 All other receipts 19................................................. 1 286 4.7 63.38977 All other receipts 19............................................... 1 286 4.7 X
712120 Historical sites 78............................................ 27 462 100.0 63.3
5500 Admissions, including sports teams’ total receipts for admissions tohome games (not including admission taxes) 78........................ 21 319 77.6 X
8500 Food and beverage sales 16.......................................... 2 238 8.1 63.38501 Sales of food and nonalcoholic beverages 16......................... 2 091 7.6 X8502 Sales of alcoholic beverages 7..................................... 147 .5 X
8600 Merchandise sales 22................................................ 2 564 9.3 63.38634 Sales of other merchandise 22...................................... 2 564 9.3 X
8940 All other receipts 19................................................. 1 286 4.7 63.38977 All other receipts 19............................................... 1 286 4.7 X
71213 Zoos & botanical gardens 117.................................. 96 915 100.0 74.9
3450 Membership dues and fees 6........................................ 327 .3 X5500 Admissions, including sports teams’ total receipts for admissions to
home games (not including admission taxes) 117........................ 74 071 76.4 X
8500 Food and beverage sales 58.......................................... 8 108 8.4 74.98501 Sales of food and nonalcoholic beverages 58......................... 7 961 8.2 X8502 Sales of alcoholic beverages 7..................................... 147 .2 X
8600 Merchandise sales 63................................................ 8 555 8.8 61.58634 Sales of other merchandise 63...................................... 8 555 8.8 X
8940 All other receipts 44................................................. 5 854 6.0 49.08977 All other receipts 44............................................... 5 854 6.0 X
712130 Zoos & botanical gardens 117.................................. 96 915 100.0 74.9
3450 Membership dues and fees 6........................................ 327 .3 X5500 Admissions, including sports teams’ total receipts for admissions to
home games (not including admission taxes) 117........................ 74 071 76.4 X
8500 Food and beverage sales 58.......................................... 8 108 8.4 74.98501 Sales of food and nonalcoholic beverages 58......................... 7 961 8.2 X8502 Sales of alcoholic beverages 7..................................... 147 .2 X
8600 Merchandise sales 63................................................ 8 555 8.8 61.58634 Sales of other merchandise 63...................................... 8 555 8.8 X
8940 All other receipts 44................................................. 5 854 6.0 49.08977 All other receipts 44............................................... 5 854 6.0 X
71219 Nature parks & other similar institutions 166.................... 100 091 100.0 83.9
5500 Admissions, including sports teams’ total receipts for admissions tohome games (not including admission taxes) 166........................ 66 798 66.7 X
8500 Food and beverage sales 129.......................................... 6 914 6.9 83.98501 Sales of food and nonalcoholic beverages 129......................... 6 780 6.8 X8502 Sales of alcoholic beverages 7..................................... 134 .1 X
8600 Merchandise sales 136................................................ 21 750 21.7 74.28634 Sales of other merchandise 136...................................... 21 750 21.7 X
8940 All other receipts 74................................................. 4 563 4.6 79.78977 All other receipts 74............................................... 4 563 4.6 X
See footnotes at end of table.
20 SUMMARY ARTS, ENTERTAINMENT, & RECREATIONmSUBJECT SERIESU.S. Census Bureau, 1997 Economic Census Apr. 30, 2001

Table 2a. Major Sources of Receipts From Customers for Firms Subject to Federal Income Taxfor the United States: 1997mCon.
[Includes only establishments with payroll. For meaning of abbreviations and symbols, see introductory text. For explanation of terms, see Appendix A]
NAICS codeand
RL codeKind of business and sources of receipts
Establishments(number)
Receipts1
($1,000)
Receipts from specifiedreceipt lines as percent of
total receipts1
Receipts of establishmentsreporting sources ofreceipts as percent
of total receipts
712190 Nature parks & other similar institutions 166.................... 100 091 100.0 83.9
5500 Admissions, including sports teams’ total receipts for admissions tohome games (not including admission taxes) 166........................ 66 798 66.7 X
8500 Food and beverage sales 129.......................................... 6 914 6.9 83.98501 Sales of food and nonalcoholic beverages 129......................... 6 780 6.8 X8502 Sales of alcoholic beverages 7..................................... 134 .1 X
8600 Merchandise sales 136................................................ 21 750 21.7 74.28634 Sales of other merchandise 136...................................... 21 750 21.7 X
8940 All other receipts 74................................................. 4 563 4.6 79.78977 All other receipts 74............................................... 4 563 4.6 X
713 Amusement, gambling, & recreation industries r52 907..............r51 861 195 100.0 77.6
3450 Membership dues and fees 19 354........................................ 7 784 180 15.0 X4900 Tuition, fees, and other payments from providing instruction (e.g., sports
instruction) 4 061..................................................... 459 303 .9 X5500 Admissions, including sports teams’ total receipts for admissions to
home games (not including admission taxes) 6 222........................ 5 388 102 10.4 X5670 This establishment’s share of receipts from concessions or amusement
machines not operated by this establishment 3 916........................ 176 715 .3 X5750 Gaming receipts 3 061.................................................. 14 367 952 27.7 X
5800 Amusement machines operated by this establishment (except slotmachines and other gaming machines) 12 140............................. 2 570 897 5.0 59.8
5801 Phonograph, compact discs, or video jukeboxes 2 365.................... 225 557 .4 X5802 Pinball machines 4 338............................................... 260 641 .5 X5803 Video games 9 308................................................... 1 428 915 2.8 X5804 Other amusement machines (excluding billiard or pool tables) 3 805........ 655 775 1.3 X
5900 Advertising (including endorsement fees) 1 708............................ 72 071 .1 X5950 Amounts received for the use of recreational facilities 24 723................. 7 773 617 15.0 X6000 Pleasure boat dockage, slip rental, launch fees, and storage 4 629........... 1 051 904 2.0 X6950 Personal and household goods repair (including boat repair, including
parts and labor) 2 545................................................. 360 231 .7 X
8500 Food and beverage sales 27 396.......................................... 5 599 571 10.8 76.48501 Sales of food and nonalcoholic beverages 26 395......................... 4 106 210 7.9 X8502 Sales of alcoholic beverages 14 365..................................... 1 493 361 2.9 X
8550 Rental and leasing of goods and equipment (including bowling shoes,canoe rental, etc.) 12 626............................................... 1 092 828 2.1 X
8600 Merchandise sales 18 572................................................ 2 963 012 5.7 75.68631 Fuels and lubricants 2 600............................................ 214 713 .4 X8632 Boats and marine equipment 2 027..................................... 550 914 1.1 X8633 All other merchandise 17 037........................................... 2 197 385 4.2 X
8940 All other receipts 14 633................................................. 2 200 812 4.2 76.28976 All other receipts 14 633............................................... 2 200 812 4.2 X
7131 Amusement parks & arcades 3 344............................... 8 418 476 100.0 91.4
3450 Membership dues and fees 15........................................ 925 Z X5500 Admissions, including sports teams’ total receipts for admissions to
home games (not including admission taxes) 1 102........................ 4 063 563 48.3 X5670 This establishment’s share of receipts from concessions or amusement
machines not operated by this establishment 159........................ 89 211 1.1 X5750 Gaming receipts 9.................................................. 1 370 Z X
5800 Amusement machines operated by this establishment (except slotmachines and other gaming machines) 3 012............................. 966 304 11.5 65.5
5801 Phonograph, compact discs, or video jukeboxes 77.................... 18 582 .2 X5802 Pinball machines 1 260............................................... 64 808 .8 X5803 Video games 2 258................................................... 583 628 6.9 X5804 Other amusement machines (excluding billiard or pool tables) 1 409........ 299 284 3.6 X
5900 Advertising (including endorsement fees) 89............................ 30 933 .4 X5950 Amounts received for the use of recreational facilities 724................. 205 385 2.4 X6950 Personal and household goods repair (including boat repair, including
parts and labor) 37................................................. 2 153 Z X
8500 Food and beverage sales 1 346.......................................... 1 393 346 16.6 91.18501 Sales of food and nonalcoholic beverages 1 340......................... 1 339 221 15.9 X8502 Sales of alcoholic beverages 127..................................... 54 125 .6 X
8550 Rental and leasing of goods and equipment (including bowling shoes,canoe rental, etc.) 117............................................... 16 340 .2 X
8600 Merchandise sales 787................................................ 1 104 946 13.1 91.08633 All other merchandise 786........................................... 1 104 921 13.1 X
8940 All other receipts 494................................................. 544 000 6.5 90.98976 All other receipts 494............................................... 544 000 6.5 X
71311 Amusement & theme parks 607................................ 7 171 677 100.0 96.0
3450 Membership dues and fees 7........................................ 889 Z X5500 Admissions, including sports teams’ total receipts for admissions to
home games (not including admission taxes) 505........................ 3 929 222 54.8 X5670 This establishment’s share of receipts from concessions or amusement
machines not operated by this establishment 128........................ 88 293 1.2 X
5800 Amusement machines operated by this establishment (except slotmachines and other gaming machines) 275............................. 122 785 1.7 68.4
5801 Phonograph, compact discs, or video jukeboxes 12.................... 1 331 Z X5802 Pinball machines 32............................................... 10 574 .1 X5803 Video games 222................................................... 45 631 .6 X5804 Other amusement machines (excluding billiard or pool tables) 97........ 65 247 .9 X
5900 Advertising (including endorsement fees) 64............................ 30 774 .4 X5950 Amounts received for the use of recreational facilities 156................. 85 778 1.2 X
8500 Food and beverage sales 495.......................................... 1 310 311 18.3 95.88501 Sales of food and nonalcoholic beverages 493......................... 1 261 668 17.6 X8502 Sales of alcoholic beverages 97..................................... 48 643 .7 X
See footnotes at end of table.
ARTS, ENTERTAINMENT, & RECREATIONmSUBJECT SERIES SUMMARY 21U.S. Census Bureau, 1997 Economic Census Apr. 30, 2001

Table 2a. Major Sources of Receipts From Customers for Firms Subject to Federal Income Taxfor the United States: 1997mCon.
[Includes only establishments with payroll. For meaning of abbreviations and symbols, see introductory text. For explanation of terms, see Appendix A]
NAICS codeand
RL codeKind of business and sources of receipts
Establishments(number)
Receipts1
($1,000)
Receipts from specifiedreceipt lines as percent of
total receipts1
Receipts of establishmentsreporting sources ofreceipts as percent
of total receipts
71311 Amusement & theme parksmCon.
8550 Rental and leasing of goods and equipment (including bowling shoes,canoe rental, etc.) 95............................................... 14 613 .2 X
8600 Merchandise sales 307................................................ 1 095 522 15.3 95.88633 All other merchandise 306........................................... 1 095 497 15.3 X
8940 All other receipts 281................................................. 493 180 6.9 95.68976 All other receipts 281............................................... 493 180 6.9 X
713110 Amusement & theme parks 607................................ 7 171 677 100.0 96.0
3450 Membership dues and fees 7........................................ 889 Z X5500 Admissions, including sports teams’ total receipts for admissions to
home games (not including admission taxes) 505........................ 3 929 222 54.8 X5670 This establishment’s share of receipts from concessions or amusement
machines not operated by this establishment 128........................ 88 293 1.2 X
5800 Amusement machines operated by this establishment (except slotmachines and other gaming machines) 275............................. 122 785 1.7 68.4
5801 Phonograph, compact discs, or video jukeboxes 12.................... 1 331 Z X5802 Pinball machines 32............................................... 10 574 .1 X5803 Video games 222................................................... 45 631 .6 X5804 Other amusement machines (excluding billiard or pool tables) 97........ 65 247 .9 X
5900 Advertising (including endorsement fees) 64............................ 30 774 .4 X5950 Amounts received for the use of recreational facilities 156................. 85 778 1.2 X
8500 Food and beverage sales 495.......................................... 1 310 311 18.3 95.88501 Sales of food and nonalcoholic beverages 493......................... 1 261 668 17.6 X8502 Sales of alcoholic beverages 97..................................... 48 643 .7 X
8550 Rental and leasing of goods and equipment (including bowling shoes,canoe rental, etc.) 95............................................... 14 613 .2 X
8600 Merchandise sales 307................................................ 1 095 522 15.3 95.88633 All other merchandise 306........................................... 1 095 497 15.3 X
8940 All other receipts 281................................................. 493 180 6.9 95.68976 All other receipts 281............................................... 493 180 6.9 X
7131101 Waterparks 157............................................... 342 958 100.0 85.3
5500 Admissions, including sports teams’ total receipts for admissions tohome games (not including admission taxes) 150........................ 241 482 70.4 X
5670 This establishment’s share of receipts from concessions or amusementmachines not operated by this establishment 37........................ 1 130 .3 X
5800 Amusement machines operated by this establishment (except slotmachines and other gaming machines) 55............................. 2 266 .7 81.5
5801 Phonograph, compact discs, or video jukeboxes 8.................... 126 Z X5802 Pinball machines 9............................................... 51 Z X5803 Video games 50................................................... 1 226 .4 X5804 Other amusement machines (excluding billiard or pool tables) 13........ 863 .3 X
5900 Advertising (including endorsement fees) 12............................ 390 .1 X5950 Amounts received for the use of recreational facilities 32................. 3 928 1.1 X
8500 Food and beverage sales 121.......................................... 50 094 14.6 85.38501 Sales of food and nonalcoholic beverages 121......................... 46 906 13.7 X8502 Sales of alcoholic beverages 35..................................... 3 188 .9 X
8550 Rental and leasing of goods and equipment (including bowling shoes,canoe rental, etc.) 58............................................... 9 261 2.7 X
8600 Merchandise sales 87................................................ 19 133 5.6 85.38633 All other merchandise 86........................................... 19 108 5.6 X
8940 All other receipts 62................................................. 15 212 4.4 83.48976 All other receipts 62............................................... 15 212 4.4 X
7131102 Amusement parks (except waterparks) 450..................... 6 828 719 100.0 96.5
5500 Admissions, including sports teams’ total receipts for admissions tohome games (not including admission taxes) 355........................ 3 687 740 54.0 X
5670 This establishment’s share of receipts from concessions or amusementmachines not operated by this establishment 91........................ 87 163 1.3 X
5800 Amusement machines operated by this establishment (except slotmachines and other gaming machines) 220............................. 120 519 1.8 68.4
5802 Pinball machines 23............................................... 10 523 .2 X5803 Video games 172................................................... 44 405 .7 X5804 Other amusement machines (excluding billiard or pool tables) 83........ 64 384 .9 X
5900 Advertising (including endorsement fees) 52............................ 30 384 .4 X5950 Amounts received for the use of recreational facilities 124................. 81 850 1.2 X
8500 Food and beverage sales 374.......................................... 1 260 217 18.5 96.38501 Sales of food and nonalcoholic beverages 372......................... 1 214 762 17.8 X8502 Sales of alcoholic beverages 63..................................... 45 455 .7 X
8550 Rental and leasing of goods and equipment (including bowling shoes,canoe rental, etc.) 37............................................... 5 352 .1 X
8600 Merchandise sales 220................................................ 1 076 389 15.8 96.38633 All other merchandise 220........................................... 1 076 389 15.8 X
8940 All other receipts 219................................................. 477 968 7.0 96.28976 All other receipts 219............................................... 477 968 7.0 X
See footnotes at end of table.
22 SUMMARY ARTS, ENTERTAINMENT, & RECREATIONmSUBJECT SERIESU.S. Census Bureau, 1997 Economic Census Apr. 30, 2001

Table 2a. Major Sources of Receipts From Customers for Firms Subject to Federal Income Taxfor the United States: 1997mCon.
[Includes only establishments with payroll. For meaning of abbreviations and symbols, see introductory text. For explanation of terms, see Appendix A]
NAICS codeand
RL codeKind of business and sources of receipts
Establishments(number)
Receipts1
($1,000)
Receipts from specifiedreceipt lines as percent of
total receipts1
Receipts of establishmentsreporting sources ofreceipts as percent
of total receipts
71312 Amusement arcades 2 737....................................... 1 246 799 100.0 65.0
3450 Membership dues and fees 8........................................ 36 Z X5500 Admissions, including sports teams’ total receipts for admissions to
home games (not including admission taxes) 597........................ 134 341 10.8 X5670 This establishment’s share of receipts from concessions or amusement
machines not operated by this establishment 31........................ 918 .1 X5750 Gaming receipts 9.................................................. 1 370 .1 X
5800 Amusement machines operated by this establishment (except slotmachines and other gaming machines) 2 737............................. 843 519 67.7 47.7
5801 Phonograph, compact discs, or video jukeboxes 64.................... 17 251 1.4 X5802 Pinball machines 1 228............................................... 54 234 4.4 X5803 Video games 2 036................................................... 537 997 43.2 X5804 Other amusement machines (excluding billiard or pool tables) 1 312........ 234 037 18.8 X
5900 Advertising (including endorsement fees) 25............................ 159 Z X5950 Amounts received for the use of recreational facilities 568................. 119 607 9.6 X6950 Personal and household goods repair (including boat repair, including
parts and labor) 35................................................. 1 843 .1 X
8500 Food and beverage sales 851.......................................... 83 035 6.7 63.38501 Sales of food and nonalcoholic beverages 847......................... 77 553 6.2 X8502 Sales of alcoholic beverages 30..................................... 5 482 .4 X
8550 Rental and leasing of goods and equipment (including bowling shoes,canoe rental, etc.) 22............................................... 1 727 .1 X
8600 Merchandise sales 480................................................ 9 424 .8 60.28633 All other merchandise 480........................................... 9 424 .8 X
8940 All other receipts 213................................................. 50 820 4.1 57.68976 All other receipts 213............................................... 50 820 4.1 X
713120 Amusement arcades 2 737....................................... 1 246 799 100.0 65.0
3450 Membership dues and fees 8........................................ 36 Z X5500 Admissions, including sports teams’ total receipts for admissions to
home games (not including admission taxes) 597........................ 134 341 10.8 X5670 This establishment’s share of receipts from concessions or amusement
machines not operated by this establishment 31........................ 918 .1 X5750 Gaming receipts 9.................................................. 1 370 .1 X
5800 Amusement machines operated by this establishment (except slotmachines and other gaming machines) 2 737............................. 843 519 67.7 47.7
5801 Phonograph, compact discs, or video jukeboxes 64.................... 17 251 1.4 X5802 Pinball machines 1 228............................................... 54 234 4.4 X5803 Video games 2 036................................................... 537 997 43.2 X5804 Other amusement machines (excluding billiard or pool tables) 1 312........ 234 037 18.8 X
5900 Advertising (including endorsement fees) 25............................ 159 Z X5950 Amounts received for the use of recreational facilities 568................. 119 607 9.6 X6950 Personal and household goods repair (including boat repair, including
parts and labor) 35................................................. 1 843 .1 X
8500 Food and beverage sales 851.......................................... 83 035 6.7 63.38501 Sales of food and nonalcoholic beverages 847......................... 77 553 6.2 X8502 Sales of alcoholic beverages 30..................................... 5 482 .4 X
8550 Rental and leasing of goods and equipment (including bowling shoes,canoe rental, etc.) 22............................................... 1 727 .1 X
8600 Merchandise sales 480................................................ 9 424 .8 60.28633 All other merchandise 480........................................... 9 424 .8 X
8940 All other receipts 213................................................. 50 820 4.1 57.68976 All other receipts 213............................................... 50 820 4.1 X
7132 Gambling industries r2 099.......................................r15 541 569 100.0 87.3
3450 Membership dues and fees 70........................................ 805 Z X5500 Admissions, including sports teams’ total receipts for admissions to
home games (not including admission taxes) 116........................ 69 125 .4 X5670 This establishment’s share of receipts from concessions or amusement
machines not operated by this establishment 116........................ 18 735 .1 X5750 Gaming receipts 2 099.................................................. 14 201 990 91.4 X
5800 Amusement machines operated by this establishment (except slotmachines and other gaming machines) 144............................. 15 503 .1 62.7
5801 Phonograph, compact discs, or video jukeboxes 77.................... 2 160 Z X5802 Pinball machines 39............................................... 943 Z X5803 Video games 76................................................... 9 883 .1 X5804 Other amusement machines (excluding billiard or pool tables) 54........ 2 515 Z X
5900 Advertising (including endorsement fees) 33............................ 3 706 Z X5950 Amounts received for the use of recreational facilities 32................. 2 852 Z X
8500 Food and beverage sales 885.......................................... 810 352 5.2 85.48501 Sales of food and nonalcoholic beverages 762......................... 566 762 3.6 X8502 Sales of alcoholic beverages 632..................................... 243 590 1.6 X
8550 Rental and leasing of goods and equipment (including bowling shoes,canoe rental, etc.) 39............................................... 13 489 .1 X
8600 Merchandise sales 324................................................ 66 335 .4 82.08633 All other merchandise 324........................................... 65 933 .4 X
8940 All other receipts 394................................................. 338 677 2.2 84.88976 All other receipts 394............................................... 338 677 2.2 X
71321 Casinos (except casino hotels) 447............................. 10 186 070 100.0 86.8
5500 Admissions, including sports teams’ total receipts for admissions tohome games (not including admission taxes) 24........................ 20 771 .2 X
5670 This establishment’s share of receipts from concessions or amusementmachines not operated by this establishment 31........................ 9 657 .1 X
5750 Gaming receipts 447.................................................. 9 159 640 89.9 X
See footnotes at end of table.
ARTS, ENTERTAINMENT, & RECREATIONmSUBJECT SERIES SUMMARY 23U.S. Census Bureau, 1997 Economic Census Apr. 30, 2001
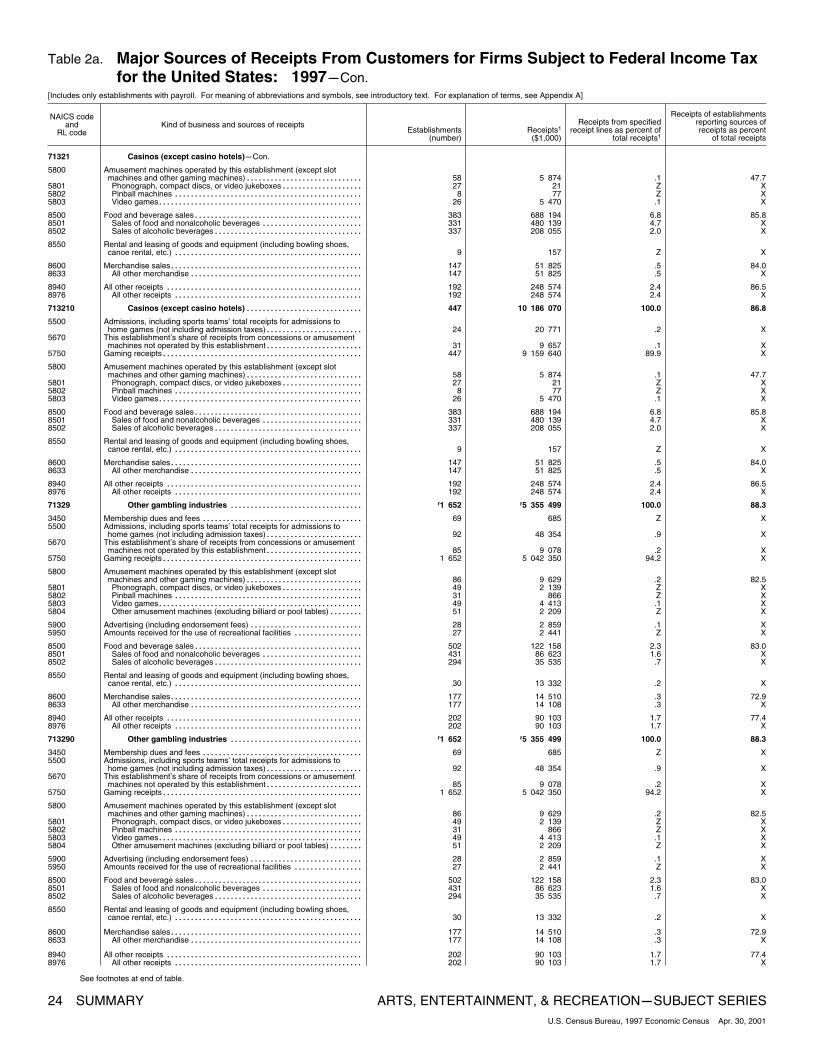
Table 2a. Major Sources of Receipts From Customers for Firms Subject to Federal Income Taxfor the United States: 1997mCon.
[Includes only establishments with payroll. For meaning of abbreviations and symbols, see introductory text. For explanation of terms, see Appendix A]
NAICS codeand
RL codeKind of business and sources of receipts
Establishments(number)
Receipts1
($1,000)
Receipts from specifiedreceipt lines as percent of
total receipts1
Receipts of establishmentsreporting sources ofreceipts as percent
of total receipts
71321 Casinos (except casino hotels)mCon.
5800 Amusement machines operated by this establishment (except slotmachines and other gaming machines) 58............................. 5 874 .1 47.7
5801 Phonograph, compact discs, or video jukeboxes 27.................... 21 Z X5802 Pinball machines 8............................................... 77 Z X5803 Video games 26................................................... 5 470 .1 X
8500 Food and beverage sales 383.......................................... 688 194 6.8 85.88501 Sales of food and nonalcoholic beverages 331......................... 480 139 4.7 X8502 Sales of alcoholic beverages 337..................................... 208 055 2.0 X
8550 Rental and leasing of goods and equipment (including bowling shoes,canoe rental, etc.) 9............................................... 157 Z X
8600 Merchandise sales 147................................................ 51 825 .5 84.08633 All other merchandise 147........................................... 51 825 .5 X
8940 All other receipts 192................................................. 248 574 2.4 86.58976 All other receipts 192............................................... 248 574 2.4 X
713210 Casinos (except casino hotels) 447............................. 10 186 070 100.0 86.8
5500 Admissions, including sports teams’ total receipts for admissions tohome games (not including admission taxes) 24........................ 20 771 .2 X
5670 This establishment’s share of receipts from concessions or amusementmachines not operated by this establishment 31........................ 9 657 .1 X
5750 Gaming receipts 447.................................................. 9 159 640 89.9 X
5800 Amusement machines operated by this establishment (except slotmachines and other gaming machines) 58............................. 5 874 .1 47.7
5801 Phonograph, compact discs, or video jukeboxes 27.................... 21 Z X5802 Pinball machines 8............................................... 77 Z X5803 Video games 26................................................... 5 470 .1 X
8500 Food and beverage sales 383.......................................... 688 194 6.8 85.88501 Sales of food and nonalcoholic beverages 331......................... 480 139 4.7 X8502 Sales of alcoholic beverages 337..................................... 208 055 2.0 X
8550 Rental and leasing of goods and equipment (including bowling shoes,canoe rental, etc.) 9............................................... 157 Z X
8600 Merchandise sales 147................................................ 51 825 .5 84.08633 All other merchandise 147........................................... 51 825 .5 X
8940 All other receipts 192................................................. 248 574 2.4 86.58976 All other receipts 192............................................... 248 574 2.4 X
71329 Other gambling industries r1 652.................................r5 355 499 100.0 88.3
3450 Membership dues and fees 69........................................ 685 Z X5500 Admissions, including sports teams’ total receipts for admissions to
home games (not including admission taxes) 92........................ 48 354 .9 X5670 This establishment’s share of receipts from concessions or amusement
machines not operated by this establishment 85........................ 9 078 .2 X5750 Gaming receipts 1 652.................................................. 5 042 350 94.2 X
5800 Amusement machines operated by this establishment (except slotmachines and other gaming machines) 86............................. 9 629 .2 82.5
5801 Phonograph, compact discs, or video jukeboxes 49.................... 2 139 Z X5802 Pinball machines 31............................................... 866 Z X5803 Video games 49................................................... 4 413 .1 X5804 Other amusement machines (excluding billiard or pool tables) 51........ 2 209 Z X
5900 Advertising (including endorsement fees) 28............................ 2 859 .1 X5950 Amounts received for the use of recreational facilities 27................. 2 441 Z X
8500 Food and beverage sales 502.......................................... 122 158 2.3 83.08501 Sales of food and nonalcoholic beverages 431......................... 86 623 1.6 X8502 Sales of alcoholic beverages 294..................................... 35 535 .7 X
8550 Rental and leasing of goods and equipment (including bowling shoes,canoe rental, etc.) 30............................................... 13 332 .2 X
8600 Merchandise sales 177................................................ 14 510 .3 72.98633 All other merchandise 177........................................... 14 108 .3 X
8940 All other receipts 202................................................. 90 103 1.7 77.48976 All other receipts 202............................................... 90 103 1.7 X
713290 Other gambling industries r1 652.................................r5 355 499 100.0 88.3
3450 Membership dues and fees 69........................................ 685 Z X5500 Admissions, including sports teams’ total receipts for admissions to
home games (not including admission taxes) 92........................ 48 354 .9 X5670 This establishment’s share of receipts from concessions or amusement
machines not operated by this establishment 85........................ 9 078 .2 X5750 Gaming receipts 1 652.................................................. 5 042 350 94.2 X
5800 Amusement machines operated by this establishment (except slotmachines and other gaming machines) 86............................. 9 629 .2 82.5
5801 Phonograph, compact discs, or video jukeboxes 49.................... 2 139 Z X5802 Pinball machines 31............................................... 866 Z X5803 Video games 49................................................... 4 413 .1 X5804 Other amusement machines (excluding billiard or pool tables) 51........ 2 209 Z X
5900 Advertising (including endorsement fees) 28............................ 2 859 .1 X5950 Amounts received for the use of recreational facilities 27................. 2 441 Z X
8500 Food and beverage sales 502.......................................... 122 158 2.3 83.08501 Sales of food and nonalcoholic beverages 431......................... 86 623 1.6 X8502 Sales of alcoholic beverages 294..................................... 35 535 .7 X
8550 Rental and leasing of goods and equipment (including bowling shoes,canoe rental, etc.) 30............................................... 13 332 .2 X
8600 Merchandise sales 177................................................ 14 510 .3 72.98633 All other merchandise 177........................................... 14 108 .3 X
8940 All other receipts 202................................................. 90 103 1.7 77.48976 All other receipts 202............................................... 90 103 1.7 X
See footnotes at end of table.
24 SUMMARY ARTS, ENTERTAINMENT, & RECREATIONmSUBJECT SERIESU.S. Census Bureau, 1997 Economic Census Apr. 30, 2001

Table 2a. Major Sources of Receipts From Customers for Firms Subject to Federal Income Taxfor the United States: 1997mCon.
[Includes only establishments with payroll. For meaning of abbreviations and symbols, see introductory text. For explanation of terms, see Appendix A]
NAICS codeand
RL codeKind of business and sources of receipts
Establishments(number)
Receipts1
($1,000)
Receipts from specifiedreceipt lines as percent of
total receipts1
Receipts of establishmentsreporting sources ofreceipts as percent
of total receipts
7132901 Slot machine operators r327....................................r1 618 475 100.0 100.0
5670 This establishment’s share of receipts from concessions or amusementmachines not operated by this establishment 13........................ 2 544 .2 X
5750 Gaming receipts 327.................................................. 1 531 811 94.6 X
5800 Amusement machines operated by this establishment (except slotmachines and other gaming machines) 42............................. 7 019 .4 100.0
5801 Phonograph, compact discs, or video jukeboxes 37.................... 2 064 .1 X5802 Pinball machines 31............................................... 866 .1 X5803 Video games 39................................................... 2 883 .2 X5804 Other amusement machines (excluding billiard or pool tables) 29........ 1 204 .1 X
8500 Food and beverage sales 66.......................................... 14 844 .9 100.08501 Sales of food and nonalcoholic beverages 41......................... 10 882 .7 X8502 Sales of alcoholic beverages 49..................................... 3 962 .2 X
8550 Rental and leasing of goods and equipment (including bowling shoes,canoe rental, etc.) 7............................................... 105 Z X
8600 Merchandise sales 6................................................ 566 Z 100.08633 All other merchandise 6........................................... 566 Z X
8940 All other receipts 39................................................. 60 609 3.7 100.08976 All other receipts 39............................................... 60 609 3.7 X
7132902 Lottery, bingo, bookie, & other betting operation 1 325............ 3 737 024 100.0 83.0
3450 Membership dues and fees 69........................................ 685 Z X5500 Admissions, including sports teams’ total receipts for admissions to
home games (not including admission taxes) 89........................ 48 310 1.3 X5670 This establishment’s share of receipts from concessions or amusement
machines not operated by this establishment 72........................ 6 534 .2 X5750 Gaming receipts 1 325.................................................. 3 510 539 93.9 X
5800 Amusement machines operated by this establishment (except slotmachines and other gaming machines) 44............................. 2 610 .1 73.9
5801 Phonograph, compact discs, or video jukeboxes 12.................... 75 Z X5803 Video games 10................................................... 1 530 Z X5804 Other amusement machines (excluding billiard or pool tables) 22........ 1 005 Z X
5900 Advertising (including endorsement fees) 25............................ 2 568 .1 X5950 Amounts received for the use of recreational facilities 25................. 1 799 Z X
8500 Food and beverage sales 436.......................................... 107 314 2.9 76.38501 Sales of food and nonalcoholic beverages 390......................... 75 741 2.0 X8502 Sales of alcoholic beverages 245..................................... 31 573 .8 X
8550 Rental and leasing of goods and equipment (including bowling shoes,canoe rental, etc.) 23............................................... 13 227 .4 X
8600 Merchandise sales 171................................................ 13 944 .4 68.48633 All other merchandise 171........................................... 13 542 .4 X
8940 All other receipts 163................................................. 29 494 .8 62.18976 All other receipts 163............................................... 29 494 .8 X
7139 Other amusement & recreation services 47 464.................... 27 901 150 100.0 67.9
3450 Membership dues and fees 19 269........................................ 7 782 450 27.9 X4900 Tuition, fees, and other payments from providing instruction (e.g., sports
instruction) 4 061..................................................... 459 303 1.6 X5500 Admissions, including sports teams’ total receipts for admissions to
home games (not including admission taxes) 5 004........................ 1 255 414 4.5 X5670 This establishment’s share of receipts from concessions or amusement
machines not operated by this establishment 3 641........................ 68 769 .2 X5750 Gaming receipts 953.................................................. 164 592 .6 X
5800 Amusement machines operated by this establishment (except slotmachines and other gaming machines) 8 984............................. 1 589 090 5.7 58.7
5801 Phonograph, compact discs, or video jukeboxes 2 211.................... 204 815 .7 X5802 Pinball machines 3 039............................................... 194 890 .7 X5803 Video games 6 974................................................... 835 404 3.0 X5804 Other amusement machines (excluding billiard or pool tables) 2 343........ 353 976 1.3 X
5900 Advertising (including endorsement fees) 1 586............................ 37 432 .1 X5950 Amounts received for the use of recreational facilities 23 967................. 7 565 380 27.1 X6000 Pleasure boat dockage, slip rental, launch fees, and storage 4 629........... 1 051 904 3.8 X6950 Personal and household goods repair (including boat repair, including
parts and labor) 2 508................................................. 358 078 1.3 X
8500 Food and beverage sales 25 165.......................................... 3 395 873 12.2 66.78501 Sales of food and nonalcoholic beverages 24 293......................... 2 200 227 7.9 X8502 Sales of alcoholic beverages 13 606..................................... 1 195 646 4.3 X
8550 Rental and leasing of goods and equipment (including bowling shoes,canoe rental, etc.) 12 470............................................... 1 062 999 3.8 X
8600 Merchandise sales 17 461................................................ 1 791 731 6.4 66.78631 Fuels and lubricants 2 597............................................ 214 311 .8 X8632 Boats and marine equipment 2 023..................................... 550 889 2.0 X8633 All other merchandise 15 928........................................... 1 026 531 3.7 X
8940 All other receipts 13 745................................................. 1 318 135 4.7 66.88976 All other receipts 13 745............................................... 1 318 135 4.7 X
71391 Golf courses & country clubs 8 546.............................. 8 636 921 100.0 68.4
3450 Membership dues and fees 5 045........................................ 1 980 552 22.9 X4900 Tuition, fees, and other payments from providing instruction (e.g., sports
instruction) 518..................................................... 17 598 .2 X5500 Admissions, including sports teams’ total receipts for admissions to
home games (not including admission taxes) 282........................ 80 853 .9 X5670 This establishment’s share of receipts from concessions or amusement
machines not operated by this establishment 286........................ 4 130 Z X5750 Gaming receipts 44.................................................. 2 738 Z X
See footnotes at end of table.
ARTS, ENTERTAINMENT, & RECREATIONmSUBJECT SERIES SUMMARY 25U.S. Census Bureau, 1997 Economic Census Apr. 30, 2001

Table 2a. Major Sources of Receipts From Customers for Firms Subject to Federal Income Taxfor the United States: 1997mCon.
[Includes only establishments with payroll. For meaning of abbreviations and symbols, see introductory text. For explanation of terms, see Appendix A]
NAICS codeand
RL codeKind of business and sources of receipts
Establishments(number)
Receipts1
($1,000)
Receipts from specifiedreceipt lines as percent of
total receipts1
Receipts of establishmentsreporting sources ofreceipts as percent
of total receipts
71391 Golf courses & country clubsmCon.
5800 Amusement machines operated by this establishment (except slotmachines and other gaming machines) 124............................. 8 732 .1 35.3
5801 Phonograph, compact discs, or video jukeboxes 41.................... 4 733 .1 X5802 Pinball machines 23............................................... 2 176 Z X5803 Video games 47................................................... 550 Z X5804 Other amusement machines (excluding billiard or pool tables) 31........ 1 272 Z X
5900 Advertising (including endorsement fees) 308............................ 17 228 .2 X5950 Amounts received for the use of recreational facilities 7 711................. 3 292 473 38.1 X6000 Pleasure boat dockage, slip rental, launch fees, and storage 228........... 8 320 .1 X6950 Personal and household goods repair (including boat repair, including
parts and labor) 164................................................. 10 373 .1 X
8500 Food and beverage sales 7 016.......................................... 1 609 131 18.6 67.28501 Sales of food and nonalcoholic beverages 6 913......................... 1 189 942 13.8 X8502 Sales of alcoholic beverages 5 445..................................... 419 189 4.9 X
8550 Rental and leasing of goods and equipment (including bowling shoes,canoe rental, etc.) 5 066............................................... 684 122 7.9 X
8600 Merchandise sales 4 838................................................ 500 185 5.8 67.18631 Fuels and lubricants 42............................................ 4 262 Z X8632 Boats and marine equipment 16..................................... 748 Z X8633 All other merchandise 4 782........................................... 495 175 5.7 X
8940 All other receipts 3 461................................................. 420 486 4.9 67.48976 All other receipts 3 461............................................... 420 486 4.9 X
713910 Golf courses & country clubs 8 546.............................. 8 636 921 100.0 68.4
3450 Membership dues and fees 5 045........................................ 1 980 552 22.9 X4900 Tuition, fees, and other payments from providing instruction (e.g., sports
instruction) 518..................................................... 17 598 .2 X5500 Admissions, including sports teams’ total receipts for admissions to
home games (not including admission taxes) 282........................ 80 853 .9 X5670 This establishment’s share of receipts from concessions or amusement
machines not operated by this establishment 286........................ 4 130 Z X5750 Gaming receipts 44.................................................. 2 738 Z X
5800 Amusement machines operated by this establishment (except slotmachines and other gaming machines) 124............................. 8 732 .1 35.3
5801 Phonograph, compact discs, or video jukeboxes 41.................... 4 733 .1 X5802 Pinball machines 23............................................... 2 176 Z X5803 Video games 47................................................... 550 Z X5804 Other amusement machines (excluding billiard or pool tables) 31........ 1 272 Z X
5900 Advertising (including endorsement fees) 308............................ 17 228 .2 X5950 Amounts received for the use of recreational facilities 7 711................. 3 292 473 38.1 X6000 Pleasure boat dockage, slip rental, launch fees, and storage 228........... 8 320 .1 X6950 Personal and household goods repair (including boat repair, including
parts and labor) 164................................................. 10 373 .1 X
8500 Food and beverage sales 7 016.......................................... 1 609 131 18.6 67.28501 Sales of food and nonalcoholic beverages 6 913......................... 1 189 942 13.8 X8502 Sales of alcoholic beverages 5 445..................................... 419 189 4.9 X
8550 Rental and leasing of goods and equipment (including bowling shoes,canoe rental, etc.) 5 066............................................... 684 122 7.9 X
8600 Merchandise sales 4 838................................................ 500 185 5.8 67.18631 Fuels and lubricants 42............................................ 4 262 Z X8632 Boats and marine equipment 16..................................... 748 Z X8633 All other merchandise 4 782........................................... 495 175 5.7 X
8940 All other receipts 3 461................................................. 420 486 4.9 67.48976 All other receipts 3 461............................................... 420 486 4.9 X
71392 Skiing facilities 379............................................ 1 340 813 100.0 71.0
3450 Membership dues and fees 36........................................ 4 658 .3 X4900 Tuition, fees, and other payments from providing instruction (e.g., sports
instruction) 157..................................................... 67 556 5.0 X5500 Admissions, including sports teams’ total receipts for admissions to
home games (not including admission taxes) 116........................ 154 476 11.5 X5670 This establishment’s share of receipts from concessions or amusement
machines not operated by this establishment 64........................ 7 311 .5 X
5800 Amusement machines operated by this establishment (except slotmachines and other gaming machines) 50............................. 2 132 .2 71.0
5803 Video games 44................................................... 1 842 .1 X
5900 Advertising (including endorsement fees) 36............................ 839 .1 X5950 Amounts received for the use of recreational facilities 296................. 793 373 59.2 X6000 Pleasure boat dockage, slip rental, launch fees, and storage 7........... 54 Z X6950 Personal and household goods repair (including boat repair, including
parts and labor) 37................................................. 1 366 .1 X
8500 Food and beverage sales 283.......................................... 128 414 9.6 67.28501 Sales of food and nonalcoholic beverages 279......................... 105 373 7.9 X8502 Sales of alcoholic beverages 198..................................... 23 041 1.7 X
8550 Rental and leasing of goods and equipment (including bowling shoes,canoe rental, etc.) 267............................................... 66 201 4.9 X
8600 Merchandise sales 177................................................ 59 350 4.4 70.98631 Fuels and lubricants 7............................................ 60 Z X8633 All other merchandise 175........................................... 59 290 4.4 X
8940 All other receipts 202................................................. 50 979 3.8 70.08976 All other receipts 202............................................... 50 979 3.8 X
See footnotes at end of table.
26 SUMMARY ARTS, ENTERTAINMENT, & RECREATIONmSUBJECT SERIESU.S. Census Bureau, 1997 Economic Census Apr. 30, 2001

Table 2a. Major Sources of Receipts From Customers for Firms Subject to Federal Income Taxfor the United States: 1997mCon.
[Includes only establishments with payroll. For meaning of abbreviations and symbols, see introductory text. For explanation of terms, see Appendix A]
NAICS codeand
RL codeKind of business and sources of receipts
Establishments(number)
Receipts1
($1,000)
Receipts from specifiedreceipt lines as percent of
total receipts1
Receipts of establishmentsreporting sources ofreceipts as percent
of total receipts
713920 Skiing facilities 379............................................ 1 340 813 100.0 71.0
3450 Membership dues and fees 36........................................ 4 658 .3 X4900 Tuition, fees, and other payments from providing instruction (e.g., sports
instruction) 157..................................................... 67 556 5.0 X5500 Admissions, including sports teams’ total receipts for admissions to
home games (not including admission taxes) 116........................ 154 476 11.5 X5670 This establishment’s share of receipts from concessions or amusement
machines not operated by this establishment 64........................ 7 311 .5 X
5800 Amusement machines operated by this establishment (except slotmachines and other gaming machines) 50............................. 2 132 .2 71.0
5803 Video games 44................................................... 1 842 .1 X
5900 Advertising (including endorsement fees) 36............................ 839 .1 X5950 Amounts received for the use of recreational facilities 296................. 793 373 59.2 X6000 Pleasure boat dockage, slip rental, launch fees, and storage 7........... 54 Z X6950 Personal and household goods repair (including boat repair, including
parts and labor) 37................................................. 1 366 .1 X
8500 Food and beverage sales 283.......................................... 128 414 9.6 67.28501 Sales of food and nonalcoholic beverages 279......................... 105 373 7.9 X8502 Sales of alcoholic beverages 198..................................... 23 041 1.7 X
8550 Rental and leasing of goods and equipment (including bowling shoes,canoe rental, etc.) 267............................................... 66 201 4.9 X
8600 Merchandise sales 177................................................ 59 350 4.4 70.98631 Fuels and lubricants 7............................................ 60 Z X8633 All other merchandise 175........................................... 59 290 4.4 X
8940 All other receipts 202................................................. 50 979 3.8 70.08976 All other receipts 202............................................... 50 979 3.8 X
71393 Marinas 4 217................................................... 2 541 481 100.0 61.1
3450 Membership dues and fees 159........................................ 29 155 1.1 X4900 Tuition, fees, and other payments from providing instruction (e.g., sports
instruction) 17..................................................... 705 Z X5500 Admissions, including sports teams’ total receipts for admissions to
home games (not including admission taxes) 12........................ 1 126 Z X5670 This establishment’s share of receipts from concessions or amusement
machines not operated by this establishment 186........................ 1 772 .1 X5750 Gaming receipts 33.................................................. 867 Z X
5800 Amusement machines operated by this establishment (except slotmachines and other gaming machines) 48............................. 3 523 .1 38.8
5802 Pinball machines 12............................................... 16 Z X5803 Video games 46................................................... 3 068 .1 X
5900 Advertising (including endorsement fees) 44............................ 1 262 .1 X5950 Amounts received for the use of recreational facilities 142................. 10 627 .4 X6000 Pleasure boat dockage, slip rental, launch fees, and storage 4 217........... 1 039 341 40.9 X6950 Personal and household goods repair (including boat repair, including
parts and labor) 1 818................................................. 334 679 13.2 X
8500 Food and beverage sales 1 656.......................................... 105 987 4.2 60.08501 Sales of food and nonalcoholic beverages 1 572......................... 80 669 3.2 X8502 Sales of alcoholic beverages 850..................................... 25 318 1.0 X
8550 Rental and leasing of goods and equipment (including bowling shoes,canoe rental, etc.) 733............................................... 55 985 2.2 X
8600 Merchandise sales 2 950................................................ 844 431 33.2 60.58631 Fuels and lubricants 2 406............................................ 207 782 8.2 X8632 Boats and marine equipment 1 952..................................... 546 088 21.5 X8633 All other merchandise 1 585........................................... 90 561 3.6 X
8940 All other receipts 1 745................................................. 112 021 4.4 61.08976 All other receipts 1 745............................................... 112 021 4.4 X
713930 Marinas 4 217................................................... 2 541 481 100.0 61.1
3450 Membership dues and fees 159........................................ 29 155 1.1 X4900 Tuition, fees, and other payments from providing instruction (e.g., sports
instruction) 17..................................................... 705 Z X5500 Admissions, including sports teams’ total receipts for admissions to
home games (not including admission taxes) 12........................ 1 126 Z X5670 This establishment’s share of receipts from concessions or amusement
machines not operated by this establishment 186........................ 1 772 .1 X5750 Gaming receipts 33.................................................. 867 Z X
5800 Amusement machines operated by this establishment (except slotmachines and other gaming machines) 48............................. 3 523 .1 38.8
5802 Pinball machines 12............................................... 16 Z X5803 Video games 46................................................... 3 068 .1 X
5900 Advertising (including endorsement fees) 44............................ 1 262 .1 X5950 Amounts received for the use of recreational facilities 142................. 10 627 .4 X6000 Pleasure boat dockage, slip rental, launch fees, and storage 4 217........... 1 039 341 40.9 X6950 Personal and household goods repair (including boat repair, including
parts and labor) 1 818................................................. 334 679 13.2 X
8500 Food and beverage sales 1 656.......................................... 105 987 4.2 60.08501 Sales of food and nonalcoholic beverages 1 572......................... 80 669 3.2 X8502 Sales of alcoholic beverages 850..................................... 25 318 1.0 X
8550 Rental and leasing of goods and equipment (including bowling shoes,canoe rental, etc.) 733............................................... 55 985 2.2 X
8600 Merchandise sales 2 950................................................ 844 431 33.2 60.58631 Fuels and lubricants 2 406............................................ 207 782 8.2 X8632 Boats and marine equipment 1 952..................................... 546 088 21.5 X8633 All other merchandise 1 585........................................... 90 561 3.6 X
8940 All other receipts 1 745................................................. 112 021 4.4 61.08976 All other receipts 1 745............................................... 112 021 4.4 X
See footnotes at end of table.
ARTS, ENTERTAINMENT, & RECREATIONmSUBJECT SERIES SUMMARY 27U.S. Census Bureau, 1997 Economic Census Apr. 30, 2001
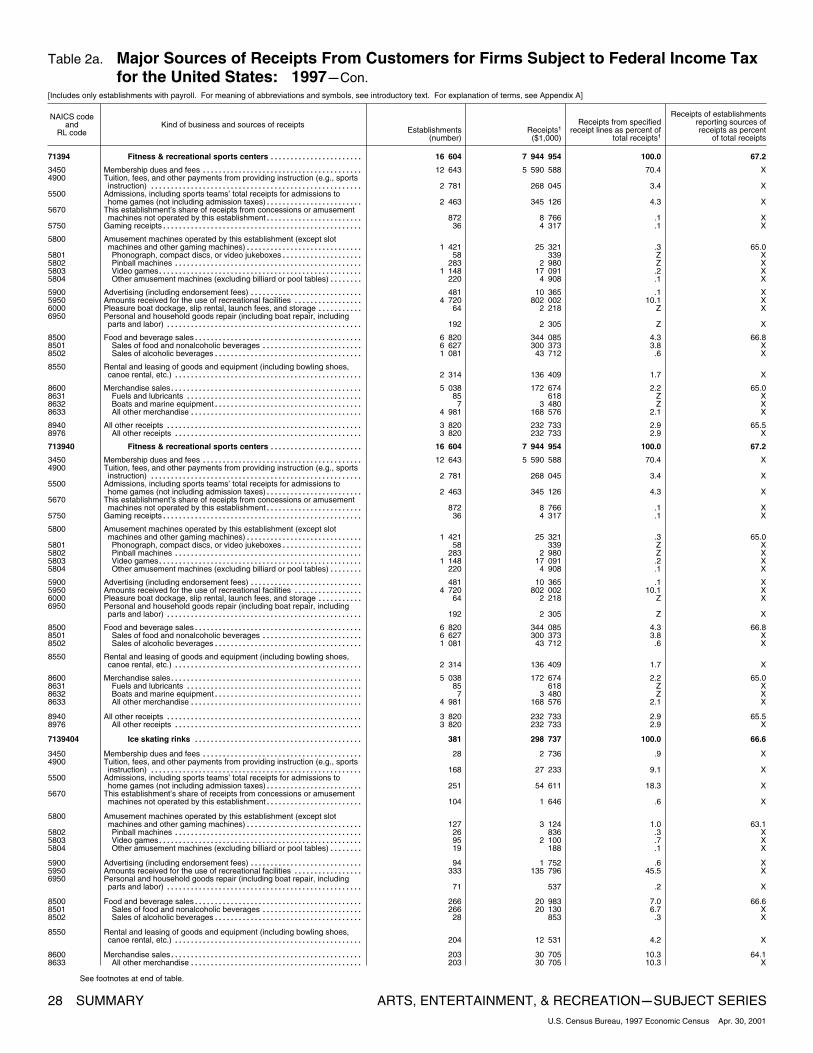
Table 2a. Major Sources of Receipts From Customers for Firms Subject to Federal Income Taxfor the United States: 1997mCon.
[Includes only establishments with payroll. For meaning of abbreviations and symbols, see introductory text. For explanation of terms, see Appendix A]
NAICS codeand
RL codeKind of business and sources of receipts
Establishments(number)
Receipts1
($1,000)
Receipts from specifiedreceipt lines as percent of
total receipts1
Receipts of establishmentsreporting sources ofreceipts as percent
of total receipts
71394 Fitness & recreational sports centers 16 604....................... 7 944 954 100.0 67.2
3450 Membership dues and fees 12 643........................................ 5 590 588 70.4 X4900 Tuition, fees, and other payments from providing instruction (e.g., sports
instruction) 2 781..................................................... 268 045 3.4 X5500 Admissions, including sports teams’ total receipts for admissions to
home games (not including admission taxes) 2 463........................ 345 126 4.3 X5670 This establishment’s share of receipts from concessions or amusement
machines not operated by this establishment 872........................ 8 766 .1 X5750 Gaming receipts 36.................................................. 4 317 .1 X
5800 Amusement machines operated by this establishment (except slotmachines and other gaming machines) 1 421............................. 25 321 .3 65.0
5801 Phonograph, compact discs, or video jukeboxes 58.................... 339 Z X5802 Pinball machines 283............................................... 2 980 Z X5803 Video games 1 148................................................... 17 091 .2 X5804 Other amusement machines (excluding billiard or pool tables) 220........ 4 908 .1 X
5900 Advertising (including endorsement fees) 481............................ 10 365 .1 X5950 Amounts received for the use of recreational facilities 4 720................. 802 002 10.1 X6000 Pleasure boat dockage, slip rental, launch fees, and storage 64........... 2 218 Z X6950 Personal and household goods repair (including boat repair, including
parts and labor) 192................................................. 2 305 Z X
8500 Food and beverage sales 6 820.......................................... 344 085 4.3 66.88501 Sales of food and nonalcoholic beverages 6 627......................... 300 373 3.8 X8502 Sales of alcoholic beverages 1 081..................................... 43 712 .6 X
8550 Rental and leasing of goods and equipment (including bowling shoes,canoe rental, etc.) 2 314............................................... 136 409 1.7 X
8600 Merchandise sales 5 038................................................ 172 674 2.2 65.08631 Fuels and lubricants 85............................................ 618 Z X8632 Boats and marine equipment 7..................................... 3 480 Z X8633 All other merchandise 4 981........................................... 168 576 2.1 X
8940 All other receipts 3 820................................................. 232 733 2.9 65.58976 All other receipts 3 820............................................... 232 733 2.9 X
713940 Fitness & recreational sports centers 16 604....................... 7 944 954 100.0 67.2
3450 Membership dues and fees 12 643........................................ 5 590 588 70.4 X4900 Tuition, fees, and other payments from providing instruction (e.g., sports
instruction) 2 781..................................................... 268 045 3.4 X5500 Admissions, including sports teams’ total receipts for admissions to
home games (not including admission taxes) 2 463........................ 345 126 4.3 X5670 This establishment’s share of receipts from concessions or amusement
machines not operated by this establishment 872........................ 8 766 .1 X5750 Gaming receipts 36.................................................. 4 317 .1 X
5800 Amusement machines operated by this establishment (except slotmachines and other gaming machines) 1 421............................. 25 321 .3 65.0
5801 Phonograph, compact discs, or video jukeboxes 58.................... 339 Z X5802 Pinball machines 283............................................... 2 980 Z X5803 Video games 1 148................................................... 17 091 .2 X5804 Other amusement machines (excluding billiard or pool tables) 220........ 4 908 .1 X
5900 Advertising (including endorsement fees) 481............................ 10 365 .1 X5950 Amounts received for the use of recreational facilities 4 720................. 802 002 10.1 X6000 Pleasure boat dockage, slip rental, launch fees, and storage 64........... 2 218 Z X6950 Personal and household goods repair (including boat repair, including
parts and labor) 192................................................. 2 305 Z X
8500 Food and beverage sales 6 820.......................................... 344 085 4.3 66.88501 Sales of food and nonalcoholic beverages 6 627......................... 300 373 3.8 X8502 Sales of alcoholic beverages 1 081..................................... 43 712 .6 X
8550 Rental and leasing of goods and equipment (including bowling shoes,canoe rental, etc.) 2 314............................................... 136 409 1.7 X
8600 Merchandise sales 5 038................................................ 172 674 2.2 65.08631 Fuels and lubricants 85............................................ 618 Z X8632 Boats and marine equipment 7..................................... 3 480 Z X8633 All other merchandise 4 981........................................... 168 576 2.1 X
8940 All other receipts 3 820................................................. 232 733 2.9 65.58976 All other receipts 3 820............................................... 232 733 2.9 X
7139404 Ice skating rinks 381.......................................... 298 737 100.0 66.6
3450 Membership dues and fees 28........................................ 2 736 .9 X4900 Tuition, fees, and other payments from providing instruction (e.g., sports
instruction) 168..................................................... 27 233 9.1 X5500 Admissions, including sports teams’ total receipts for admissions to
home games (not including admission taxes) 251........................ 54 611 18.3 X5670 This establishment’s share of receipts from concessions or amusement
machines not operated by this establishment 104........................ 1 646 .6 X
5800 Amusement machines operated by this establishment (except slotmachines and other gaming machines) 127............................. 3 124 1.0 63.1
5802 Pinball machines 26............................................... 836 .3 X5803 Video games 95................................................... 2 100 .7 X5804 Other amusement machines (excluding billiard or pool tables) 19........ 188 .1 X
5900 Advertising (including endorsement fees) 94............................ 1 752 .6 X5950 Amounts received for the use of recreational facilities 333................. 135 796 45.5 X6950 Personal and household goods repair (including boat repair, including
parts and labor) 71................................................. 537 .2 X
8500 Food and beverage sales 266.......................................... 20 983 7.0 66.68501 Sales of food and nonalcoholic beverages 266......................... 20 130 6.7 X8502 Sales of alcoholic beverages 28..................................... 853 .3 X
8550 Rental and leasing of goods and equipment (including bowling shoes,canoe rental, etc.) 204............................................... 12 531 4.2 X
8600 Merchandise sales 203................................................ 30 705 10.3 64.18633 All other merchandise 203........................................... 30 705 10.3 X
See footnotes at end of table.
28 SUMMARY ARTS, ENTERTAINMENT, & RECREATIONmSUBJECT SERIESU.S. Census Bureau, 1997 Economic Census Apr. 30, 2001

Table 2a. Major Sources of Receipts From Customers for Firms Subject to Federal Income Taxfor the United States: 1997mCon.
[Includes only establishments with payroll. For meaning of abbreviations and symbols, see introductory text. For explanation of terms, see Appendix A]
NAICS codeand
RL codeKind of business and sources of receipts
Establishments(number)
Receipts1
($1,000)
Receipts from specifiedreceipt lines as percent of
total receipts1
Receipts of establishmentsreporting sources ofreceipts as percent
of total receipts
7139404 Ice skating rinksmCon.
8940 All other receipts 165................................................. 6 590 2.2 64.68976 All other receipts 165............................................... 6 590 2.2 X
7139405 Roller skating rinks 1 611........................................ 416 339 100.0 66.5
3450 Membership dues and fees 133........................................ 6 121 1.5 X4900 Tuition, fees, and other payments from providing instruction (e.g., sports
instruction) 207..................................................... 2 313 .6 X5500 Admissions, including sports teams’ total receipts for admissions to
home games (not including admission taxes) 1 463........................ 216 776 52.1 X5670 This establishment’s share of receipts from concessions or amusement
machines not operated by this establishment 280........................ 3 009 .7 X5750 Gaming receipts 7.................................................. 1 513 .4 X
5800 Amusement machines operated by this establishment (except slotmachines and other gaming machines) 1 074............................. 19 335 4.6 65.0
5801 Phonograph, compact discs, or video jukeboxes 47.................... 333 .1 X5802 Pinball machines 203............................................... 1 907 .5 X5803 Video games 872................................................... 13 026 3.1 X5804 Other amusement machines (excluding billiard or pool tables) 148........ 4 069 1.0 X
5900 Advertising (including endorsement fees) 75............................ 349 .1 X5950 Amounts received for the use of recreational facilities 559................. 35 320 8.5 X6950 Personal and household goods repair (including boat repair, including
parts and labor) 25................................................. 508 .1 X
8500 Food and beverage sales 1 427.......................................... 74 945 18.0 66.08501 Sales of food and nonalcoholic beverages 1 427......................... 74 528 17.9 X8502 Sales of alcoholic beverages 13..................................... 417 .1 X
8550 Rental and leasing of goods and equipment (including bowling shoes,canoe rental, etc.) 856............................................... 20 612 5.0 X
8600 Merchandise sales 954................................................ 21 219 5.1 66.28631 Fuels and lubricants 12............................................ 165 Z X8633 All other merchandise 946........................................... 21 054 5.1 X
8940 All other receipts 446................................................. 14 319 3.4 66.48976 All other receipts 446............................................... 14 319 3.4 X
71395 Bowling centers 5 590........................................... 2 820 685 100.0 69.0
3450 Membership dues and fees 125........................................ 3 619 .1 X4900 Tuition, fees, and other payments from providing instruction (e.g., sports
instruction) 47..................................................... 356 Z X5500 Admissions, including sports teams’ total receipts for admissions to
home games (not including admission taxes) 31........................ 3 700 .1 X5670 This establishment’s share of receipts from concessions or amusement
machines not operated by this establishment 1 551........................ 28 115 1.0 X5750 Gaming receipts 496.................................................. 53 351 1.9 X
5800 Amusement machines operated by this establishment (except slotmachines and other gaming machines) 3 054............................. 69 560 2.5 65.6
5801 Phonograph, compact discs, or video jukeboxes 340.................... 1 760 .1 X5802 Pinball machines 746............................................... 5 148 .2 X5803 Video games 2 464................................................... 54 791 1.9 X5804 Other amusement machines (excluding billiard or pool tables) 512........ 7 860 .3 X
5900 Advertising (including endorsement fees) 273............................ 635 Z X5950 Amounts received for the use of recreational facilities 5 590................. 1 677 263 59.5 X6000 Pleasure boat dockage, slip rental, launch fees, and storage 27........... 291 Z X6950 Personal and household goods repair (including boat repair, including
parts and labor) 89................................................. 453 Z X
8500 Food and beverage sales 5 054.......................................... 803 907 28.5 68.18501 Sales of food and nonalcoholic beverages 4 766......................... 305 817 10.8 X8502 Sales of alcoholic beverages 4 382..................................... 498 090 17.7 X
8550 Rental and leasing of goods and equipment (including bowling shoes,canoe rental, etc.) 3 000............................................... 65 358 2.3 X
8600 Merchandise sales 2 147................................................ 45 767 1.6 68.58633 All other merchandise 2 145........................................... 45 650 1.6 X
8940 All other receipts 1 832................................................. 68 310 2.4 68.78976 All other receipts 1 832............................................... 68 310 2.4 X
713950 Bowling centers 5 590........................................... 2 820 685 100.0 69.0
3450 Membership dues and fees 125........................................ 3 619 .1 X4900 Tuition, fees, and other payments from providing instruction (e.g., sports
instruction) 47..................................................... 356 Z X5500 Admissions, including sports teams’ total receipts for admissions to
home games (not including admission taxes) 31........................ 3 700 .1 X5670 This establishment’s share of receipts from concessions or amusement
machines not operated by this establishment 1 551........................ 28 115 1.0 X5750 Gaming receipts 496.................................................. 53 351 1.9 X
5800 Amusement machines operated by this establishment (except slotmachines and other gaming machines) 3 054............................. 69 560 2.5 65.6
5801 Phonograph, compact discs, or video jukeboxes 340.................... 1 760 .1 X5802 Pinball machines 746............................................... 5 148 .2 X5803 Video games 2 464................................................... 54 791 1.9 X5804 Other amusement machines (excluding billiard or pool tables) 512........ 7 860 .3 X
5900 Advertising (including endorsement fees) 273............................ 635 Z X5950 Amounts received for the use of recreational facilities 5 590................. 1 677 263 59.5 X6000 Pleasure boat dockage, slip rental, launch fees, and storage 27........... 291 Z X6950 Personal and household goods repair (including boat repair, including
parts and labor) 89................................................. 453 Z X
8500 Food and beverage sales 5 054.......................................... 803 907 28.5 68.18501 Sales of food and nonalcoholic beverages 4 766......................... 305 817 10.8 X8502 Sales of alcoholic beverages 4 382..................................... 498 090 17.7 X
8550 Rental and leasing of goods and equipment (including bowling shoes,canoe rental, etc.) 3 000............................................... 65 358 2.3 X
See footnotes at end of table.
ARTS, ENTERTAINMENT, & RECREATIONmSUBJECT SERIES SUMMARY 29U.S. Census Bureau, 1997 Economic Census Apr. 30, 2001
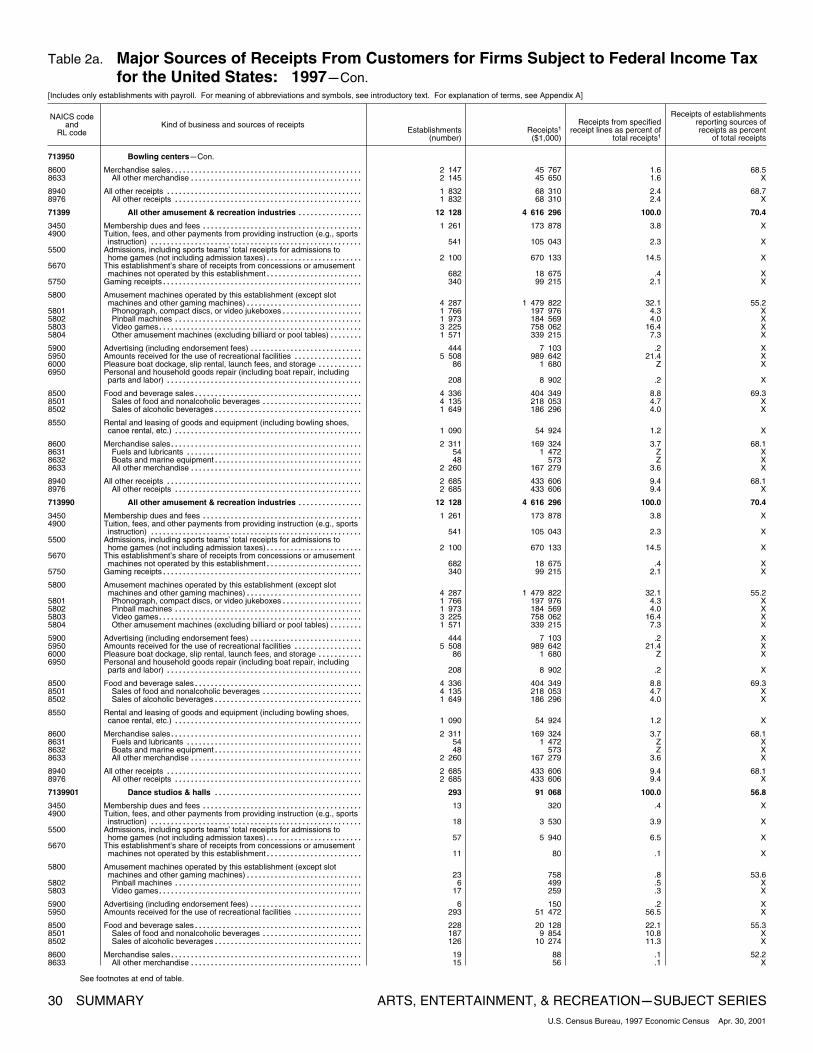
Table 2a. Major Sources of Receipts From Customers for Firms Subject to Federal Income Taxfor the United States: 1997mCon.
[Includes only establishments with payroll. For meaning of abbreviations and symbols, see introductory text. For explanation of terms, see Appendix A]
NAICS codeand
RL codeKind of business and sources of receipts
Establishments(number)
Receipts1
($1,000)
Receipts from specifiedreceipt lines as percent of
total receipts1
Receipts of establishmentsreporting sources ofreceipts as percent
of total receipts
713950 Bowling centersmCon.
8600 Merchandise sales 2 147................................................ 45 767 1.6 68.58633 All other merchandise 2 145........................................... 45 650 1.6 X
8940 All other receipts 1 832................................................. 68 310 2.4 68.78976 All other receipts 1 832............................................... 68 310 2.4 X
71399 All other amusement & recreation industries 12 128................ 4 616 296 100.0 70.4
3450 Membership dues and fees 1 261........................................ 173 878 3.8 X4900 Tuition, fees, and other payments from providing instruction (e.g., sports
instruction) 541..................................................... 105 043 2.3 X5500 Admissions, including sports teams’ total receipts for admissions to
home games (not including admission taxes) 2 100........................ 670 133 14.5 X5670 This establishment’s share of receipts from concessions or amusement
machines not operated by this establishment 682........................ 18 675 .4 X5750 Gaming receipts 340.................................................. 99 215 2.1 X
5800 Amusement machines operated by this establishment (except slotmachines and other gaming machines) 4 287............................. 1 479 822 32.1 55.2
5801 Phonograph, compact discs, or video jukeboxes 1 766.................... 197 976 4.3 X5802 Pinball machines 1 973............................................... 184 569 4.0 X5803 Video games 3 225................................................... 758 062 16.4 X5804 Other amusement machines (excluding billiard or pool tables) 1 571........ 339 215 7.3 X
5900 Advertising (including endorsement fees) 444............................ 7 103 .2 X5950 Amounts received for the use of recreational facilities 5 508................. 989 642 21.4 X6000 Pleasure boat dockage, slip rental, launch fees, and storage 86........... 1 680 Z X6950 Personal and household goods repair (including boat repair, including
parts and labor) 208................................................. 8 902 .2 X
8500 Food and beverage sales 4 336.......................................... 404 349 8.8 69.38501 Sales of food and nonalcoholic beverages 4 135......................... 218 053 4.7 X8502 Sales of alcoholic beverages 1 649..................................... 186 296 4.0 X
8550 Rental and leasing of goods and equipment (including bowling shoes,canoe rental, etc.) 1 090............................................... 54 924 1.2 X
8600 Merchandise sales 2 311................................................ 169 324 3.7 68.18631 Fuels and lubricants 54............................................ 1 472 Z X8632 Boats and marine equipment 48..................................... 573 Z X8633 All other merchandise 2 260........................................... 167 279 3.6 X
8940 All other receipts 2 685................................................. 433 606 9.4 68.18976 All other receipts 2 685............................................... 433 606 9.4 X
713990 All other amusement & recreation industries 12 128................ 4 616 296 100.0 70.4
3450 Membership dues and fees 1 261........................................ 173 878 3.8 X4900 Tuition, fees, and other payments from providing instruction (e.g., sports
instruction) 541..................................................... 105 043 2.3 X5500 Admissions, including sports teams’ total receipts for admissions to
home games (not including admission taxes) 2 100........................ 670 133 14.5 X5670 This establishment’s share of receipts from concessions or amusement
machines not operated by this establishment 682........................ 18 675 .4 X5750 Gaming receipts 340.................................................. 99 215 2.1 X
5800 Amusement machines operated by this establishment (except slotmachines and other gaming machines) 4 287............................. 1 479 822 32.1 55.2
5801 Phonograph, compact discs, or video jukeboxes 1 766.................... 197 976 4.3 X5802 Pinball machines 1 973............................................... 184 569 4.0 X5803 Video games 3 225................................................... 758 062 16.4 X5804 Other amusement machines (excluding billiard or pool tables) 1 571........ 339 215 7.3 X
5900 Advertising (including endorsement fees) 444............................ 7 103 .2 X5950 Amounts received for the use of recreational facilities 5 508................. 989 642 21.4 X6000 Pleasure boat dockage, slip rental, launch fees, and storage 86........... 1 680 Z X6950 Personal and household goods repair (including boat repair, including
parts and labor) 208................................................. 8 902 .2 X
8500 Food and beverage sales 4 336.......................................... 404 349 8.8 69.38501 Sales of food and nonalcoholic beverages 4 135......................... 218 053 4.7 X8502 Sales of alcoholic beverages 1 649..................................... 186 296 4.0 X
8550 Rental and leasing of goods and equipment (including bowling shoes,canoe rental, etc.) 1 090............................................... 54 924 1.2 X
8600 Merchandise sales 2 311................................................ 169 324 3.7 68.18631 Fuels and lubricants 54............................................ 1 472 Z X8632 Boats and marine equipment 48..................................... 573 Z X8633 All other merchandise 2 260........................................... 167 279 3.6 X
8940 All other receipts 2 685................................................. 433 606 9.4 68.18976 All other receipts 2 685............................................... 433 606 9.4 X
7139901 Dance studios & halls 293..................................... 91 068 100.0 56.8
3450 Membership dues and fees 13........................................ 320 .4 X4900 Tuition, fees, and other payments from providing instruction (e.g., sports
instruction) 18..................................................... 3 530 3.9 X5500 Admissions, including sports teams’ total receipts for admissions to
home games (not including admission taxes) 57........................ 5 940 6.5 X5670 This establishment’s share of receipts from concessions or amusement
machines not operated by this establishment 11........................ 80 .1 X
5800 Amusement machines operated by this establishment (except slotmachines and other gaming machines) 23............................. 758 .8 53.6
5802 Pinball machines 6............................................... 499 .5 X5803 Video games 17................................................... 259 .3 X
5900 Advertising (including endorsement fees) 6............................ 150 .2 X5950 Amounts received for the use of recreational facilities 293................. 51 472 56.5 X
8500 Food and beverage sales 228.......................................... 20 128 22.1 55.38501 Sales of food and nonalcoholic beverages 187......................... 9 854 10.8 X8502 Sales of alcoholic beverages 126..................................... 10 274 11.3 X
8600 Merchandise sales 19................................................ 88 .1 52.28633 All other merchandise 15........................................... 56 .1 X
See footnotes at end of table.
30 SUMMARY ARTS, ENTERTAINMENT, & RECREATIONmSUBJECT SERIESU.S. Census Bureau, 1997 Economic Census Apr. 30, 2001
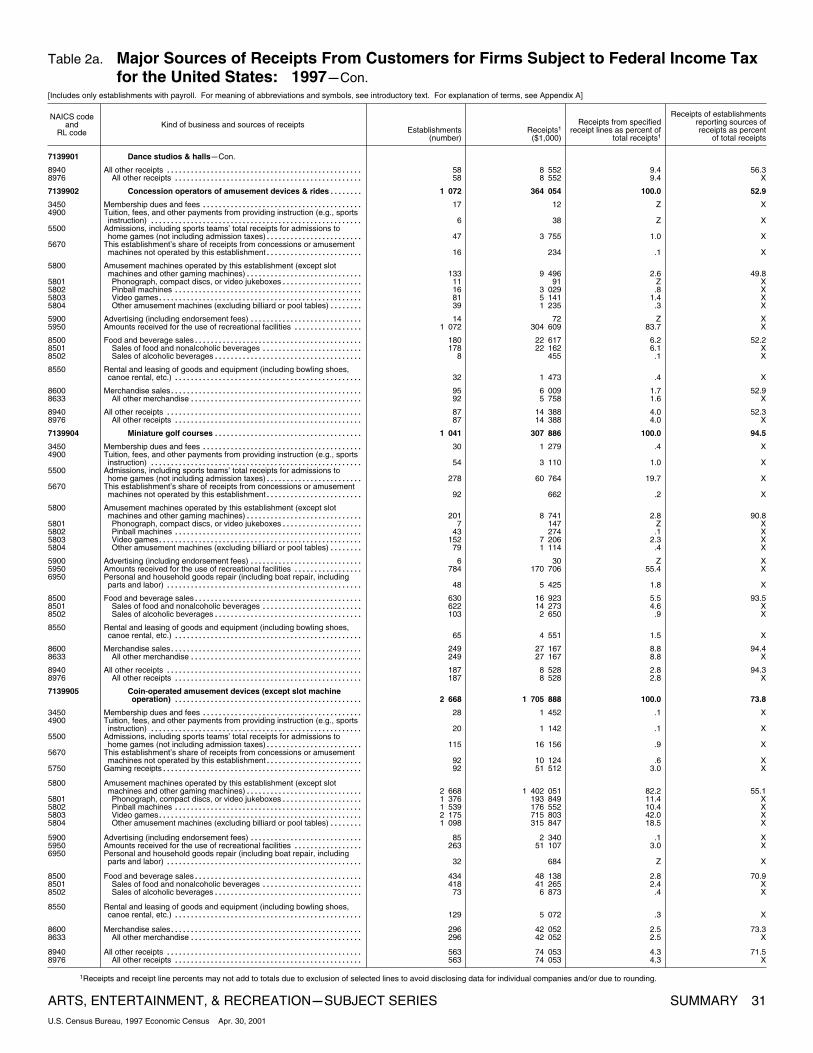
Table 2a. Major Sources of Receipts From Customers for Firms Subject to Federal Income Taxfor the United States: 1997mCon.
[Includes only establishments with payroll. For meaning of abbreviations and symbols, see introductory text. For explanation of terms, see Appendix A]
NAICS codeand
RL codeKind of business and sources of receipts
Establishments(number)
Receipts1
($1,000)
Receipts from specifiedreceipt lines as percent of
total receipts1
Receipts of establishmentsreporting sources ofreceipts as percent
of total receipts
7139901 Dance studios & hallsmCon.
8940 All other receipts 58................................................. 8 552 9.4 56.38976 All other receipts 58............................................... 8 552 9.4 X
7139902 Concession operators of amusement devices & rides 1 072........ 364 054 100.0 52.9
3450 Membership dues and fees 17........................................ 12 Z X4900 Tuition, fees, and other payments from providing instruction (e.g., sports
instruction) 6..................................................... 38 Z X5500 Admissions, including sports teams’ total receipts for admissions to
home games (not including admission taxes) 47........................ 3 755 1.0 X5670 This establishment’s share of receipts from concessions or amusement
machines not operated by this establishment 16........................ 234 .1 X
5800 Amusement machines operated by this establishment (except slotmachines and other gaming machines) 133............................. 9 496 2.6 49.8
5801 Phonograph, compact discs, or video jukeboxes 11.................... 91 Z X5802 Pinball machines 16............................................... 3 029 .8 X5803 Video games 81................................................... 5 141 1.4 X5804 Other amusement machines (excluding billiard or pool tables) 39........ 1 235 .3 X
5900 Advertising (including endorsement fees) 14............................ 72 Z X5950 Amounts received for the use of recreational facilities 1 072................. 304 609 83.7 X
8500 Food and beverage sales 180.......................................... 22 617 6.2 52.28501 Sales of food and nonalcoholic beverages 178......................... 22 162 6.1 X8502 Sales of alcoholic beverages 8..................................... 455 .1 X
8550 Rental and leasing of goods and equipment (including bowling shoes,canoe rental, etc.) 32............................................... 1 473 .4 X
8600 Merchandise sales 95................................................ 6 009 1.7 52.98633 All other merchandise 92........................................... 5 758 1.6 X
8940 All other receipts 87................................................. 14 388 4.0 52.38976 All other receipts 87............................................... 14 388 4.0 X
7139904 Miniature golf courses 1 041..................................... 307 886 100.0 94.5
3450 Membership dues and fees 30........................................ 1 279 .4 X4900 Tuition, fees, and other payments from providing instruction (e.g., sports
instruction) 54..................................................... 3 110 1.0 X5500 Admissions, including sports teams’ total receipts for admissions to
home games (not including admission taxes) 278........................ 60 764 19.7 X5670 This establishment’s share of receipts from concessions or amusement
machines not operated by this establishment 92........................ 662 .2 X
5800 Amusement machines operated by this establishment (except slotmachines and other gaming machines) 201............................. 8 741 2.8 90.8
5801 Phonograph, compact discs, or video jukeboxes 7.................... 147 Z X5802 Pinball machines 43............................................... 274 .1 X5803 Video games 152................................................... 7 206 2.3 X5804 Other amusement machines (excluding billiard or pool tables) 79........ 1 114 .4 X
5900 Advertising (including endorsement fees) 6............................ 30 Z X5950 Amounts received for the use of recreational facilities 784................. 170 706 55.4 X6950 Personal and household goods repair (including boat repair, including
parts and labor) 48................................................. 5 425 1.8 X
8500 Food and beverage sales 630.......................................... 16 923 5.5 93.58501 Sales of food and nonalcoholic beverages 622......................... 14 273 4.6 X8502 Sales of alcoholic beverages 103..................................... 2 650 .9 X
8550 Rental and leasing of goods and equipment (including bowling shoes,canoe rental, etc.) 65............................................... 4 551 1.5 X
8600 Merchandise sales 249................................................ 27 167 8.8 94.48633 All other merchandise 249........................................... 27 167 8.8 X
8940 All other receipts 187................................................. 8 528 2.8 94.38976 All other receipts 187............................................... 8 528 2.8 X
7139905 Coin~operated amusement devices (except slot machineoperation) 2 668............................................... 1 705 888 100.0 73.8
3450 Membership dues and fees 28........................................ 1 452 .1 X4900 Tuition, fees, and other payments from providing instruction (e.g., sports
instruction) 20..................................................... 1 142 .1 X5500 Admissions, including sports teams’ total receipts for admissions to
home games (not including admission taxes) 115........................ 16 156 .9 X5670 This establishment’s share of receipts from concessions or amusement
machines not operated by this establishment 92........................ 10 124 .6 X5750 Gaming receipts 92.................................................. 51 512 3.0 X
5800 Amusement machines operated by this establishment (except slotmachines and other gaming machines) 2 668............................. 1 402 051 82.2 55.1
5801 Phonograph, compact discs, or video jukeboxes 1 376.................... 193 849 11.4 X5802 Pinball machines 1 539............................................... 176 552 10.4 X5803 Video games 2 175................................................... 715 803 42.0 X5804 Other amusement machines (excluding billiard or pool tables) 1 098........ 315 847 18.5 X
5900 Advertising (including endorsement fees) 85............................ 2 340 .1 X5950 Amounts received for the use of recreational facilities 263................. 51 107 3.0 X6950 Personal and household goods repair (including boat repair, including
parts and labor) 32................................................. 684 Z X
8500 Food and beverage sales 434.......................................... 48 138 2.8 70.98501 Sales of food and nonalcoholic beverages 418......................... 41 265 2.4 X8502 Sales of alcoholic beverages 73..................................... 6 873 .4 X
8550 Rental and leasing of goods and equipment (including bowling shoes,canoe rental, etc.) 129............................................... 5 072 .3 X
8600 Merchandise sales 296................................................ 42 052 2.5 73.38633 All other merchandise 296........................................... 42 052 2.5 X
8940 All other receipts 563................................................. 74 053 4.3 71.58976 All other receipts 563............................................... 74 053 4.3 X
1Receipts and receipt line percents may not add to totals due to exclusion of selected lines to avoid disclosing data for individual companies and/or due to rounding.
ARTS, ENTERTAINMENT, & RECREATIONmSUBJECT SERIES SUMMARY 31U.S. Census Bureau, 1997 Economic Census Apr. 30, 2001
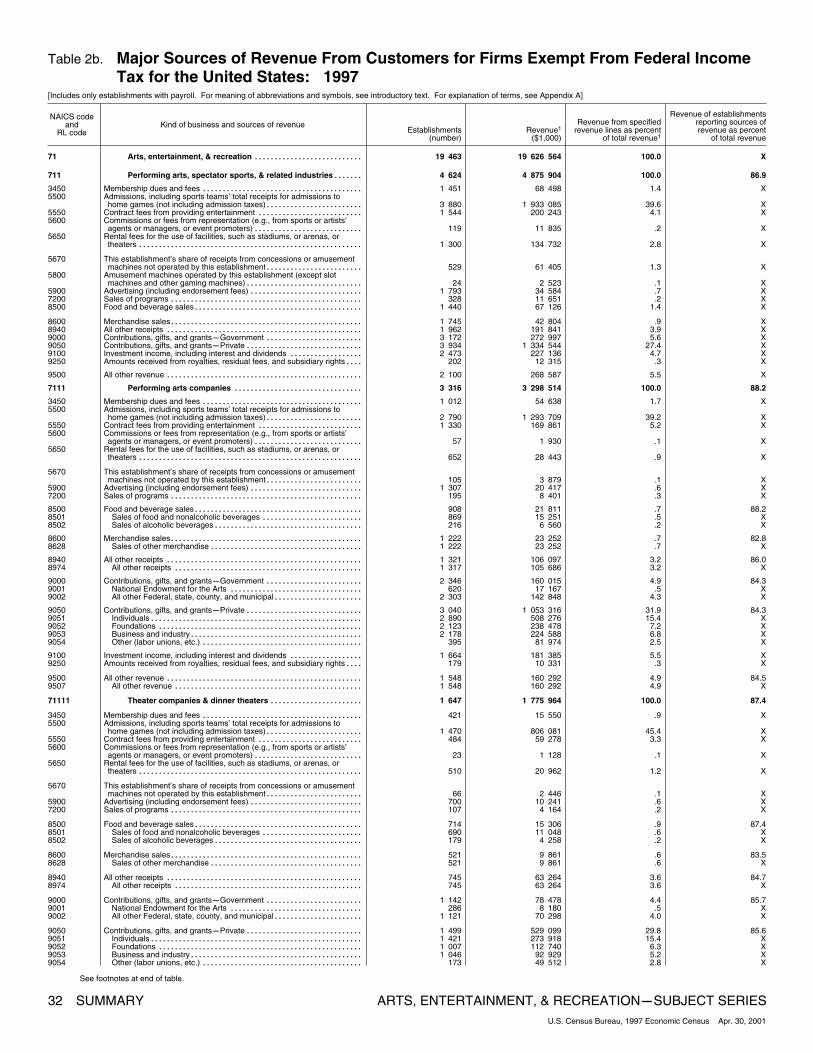
Table 2b. Major Sources of Revenue From Customers for Firms Exempt From Federal IncomeTax for the United States: 1997
[Includes only establishments with payroll. For meaning of abbreviations and symbols, see introductory text. For explanation of terms, see Appendix A]
NAICS codeand
RL codeKind of business and sources of revenue
Establishments(number)
Revenue1
($1,000)
Revenue from specifiedrevenue lines as percent
of total revenue1
Revenue of establishmentsreporting sources ofrevenue as percent
of total revenue
71 Arts, entertainment, & recreation 19 463........................... 19 626 564 100.0 X
711 Performing arts, spectator sports, & related industries 4 624....... 4 875 904 100.0 86.9
3450 Membership dues and fees 1 451........................................ 68 498 1.4 X5500 Admissions, including sports teams’ total receipts for admissions to
home games (not including admission taxes) 3 880........................ 1 933 085 39.6 X5550 Contract fees from providing entertainment 1 544.......................... 200 243 4.1 X5600 Commissions or fees from representation (e.g., from sports or artists’
agents or managers, or event promoters) 119........................... 11 835 .2 X5650 Rental fees for the use of facilities, such as stadiums, or arenas, or
theaters 1 300........................................................ 134 732 2.8 X
5670 This establishment’s share of receipts from concessions or amusementmachines not operated by this establishment 529........................ 61 405 1.3 X
5800 Amusement machines operated by this establishment (except slotmachines and other gaming machines) 24............................. 2 523 .1 X
5900 Advertising (including endorsement fees) 1 793............................ 34 584 .7 X7200 Sales of programs 328................................................ 11 651 .2 X8500 Food and beverage sales 1 440.......................................... 67 126 1.4 X
8600 Merchandise sales 1 745................................................ 42 804 .9 X8940 All other receipts 1 962................................................. 191 841 3.9 X9000 Contributions, gifts, and grantsmGovernment 3 172........................ 272 997 5.6 X9050 Contributions, gifts, and grantsmPrivate 3 934............................. 1 334 544 27.4 X9100 Investment income, including interest and dividends 2 473.................. 227 136 4.7 X9250 Amounts received from royalties, residual fees, and subsidiary rights 202.... 12 315 .3 X
9500 All other revenue 2 100................................................. 268 587 5.5 X
7111 Performing arts companies 3 316................................ 3 298 514 100.0 88.2
3450 Membership dues and fees 1 012........................................ 54 638 1.7 X5500 Admissions, including sports teams’ total receipts for admissions to
home games (not including admission taxes) 2 790........................ 1 293 709 39.2 X5550 Contract fees from providing entertainment 1 330.......................... 169 861 5.2 X5600 Commissions or fees from representation (e.g., from sports or artists’
agents or managers, or event promoters) 57........................... 1 930 .1 X5650 Rental fees for the use of facilities, such as stadiums, or arenas, or
theaters 652........................................................ 28 443 .9 X
5670 This establishment’s share of receipts from concessions or amusementmachines not operated by this establishment 105........................ 3 879 .1 X
5900 Advertising (including endorsement fees) 1 307............................ 20 417 .6 X7200 Sales of programs 195................................................ 8 401 .3 X
8500 Food and beverage sales 908.......................................... 21 811 .7 88.28501 Sales of food and nonalcoholic beverages 869......................... 15 251 .5 X8502 Sales of alcoholic beverages 216..................................... 6 560 .2 X
8600 Merchandise sales 1 222................................................ 23 252 .7 82.88628 Sales of other merchandise 1 222...................................... 23 252 .7 X
8940 All other receipts 1 321................................................. 106 097 3.2 86.08974 All other receipts 1 317............................................... 105 686 3.2 X
9000 Contributions, gifts, and grantsmGovernment 2 346........................ 160 015 4.9 84.39001 National Endowment for the Arts 620................................. 17 167 .5 X9002 All other Federal, state, county, and municipal 2 303...................... 142 848 4.3 X
9050 Contributions, gifts, and grantsmPrivate 3 040............................. 1 053 316 31.9 84.39051 Individuals 2 890..................................................... 508 276 15.4 X9052 Foundations 2 123................................................... 238 478 7.2 X9053 Business and industry 2 178........................................... 224 588 6.8 X9054 Other (labor unions, etc.) 395........................................ 81 974 2.5 X
9100 Investment income, including interest and dividends 1 664.................. 181 385 5.5 X9250 Amounts received from royalties, residual fees, and subsidiary rights 179.... 10 331 .3 X
9500 All other revenue 1 548................................................. 160 292 4.9 84.59507 All other revenue 1 548............................................... 160 292 4.9 X
71111 Theater companies & dinner theaters 1 647....................... 1 775 964 100.0 87.4
3450 Membership dues and fees 421........................................ 15 550 .9 X5500 Admissions, including sports teams’ total receipts for admissions to
home games (not including admission taxes) 1 470........................ 806 081 45.4 X5550 Contract fees from providing entertainment 484.......................... 59 278 3.3 X5600 Commissions or fees from representation (e.g., from sports or artists’
agents or managers, or event promoters) 23........................... 1 128 .1 X5650 Rental fees for the use of facilities, such as stadiums, or arenas, or
theaters 510........................................................ 20 962 1.2 X
5670 This establishment’s share of receipts from concessions or amusementmachines not operated by this establishment 66........................ 2 446 .1 X
5900 Advertising (including endorsement fees) 700............................ 10 241 .6 X7200 Sales of programs 107................................................ 4 164 .2 X
8500 Food and beverage sales 714.......................................... 15 306 .9 87.48501 Sales of food and nonalcoholic beverages 690......................... 11 048 .6 X8502 Sales of alcoholic beverages 179..................................... 4 258 .2 X
8600 Merchandise sales 521................................................ 9 861 .6 83.58628 Sales of other merchandise 521...................................... 9 861 .6 X
8940 All other receipts 745................................................. 63 264 3.6 84.78974 All other receipts 745............................................... 63 264 3.6 X
9000 Contributions, gifts, and grantsmGovernment 1 142........................ 78 478 4.4 85.79001 National Endowment for the Arts 286................................. 8 180 .5 X9002 All other Federal, state, county, and municipal 1 121...................... 70 298 4.0 X
9050 Contributions, gifts, and grantsmPrivate 1 499............................. 529 099 29.8 85.69051 Individuals 1 421..................................................... 273 918 15.4 X9052 Foundations 1 007................................................... 112 740 6.3 X9053 Business and industry 1 046........................................... 92 929 5.2 X9054 Other (labor unions, etc.) 173........................................ 49 512 2.8 X
See footnotes at end of table.
32 SUMMARY ARTS, ENTERTAINMENT, & RECREATIONmSUBJECT SERIESU.S. Census Bureau, 1997 Economic Census Apr. 30, 2001

Table 2b. Major Sources of Revenue From Customers for Firms Exempt From Federal IncomeTax for the United States: 1997mCon.
[Includes only establishments with payroll. For meaning of abbreviations and symbols, see introductory text. For explanation of terms, see Appendix A]
NAICS codeand
RL codeKind of business and sources of revenue
Establishments(number)
Revenue1
($1,000)
Revenue from specifiedrevenue lines as percent
of total revenue1
Revenue of establishmentsreporting sources ofrevenue as percent
of total revenue
71111 Theater companies & dinner theatersmCon.
9100 Investment income, including interest and dividends 791.................. 66 587 3.7 X9250 Amounts received from royalties, residual fees, and subsidiary rights 98.... 6 365 .4 X
9500 All other revenue 768................................................. 86 416 4.9 85.29507 All other revenue 768............................................... 86 416 4.9 X
711110 Theater companies & dinner theaters 1 647....................... 1 775 964 100.0 87.4
3450 Membership dues and fees 421........................................ 15 550 .9 X5500 Admissions, including sports teams’ total receipts for admissions to
home games (not including admission taxes) 1 470........................ 806 081 45.4 X5550 Contract fees from providing entertainment 484.......................... 59 278 3.3 X5600 Commissions or fees from representation (e.g., from sports or artists’
agents or managers, or event promoters) 23........................... 1 128 .1 X5650 Rental fees for the use of facilities, such as stadiums, or arenas, or
theaters 510........................................................ 20 962 1.2 X
5670 This establishment’s share of receipts from concessions or amusementmachines not operated by this establishment 66........................ 2 446 .1 X
5900 Advertising (including endorsement fees) 700............................ 10 241 .6 X7200 Sales of programs 107................................................ 4 164 .2 X
8500 Food and beverage sales 714.......................................... 15 306 .9 87.48501 Sales of food and nonalcoholic beverages 690......................... 11 048 .6 X8502 Sales of alcoholic beverages 179..................................... 4 258 .2 X
8600 Merchandise sales 521................................................ 9 861 .6 83.58628 Sales of other merchandise 521...................................... 9 861 .6 X
8940 All other receipts 745................................................. 63 264 3.6 84.78974 All other receipts 745............................................... 63 264 3.6 X
9000 Contributions, gifts, and grantsmGovernment 1 142........................ 78 478 4.4 85.79001 National Endowment for the Arts 286................................. 8 180 .5 X9002 All other Federal, state, county, and municipal 1 121...................... 70 298 4.0 X
9050 Contributions, gifts, and grantsmPrivate 1 499............................. 529 099 29.8 85.69051 Individuals 1 421..................................................... 273 918 15.4 X9052 Foundations 1 007................................................... 112 740 6.3 X9053 Business and industry 1 046........................................... 92 929 5.2 X9054 Other (labor unions, etc.) 173........................................ 49 512 2.8 X
9100 Investment income, including interest and dividends 791.................. 66 587 3.7 X9250 Amounts received from royalties, residual fees, and subsidiary rights 98.... 6 365 .4 X
9500 All other revenue 768................................................. 86 416 4.9 85.29507 All other revenue 768............................................... 86 416 4.9 X
7111101 Opera companies 147......................................... 593 608 100.0 92.3
3450 Membership dues and fees 37........................................ 3 967 .7 X5500 Admissions, including sports teams’ total receipts for admissions to
home games (not including admission taxes) 138........................ 223 911 37.7 X5550 Contract fees from providing entertainment 53.......................... 16 694 2.8 X5650 Rental fees for the use of facilities, such as stadiums, or arenas, or
theaters 38........................................................ 4 707 .8 X5900 Advertising (including endorsement fees) 60............................ 1 229 .2 X7200 Sales of programs 12................................................ 185 Z X
8500 Food and beverage sales 25.......................................... 2 020 .3 92.38501 Sales of food and nonalcoholic beverages 19......................... 1 433 .2 X8502 Sales of alcoholic beverages 18..................................... 587 .1 X
8600 Merchandise sales 55................................................ 1 963 .3 92.38628 Sales of other merchandise 55...................................... 1 963 .3 X
8940 All other receipts 64................................................. 6 901 1.2 92.38974 All other receipts 64............................................... 6 901 1.2 X
9000 Contributions, gifts, and grantsmGovernment 114........................ 18 619 3.1 92.19001 National Endowment for the Arts 43................................. 2 454 .4 X9002 All other Federal, state, county, and municipal 113...................... 16 165 2.7 X
9050 Contributions, gifts, and grantsmPrivate 139............................. 247 055 41.6 92.19051 Individuals 135..................................................... 152 279 25.7 X9052 Foundations 112................................................... 31 185 5.3 X9053 Business and industry 116........................................... 27 863 4.7 X9054 Other (labor unions, etc.) 34........................................ 35 728 6.0 X
9100 Investment income, including interest and dividends 111.................. 37 534 6.3 X
9500 All other revenue 90................................................. 26 514 4.5 92.09507 All other revenue 90............................................... 26 514 4.5 X
7111102 Theater companies 1 500........................................ 1 182 356 100.0 84.9
3450 Membership dues and fees 384........................................ 11 583 1.0 X5500 Admissions, including sports teams’ total receipts for admissions to
home games (not including admission taxes) 1 332........................ 582 170 49.2 X5550 Contract fees from providing entertainment 431.......................... 42 584 3.6 X5600 Commissions or fees from representation (e.g., from sports or artists’
agents or managers, or event promoters) 23........................... 1 128 .1 X5650 Rental fees for the use of facilities, such as stadiums, or arenas, or
theaters 472........................................................ 16 255 1.4 X
5670 This establishment’s share of receipts from concessions or amusementmachines not operated by this establishment 61........................ 1 024 .1 X
5900 Advertising (including endorsement fees) 640............................ 9 012 .8 X7200 Sales of programs 95................................................ 3 979 .3 X
8500 Food and beverage sales 689.......................................... 13 286 1.1 84.98501 Sales of food and nonalcoholic beverages 671......................... 9 615 .8 X8502 Sales of alcoholic beverages 161..................................... 3 671 .3 X
8600 Merchandise sales 466................................................ 7 898 .7 79.18628 Sales of other merchandise 466...................................... 7 898 .7 X
See footnotes at end of table.
ARTS, ENTERTAINMENT, & RECREATIONmSUBJECT SERIES SUMMARY 33U.S. Census Bureau, 1997 Economic Census Apr. 30, 2001
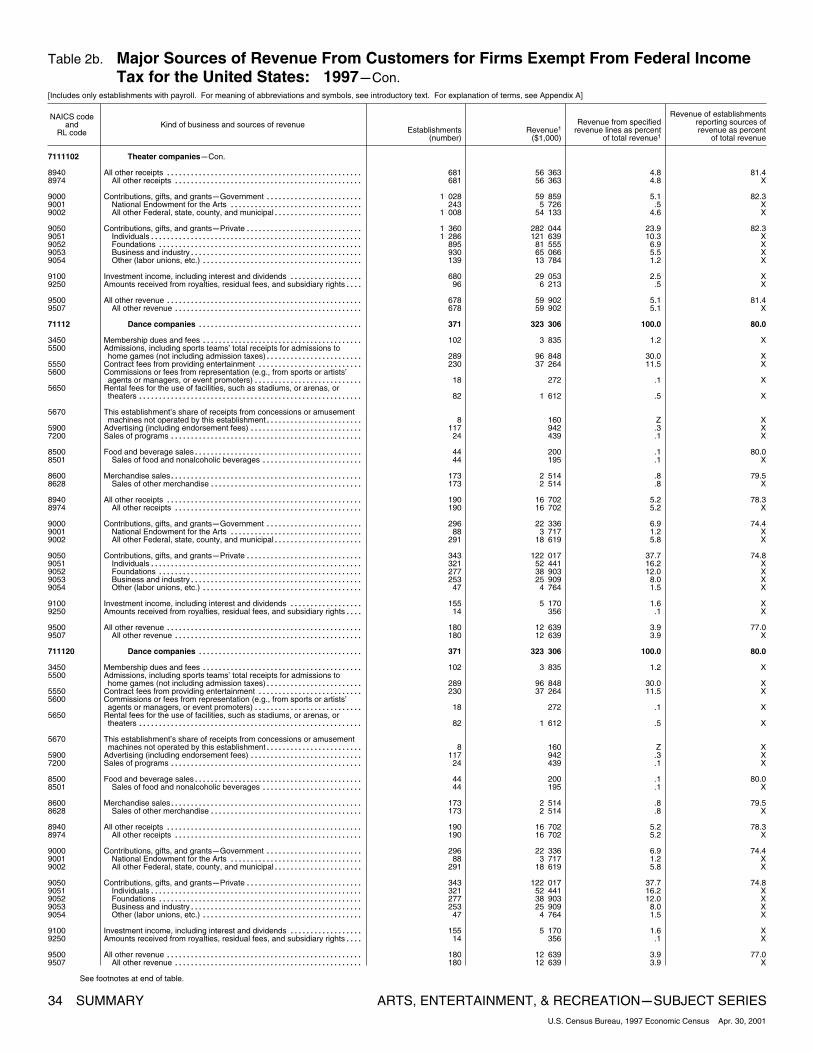
Table 2b. Major Sources of Revenue From Customers for Firms Exempt From Federal IncomeTax for the United States: 1997mCon.
[Includes only establishments with payroll. For meaning of abbreviations and symbols, see introductory text. For explanation of terms, see Appendix A]
NAICS codeand
RL codeKind of business and sources of revenue
Establishments(number)
Revenue1
($1,000)
Revenue from specifiedrevenue lines as percent
of total revenue1
Revenue of establishmentsreporting sources ofrevenue as percent
of total revenue
7111102 Theater companiesmCon.
8940 All other receipts 681................................................. 56 363 4.8 81.48974 All other receipts 681............................................... 56 363 4.8 X
9000 Contributions, gifts, and grantsmGovernment 1 028........................ 59 859 5.1 82.39001 National Endowment for the Arts 243................................. 5 726 .5 X9002 All other Federal, state, county, and municipal 1 008...................... 54 133 4.6 X
9050 Contributions, gifts, and grantsmPrivate 1 360............................. 282 044 23.9 82.39051 Individuals 1 286..................................................... 121 639 10.3 X9052 Foundations 895................................................... 81 555 6.9 X9053 Business and industry 930........................................... 65 066 5.5 X9054 Other (labor unions, etc.) 139........................................ 13 784 1.2 X
9100 Investment income, including interest and dividends 680.................. 29 053 2.5 X9250 Amounts received from royalties, residual fees, and subsidiary rights 96.... 6 213 .5 X
9500 All other revenue 678................................................. 59 902 5.1 81.49507 All other revenue 678............................................... 59 902 5.1 X
71112 Dance companies 371......................................... 323 306 100.0 80.0
3450 Membership dues and fees 102........................................ 3 835 1.2 X5500 Admissions, including sports teams’ total receipts for admissions to
home games (not including admission taxes) 289........................ 96 848 30.0 X5550 Contract fees from providing entertainment 230.......................... 37 264 11.5 X5600 Commissions or fees from representation (e.g., from sports or artists’
agents or managers, or event promoters) 18........................... 272 .1 X5650 Rental fees for the use of facilities, such as stadiums, or arenas, or
theaters 82........................................................ 1 612 .5 X
5670 This establishment’s share of receipts from concessions or amusementmachines not operated by this establishment 8........................ 160 Z X
5900 Advertising (including endorsement fees) 117............................ 942 .3 X7200 Sales of programs 24................................................ 439 .1 X
8500 Food and beverage sales 44.......................................... 200 .1 80.08501 Sales of food and nonalcoholic beverages 44......................... 195 .1 X
8600 Merchandise sales 173................................................ 2 514 .8 79.58628 Sales of other merchandise 173...................................... 2 514 .8 X
8940 All other receipts 190................................................. 16 702 5.2 78.38974 All other receipts 190............................................... 16 702 5.2 X
9000 Contributions, gifts, and grantsmGovernment 296........................ 22 336 6.9 74.49001 National Endowment for the Arts 88................................. 3 717 1.2 X9002 All other Federal, state, county, and municipal 291...................... 18 619 5.8 X
9050 Contributions, gifts, and grantsmPrivate 343............................. 122 017 37.7 74.89051 Individuals 321..................................................... 52 441 16.2 X9052 Foundations 277................................................... 38 903 12.0 X9053 Business and industry 253........................................... 25 909 8.0 X9054 Other (labor unions, etc.) 47........................................ 4 764 1.5 X
9100 Investment income, including interest and dividends 155.................. 5 170 1.6 X9250 Amounts received from royalties, residual fees, and subsidiary rights 14.... 356 .1 X
9500 All other revenue 180................................................. 12 639 3.9 77.09507 All other revenue 180............................................... 12 639 3.9 X
711120 Dance companies 371......................................... 323 306 100.0 80.0
3450 Membership dues and fees 102........................................ 3 835 1.2 X5500 Admissions, including sports teams’ total receipts for admissions to
home games (not including admission taxes) 289........................ 96 848 30.0 X5550 Contract fees from providing entertainment 230.......................... 37 264 11.5 X5600 Commissions or fees from representation (e.g., from sports or artists’
agents or managers, or event promoters) 18........................... 272 .1 X5650 Rental fees for the use of facilities, such as stadiums, or arenas, or
theaters 82........................................................ 1 612 .5 X
5670 This establishment’s share of receipts from concessions or amusementmachines not operated by this establishment 8........................ 160 Z X
5900 Advertising (including endorsement fees) 117............................ 942 .3 X7200 Sales of programs 24................................................ 439 .1 X
8500 Food and beverage sales 44.......................................... 200 .1 80.08501 Sales of food and nonalcoholic beverages 44......................... 195 .1 X
8600 Merchandise sales 173................................................ 2 514 .8 79.58628 Sales of other merchandise 173...................................... 2 514 .8 X
8940 All other receipts 190................................................. 16 702 5.2 78.38974 All other receipts 190............................................... 16 702 5.2 X
9000 Contributions, gifts, and grantsmGovernment 296........................ 22 336 6.9 74.49001 National Endowment for the Arts 88................................. 3 717 1.2 X9002 All other Federal, state, county, and municipal 291...................... 18 619 5.8 X
9050 Contributions, gifts, and grantsmPrivate 343............................. 122 017 37.7 74.89051 Individuals 321..................................................... 52 441 16.2 X9052 Foundations 277................................................... 38 903 12.0 X9053 Business and industry 253........................................... 25 909 8.0 X9054 Other (labor unions, etc.) 47........................................ 4 764 1.5 X
9100 Investment income, including interest and dividends 155.................. 5 170 1.6 X9250 Amounts received from royalties, residual fees, and subsidiary rights 14.... 356 .1 X
9500 All other revenue 180................................................. 12 639 3.9 77.09507 All other revenue 180............................................... 12 639 3.9 X
See footnotes at end of table.
34 SUMMARY ARTS, ENTERTAINMENT, & RECREATIONmSUBJECT SERIESU.S. Census Bureau, 1997 Economic Census Apr. 30, 2001
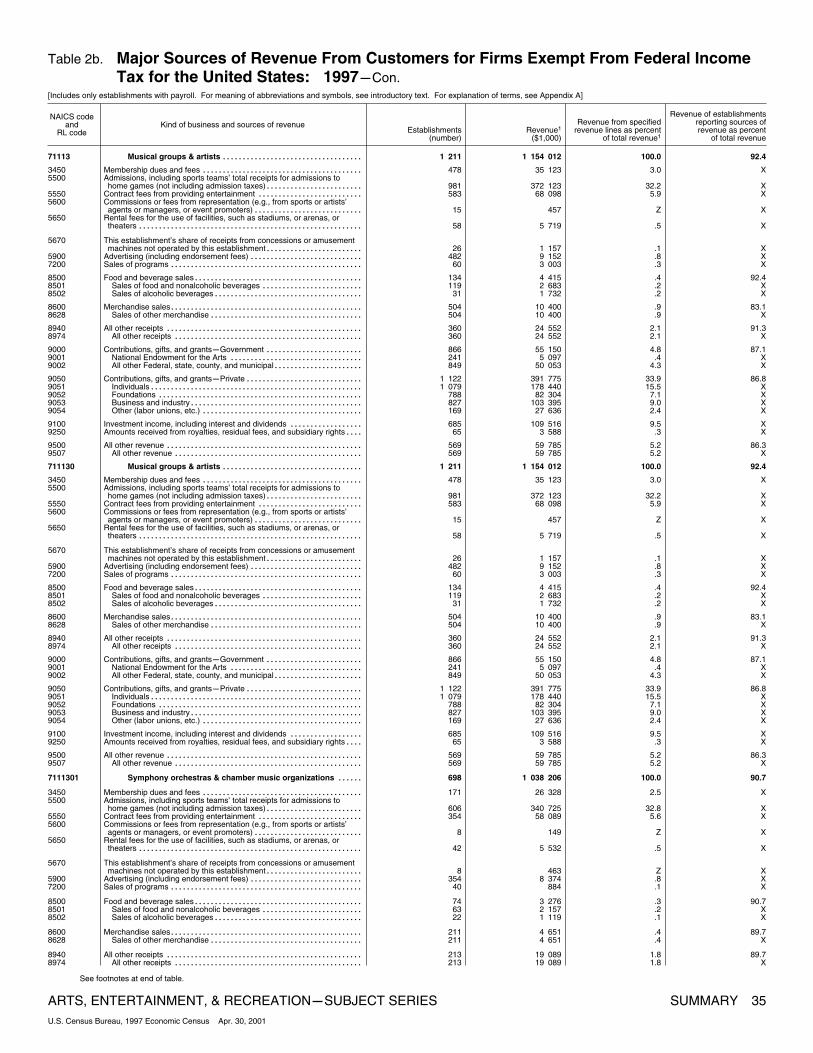
Table 2b. Major Sources of Revenue From Customers for Firms Exempt From Federal IncomeTax for the United States: 1997mCon.
[Includes only establishments with payroll. For meaning of abbreviations and symbols, see introductory text. For explanation of terms, see Appendix A]
NAICS codeand
RL codeKind of business and sources of revenue
Establishments(number)
Revenue1
($1,000)
Revenue from specifiedrevenue lines as percent
of total revenue1
Revenue of establishmentsreporting sources ofrevenue as percent
of total revenue
71113 Musical groups & artists 1 211................................... 1 154 012 100.0 92.4
3450 Membership dues and fees 478........................................ 35 123 3.0 X5500 Admissions, including sports teams’ total receipts for admissions to
home games (not including admission taxes) 981........................ 372 123 32.2 X5550 Contract fees from providing entertainment 583.......................... 68 098 5.9 X5600 Commissions or fees from representation (e.g., from sports or artists’
agents or managers, or event promoters) 15........................... 457 Z X5650 Rental fees for the use of facilities, such as stadiums, or arenas, or
theaters 58........................................................ 5 719 .5 X
5670 This establishment’s share of receipts from concessions or amusementmachines not operated by this establishment 26........................ 1 157 .1 X
5900 Advertising (including endorsement fees) 482............................ 9 152 .8 X7200 Sales of programs 60................................................ 3 003 .3 X
8500 Food and beverage sales 134.......................................... 4 415 .4 92.48501 Sales of food and nonalcoholic beverages 119......................... 2 683 .2 X8502 Sales of alcoholic beverages 31..................................... 1 732 .2 X
8600 Merchandise sales 504................................................ 10 400 .9 83.18628 Sales of other merchandise 504...................................... 10 400 .9 X
8940 All other receipts 360................................................. 24 552 2.1 91.38974 All other receipts 360............................................... 24 552 2.1 X
9000 Contributions, gifts, and grantsmGovernment 866........................ 55 150 4.8 87.19001 National Endowment for the Arts 241................................. 5 097 .4 X9002 All other Federal, state, county, and municipal 849...................... 50 053 4.3 X
9050 Contributions, gifts, and grantsmPrivate 1 122............................. 391 775 33.9 86.89051 Individuals 1 079..................................................... 178 440 15.5 X9052 Foundations 788................................................... 82 304 7.1 X9053 Business and industry 827........................................... 103 395 9.0 X9054 Other (labor unions, etc.) 169........................................ 27 636 2.4 X
9100 Investment income, including interest and dividends 685.................. 109 516 9.5 X9250 Amounts received from royalties, residual fees, and subsidiary rights 65.... 3 588 .3 X
9500 All other revenue 569................................................. 59 785 5.2 86.39507 All other revenue 569............................................... 59 785 5.2 X
711130 Musical groups & artists 1 211................................... 1 154 012 100.0 92.4
3450 Membership dues and fees 478........................................ 35 123 3.0 X5500 Admissions, including sports teams’ total receipts for admissions to
home games (not including admission taxes) 981........................ 372 123 32.2 X5550 Contract fees from providing entertainment 583.......................... 68 098 5.9 X5600 Commissions or fees from representation (e.g., from sports or artists’
agents or managers, or event promoters) 15........................... 457 Z X5650 Rental fees for the use of facilities, such as stadiums, or arenas, or
theaters 58........................................................ 5 719 .5 X
5670 This establishment’s share of receipts from concessions or amusementmachines not operated by this establishment 26........................ 1 157 .1 X
5900 Advertising (including endorsement fees) 482............................ 9 152 .8 X7200 Sales of programs 60................................................ 3 003 .3 X
8500 Food and beverage sales 134.......................................... 4 415 .4 92.48501 Sales of food and nonalcoholic beverages 119......................... 2 683 .2 X8502 Sales of alcoholic beverages 31..................................... 1 732 .2 X
8600 Merchandise sales 504................................................ 10 400 .9 83.18628 Sales of other merchandise 504...................................... 10 400 .9 X
8940 All other receipts 360................................................. 24 552 2.1 91.38974 All other receipts 360............................................... 24 552 2.1 X
9000 Contributions, gifts, and grantsmGovernment 866........................ 55 150 4.8 87.19001 National Endowment for the Arts 241................................. 5 097 .4 X9002 All other Federal, state, county, and municipal 849...................... 50 053 4.3 X
9050 Contributions, gifts, and grantsmPrivate 1 122............................. 391 775 33.9 86.89051 Individuals 1 079..................................................... 178 440 15.5 X9052 Foundations 788................................................... 82 304 7.1 X9053 Business and industry 827........................................... 103 395 9.0 X9054 Other (labor unions, etc.) 169........................................ 27 636 2.4 X
9100 Investment income, including interest and dividends 685.................. 109 516 9.5 X9250 Amounts received from royalties, residual fees, and subsidiary rights 65.... 3 588 .3 X
9500 All other revenue 569................................................. 59 785 5.2 86.39507 All other revenue 569............................................... 59 785 5.2 X
7111301 Symphony orchestras & chamber music organizations 698...... 1 038 206 100.0 90.7
3450 Membership dues and fees 171........................................ 26 328 2.5 X5500 Admissions, including sports teams’ total receipts for admissions to
home games (not including admission taxes) 606........................ 340 725 32.8 X5550 Contract fees from providing entertainment 354.......................... 58 089 5.6 X5600 Commissions or fees from representation (e.g., from sports or artists’
agents or managers, or event promoters) 8........................... 149 Z X5650 Rental fees for the use of facilities, such as stadiums, or arenas, or
theaters 42........................................................ 5 532 .5 X
5670 This establishment’s share of receipts from concessions or amusementmachines not operated by this establishment 8........................ 463 Z X
5900 Advertising (including endorsement fees) 354............................ 8 374 .8 X7200 Sales of programs 40................................................ 884 .1 X
8500 Food and beverage sales 74.......................................... 3 276 .3 90.78501 Sales of food and nonalcoholic beverages 63......................... 2 157 .2 X8502 Sales of alcoholic beverages 22..................................... 1 119 .1 X
8600 Merchandise sales 211................................................ 4 651 .4 89.78628 Sales of other merchandise 211...................................... 4 651 .4 X
8940 All other receipts 213................................................. 19 089 1.8 89.78974 All other receipts 213............................................... 19 089 1.8 X
See footnotes at end of table.
ARTS, ENTERTAINMENT, & RECREATIONmSUBJECT SERIES SUMMARY 35U.S. Census Bureau, 1997 Economic Census Apr. 30, 2001

Table 2b. Major Sources of Revenue From Customers for Firms Exempt From Federal IncomeTax for the United States: 1997mCon.
[Includes only establishments with payroll. For meaning of abbreviations and symbols, see introductory text. For explanation of terms, see Appendix A]
NAICS codeand
RL codeKind of business and sources of revenue
Establishments(number)
Revenue1
($1,000)
Revenue from specifiedrevenue lines as percent
of total revenue1
Revenue of establishmentsreporting sources ofrevenue as percent
of total revenue
7111301 Symphony orchestras & chamber music organizationsmCon.
9000 Contributions, gifts, and grantsmGovernment 555........................ 48 918 4.7 90.39001 National Endowment for the Arts 173................................. 4 318 .4 X9002 All other Federal, state, county, and municipal 547...................... 44 600 4.3 X
9050 Contributions, gifts, and grantsmPrivate 667............................. 355 161 34.2 89.79051 Individuals 651..................................................... 159 889 15.4 X9052 Foundations 528................................................... 71 237 6.9 X9053 Business and industry 552........................................... 97 683 9.4 X9054 Other (labor unions, etc.) 133........................................ 26 352 2.5 X
9100 Investment income, including interest and dividends 465.................. 108 464 10.4 X9250 Amounts received from royalties, residual fees, and subsidiary rights 39.... 3 296 .3 X
9500 All other revenue 352................................................. 54 807 5.3 90.09507 All other revenue 352............................................... 54 807 5.3 X
7111309 Other music groups & artists 513............................... 115 806 100.0 100.0
3450 Membership dues and fees 307........................................ 8 795 7.6 X5500 Admissions, including sports teams’ total receipts for admissions to
home games (not including admission taxes) 375........................ 31 398 27.1 X5550 Contract fees from providing entertainment 229.......................... 10 009 8.6 X5600 Commissions or fees from representation (e.g., from sports or artists’
agents or managers, or event promoters) 7........................... 308 .3 X5650 Rental fees for the use of facilities, such as stadiums, or arenas, or
theaters 16........................................................ 187 .2 X
5670 This establishment’s share of receipts from concessions or amusementmachines not operated by this establishment 18........................ 694 .6 X
5900 Advertising (including endorsement fees) 128............................ 778 .7 X7200 Sales of programs 20................................................ 2 119 1.8 X
8500 Food and beverage sales 60.......................................... 1 139 1.0 100.08501 Sales of food and nonalcoholic beverages 56......................... 526 .5 X8502 Sales of alcoholic beverages 9..................................... 613 .5 X
8600 Merchandise sales 293................................................ 5 749 5.0 57.48628 Sales of other merchandise 293...................................... 5 749 5.0 X
8940 All other receipts 147................................................. 5 463 4.7 100.08974 All other receipts 147............................................... 5 463 4.7 X
9000 Contributions, gifts, and grantsmGovernment 311........................ 6 232 5.4 52.09001 National Endowment for the Arts 69................................. 779 .7 X9002 All other Federal, state, county, and municipal 302...................... 5 453 4.7 X
9050 Contributions, gifts, and grantsmPrivate 455............................. 36 614 31.6 60.29051 Individuals 428..................................................... 18 551 16.0 X9052 Foundations 259................................................... 11 067 9.6 X9053 Business and industry 275........................................... 5 712 4.9 X9054 Other (labor unions, etc.) 36........................................ 1 284 1.1 X
9100 Investment income, including interest and dividends 220.................. 1 052 .9 X9250 Amounts received from royalties, residual fees, and subsidiary rights 26.... 292 .3 X
9500 All other revenue 217................................................. 4 978 4.3 48.19507 All other revenue 217............................................... 4 978 4.3 X
71119 Other performing arts companies 87.......................... 45 232 100.0 74.3
3450 Membership dues and fees 11........................................ 130 .3 X5500 Admissions, including sports teams’ total receipts for admissions to
home games (not including admission taxes) 50........................ 18 657 41.2 X5550 Contract fees from providing entertainment 33.......................... 5 221 11.5 X5900 Advertising (including endorsement fees) 8............................ 82 .2 X
8500 Food and beverage sales 16.......................................... 1 890 4.2 74.38501 Sales of food and nonalcoholic beverages 16......................... 1 325 2.9 X
8600 Merchandise sales 24................................................ 477 1.1 59.18628 Sales of other merchandise 24...................................... 477 1.1 X
8940 All other receipts 26................................................. 1 579 3.5 48.18974 All other receipts 22............................................... 1 168 2.6 X
9000 Contributions, gifts, and grantsmGovernment 42........................ 4 051 9.0 29.19002 All other Federal, state, county, and municipal 42...................... 3 878 8.6 X
9050 Contributions, gifts, and grantsmPrivate 76............................. 10 425 23.0 32.19051 Individuals 69..................................................... 3 477 7.7 X9052 Foundations 52................................................... 4 531 10.0 X9053 Business and industry 52........................................... 2 355 5.2 X
9100 Investment income, including interest and dividends 33.................. 112 .2 X
9500 All other revenue 31................................................. 1 452 3.2 71.79507 All other revenue 31............................................... 1 452 3.2 X
711190 Other performing arts companies 87.......................... 45 232 100.0 74.3
3450 Membership dues and fees 11........................................ 130 .3 X5500 Admissions, including sports teams’ total receipts for admissions to
home games (not including admission taxes) 50........................ 18 657 41.2 X5550 Contract fees from providing entertainment 33.......................... 5 221 11.5 X5900 Advertising (including endorsement fees) 8............................ 82 .2 X
8500 Food and beverage sales 16.......................................... 1 890 4.2 74.38501 Sales of food and nonalcoholic beverages 16......................... 1 325 2.9 X
8600 Merchandise sales 24................................................ 477 1.1 59.18628 Sales of other merchandise 24...................................... 477 1.1 X
8940 All other receipts 26................................................. 1 579 3.5 48.18974 All other receipts 22............................................... 1 168 2.6 X
9000 Contributions, gifts, and grantsmGovernment 42........................ 4 051 9.0 29.19002 All other Federal, state, county, and municipal 42...................... 3 878 8.6 X
See footnotes at end of table.
36 SUMMARY ARTS, ENTERTAINMENT, & RECREATIONmSUBJECT SERIESU.S. Census Bureau, 1997 Economic Census Apr. 30, 2001
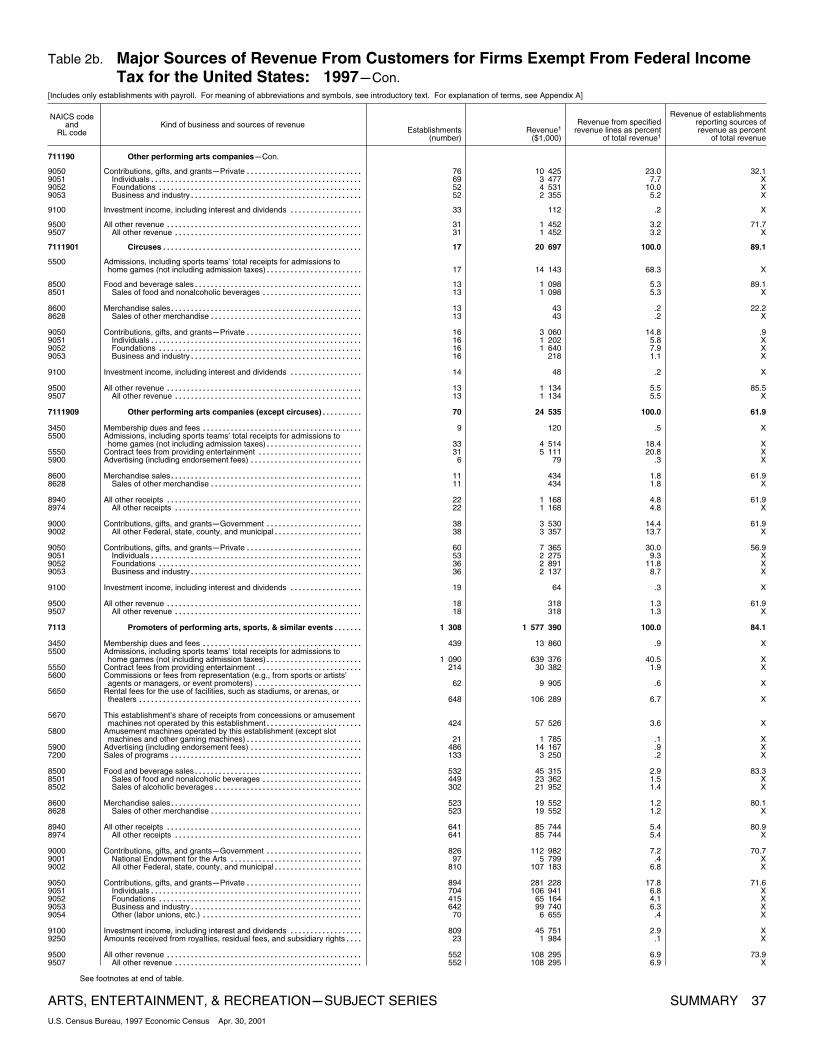
Table 2b. Major Sources of Revenue From Customers for Firms Exempt From Federal IncomeTax for the United States: 1997mCon.
[Includes only establishments with payroll. For meaning of abbreviations and symbols, see introductory text. For explanation of terms, see Appendix A]
NAICS codeand
RL codeKind of business and sources of revenue
Establishments(number)
Revenue1
($1,000)
Revenue from specifiedrevenue lines as percent
of total revenue1
Revenue of establishmentsreporting sources ofrevenue as percent
of total revenue
711190 Other performing arts companiesmCon.
9050 Contributions, gifts, and grantsmPrivate 76............................. 10 425 23.0 32.19051 Individuals 69..................................................... 3 477 7.7 X9052 Foundations 52................................................... 4 531 10.0 X9053 Business and industry 52........................................... 2 355 5.2 X
9100 Investment income, including interest and dividends 33.................. 112 .2 X
9500 All other revenue 31................................................. 1 452 3.2 71.79507 All other revenue 31............................................... 1 452 3.2 X
7111901 Circuses 17.................................................. 20 697 100.0 89.1
5500 Admissions, including sports teams’ total receipts for admissions tohome games (not including admission taxes) 17........................ 14 143 68.3 X
8500 Food and beverage sales 13.......................................... 1 098 5.3 89.18501 Sales of food and nonalcoholic beverages 13......................... 1 098 5.3 X
8600 Merchandise sales 13................................................ 43 .2 22.28628 Sales of other merchandise 13...................................... 43 .2 X
9050 Contributions, gifts, and grantsmPrivate 16............................. 3 060 14.8 .99051 Individuals 16..................................................... 1 202 5.8 X9052 Foundations 16................................................... 1 640 7.9 X9053 Business and industry 16........................................... 218 1.1 X
9100 Investment income, including interest and dividends 14.................. 48 .2 X
9500 All other revenue 13................................................. 1 134 5.5 85.59507 All other revenue 13............................................... 1 134 5.5 X
7111909 Other performing arts companies (except circuses) 70.......... 24 535 100.0 61.9
3450 Membership dues and fees 9........................................ 120 .5 X5500 Admissions, including sports teams’ total receipts for admissions to
home games (not including admission taxes) 33........................ 4 514 18.4 X5550 Contract fees from providing entertainment 31.......................... 5 111 20.8 X5900 Advertising (including endorsement fees) 6............................ 79 .3 X
8600 Merchandise sales 11................................................ 434 1.8 61.98628 Sales of other merchandise 11...................................... 434 1.8 X
8940 All other receipts 22................................................. 1 168 4.8 61.98974 All other receipts 22............................................... 1 168 4.8 X
9000 Contributions, gifts, and grantsmGovernment 38........................ 3 530 14.4 61.99002 All other Federal, state, county, and municipal 38...................... 3 357 13.7 X
9050 Contributions, gifts, and grantsmPrivate 60............................. 7 365 30.0 56.99051 Individuals 53..................................................... 2 275 9.3 X9052 Foundations 36................................................... 2 891 11.8 X9053 Business and industry 36........................................... 2 137 8.7 X
9100 Investment income, including interest and dividends 19.................. 64 .3 X
9500 All other revenue 18................................................. 318 1.3 61.99507 All other revenue 18............................................... 318 1.3 X
7113 Promoters of performing arts, sports, & similar events 1 308....... 1 577 390 100.0 84.1
3450 Membership dues and fees 439........................................ 13 860 .9 X5500 Admissions, including sports teams’ total receipts for admissions to
home games (not including admission taxes) 1 090........................ 639 376 40.5 X5550 Contract fees from providing entertainment 214.......................... 30 382 1.9 X5600 Commissions or fees from representation (e.g., from sports or artists’
agents or managers, or event promoters) 62........................... 9 905 .6 X5650 Rental fees for the use of facilities, such as stadiums, or arenas, or
theaters 648........................................................ 106 289 6.7 X
5670 This establishment’s share of receipts from concessions or amusementmachines not operated by this establishment 424........................ 57 526 3.6 X
5800 Amusement machines operated by this establishment (except slotmachines and other gaming machines) 21............................. 1 785 .1 X
5900 Advertising (including endorsement fees) 486............................ 14 167 .9 X7200 Sales of programs 133................................................ 3 250 .2 X
8500 Food and beverage sales 532.......................................... 45 315 2.9 83.38501 Sales of food and nonalcoholic beverages 449......................... 23 362 1.5 X8502 Sales of alcoholic beverages 302..................................... 21 952 1.4 X
8600 Merchandise sales 523................................................ 19 552 1.2 80.18628 Sales of other merchandise 523...................................... 19 552 1.2 X
8940 All other receipts 641................................................. 85 744 5.4 80.98974 All other receipts 641............................................... 85 744 5.4 X
9000 Contributions, gifts, and grantsmGovernment 826........................ 112 982 7.2 70.79001 National Endowment for the Arts 97................................. 5 799 .4 X9002 All other Federal, state, county, and municipal 810...................... 107 183 6.8 X
9050 Contributions, gifts, and grantsmPrivate 894............................. 281 228 17.8 71.69051 Individuals 704..................................................... 106 941 6.8 X9052 Foundations 415................................................... 65 164 4.1 X9053 Business and industry 642........................................... 99 740 6.3 X9054 Other (labor unions, etc.) 70........................................ 6 655 .4 X
9100 Investment income, including interest and dividends 809.................. 45 751 2.9 X9250 Amounts received from royalties, residual fees, and subsidiary rights 23.... 1 984 .1 X
9500 All other revenue 552................................................. 108 295 6.9 73.99507 All other revenue 552............................................... 108 295 6.9 X
See footnotes at end of table.
ARTS, ENTERTAINMENT, & RECREATIONmSUBJECT SERIES SUMMARY 37U.S. Census Bureau, 1997 Economic Census Apr. 30, 2001

Table 2b. Major Sources of Revenue From Customers for Firms Exempt From Federal IncomeTax for the United States: 1997mCon.
[Includes only establishments with payroll. For meaning of abbreviations and symbols, see introductory text. For explanation of terms, see Appendix A]
NAICS codeand
RL codeKind of business and sources of revenue
Establishments(number)
Revenue1
($1,000)
Revenue from specifiedrevenue lines as percent
of total revenue1
Revenue of establishmentsreporting sources ofrevenue as percent
of total revenue
71131 Promoters of performing arts, sports, & similar events w/facility 371................................................... 846 172 100.0 84.5
3450 Membership dues and fees 133........................................ 7 420 .9 X5500 Admissions, including sports teams’ total receipts for admissions to
home games (not including admission taxes) 312........................ 368 999 43.6 X5550 Contract fees from providing entertainment 56.......................... 13 981 1.7 X5600 Commissions or fees from representation (e.g., from sports or artists’
agents or managers, or event promoters) 17........................... 1 949 .2 X5650 Rental fees for the use of facilities, such as stadiums, or arenas, or
theaters 225........................................................ 44 131 5.2 X
5670 This establishment’s share of receipts from concessions or amusementmachines not operated by this establishment 31........................ 2 676 .3 X
5900 Advertising (including endorsement fees) 149............................ 5 369 .6 X7200 Sales of programs 22................................................ 678 .1 X
8500 Food and beverage sales 214.......................................... 16 824 2.0 84.08501 Sales of food and nonalcoholic beverages 191......................... 8 228 1.0 X8502 Sales of alcoholic beverages 119..................................... 8 596 1.0 X
8600 Merchandise sales 209................................................ 10 496 1.2 81.78628 Sales of other merchandise 209...................................... 10 496 1.2 X
8940 All other receipts 210................................................. 30 312 3.6 82.08974 All other receipts 210............................................... 30 312 3.6 X
9000 Contributions, gifts, and grantsmGovernment 253........................ 80 071 9.5 71.09001 National Endowment for the Arts 45................................. 4 617 .5 X9002 All other Federal, state, county, and municipal 252...................... 75 454 8.9 X
9050 Contributions, gifts, and grantsmPrivate 296............................. 175 299 20.7 70.19051 Individuals 271..................................................... 64 075 7.6 X9052 Foundations 224................................................... 49 617 5.9 X9053 Business and industry 230........................................... 53 355 6.3 X9054 Other (labor unions, etc.) 29........................................ 5 524 .7 X
9100 Investment income, including interest and dividends 240.................. 32 078 3.8 X9250 Amounts received from royalties, residual fees, and subsidiary rights 13.... 817 .1 X
9500 All other revenue 161................................................. 54 978 6.5 73.09507 All other revenue 161............................................... 54 978 6.5 X
711310 Promoters of performing arts, sports, & similar events w/facility 371................................................... 846 172 100.0 84.5
3450 Membership dues and fees 133........................................ 7 420 .9 X5500 Admissions, including sports teams’ total receipts for admissions to
home games (not including admission taxes) 312........................ 368 999 43.6 X5550 Contract fees from providing entertainment 56.......................... 13 981 1.7 X5600 Commissions or fees from representation (e.g., from sports or artists’
agents or managers, or event promoters) 17........................... 1 949 .2 X5650 Rental fees for the use of facilities, such as stadiums, or arenas, or
theaters 225........................................................ 44 131 5.2 X
5670 This establishment’s share of receipts from concessions or amusementmachines not operated by this establishment 31........................ 2 676 .3 X
5900 Advertising (including endorsement fees) 149............................ 5 369 .6 X7200 Sales of programs 22................................................ 678 .1 X
8500 Food and beverage sales 214.......................................... 16 824 2.0 84.08501 Sales of food and nonalcoholic beverages 191......................... 8 228 1.0 X8502 Sales of alcoholic beverages 119..................................... 8 596 1.0 X
8600 Merchandise sales 209................................................ 10 496 1.2 81.78628 Sales of other merchandise 209...................................... 10 496 1.2 X
8940 All other receipts 210................................................. 30 312 3.6 82.08974 All other receipts 210............................................... 30 312 3.6 X
9000 Contributions, gifts, and grantsmGovernment 253........................ 80 071 9.5 71.09001 National Endowment for the Arts 45................................. 4 617 .5 X9002 All other Federal, state, county, and municipal 252...................... 75 454 8.9 X
9050 Contributions, gifts, and grantsmPrivate 296............................. 175 299 20.7 70.19051 Individuals 271..................................................... 64 075 7.6 X9052 Foundations 224................................................... 49 617 5.9 X9053 Business and industry 230........................................... 53 355 6.3 X9054 Other (labor unions, etc.) 29........................................ 5 524 .7 X
9100 Investment income, including interest and dividends 240.................. 32 078 3.8 X9250 Amounts received from royalties, residual fees, and subsidiary rights 13.... 817 .1 X
9500 All other revenue 161................................................. 54 978 6.5 73.09507 All other revenue 161............................................... 54 978 6.5 X
71132 Promoters of performing arts, sports, & similar events w/ofacil 937..................................................... 731 218 100.0 83.6
3450 Membership dues and fees 306........................................ 6 440 .9 X5500 Admissions, including sports teams’ total receipts for admissions to
home games (not including admission taxes) 778........................ 270 377 37.0 X5550 Contract fees from providing entertainment 158.......................... 16 401 2.2 X5600 Commissions or fees from representation (e.g., from sports or artists’
agents or managers, or event promoters) 45........................... 7 956 1.1 X5650 Rental fees for the use of facilities, such as stadiums, or arenas, or
theaters 423........................................................ 62 158 8.5 X
5670 This establishment’s share of receipts from concessions or amusementmachines not operated by this establishment 393........................ 54 850 7.5 X
5800 Amusement machines operated by this establishment (except slotmachines and other gaming machines) 17............................. 1 691 .2 X
5900 Advertising (including endorsement fees) 337............................ 8 798 1.2 X7200 Sales of programs 111................................................ 2 572 .4 X
8500 Food and beverage sales 318.......................................... 28 491 3.9 82.38501 Sales of food and nonalcoholic beverages 258......................... 15 134 2.1 X8502 Sales of alcoholic beverages 183..................................... 13 356 1.8 X
See footnotes at end of table.
38 SUMMARY ARTS, ENTERTAINMENT, & RECREATIONmSUBJECT SERIESU.S. Census Bureau, 1997 Economic Census Apr. 30, 2001
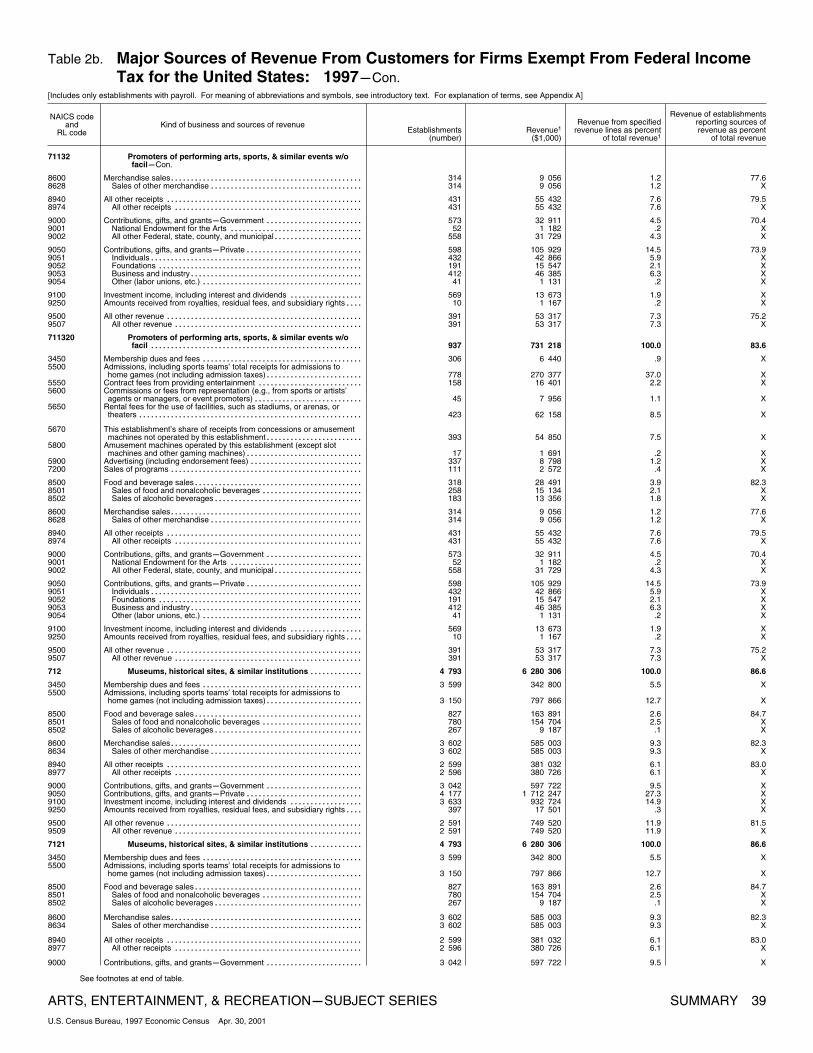
Table 2b. Major Sources of Revenue From Customers for Firms Exempt From Federal IncomeTax for the United States: 1997mCon.
[Includes only establishments with payroll. For meaning of abbreviations and symbols, see introductory text. For explanation of terms, see Appendix A]
NAICS codeand
RL codeKind of business and sources of revenue
Establishments(number)
Revenue1
($1,000)
Revenue from specifiedrevenue lines as percent
of total revenue1
Revenue of establishmentsreporting sources ofrevenue as percent
of total revenue
71132 Promoters of performing arts, sports, & similar events w/ofacilmCon.
8600 Merchandise sales 314................................................ 9 056 1.2 77.68628 Sales of other merchandise 314...................................... 9 056 1.2 X
8940 All other receipts 431................................................. 55 432 7.6 79.58974 All other receipts 431............................................... 55 432 7.6 X
9000 Contributions, gifts, and grantsmGovernment 573........................ 32 911 4.5 70.49001 National Endowment for the Arts 52................................. 1 182 .2 X9002 All other Federal, state, county, and municipal 558...................... 31 729 4.3 X
9050 Contributions, gifts, and grantsmPrivate 598............................. 105 929 14.5 73.99051 Individuals 432..................................................... 42 866 5.9 X9052 Foundations 191................................................... 15 547 2.1 X9053 Business and industry 412........................................... 46 385 6.3 X9054 Other (labor unions, etc.) 41........................................ 1 131 .2 X
9100 Investment income, including interest and dividends 569.................. 13 673 1.9 X9250 Amounts received from royalties, residual fees, and subsidiary rights 10.... 1 167 .2 X
9500 All other revenue 391................................................. 53 317 7.3 75.29507 All other revenue 391............................................... 53 317 7.3 X
711320 Promoters of performing arts, sports, & similar events w/ofacil 937..................................................... 731 218 100.0 83.6
3450 Membership dues and fees 306........................................ 6 440 .9 X5500 Admissions, including sports teams’ total receipts for admissions to
home games (not including admission taxes) 778........................ 270 377 37.0 X5550 Contract fees from providing entertainment 158.......................... 16 401 2.2 X5600 Commissions or fees from representation (e.g., from sports or artists’
agents or managers, or event promoters) 45........................... 7 956 1.1 X5650 Rental fees for the use of facilities, such as stadiums, or arenas, or
theaters 423........................................................ 62 158 8.5 X
5670 This establishment’s share of receipts from concessions or amusementmachines not operated by this establishment 393........................ 54 850 7.5 X
5800 Amusement machines operated by this establishment (except slotmachines and other gaming machines) 17............................. 1 691 .2 X
5900 Advertising (including endorsement fees) 337............................ 8 798 1.2 X7200 Sales of programs 111................................................ 2 572 .4 X
8500 Food and beverage sales 318.......................................... 28 491 3.9 82.38501 Sales of food and nonalcoholic beverages 258......................... 15 134 2.1 X8502 Sales of alcoholic beverages 183..................................... 13 356 1.8 X
8600 Merchandise sales 314................................................ 9 056 1.2 77.68628 Sales of other merchandise 314...................................... 9 056 1.2 X
8940 All other receipts 431................................................. 55 432 7.6 79.58974 All other receipts 431............................................... 55 432 7.6 X
9000 Contributions, gifts, and grantsmGovernment 573........................ 32 911 4.5 70.49001 National Endowment for the Arts 52................................. 1 182 .2 X9002 All other Federal, state, county, and municipal 558...................... 31 729 4.3 X
9050 Contributions, gifts, and grantsmPrivate 598............................. 105 929 14.5 73.99051 Individuals 432..................................................... 42 866 5.9 X9052 Foundations 191................................................... 15 547 2.1 X9053 Business and industry 412........................................... 46 385 6.3 X9054 Other (labor unions, etc.) 41........................................ 1 131 .2 X
9100 Investment income, including interest and dividends 569.................. 13 673 1.9 X9250 Amounts received from royalties, residual fees, and subsidiary rights 10.... 1 167 .2 X
9500 All other revenue 391................................................. 53 317 7.3 75.29507 All other revenue 391............................................... 53 317 7.3 X
712 Museums, historical sites, & similar institutions 4 793............. 6 280 306 100.0 86.6
3450 Membership dues and fees 3 599........................................ 342 800 5.5 X5500 Admissions, including sports teams’ total receipts for admissions to
home games (not including admission taxes) 3 150........................ 797 866 12.7 X
8500 Food and beverage sales 827.......................................... 163 891 2.6 84.78501 Sales of food and nonalcoholic beverages 780......................... 154 704 2.5 X8502 Sales of alcoholic beverages 267..................................... 9 187 .1 X
8600 Merchandise sales 3 602................................................ 585 003 9.3 82.38634 Sales of other merchandise 3 602...................................... 585 003 9.3 X
8940 All other receipts 2 599................................................. 381 032 6.1 83.08977 All other receipts 2 596............................................... 380 726 6.1 X
9000 Contributions, gifts, and grantsmGovernment 3 042........................ 597 722 9.5 X9050 Contributions, gifts, and grantsmPrivate 4 177............................. 1 712 247 27.3 X9100 Investment income, including interest and dividends 3 633.................. 932 724 14.9 X9250 Amounts received from royalties, residual fees, and subsidiary rights 397.... 17 501 .3 X
9500 All other revenue 2 591................................................. 749 520 11.9 81.59509 All other revenue 2 591............................................... 749 520 11.9 X
7121 Museums, historical sites, & similar institutions 4 793............. 6 280 306 100.0 86.6
3450 Membership dues and fees 3 599........................................ 342 800 5.5 X5500 Admissions, including sports teams’ total receipts for admissions to
home games (not including admission taxes) 3 150........................ 797 866 12.7 X
8500 Food and beverage sales 827.......................................... 163 891 2.6 84.78501 Sales of food and nonalcoholic beverages 780......................... 154 704 2.5 X8502 Sales of alcoholic beverages 267..................................... 9 187 .1 X
8600 Merchandise sales 3 602................................................ 585 003 9.3 82.38634 Sales of other merchandise 3 602...................................... 585 003 9.3 X
8940 All other receipts 2 599................................................. 381 032 6.1 83.08977 All other receipts 2 596............................................... 380 726 6.1 X
9000 Contributions, gifts, and grantsmGovernment 3 042........................ 597 722 9.5 X
See footnotes at end of table.
ARTS, ENTERTAINMENT, & RECREATIONmSUBJECT SERIES SUMMARY 39U.S. Census Bureau, 1997 Economic Census Apr. 30, 2001

Table 2b. Major Sources of Revenue From Customers for Firms Exempt From Federal IncomeTax for the United States: 1997mCon.
[Includes only establishments with payroll. For meaning of abbreviations and symbols, see introductory text. For explanation of terms, see Appendix A]
NAICS codeand
RL codeKind of business and sources of revenue
Establishments(number)
Revenue1
($1,000)
Revenue from specifiedrevenue lines as percent
of total revenue1
Revenue of establishmentsreporting sources ofrevenue as percent
of total revenue
7121 Museums, historical sites, & similar institutionsmCon.
9050 Contributions, gifts, and grantsmPrivate 4 177............................. 1 712 247 27.3 X9100 Investment income, including interest and dividends 3 633.................. 932 724 14.9 X9250 Amounts received from royalties, residual fees, and subsidiary rights 397.... 17 501 .3 X
9500 All other revenue 2 591................................................. 749 520 11.9 81.59509 All other revenue 2 591............................................... 749 520 11.9 X
71211 Museums 3 434................................................. 4 529 209 100.0 82.7
3450 Membership dues and fees 2 627........................................ 212 159 4.7 X5500 Admissions, including sports teams’ total receipts for admissions to
home games (not including admission taxes) 2 392........................ 472 986 10.4 X
8500 Food and beverage sales 540.......................................... 85 041 1.9 82.28501 Sales of food and nonalcoholic beverages 503......................... 79 210 1.7 X8502 Sales of alcoholic beverages 221..................................... 5 831 .1 X
8600 Merchandise sales 2 686................................................ 404 078 8.9 80.08634 Sales of other merchandise 2 686...................................... 404 078 8.9 X
8940 All other receipts 1 858................................................. 303 975 6.7 80.18977 All other receipts 1 858............................................... 303 975 6.7 X
9000 Contributions, gifts, and grantsmGovernment 2 223........................ 432 217 9.5 X9050 Contributions, gifts, and grantsmPrivate 3 063............................. 1 369 895 30.2 X9100 Investment income, including interest and dividends 2 566.................. 754 500 16.7 X9250 Amounts received from royalties, residual fees, and subsidiary rights 318.... 15 743 .3 X
9500 All other revenue 1 786................................................. 478 615 10.6 78.59509 All other revenue 1 786............................................... 478 615 10.6 X
712110 Museums 3 434................................................. 4 529 209 100.0 82.7
3450 Membership dues and fees 2 627........................................ 212 159 4.7 X5500 Admissions, including sports teams’ total receipts for admissions to
home games (not including admission taxes) 2 392........................ 472 986 10.4 X
8500 Food and beverage sales 540.......................................... 85 041 1.9 82.28501 Sales of food and nonalcoholic beverages 503......................... 79 210 1.7 X8502 Sales of alcoholic beverages 221..................................... 5 831 .1 X
8600 Merchandise sales 2 686................................................ 404 078 8.9 80.08634 Sales of other merchandise 2 686...................................... 404 078 8.9 X
8940 All other receipts 1 858................................................. 303 975 6.7 80.18977 All other receipts 1 858............................................... 303 975 6.7 X
9000 Contributions, gifts, and grantsmGovernment 2 223........................ 432 217 9.5 X9050 Contributions, gifts, and grantsmPrivate 3 063............................. 1 369 895 30.2 X9100 Investment income, including interest and dividends 2 566.................. 754 500 16.7 X9250 Amounts received from royalties, residual fees, and subsidiary rights 318.... 15 743 .3 X
9500 All other revenue 1 786................................................. 478 615 10.6 78.59509 All other revenue 1 786............................................... 478 615 10.6 X
71212 Historical sites 814............................................ 342 606 100.0 86.6
3450 Membership dues and fees 543........................................ 11 338 3.3 X5500 Admissions, including sports teams’ total receipts for admissions to
home games (not including admission taxes) 484........................ 84 879 24.8 X
8500 Food and beverage sales 129.......................................... 15 621 4.6 81.88501 Sales of food and nonalcoholic beverages 123......................... 13 795 4.0 X8502 Sales of alcoholic beverages 23..................................... 1 826 .5 X
8600 Merchandise sales 585................................................ 63 153 18.4 66.28634 Sales of other merchandise 585...................................... 63 153 18.4 X
8940 All other receipts 411................................................. 16 987 5.0 82.38977 All other receipts 411............................................... 16 987 5.0 X
9000 Contributions, gifts, and grantsmGovernment 471........................ 20 399 6.0 X9050 Contributions, gifts, and grantsmPrivate 626............................. 60 834 17.8 X9100 Investment income, including interest and dividends 615.................. 54 702 16.0 X9250 Amounts received from royalties, residual fees, and subsidiary rights 26.... 318 .1 X
9500 All other revenue 433................................................. 14 375 4.2 65.99509 All other revenue 433............................................... 14 375 4.2 X
712120 Historical sites 814............................................ 342 606 100.0 86.6
3450 Membership dues and fees 543........................................ 11 338 3.3 X5500 Admissions, including sports teams’ total receipts for admissions to
home games (not including admission taxes) 484........................ 84 879 24.8 X
8500 Food and beverage sales 129.......................................... 15 621 4.6 81.88501 Sales of food and nonalcoholic beverages 123......................... 13 795 4.0 X8502 Sales of alcoholic beverages 23..................................... 1 826 .5 X
8600 Merchandise sales 585................................................ 63 153 18.4 66.28634 Sales of other merchandise 585...................................... 63 153 18.4 X
8940 All other receipts 411................................................. 16 987 5.0 82.38977 All other receipts 411............................................... 16 987 5.0 X
9000 Contributions, gifts, and grantsmGovernment 471........................ 20 399 6.0 X9050 Contributions, gifts, and grantsmPrivate 626............................. 60 834 17.8 X9100 Investment income, including interest and dividends 615.................. 54 702 16.0 X9250 Amounts received from royalties, residual fees, and subsidiary rights 26.... 318 .1 X
9500 All other revenue 433................................................. 14 375 4.2 65.99509 All other revenue 433............................................... 14 375 4.2 X
See footnotes at end of table.
40 SUMMARY ARTS, ENTERTAINMENT, & RECREATIONmSUBJECT SERIESU.S. Census Bureau, 1997 Economic Census Apr. 30, 2001

Table 2b. Major Sources of Revenue From Customers for Firms Exempt From Federal IncomeTax for the United States: 1997mCon.
[Includes only establishments with payroll. For meaning of abbreviations and symbols, see introductory text. For explanation of terms, see Appendix A]
NAICS codeand
RL codeKind of business and sources of revenue
Establishments(number)
Revenue1
($1,000)
Revenue from specifiedrevenue lines as percent
of total revenue1
Revenue of establishmentsreporting sources ofrevenue as percent
of total revenue
71213 Zoos & botanical gardens 269.................................. 1 279 021 100.0 100.0
3450 Membership dues and fees 203........................................ 75 485 5.9 X5500 Admissions, including sports teams’ total receipts for admissions to
home games (not including admission taxes) 167........................ 233 219 18.2 X
8500 Food and beverage sales 128.......................................... 61 450 4.8 96.58501 Sales of food and nonalcoholic beverages 124......................... 59 939 4.7 X8502 Sales of alcoholic beverages 21..................................... 1 511 .1 X
8600 Merchandise sales 208................................................ 110 096 8.6 95.88634 Sales of other merchandise 208...................................... 110 096 8.6 X
8940 All other receipts 159................................................. 50 674 4.0 94.88977 All other receipts 159............................................... 50 674 4.0 X
9000 Contributions, gifts, and grantsmGovernment 145........................ 136 883 10.7 X9050 Contributions, gifts, and grantsmPrivate 247............................. 250 567 19.6 X9100 Investment income, including interest and dividends 220.................. 112 534 8.8 X9250 Amounts received from royalties, residual fees, and subsidiary rights 20.... 805 .1 X
9500 All other revenue 176................................................. 247 308 19.3 96.99509 All other revenue 176............................................... 247 308 19.3 X
712130 Zoos & botanical gardens 269.................................. 1 279 021 100.0 100.0
3450 Membership dues and fees 203........................................ 75 485 5.9 X5500 Admissions, including sports teams’ total receipts for admissions to
home games (not including admission taxes) 167........................ 233 219 18.2 X
8500 Food and beverage sales 128.......................................... 61 450 4.8 96.58501 Sales of food and nonalcoholic beverages 124......................... 59 939 4.7 X8502 Sales of alcoholic beverages 21..................................... 1 511 .1 X
8600 Merchandise sales 208................................................ 110 096 8.6 95.88634 Sales of other merchandise 208...................................... 110 096 8.6 X
8940 All other receipts 159................................................. 50 674 4.0 94.88977 All other receipts 159............................................... 50 674 4.0 X
9000 Contributions, gifts, and grantsmGovernment 145........................ 136 883 10.7 X9050 Contributions, gifts, and grantsmPrivate 247............................. 250 567 19.6 X9100 Investment income, including interest and dividends 220.................. 112 534 8.8 X9250 Amounts received from royalties, residual fees, and subsidiary rights 20.... 805 .1 X
9500 All other revenue 176................................................. 247 308 19.3 96.99509 All other revenue 176............................................... 247 308 19.3 X
71219 Nature parks & other similar institutions 276.................... 129 470 100.0 79.0
3450 Membership dues and fees 226........................................ 43 818 33.8 X5500 Admissions, including sports teams’ total receipts for admissions to
home games (not including admission taxes) 107........................ 6 782 5.2 X
8500 Food and beverage sales 30.......................................... 1 779 1.4 75.28501 Sales of food and nonalcoholic beverages 30......................... 1 760 1.4 X
8600 Merchandise sales 123................................................ 7 676 5.9 70.68634 Sales of other merchandise 123...................................... 7 676 5.9 X
8940 All other receipts 171................................................. 9 396 7.3 69.68977 All other receipts 168............................................... 9 090 7.0 X
9000 Contributions, gifts, and grantsmGovernment 203........................ 8 223 6.4 X9050 Contributions, gifts, and grantsmPrivate 241............................. 30 951 23.9 X9100 Investment income, including interest and dividends 232.................. 10 988 8.5 X9250 Amounts received from royalties, residual fees, and subsidiary rights 33.... 635 .5 X
9500 All other revenue 196................................................. 9 222 7.1 73.79509 All other revenue 196............................................... 9 222 7.1 X
712190 Nature parks & other similar institutions 276.................... 129 470 100.0 79.0
3450 Membership dues and fees 226........................................ 43 818 33.8 X5500 Admissions, including sports teams’ total receipts for admissions to
home games (not including admission taxes) 107........................ 6 782 5.2 X
8500 Food and beverage sales 30.......................................... 1 779 1.4 75.28501 Sales of food and nonalcoholic beverages 30......................... 1 760 1.4 X
8600 Merchandise sales 123................................................ 7 676 5.9 70.68634 Sales of other merchandise 123...................................... 7 676 5.9 X
8940 All other receipts 171................................................. 9 396 7.3 69.68977 All other receipts 168............................................... 9 090 7.0 X
9000 Contributions, gifts, and grantsmGovernment 203........................ 8 223 6.4 X9050 Contributions, gifts, and grantsmPrivate 241............................. 30 951 23.9 X9100 Investment income, including interest and dividends 232.................. 10 988 8.5 X9250 Amounts received from royalties, residual fees, and subsidiary rights 33.... 635 .5 X
9500 All other revenue 196................................................. 9 222 7.1 73.79509 All other revenue 196............................................... 9 222 7.1 X
713 Amusement, gambling, & recreation industries 10 046.............. 8 470 354 100.0 81.5
3450 Membership dues and fees 8 778........................................ 4 233 125 50.0 X4900 Tuition, fees, and other payments from providing instruction (e.g., sports
instruction) 1 564..................................................... 139 671 1.6 X5500 Admissions, including sports teams’ total receipts for admissions to
home games (not including admission taxes) 641........................ 56 675 .7 X5670 This establishment’s share of receipts from concessions or amusement
machines not operated by this establishment 280........................ 3 891 Z X5750 Gaming receipts 98.................................................. 7 518 .1 X
5800 Amusement machines operated by this establishment (except slotmachines and other gaming machines) 109............................. 4 123 Z 20.4
5801 Phonograph, compact discs, or video jukeboxes 31.................... 170 Z X5802 Pinball machines 21............................................... 3 728 Z X5803 Video games 57................................................... 168 Z X5804 Other amusement machines (excluding billiard or pool tables) 27........ 57 Z X
See footnotes at end of table.
ARTS, ENTERTAINMENT, & RECREATIONmSUBJECT SERIES SUMMARY 41U.S. Census Bureau, 1997 Economic Census Apr. 30, 2001
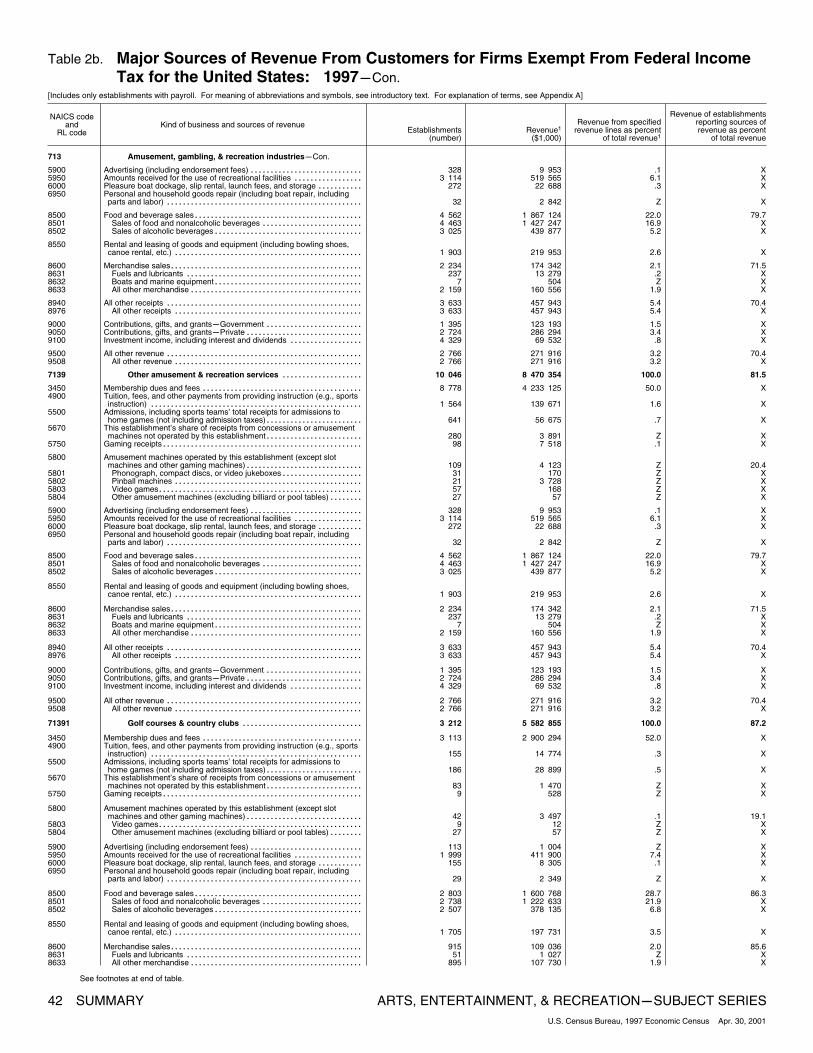
Table 2b. Major Sources of Revenue From Customers for Firms Exempt From Federal IncomeTax for the United States: 1997mCon.
[Includes only establishments with payroll. For meaning of abbreviations and symbols, see introductory text. For explanation of terms, see Appendix A]
NAICS codeand
RL codeKind of business and sources of revenue
Establishments(number)
Revenue1
($1,000)
Revenue from specifiedrevenue lines as percent
of total revenue1
Revenue of establishmentsreporting sources ofrevenue as percent
of total revenue
713 Amusement, gambling, & recreation industriesmCon.
5900 Advertising (including endorsement fees) 328............................ 9 953 .1 X5950 Amounts received for the use of recreational facilities 3 114................. 519 565 6.1 X6000 Pleasure boat dockage, slip rental, launch fees, and storage 272........... 22 688 .3 X6950 Personal and household goods repair (including boat repair, including
parts and labor) 32................................................. 2 842 Z X
8500 Food and beverage sales 4 562.......................................... 1 867 124 22.0 79.78501 Sales of food and nonalcoholic beverages 4 463......................... 1 427 247 16.9 X8502 Sales of alcoholic beverages 3 025..................................... 439 877 5.2 X
8550 Rental and leasing of goods and equipment (including bowling shoes,canoe rental, etc.) 1 903............................................... 219 953 2.6 X
8600 Merchandise sales 2 234................................................ 174 342 2.1 71.58631 Fuels and lubricants 237............................................ 13 279 .2 X8632 Boats and marine equipment 7..................................... 504 Z X8633 All other merchandise 2 159........................................... 160 556 1.9 X
8940 All other receipts 3 633................................................. 457 943 5.4 70.48976 All other receipts 3 633............................................... 457 943 5.4 X
9000 Contributions, gifts, and grantsmGovernment 1 395........................ 123 193 1.5 X9050 Contributions, gifts, and grantsmPrivate 2 724............................. 286 294 3.4 X9100 Investment income, including interest and dividends 4 329.................. 69 532 .8 X
9500 All other revenue 2 766................................................. 271 916 3.2 70.49508 All other revenue 2 766............................................... 271 916 3.2 X
7139 Other amusement & recreation services 10 046.................... 8 470 354 100.0 81.5
3450 Membership dues and fees 8 778........................................ 4 233 125 50.0 X4900 Tuition, fees, and other payments from providing instruction (e.g., sports
instruction) 1 564..................................................... 139 671 1.6 X5500 Admissions, including sports teams’ total receipts for admissions to
home games (not including admission taxes) 641........................ 56 675 .7 X5670 This establishment’s share of receipts from concessions or amusement
machines not operated by this establishment 280........................ 3 891 Z X5750 Gaming receipts 98.................................................. 7 518 .1 X
5800 Amusement machines operated by this establishment (except slotmachines and other gaming machines) 109............................. 4 123 Z 20.4
5801 Phonograph, compact discs, or video jukeboxes 31.................... 170 Z X5802 Pinball machines 21............................................... 3 728 Z X5803 Video games 57................................................... 168 Z X5804 Other amusement machines (excluding billiard or pool tables) 27........ 57 Z X
5900 Advertising (including endorsement fees) 328............................ 9 953 .1 X5950 Amounts received for the use of recreational facilities 3 114................. 519 565 6.1 X6000 Pleasure boat dockage, slip rental, launch fees, and storage 272........... 22 688 .3 X6950 Personal and household goods repair (including boat repair, including
parts and labor) 32................................................. 2 842 Z X
8500 Food and beverage sales 4 562.......................................... 1 867 124 22.0 79.78501 Sales of food and nonalcoholic beverages 4 463......................... 1 427 247 16.9 X8502 Sales of alcoholic beverages 3 025..................................... 439 877 5.2 X
8550 Rental and leasing of goods and equipment (including bowling shoes,canoe rental, etc.) 1 903............................................... 219 953 2.6 X
8600 Merchandise sales 2 234................................................ 174 342 2.1 71.58631 Fuels and lubricants 237............................................ 13 279 .2 X8632 Boats and marine equipment 7..................................... 504 Z X8633 All other merchandise 2 159........................................... 160 556 1.9 X
8940 All other receipts 3 633................................................. 457 943 5.4 70.48976 All other receipts 3 633............................................... 457 943 5.4 X
9000 Contributions, gifts, and grantsmGovernment 1 395........................ 123 193 1.5 X9050 Contributions, gifts, and grantsmPrivate 2 724............................. 286 294 3.4 X9100 Investment income, including interest and dividends 4 329.................. 69 532 .8 X
9500 All other revenue 2 766................................................. 271 916 3.2 70.49508 All other revenue 2 766............................................... 271 916 3.2 X
71391 Golf courses & country clubs 3 212.............................. 5 582 855 100.0 87.2
3450 Membership dues and fees 3 113........................................ 2 900 294 52.0 X4900 Tuition, fees, and other payments from providing instruction (e.g., sports
instruction) 155..................................................... 14 774 .3 X5500 Admissions, including sports teams’ total receipts for admissions to
home games (not including admission taxes) 186........................ 28 899 .5 X5670 This establishment’s share of receipts from concessions or amusement
machines not operated by this establishment 83........................ 1 470 Z X5750 Gaming receipts 9.................................................. 528 Z X
5800 Amusement machines operated by this establishment (except slotmachines and other gaming machines) 42............................. 3 497 .1 19.1
5803 Video games 9................................................... 12 Z X5804 Other amusement machines (excluding billiard or pool tables) 27........ 57 Z X
5900 Advertising (including endorsement fees) 113............................ 1 004 Z X5950 Amounts received for the use of recreational facilities 1 999................. 411 900 7.4 X6000 Pleasure boat dockage, slip rental, launch fees, and storage 155........... 8 305 .1 X6950 Personal and household goods repair (including boat repair, including
parts and labor) 29................................................. 2 349 Z X
8500 Food and beverage sales 2 803.......................................... 1 600 768 28.7 86.38501 Sales of food and nonalcoholic beverages 2 738......................... 1 222 633 21.9 X8502 Sales of alcoholic beverages 2 507..................................... 378 135 6.8 X
8550 Rental and leasing of goods and equipment (including bowling shoes,canoe rental, etc.) 1 705............................................... 197 731 3.5 X
8600 Merchandise sales 915................................................ 109 036 2.0 85.68631 Fuels and lubricants 51............................................ 1 027 Z X8633 All other merchandise 895........................................... 107 730 1.9 X
See footnotes at end of table.
42 SUMMARY ARTS, ENTERTAINMENT, & RECREATIONmSUBJECT SERIESU.S. Census Bureau, 1997 Economic Census Apr. 30, 2001

Table 2b. Major Sources of Revenue From Customers for Firms Exempt From Federal IncomeTax for the United States: 1997mCon.
[Includes only establishments with payroll. For meaning of abbreviations and symbols, see introductory text. For explanation of terms, see Appendix A]
NAICS codeand
RL codeKind of business and sources of revenue
Establishments(number)
Revenue1
($1,000)
Revenue from specifiedrevenue lines as percent
of total revenue1
Revenue of establishmentsreporting sources ofrevenue as percent
of total revenue
71391 Golf courses & country clubsmCon.
8940 All other receipts 1 255................................................. 163 778 2.9 85.98976 All other receipts 1 255............................................... 163 778 2.9 X
9000 Contributions, gifts, and grantsmGovernment 67........................ 2 441 Z X9050 Contributions, gifts, and grantsmPrivate 268............................. 6 601 .1 X9100 Investment income, including interest and dividends 1 250.................. 27 600 .5 X
9500 All other revenue 848................................................. 101 880 1.8 87.09508 All other revenue 848............................................... 101 880 1.8 X
713910 Golf courses & country clubs 3 212.............................. 5 582 855 100.0 87.2
3450 Membership dues and fees 3 113........................................ 2 900 294 52.0 X4900 Tuition, fees, and other payments from providing instruction (e.g., sports
instruction) 155..................................................... 14 774 .3 X5500 Admissions, including sports teams’ total receipts for admissions to
home games (not including admission taxes) 186........................ 28 899 .5 X5670 This establishment’s share of receipts from concessions or amusement
machines not operated by this establishment 83........................ 1 470 Z X5750 Gaming receipts 9.................................................. 528 Z X
5800 Amusement machines operated by this establishment (except slotmachines and other gaming machines) 42............................. 3 497 .1 19.1
5803 Video games 9................................................... 12 Z X5804 Other amusement machines (excluding billiard or pool tables) 27........ 57 Z X
5900 Advertising (including endorsement fees) 113............................ 1 004 Z X5950 Amounts received for the use of recreational facilities 1 999................. 411 900 7.4 X6000 Pleasure boat dockage, slip rental, launch fees, and storage 155........... 8 305 .1 X6950 Personal and household goods repair (including boat repair, including
parts and labor) 29................................................. 2 349 Z X
8500 Food and beverage sales 2 803.......................................... 1 600 768 28.7 86.38501 Sales of food and nonalcoholic beverages 2 738......................... 1 222 633 21.9 X8502 Sales of alcoholic beverages 2 507..................................... 378 135 6.8 X
8550 Rental and leasing of goods and equipment (including bowling shoes,canoe rental, etc.) 1 705............................................... 197 731 3.5 X
8600 Merchandise sales 915................................................ 109 036 2.0 85.68631 Fuels and lubricants 51............................................ 1 027 Z X8633 All other merchandise 895........................................... 107 730 1.9 X
8940 All other receipts 1 255................................................. 163 778 2.9 85.98976 All other receipts 1 255............................................... 163 778 2.9 X
9000 Contributions, gifts, and grantsmGovernment 67........................ 2 441 Z X9050 Contributions, gifts, and grantsmPrivate 268............................. 6 601 .1 X9100 Investment income, including interest and dividends 1 250.................. 27 600 .5 X
9500 All other revenue 848................................................. 101 880 1.8 87.09508 All other revenue 848............................................... 101 880 1.8 X
71394 Fitness & recreational sports centers 4 679....................... 2 217 294 100.0 70.8
3450 Membership dues and fees 3 938........................................ 1 087 598 49.1 X4900 Tuition, fees, and other payments from providing instruction (e.g., sports
instruction) 1 190..................................................... 95 018 4.3 X5500 Admissions, including sports teams’ total receipts for admissions to
home games (not including admission taxes) 343........................ 15 376 .7 X5670 This establishment’s share of receipts from concessions or amusement
machines not operated by this establishment 167........................ 1 894 .1 X5750 Gaming receipts 14.................................................. 5 943 .3 X
5800 Amusement machines operated by this establishment (except slotmachines and other gaming machines) 67............................. 626 Z 31.1
5801 Phonograph, compact discs, or video jukeboxes 28.................... 165 Z X5802 Pinball machines 18............................................... 305 Z X5803 Video games 48................................................... 156 Z X
5900 Advertising (including endorsement fees) 94............................ 3 804 .2 X5950 Amounts received for the use of recreational facilities 957................. 92 207 4.2 X6000 Pleasure boat dockage, slip rental, launch fees, and storage 62........... 10 469 .5 X
8500 Food and beverage sales 1 326.......................................... 201 544 9.1 64.38501 Sales of food and nonalcoholic beverages 1 304......................... 156 212 7.0 X8502 Sales of alcoholic beverages 303..................................... 45 332 2.0 X
8550 Rental and leasing of goods and equipment (including bowling shoes,canoe rental, etc.) 136............................................... 18 629 .8 X
8600 Merchandise sales 858................................................ 40 642 1.8 48.58631 Fuels and lubricants 51............................................ 2 262 .1 X8633 All other merchandise 847........................................... 38 380 1.7 X
8940 All other receipts 1 612................................................. 206 340 9.3 44.98976 All other receipts 1 612............................................... 206 340 9.3 X
9000 Contributions, gifts, and grantsmGovernment 933........................ 102 158 4.6 X9050 Contributions, gifts, and grantsmPrivate 1 542............................. 185 047 8.3 X9100 Investment income, including interest and dividends 2 287.................. 29 599 1.3 X
9500 All other revenue 1 243................................................. 119 978 5.4 41.69508 All other revenue 1 243............................................... 119 978 5.4 X
713940 Fitness & recreational sports centers 4 679....................... 2 217 294 100.0 70.8
3450 Membership dues and fees 3 938........................................ 1 087 598 49.1 X4900 Tuition, fees, and other payments from providing instruction (e.g., sports
instruction) 1 190..................................................... 95 018 4.3 X5500 Admissions, including sports teams’ total receipts for admissions to
home games (not including admission taxes) 343........................ 15 376 .7 X5670 This establishment’s share of receipts from concessions or amusement
machines not operated by this establishment 167........................ 1 894 .1 X5750 Gaming receipts 14.................................................. 5 943 .3 X
See footnotes at end of table.
ARTS, ENTERTAINMENT, & RECREATIONmSUBJECT SERIES SUMMARY 43U.S. Census Bureau, 1997 Economic Census Apr. 30, 2001
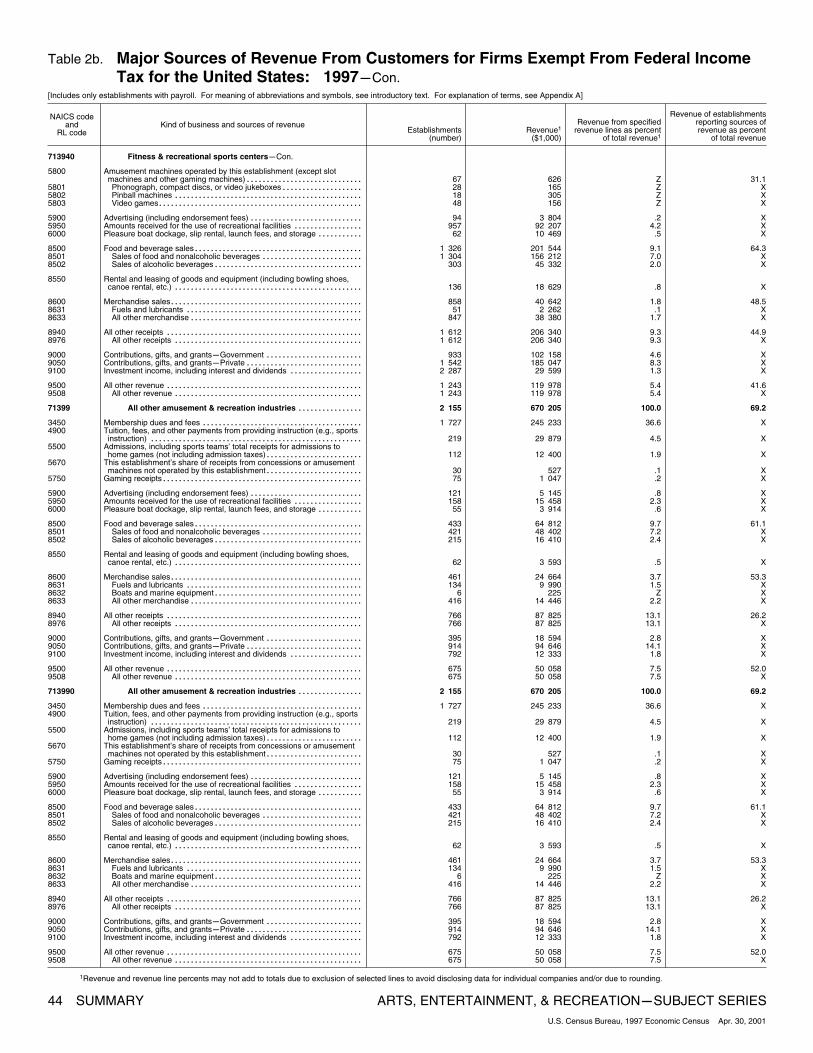
Table 2b. Major Sources of Revenue From Customers for Firms Exempt From Federal IncomeTax for the United States: 1997mCon.
[Includes only establishments with payroll. For meaning of abbreviations and symbols, see introductory text. For explanation of terms, see Appendix A]
NAICS codeand
RL codeKind of business and sources of revenue
Establishments(number)
Revenue1
($1,000)
Revenue from specifiedrevenue lines as percent
of total revenue1
Revenue of establishmentsreporting sources ofrevenue as percent
of total revenue
713940 Fitness & recreational sports centersmCon.
5800 Amusement machines operated by this establishment (except slotmachines and other gaming machines) 67............................. 626 Z 31.1
5801 Phonograph, compact discs, or video jukeboxes 28.................... 165 Z X5802 Pinball machines 18............................................... 305 Z X5803 Video games 48................................................... 156 Z X
5900 Advertising (including endorsement fees) 94............................ 3 804 .2 X5950 Amounts received for the use of recreational facilities 957................. 92 207 4.2 X6000 Pleasure boat dockage, slip rental, launch fees, and storage 62........... 10 469 .5 X
8500 Food and beverage sales 1 326.......................................... 201 544 9.1 64.38501 Sales of food and nonalcoholic beverages 1 304......................... 156 212 7.0 X8502 Sales of alcoholic beverages 303..................................... 45 332 2.0 X
8550 Rental and leasing of goods and equipment (including bowling shoes,canoe rental, etc.) 136............................................... 18 629 .8 X
8600 Merchandise sales 858................................................ 40 642 1.8 48.58631 Fuels and lubricants 51............................................ 2 262 .1 X8633 All other merchandise 847........................................... 38 380 1.7 X
8940 All other receipts 1 612................................................. 206 340 9.3 44.98976 All other receipts 1 612............................................... 206 340 9.3 X
9000 Contributions, gifts, and grantsmGovernment 933........................ 102 158 4.6 X9050 Contributions, gifts, and grantsmPrivate 1 542............................. 185 047 8.3 X9100 Investment income, including interest and dividends 2 287.................. 29 599 1.3 X
9500 All other revenue 1 243................................................. 119 978 5.4 41.69508 All other revenue 1 243............................................... 119 978 5.4 X
71399 All other amusement & recreation industries 2 155................ 670 205 100.0 69.2
3450 Membership dues and fees 1 727........................................ 245 233 36.6 X4900 Tuition, fees, and other payments from providing instruction (e.g., sports
instruction) 219..................................................... 29 879 4.5 X5500 Admissions, including sports teams’ total receipts for admissions to
home games (not including admission taxes) 112........................ 12 400 1.9 X5670 This establishment’s share of receipts from concessions or amusement
machines not operated by this establishment 30........................ 527 .1 X5750 Gaming receipts 75.................................................. 1 047 .2 X
5900 Advertising (including endorsement fees) 121............................ 5 145 .8 X5950 Amounts received for the use of recreational facilities 158................. 15 458 2.3 X6000 Pleasure boat dockage, slip rental, launch fees, and storage 55........... 3 914 .6 X
8500 Food and beverage sales 433.......................................... 64 812 9.7 61.18501 Sales of food and nonalcoholic beverages 421......................... 48 402 7.2 X8502 Sales of alcoholic beverages 215..................................... 16 410 2.4 X
8550 Rental and leasing of goods and equipment (including bowling shoes,canoe rental, etc.) 62............................................... 3 593 .5 X
8600 Merchandise sales 461................................................ 24 664 3.7 53.38631 Fuels and lubricants 134............................................ 9 990 1.5 X8632 Boats and marine equipment 6..................................... 225 Z X8633 All other merchandise 416........................................... 14 446 2.2 X
8940 All other receipts 766................................................. 87 825 13.1 26.28976 All other receipts 766............................................... 87 825 13.1 X
9000 Contributions, gifts, and grantsmGovernment 395........................ 18 594 2.8 X9050 Contributions, gifts, and grantsmPrivate 914............................. 94 646 14.1 X9100 Investment income, including interest and dividends 792.................. 12 333 1.8 X
9500 All other revenue 675................................................. 50 058 7.5 52.09508 All other revenue 675............................................... 50 058 7.5 X
713990 All other amusement & recreation industries 2 155................ 670 205 100.0 69.2
3450 Membership dues and fees 1 727........................................ 245 233 36.6 X4900 Tuition, fees, and other payments from providing instruction (e.g., sports
instruction) 219..................................................... 29 879 4.5 X5500 Admissions, including sports teams’ total receipts for admissions to
home games (not including admission taxes) 112........................ 12 400 1.9 X5670 This establishment’s share of receipts from concessions or amusement
machines not operated by this establishment 30........................ 527 .1 X5750 Gaming receipts 75.................................................. 1 047 .2 X
5900 Advertising (including endorsement fees) 121............................ 5 145 .8 X5950 Amounts received for the use of recreational facilities 158................. 15 458 2.3 X6000 Pleasure boat dockage, slip rental, launch fees, and storage 55........... 3 914 .6 X
8500 Food and beverage sales 433.......................................... 64 812 9.7 61.18501 Sales of food and nonalcoholic beverages 421......................... 48 402 7.2 X8502 Sales of alcoholic beverages 215..................................... 16 410 2.4 X
8550 Rental and leasing of goods and equipment (including bowling shoes,canoe rental, etc.) 62............................................... 3 593 .5 X
8600 Merchandise sales 461................................................ 24 664 3.7 53.38631 Fuels and lubricants 134............................................ 9 990 1.5 X8632 Boats and marine equipment 6..................................... 225 Z X8633 All other merchandise 416........................................... 14 446 2.2 X
8940 All other receipts 766................................................. 87 825 13.1 26.28976 All other receipts 766............................................... 87 825 13.1 X
9000 Contributions, gifts, and grantsmGovernment 395........................ 18 594 2.8 X9050 Contributions, gifts, and grantsmPrivate 914............................. 94 646 14.1 X9100 Investment income, including interest and dividends 792.................. 12 333 1.8 X
9500 All other revenue 675................................................. 50 058 7.5 52.09508 All other revenue 675............................................... 50 058 7.5 X
1Revenue and revenue line percents may not add to totals due to exclusion of selected lines to avoid disclosing data for individual companies and/or due to rounding.
44 SUMMARY ARTS, ENTERTAINMENT, & RECREATIONmSUBJECT SERIESU.S. Census Bureau, 1997 Economic Census Apr. 30, 2001

Table 3a. Concentration by Largest Firms Subject to Federal Income Tax: 1997[Includes only firms and establishments with payroll. Includes data for establishments classified in Sector 71, Arts, Entertainment, and Recreation only. See introductory text for a description ofestablishments in this sector. For meaning of abbreviations and symbols, see introductory text. For explanation of terms, see Appendix A. For method of assignment to categories shown, see AppendixC]
NAICS code Kind of business or operation and largest firms based on receipts
Receipts
Establishments(number)
Amount($1,000) As percent of total
Annual payroll($1,000)
First~quarterpayroll
($1,000)
Paid employeesfor pay period
includingMarch 12(number)
71 ARTS, ENTERTAINMENT, & RECREATIONAll firms r79 636...........................................
r85 088 464 100.0 r26 103 856 r5 617 788 r1 207 373
4 largest firms 372............................................ 6 112 394 7.2 1 287 323 298 177 81 3578 largest firms 781............................................ 8 640 116 10.2 1 878 886 432 347 122 80020 largest firms 1 335........................................... 12 864 087 15.1 2 782 682 635 591 175 86750 largest firms 1 586........................................... 18 569 665 21.8 4 286 757 979 755 225 627
711 Performing arts, spectator sports, & relatedindustries
All firms 25 942........................................... 32 743 586 100.0 12 834 362 2 653 922 235 926
4 largest firms 27............................................ 1 031 885 3.2 316 232 50 951 5 7218 largest firms 51............................................ 1 770 147 5.4 521 839 108 978 9 26720 largest firms 103........................................... 3 424 528 10.5 1 257 085 251 252 17 09650 largest firms 177........................................... 6 271 604 19.2 2 648 797 553 629 29 235
7111 Performing arts companiesAll firms 5 883........................................... 5 271 542 100.0 1 452 152 271 512 51 802
4 largest firms 16............................................ 449 119 8.5 91 166 22 459 2 5858 largest firms 22............................................ 625 698 11.9 126 676 31 073 3 58920 largest firms 38........................................... 1 013 340 19.2 193 225 44 004 5 52450 largest firms 77........................................... 1 638 965 31.1 331 655 70 606 8 415
71111 Theater companies & dinner theatersAll firms 1 600........................................... 2 344 240 100.0 593 790 127 135 26 488
4 largest firms 13............................................ 296 119 12.6 52 466 10 605 1 2688 largest firms 19............................................ 460 198 19.6 85 676 18 953 2 26420 largest firms 38........................................... 825 685 35.2 154 500 35 298 4 47750 largest firms 73........................................... 1 279 162 54.6 253 983 55 729 7 438
711110 Theater companies & dinner theatersAll firms 1 600........................................... 2 344 240 100.0 593 790 127 135 26 488
4 largest firms 13............................................ 296 119 12.6 52 466 10 605 1 2688 largest firms 19............................................ 460 198 19.6 85 676 18 953 2 26420 largest firms 38........................................... 825 685 35.2 154 500 35 298 4 47750 largest firms 73........................................... 1 279 162 54.6 253 983 55 729 7 438
7111101 Opera companiesAll firms 23........................................... D D D D c
4 largest firms 4............................................ D D D D c8 largest firms 8............................................ D D D D c20 largest firms 20........................................... D D D D c50 largest firms 23........................................... D D D D c
7111102 Theater companiesAll firms 1 393........................................... 2 043 181 100.0 502 901 108 258 19 157
4 largest firms 13............................................ 296 119 14.5 52 466 10 605 1 2688 largest firms 19............................................ 460 198 22.5 85 676 18 953 2 26420 largest firms 36........................................... 813 502 39.8 148 972 35 098 3 56050 largest firms 73........................................... 1 224 034 59.9 246 916 54 715 6 421
7111103 Dinner theatersAll firms 184........................................... D D D D i
4 largest firms 8............................................ D D D D g8 largest firms 12............................................ D D D D g20 largest firms 24........................................... D D D D h50 largest firms 54........................................... D D D D i
71112 Dance companiesAll firms 159........................................... 109 384 100.0 35 272 7 638 2 349
4 largest firms 4............................................ 50 963 46.6 15 609 2 847 6108 largest firms 8............................................ 69 997 64.0 22 751 4 430 1 23720 largest firms 20........................................... 87 488 80.0 28 367 6 098 1 51850 largest firms 50........................................... 100 650 92.0 32 643 7 086 1 924
711120 Dance companiesAll firms 159........................................... 109 384 100.0 35 272 7 638 2 349
4 largest firms 4............................................ 50 963 46.6 15 609 2 847 6108 largest firms 8............................................ 69 997 64.0 22 751 4 430 1 23720 largest firms 20........................................... 87 488 80.0 28 367 6 098 1 51850 largest firms 50........................................... 100 650 92.0 32 643 7 086 1 924
71113 Musical groups & artists
All firms 3 369........................................... 2 172 497 100.0 635 040 91 888 16 354
4 largest firms 4............................................ 113 432 5.2 24 640 3 867 1618 largest firms 8............................................ 195 171 9.0 42 189 5 445 25920 largest firms 21........................................... 344 023 15.8 80 185 10 662 63150 largest firms 51........................................... 567 786 26.1 132 026 15 518 1 088
711130 Musical groups & artists
All firms 3 369........................................... 2 172 497 100.0 635 040 91 888 16 354
4 largest firms 4............................................ 113 432 5.2 24 640 3 867 1618 largest firms 8............................................ 195 171 9.0 42 189 5 445 25920 largest firms 21........................................... 344 023 15.8 80 185 10 662 63150 largest firms 51........................................... 567 786 26.1 132 026 15 518 1 088
ARTS, ENTERTAINMENT, & RECREATIONmSUBJECT SERIES SUMMARY 45U.S. Census Bureau, 1997 Economic Census Apr. 30, 2001

Table 3a. Concentration by Largest Firms Subject to Federal Income Tax: 1997mCon.[Includes only firms and establishments with payroll. Includes data for establishments classified in Sector 71, Arts, Entertainment, and Recreation only. See introductory text for a description ofestablishments in this sector. For meaning of abbreviations and symbols, see introductory text. For explanation of terms, see Appendix A. For method of assignment to categories shown, see AppendixC]
NAICS code Kind of business or operation and largest firms based on receipts
Receipts
Establishments(number)
Amount($1,000) As percent of total
Annual payroll($1,000)
First~quarterpayroll
($1,000)
Paid employeesfor pay period
includingMarch 12(number)
71 ARTS, ENTERTAINMENT, & RECREATIONmCon.
711 Performing arts, spectator sports, & relatedindustriesmCon.
7111301 Symphony orchestras & chamber music organizations
All firms 107........................................... 40 022 100.0 15 438 1 908 628
4 largest firms 4............................................ 9 573 23.9 6 487 866 1578 largest firms 8............................................ 14 960 37.4 7 978 1 025 16620 largest firms 20........................................... 25 107 62.7 11 026 1 273 48350 largest firms 50........................................... 34 932 87.3 13 850 1 699 550
7111309 Other music groups & artists
All firms 3 262........................................... 2 132 475 100.0 619 602 89 980 15 726
4 largest firms 4............................................ 113 432 5.3 24 640 3 867 1618 largest firms 8............................................ 195 171 9.2 42 189 5 445 25920 largest firms 21........................................... 344 023 16.1 80 185 10 662 63150 largest firms 51........................................... 567 786 26.6 132 026 15 518 1 088
71119 Other performing arts companies
All firms 755........................................... 645 421 100.0 188 050 44 851 6 611
4 largest firms 7............................................ 266 316 41.3 55 959 15 804 1 6798 largest firms 17............................................ 306 723 47.5 63 012 16 920 1 82420 largest firms 29........................................... 358 946 55.6 76 888 20 231 2 22850 largest firms 66........................................... 432 016 66.9 106 326 28 392 2 939
711190 Other performing arts companies
All firms 755........................................... 645 421 100.0 188 050 44 851 6 611
4 largest firms 7............................................ 266 316 41.3 55 959 15 804 1 6798 largest firms 17............................................ 306 723 47.5 63 012 16 920 1 82420 largest firms 29........................................... 358 946 55.6 76 888 20 231 2 22850 largest firms 66........................................... 432 016 66.9 106 326 28 392 2 939
7111901 Circuses
All firms 70........................................... 268 351 100.0 56 393 13 684 1 861
4 largest firms 6............................................ 226 181 84.3 49 015 12 478 1 3488 largest firms 10............................................ 243 679 90.8 50 784 12 933 1 42920 largest firms 22........................................... 258 682 96.4 53 726 13 387 1 65250 largest firms 52........................................... 267 135 99.5 56 082 13 629 1 826
7111909 Other performing arts companies (except circuses)
All firms 685........................................... 377 070 100.0 131 657 31 167 4 750
4 largest firms 10............................................ 67 113 17.8 8 006 1 629 1888 largest firms 14............................................ 95 124 25.2 17 256 5 215 61120 largest firms 26........................................... 138 888 36.8 35 502 8 724 1 00050 largest firms 63........................................... 197 924 52.5 62 672 16 793 1 570
7112 Spectator sports
All firms 3 881........................................... 13 656 033 100.0 6 151 215 1 374 222 92 393
4 largest firms 21............................................ 732 818 5.4 243 243 68 403 4 7558 largest firms 33............................................ 1 307 374 9.6 484 144 121 480 8 12520 largest firms 55........................................... 2 645 185 19.4 1 013 189 195 751 14 56850 largest firms 92........................................... 5 136 676 37.6 2 539 015 531 273 21 641
71121 Spectator sports
All firms 3 881........................................... 13 656 033 100.0 6 151 215 1 374 222 92 393
4 largest firms 21............................................ 732 818 5.4 243 243 68 403 4 7558 largest firms 33............................................ 1 307 374 9.6 484 144 121 480 8 12520 largest firms 55........................................... 2 645 185 19.4 1 013 189 195 751 14 56850 largest firms 92........................................... 5 136 676 37.6 2 539 015 531 273 21 641
711211 Sports teams & clubs
All firms 483........................................... 7 808 684 100.0 4 922 390 1 114 533 33 330
4 largest firms 13............................................ 632 986 8.1 283 096 58 811 3 0478 largest firms 17............................................ 1 100 826 14.1 550 907 81 734 4 17720 largest firms 34........................................... 2 253 999 28.9 1 279 413 248 259 7 53550 largest firms 68........................................... 4 555 106 58.3 2 860 656 569 066 13 714
7112111 Football clubs
All firms 45........................................... 2 503 339 100.0 1 656 478 382 473 4 107
4 largest firms 4............................................ 442 935 17.7 243 137 63 840 6708 largest firms 8............................................ 804 941 32.2 464 467 113 804 1 27020 largest firms 20........................................... 1 767 786 70.6 1 125 076 266 944 2 72050 largest firms 45........................................... 2 503 339 100.0 1 656 478 382 473 4 107
7112112 Baseball clubs
All firms 194........................................... 2 296 558 100.0 1 425 319 135 620 14 410
4 largest firms 11............................................ 538 837 23.5 265 362 24 288 3 0858 largest firms 17............................................ 937 164 40.8 520 765 43 644 5 20520 largest firms 30........................................... 1 754 383 76.4 1 198 681 108 869 8 81150 largest firms 63........................................... 2 154 550 93.8 1 385 701 129 106 11 588
46 SUMMARY ARTS, ENTERTAINMENT, & RECREATIONmSUBJECT SERIESU.S. Census Bureau, 1997 Economic Census Apr. 30, 2001

Table 3a. Concentration by Largest Firms Subject to Federal Income Tax: 1997mCon.[Includes only firms and establishments with payroll. Includes data for establishments classified in Sector 71, Arts, Entertainment, and Recreation only. See introductory text for a description ofestablishments in this sector. For meaning of abbreviations and symbols, see introductory text. For explanation of terms, see Appendix A. For method of assignment to categories shown, see AppendixC]
NAICS code Kind of business or operation and largest firms based on receipts
Receipts
Establishments(number)
Amount($1,000) As percent of total
Annual payroll($1,000)
First~quarterpayroll
($1,000)
Paid employeesfor pay period
includingMarch 12(number)
71 ARTS, ENTERTAINMENT, & RECREATIONmCon.
711 Performing arts, spectator sports, & relatedindustriesmCon.
7112119 Other professional sports clubsAll firms 244........................................... 3 008 787 100.0 1 840 593 596 440 14 813
4 largest firms 6............................................ 441 830 14.7 274 598 66 733 6968 largest firms 12............................................ 752 951 25.0 431 517 121 269 2 24220 largest firms 29........................................... 1 530 762 50.9 877 786 264 497 4 38450 largest firms 62........................................... 2 714 028 90.2 1 731 070 566 409 10 101
711212 RacetracksAll firms 807........................................... 4 142 020 100.0 797 261 173 543 44 880
4 largest firms 16............................................ 604 255 14.6 106 411 23 813 4 9598 largest firms 23............................................ 1 018 214 24.6 175 103 41 603 8 22120 largest firms 46........................................... 1 799 241 43.4 335 086 78 734 15 93450 largest firms 84........................................... 2 726 711 65.8 518 292 116 697 26 209
7112121 Dog racetrack operationAll firms 56........................................... 796 069 100.0 148 173 36 997 11 212
4 largest firms 11............................................ 331 815 41.7 46 280 11 704 3 4758 largest firms 15............................................ 455 820 57.3 70 809 17 752 5 37220 largest firms 29........................................... 681 202 85.6 116 736 29 191 8 27450 largest firms 56........................................... 796 069 100.0 148 173 36 997 11 212
7112122 Auto racetrack operationAll firms 590........................................... 897 600 100.0 120 176 22 215 6 267
4 largest firms 9............................................ 292 152 32.5 37 766 8 734 1 0998 largest firms 20............................................ 402 699 44.9 47 930 11 338 1 64520 largest firms 32........................................... 550 635 61.3 70 712 16 087 2 64050 largest firms 63........................................... 653 018 72.8 86 480 18 064 3 460
7112123 Horse racetrack operation
All firms 161........................................... 2 448 351 100.0 528 912 114 331 27 401
4 largest firms 10............................................ 579 154 23.7 106 138 23 007 3 9698 largest firms 16............................................ 875 453 35.8 184 433 44 994 8 14020 largest firms 31........................................... 1 453 751 59.4 295 882 66 697 14 07450 largest firms 61........................................... 2 115 830 86.4 455 934 99 385 22 744
711219 Other spectator sports
All firms 2 591........................................... 1 705 329 100.0 431 564 86 146 14 183
4 largest firms 6............................................ 150 512 8.8 20 383 4 333 3028 largest firms 10............................................ 254 889 14.9 43 445 9 129 67520 largest firms 23........................................... 437 327 25.6 79 558 16 336 1 18050 largest firms 62........................................... 660 072 38.7 138 206 27 402 2 177
7112191 Professional athletes
All firms 569........................................... 302 751 100.0 83 227 12 583 1 540
4 largest firms 4............................................ 74 456 24.6 8 320 1 404 398 largest firms 8............................................ 106 209 35.1 21 121 2 482 10720 largest firms 20........................................... 145 555 48.1 35 777 4 723 18350 largest firms 50........................................... 190 886 63.1 49 766 6 995 415
7112192 Racing (except racetrack operation)
All firms 2 022........................................... 1 402 578 100.0 348 337 73 563 12 643
4 largest firms 6............................................ 140 410 10.0 26 215 5 219 3988 largest firms 10............................................ 238 834 17.0 49 849 10 136 72820 largest firms 25........................................... 403 570 28.8 79 182 16 616 1 32650 largest firms 62........................................... 595 695 42.5 127 065 26 979 2 234
7113 Promoters of performing arts, sports, & similar events
All firms 2 633........................................... 5 045 093 100.0 1 052 645 232 997 51 411
4 largest firms 30............................................ 416 022 8.2 76 301 22 125 3 6968 largest firms 42............................................ 726 353 14.4 140 383 35 677 5 06520 largest firms 62........................................... 1 441 849 28.6 300 500 77 743 15 57950 largest firms 123........................................... 2 302 917 45.6 484 754 121 035 25 933
71131 Promoters of performing arts, sports, & similar events w/facility
All firms 557........................................... 1 548 106 100.0 418 885 97 610 25 713
4 largest firms 27............................................ 321 433 20.8 111 633 31 969 2 4658 largest firms 31............................................ 535 361 34.6 167 022 44 682 6 66420 largest firms 61........................................... 877 675 56.7 272 628 68 742 14 54550 largest firms 98........................................... 1 237 403 79.9 344 601 81 978 19 308
711310 Promoters of performing arts, sports, & similar events w/facility
All firms 557........................................... 1 548 106 100.0 418 885 97 610 25 713
4 largest firms 27............................................ 321 433 20.8 111 633 31 969 2 4658 largest firms 31............................................ 535 361 34.6 167 022 44 682 6 66420 largest firms 61........................................... 877 675 56.7 272 628 68 742 14 54550 largest firms 98........................................... 1 237 403 79.9 344 601 81 978 19 308
ARTS, ENTERTAINMENT, & RECREATIONmSUBJECT SERIES SUMMARY 47U.S. Census Bureau, 1997 Economic Census Apr. 30, 2001

Table 3a. Concentration by Largest Firms Subject to Federal Income Tax: 1997mCon.[Includes only firms and establishments with payroll. Includes data for establishments classified in Sector 71, Arts, Entertainment, and Recreation only. See introductory text for a description ofestablishments in this sector. For meaning of abbreviations and symbols, see introductory text. For explanation of terms, see Appendix A. For method of assignment to categories shown, see AppendixC]
NAICS code Kind of business or operation and largest firms based on receipts
Receipts
Establishments(number)
Amount($1,000) As percent of total
Annual payroll($1,000)
First~quarterpayroll
($1,000)
Paid employeesfor pay period
includingMarch 12(number)
71 ARTS, ENTERTAINMENT, & RECREATIONmCon.
711 Performing arts, spectator sports, & relatedindustriesmCon.
71132 Promoters of performing arts, sports, & similar events w/o facil
All firms 2 076........................................... 3 496 987 100.0 633 760 135 387 25 698
4 largest firms 8............................................ 381 792 10.9 42 536 9 709 1 5748 largest firms 15............................................ 664 137 19.0 113 140 28 665 8 09620 largest firms 36........................................... 1 166 732 33.4 160 841 40 077 9 27750 largest firms 77........................................... 1 673 222 47.8 227 080 54 344 12 040
711320 Promoters of performing arts, sports, & similar events w/o facil
All firms 2 076........................................... 3 496 987 100.0 633 760 135 387 25 698
4 largest firms 8............................................ 381 792 10.9 42 536 9 709 1 5748 largest firms 15............................................ 664 137 19.0 113 140 28 665 8 09620 largest firms 36........................................... 1 166 732 33.4 160 841 40 077 9 27750 largest firms 77........................................... 1 673 222 47.8 227 080 54 344 12 040
7114 Agents/managers for artists, athletes, & other publicfigures
All firms 2 532........................................... 2 409 918 100.0 910 844 195 732 13 239
4 largest firms 29............................................ 566 742 23.5 271 382 65 180 2 1608 largest firms 35............................................ 697 387 28.9 296 470 70 194 2 47020 largest firms 49........................................... 877 557 36.4 368 514 81 943 2 95550 largest firms 87........................................... 1 100 451 45.7 470 126 103 555 4 058
71141 Agents/managers for artists, athletes, & other publicfigures
All firms 2 532........................................... 2 409 918 100.0 910 844 195 732 13 239
4 largest firms 29............................................ 566 742 23.5 271 382 65 180 2 1608 largest firms 35............................................ 697 387 28.9 296 470 70 194 2 47020 largest firms 49........................................... 877 557 36.4 368 514 81 943 2 95550 largest firms 87........................................... 1 100 451 45.7 470 126 103 555 4 058
711410 Agents/managers for artists, athletes, & other publicfigures
All firms 2 532........................................... 2 409 918 100.0 910 844 195 732 13 239
4 largest firms 29............................................ 566 742 23.5 271 382 65 180 2 1608 largest firms 35............................................ 697 387 28.9 296 470 70 194 2 47020 largest firms 49........................................... 877 557 36.4 368 514 81 943 2 95550 largest firms 87........................................... 1 100 451 45.7 470 126 103 555 4 058
7115 Independent artists, writers, & performersAll firms 11 013........................................... 6 361 000 100.0 3 267 506 579 459 27 081
4 largest firms 4............................................ 353 829 5.6 233 579 33 056 88 largest firms 8............................................ 483 638 7.6 312 059 33 274 2720 largest firms 20........................................... 745 025 11.7 484 765 55 251 12050 largest firms 54........................................... 1 158 291 18.2 695 208 99 613 769
71151 Independent artists, writers, & performersAll firms 11 013........................................... 6 361 000 100.0 3 267 506 579 459 27 081
4 largest firms 4............................................ 353 829 5.6 233 579 33 056 88 largest firms 8............................................ 483 638 7.6 312 059 33 274 2720 largest firms 20........................................... 745 025 11.7 484 765 55 251 12050 largest firms 54........................................... 1 158 291 18.2 695 208 99 613 769
711510 Independent artists, writers, & performersAll firms 11 013........................................... 6 361 000 100.0 3 267 506 579 459 27 081
4 largest firms 4............................................ 353 829 5.6 233 579 33 056 88 largest firms 8............................................ 483 638 7.6 312 059 33 274 2720 largest firms 20........................................... 745 025 11.7 484 765 55 251 12050 largest firms 54........................................... 1 158 291 18.2 695 208 99 613 769
712 Museums, historical sites, & similar institutionsAll firms 787........................................... 483 683 100.0 122 404 24 387 7 281
4 largest firms 7............................................ 113 505 23.5 21 245 4 699 1 0678 largest firms 12............................................ 146 088 30.2 31 127 7 117 1 57620 largest firms 25........................................... 201 812 41.7 47 258 10 474 2 28650 largest firms 56........................................... 267 708 55.3 64 925 13 980 3 300
7121 Museums, historical sites, & similar institutionsAll firms 787........................................... 483 683 100.0 122 404 24 387 7 281
4 largest firms 7............................................ 113 505 23.5 21 245 4 699 1 0678 largest firms 12............................................ 146 088 30.2 31 127 7 117 1 57620 largest firms 25........................................... 201 812 41.7 47 258 10 474 2 28650 largest firms 56........................................... 267 708 55.3 64 925 13 980 3 300
71211 MuseumsAll firms 426........................................... 259 215 100.0 52 692 11 230 2 975
4 largest firms 7............................................ 107 943 41.6 19 963 4 336 1 0118 largest firms 12............................................ 125 406 48.4 22 466 5 197 1 14120 largest firms 24........................................... 147 633 57.0 27 172 6 207 1 29950 largest firms 54........................................... 181 782 70.1 34 391 7 699 1 766
48 SUMMARY ARTS, ENTERTAINMENT, & RECREATIONmSUBJECT SERIESU.S. Census Bureau, 1997 Economic Census Apr. 30, 2001

Table 3a. Concentration by Largest Firms Subject to Federal Income Tax: 1997mCon.[Includes only firms and establishments with payroll. Includes data for establishments classified in Sector 71, Arts, Entertainment, and Recreation only. See introductory text for a description ofestablishments in this sector. For meaning of abbreviations and symbols, see introductory text. For explanation of terms, see Appendix A. For method of assignment to categories shown, see AppendixC]
NAICS code Kind of business or operation and largest firms based on receipts
Receipts
Establishments(number)
Amount($1,000) As percent of total
Annual payroll($1,000)
First~quarterpayroll
($1,000)
Paid employeesfor pay period
includingMarch 12(number)
71 ARTS, ENTERTAINMENT, & RECREATIONmCon.
712 Museums, historical sites, & similar institutionsmCon.
712110 Museums
All firms 426........................................... 259 215 100.0 52 692 11 230 2 975
4 largest firms 7............................................ 107 943 41.6 19 963 4 336 1 0118 largest firms 12............................................ 125 406 48.4 22 466 5 197 1 14120 largest firms 24........................................... 147 633 57.0 27 172 6 207 1 29950 largest firms 54........................................... 181 782 70.1 34 391 7 699 1 766
71212 Historical sites
All firms 78........................................... 27 462 100.0 9 307 1 662 927
4 largest firms 4............................................ 9 884 36.0 2 911 657 2368 largest firms 8............................................ 14 880 54.2 4 746 927 53720 largest firms 20........................................... 21 491 78.3 7 099 1 271 69150 largest firms 50........................................... 26 687 97.2 9 001 1 614 896
712120 Historical sites
All firms 78........................................... 27 462 100.0 9 307 1 662 927
4 largest firms 4............................................ 9 884 36.0 2 911 657 2368 largest firms 8............................................ 14 880 54.2 4 746 927 53720 largest firms 20........................................... 21 491 78.3 7 099 1 271 69150 largest firms 50........................................... 26 687 97.2 9 001 1 614 896
71213 Zoos & botanical gardens
All firms 117........................................... 96 915 100.0 28 900 5 845 1 645
4 largest firms 4............................................ 36 462 37.6 9 221 2 047 5348 largest firms 8............................................ 51 094 52.7 15 521 3 240 77420 largest firms 20........................................... 70 954 73.2 21 400 4 587 1 13050 largest firms 50........................................... 88 857 91.7 26 804 5 520 1 473
712130 Zoos & botanical gardens
All firms 117........................................... 96 915 100.0 28 900 5 845 1 645
4 largest firms 4............................................ 36 462 37.6 9 221 2 047 5348 largest firms 8............................................ 51 094 52.7 15 521 3 240 77420 largest firms 20........................................... 70 954 73.2 21 400 4 587 1 13050 largest firms 50........................................... 88 857 91.7 26 804 5 520 1 473
71219 Nature parks & other similar institutions
All firms 166........................................... 100 091 100.0 31 505 5 650 1 734
4 largest firms 4............................................ 23 483 23.5 7 743 1 759 3518 largest firms 8............................................ 34 878 34.8 11 481 2 433 47920 largest firms 20........................................... 57 538 57.5 18 813 3 716 89650 largest firms 53........................................... 83 095 83.0 26 254 4 918 1 368
712190 Nature parks & other similar institutions
All firms 166........................................... 100 091 100.0 31 505 5 650 1 734
4 largest firms 4............................................ 23 483 23.5 7 743 1 759 3518 largest firms 8............................................ 34 878 34.8 11 481 2 433 47920 largest firms 20........................................... 57 538 57.5 18 813 3 716 89650 largest firms 53........................................... 83 095 83.0 26 254 4 918 1 368
713 Amusement, gambling, & recreation industries
All firms r52 907...........................................r51 861 195 100.0 r13 147 090 r2 939 479 r964 166
4 largest firms 349............................................ 5 637 232 10.9 1 143 263 261 585 67 7458 largest firms 756............................................ 8 064 713 15.6 1 731 334 390 992 118 05120 largest firms 1 308........................................... 12 208 569 23.5 2 637 163 590 712 170 61450 largest firms 1 703........................................... 17 110 819 33.0 3 654 835 844 115 227 570
7131 Amusement parks & arcades
All firms 3 344........................................... 8 418 476 100.0 1 961 871 396 359 138 930
4 largest firms 29............................................ 4 857 835 57.7 1 027 132 227 589 74 2368 largest firms 246............................................ 5 909 841 70.2 1 307 687 284 516 92 96420 largest firms 867........................................... 6 682 650 79.4 1 467 854 314 252 102 92850 largest firms 1 114........................................... 7 159 068 85.0 1 624 463 342 104 113 739
71311 Amusement & theme parks
All firms 607........................................... 7 171 677 100.0 1 690 386 337 225 110 789
4 largest firms 29............................................ 4 857 835 67.7 1 027 132 227 589 74 2368 largest firms 44............................................ 5 898 027 82.2 1 308 575 281 177 88 86720 largest firms 76........................................... 6 344 828 88.5 1 424 398 300 072 95 43850 largest firms 108........................................... 6 663 219 92.9 1 541 495 318 682 101 696
713110 Amusement & theme parks
All firms 607........................................... 7 171 677 100.0 1 690 386 337 225 110 789
4 largest firms 29............................................ 4 857 835 67.7 1 027 132 227 589 74 2368 largest firms 44............................................ 5 898 027 82.2 1 308 575 281 177 88 86720 largest firms 76........................................... 6 344 828 88.5 1 424 398 300 072 95 43850 largest firms 108........................................... 6 663 219 92.9 1 541 495 318 682 101 696
ARTS, ENTERTAINMENT, & RECREATIONmSUBJECT SERIES SUMMARY 49U.S. Census Bureau, 1997 Economic Census Apr. 30, 2001
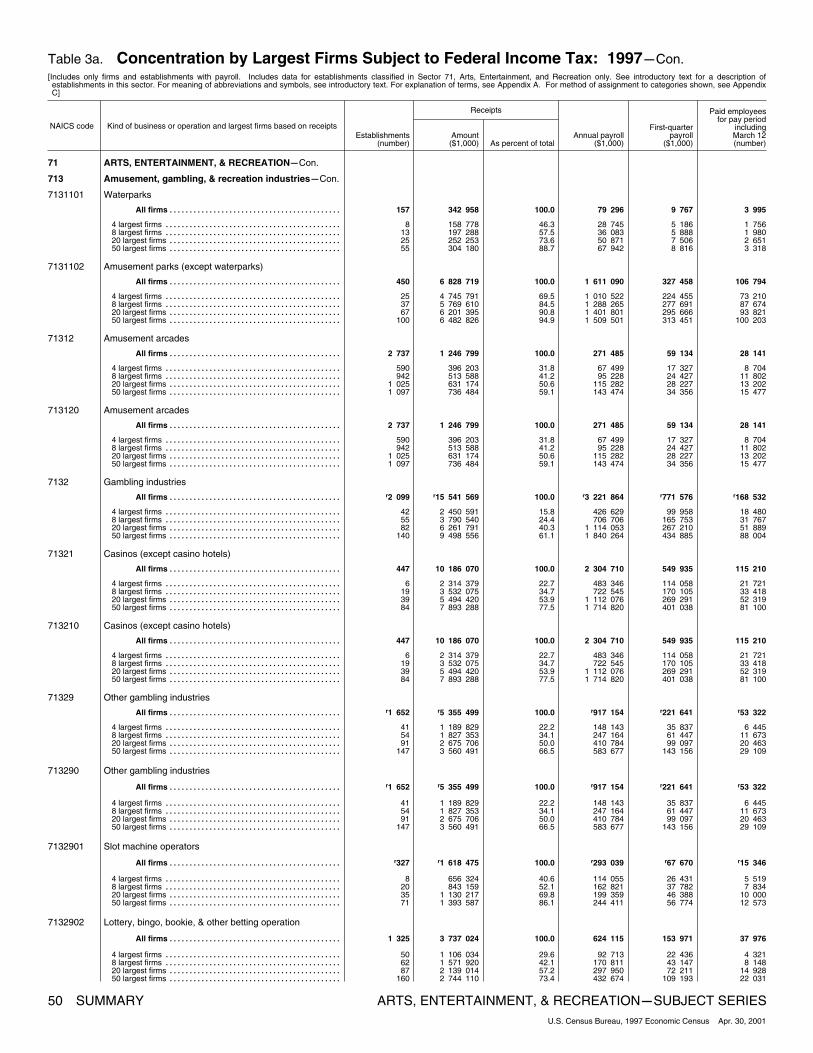
Table 3a. Concentration by Largest Firms Subject to Federal Income Tax: 1997mCon.[Includes only firms and establishments with payroll. Includes data for establishments classified in Sector 71, Arts, Entertainment, and Recreation only. See introductory text for a description ofestablishments in this sector. For meaning of abbreviations and symbols, see introductory text. For explanation of terms, see Appendix A. For method of assignment to categories shown, see AppendixC]
NAICS code Kind of business or operation and largest firms based on receipts
Receipts
Establishments(number)
Amount($1,000) As percent of total
Annual payroll($1,000)
First~quarterpayroll
($1,000)
Paid employeesfor pay period
includingMarch 12(number)
71 ARTS, ENTERTAINMENT, & RECREATIONmCon.
713 Amusement, gambling, & recreation industriesmCon.
7131101 Waterparks
All firms 157........................................... 342 958 100.0 79 296 9 767 3 995
4 largest firms 8............................................ 158 778 46.3 28 745 5 186 1 7568 largest firms 13............................................ 197 288 57.5 36 083 5 888 1 98020 largest firms 25........................................... 252 253 73.6 50 871 7 506 2 65150 largest firms 55........................................... 304 180 88.7 67 942 8 816 3 318
7131102 Amusement parks (except waterparks)
All firms 450........................................... 6 828 719 100.0 1 611 090 327 458 106 794
4 largest firms 25............................................ 4 745 791 69.5 1 010 522 224 455 73 2108 largest firms 37............................................ 5 769 610 84.5 1 288 265 277 691 87 67420 largest firms 67........................................... 6 201 395 90.8 1 401 801 295 666 93 82150 largest firms 100........................................... 6 482 826 94.9 1 509 501 313 451 100 203
71312 Amusement arcades
All firms 2 737........................................... 1 246 799 100.0 271 485 59 134 28 141
4 largest firms 590............................................ 396 203 31.8 67 499 17 327 8 7048 largest firms 942............................................ 513 588 41.2 95 228 24 427 11 80220 largest firms 1 025........................................... 631 174 50.6 115 282 28 227 13 20250 largest firms 1 097........................................... 736 484 59.1 143 474 34 356 15 477
713120 Amusement arcades
All firms 2 737........................................... 1 246 799 100.0 271 485 59 134 28 141
4 largest firms 590............................................ 396 203 31.8 67 499 17 327 8 7048 largest firms 942............................................ 513 588 41.2 95 228 24 427 11 80220 largest firms 1 025........................................... 631 174 50.6 115 282 28 227 13 20250 largest firms 1 097........................................... 736 484 59.1 143 474 34 356 15 477
7132 Gambling industries
All firms r2 099...........................................r15 541 569 100.0 r3 221 864 r771 576 r168 532
4 largest firms 42............................................ 2 450 591 15.8 426 629 99 958 18 4808 largest firms 55............................................ 3 790 540 24.4 706 706 165 753 31 76720 largest firms 82........................................... 6 261 791 40.3 1 114 053 267 210 51 88950 largest firms 140........................................... 9 498 556 61.1 1 840 264 434 885 88 004
71321 Casinos (except casino hotels)
All firms 447........................................... 10 186 070 100.0 2 304 710 549 935 115 210
4 largest firms 6............................................ 2 314 379 22.7 483 346 114 058 21 7218 largest firms 19............................................ 3 532 075 34.7 722 545 170 105 33 41820 largest firms 39........................................... 5 494 420 53.9 1 112 076 269 291 52 31950 largest firms 84........................................... 7 893 288 77.5 1 714 820 401 038 81 100
713210 Casinos (except casino hotels)
All firms 447........................................... 10 186 070 100.0 2 304 710 549 935 115 210
4 largest firms 6............................................ 2 314 379 22.7 483 346 114 058 21 7218 largest firms 19............................................ 3 532 075 34.7 722 545 170 105 33 41820 largest firms 39........................................... 5 494 420 53.9 1 112 076 269 291 52 31950 largest firms 84........................................... 7 893 288 77.5 1 714 820 401 038 81 100
71329 Other gambling industries
All firms r1 652...........................................r5 355 499 100.0 r917 154 r221 641 r53 322
4 largest firms 41............................................ 1 189 829 22.2 148 143 35 837 6 4458 largest firms 54............................................ 1 827 353 34.1 247 164 61 447 11 67320 largest firms 91........................................... 2 675 706 50.0 410 784 99 097 20 46350 largest firms 147........................................... 3 560 491 66.5 583 677 143 156 29 109
713290 Other gambling industries
All firms r1 652...........................................r5 355 499 100.0 r917 154 r221 641 r53 322
4 largest firms 41............................................ 1 189 829 22.2 148 143 35 837 6 4458 largest firms 54............................................ 1 827 353 34.1 247 164 61 447 11 67320 largest firms 91........................................... 2 675 706 50.0 410 784 99 097 20 46350 largest firms 147........................................... 3 560 491 66.5 583 677 143 156 29 109
7132901 Slot machine operators
All firms r327...........................................r1 618 475 100.0 r293 039 r67 670 r15 346
4 largest firms 8............................................ 656 324 40.6 114 055 26 431 5 5198 largest firms 20............................................ 843 159 52.1 162 821 37 782 7 83420 largest firms 35........................................... 1 130 217 69.8 199 359 46 388 10 00050 largest firms 71........................................... 1 393 587 86.1 244 411 56 774 12 573
7132902 Lottery, bingo, bookie, & other betting operation
All firms 1 325........................................... 3 737 024 100.0 624 115 153 971 37 976
4 largest firms 50............................................ 1 106 034 29.6 92 713 22 436 4 3218 largest firms 62............................................ 1 571 920 42.1 170 811 43 147 8 14820 largest firms 87........................................... 2 139 014 57.2 297 950 72 211 14 92850 largest firms 160........................................... 2 744 110 73.4 432 674 109 193 22 031
50 SUMMARY ARTS, ENTERTAINMENT, & RECREATIONmSUBJECT SERIESU.S. Census Bureau, 1997 Economic Census Apr. 30, 2001

Table 3a. Concentration by Largest Firms Subject to Federal Income Tax: 1997mCon.[Includes only firms and establishments with payroll. Includes data for establishments classified in Sector 71, Arts, Entertainment, and Recreation only. See introductory text for a description ofestablishments in this sector. For meaning of abbreviations and symbols, see introductory text. For explanation of terms, see Appendix A. For method of assignment to categories shown, see AppendixC]
NAICS code Kind of business or operation and largest firms based on receipts
Receipts
Establishments(number)
Amount($1,000) As percent of total
Annual payroll($1,000)
First~quarterpayroll
($1,000)
Paid employeesfor pay period
includingMarch 12(number)
71 ARTS, ENTERTAINMENT, & RECREATIONmCon.
713 Amusement, gambling, & recreation industriesmCon.
7139 Other amusement & recreation services
All firms 47 464........................................... 27 901 150 100.0 7 963 355 1 771 544 656 704
4 largest firms 1 042............................................ 2 306 689 8.3 529 997 124 471 41 6338 largest firms 1 338............................................ 3 120 766 11.2 802 259 192 976 61 68320 largest firms 1 575........................................... 3 919 770 14.0 1 009 124 243 927 78 49250 largest firms 1 826........................................... 4 993 952 17.9 1 302 487 321 730 102 182
71391 Golf courses & country clubs
All firms 8 546........................................... 8 636 921 100.0 2 731 863 516 430 160 118
4 largest firms 400............................................ 1 226 060 14.2 325 116 74 468 21 1788 largest firms 426............................................ 1 411 854 16.3 374 592 84 089 23 73320 largest firms 536........................................... 1 757 356 20.3 497 073 109 313 31 99950 largest firms 620........................................... 2 152 389 24.9 619 070 135 483 38 864
713910 Golf courses & country clubs
All firms 8 546........................................... 8 636 921 100.0 2 731 863 516 430 160 118
4 largest firms 400............................................ 1 226 060 14.2 325 116 74 468 21 1788 largest firms 426............................................ 1 411 854 16.3 374 592 84 089 23 73320 largest firms 536........................................... 1 757 356 20.3 497 073 109 313 31 99950 largest firms 620........................................... 2 152 389 24.9 619 070 135 483 38 864
71392 Skiing facilities
All firms 379........................................... 1 340 813 100.0 431 147 166 775 58 513
4 largest firms 19............................................ 478 214 35.7 153 298 43 512 11 3468 largest firms 24............................................ 619 321 46.2 193 848 61 139 15 86520 largest firms 38........................................... 840 185 62.7 262 528 89 496 24 06250 largest firms 74........................................... 1 063 281 79.3 335 022 119 667 35 403
713920 Skiing facilities
All firms 379........................................... 1 340 813 100.0 431 147 166 775 58 513
4 largest firms 19............................................ 478 214 35.7 153 298 43 512 11 3468 largest firms 24............................................ 619 321 46.2 193 848 61 139 15 86520 largest firms 38........................................... 840 185 62.7 262 528 89 496 24 06250 largest firms 74........................................... 1 063 281 79.3 335 022 119 667 35 403
71393 Marinas
All firms 4 217........................................... 2 541 481 100.0 516 589 102 145 22 765
4 largest firms 42............................................ 161 373 6.3 20 636 3 858 8268 largest firms 50............................................ 212 811 8.4 26 286 5 006 1 05120 largest firms 65........................................... 318 962 12.6 44 117 10 288 1 67150 largest firms 107........................................... 487 588 19.2 74 885 16 209 2 755
713930 Marinas
All firms 4 217........................................... 2 541 481 100.0 516 589 102 145 22 765
4 largest firms 42............................................ 161 373 6.3 20 636 3 858 8268 largest firms 50............................................ 212 811 8.4 26 286 5 006 1 05120 largest firms 65........................................... 318 962 12.6 44 117 10 288 1 67150 largest firms 107........................................... 487 588 19.2 74 885 16 209 2 755
71394 Fitness & recreational sports centers
All firms 16 604........................................... 7 944 954 100.0 2 405 043 562 933 256 397
4 largest firms 550............................................ 1 308 784 16.5 277 465 66 142 24 3808 largest firms 638............................................ 1 559 713 19.6 353 221 85 326 31 10520 largest firms 707........................................... 1 898 708 23.9 465 395 112 973 40 16450 largest firms 814........................................... 2 237 597 28.2 559 833 136 751 48 296
713940 Fitness & recreational sports centers
All firms 16 604........................................... 7 944 954 100.0 2 405 043 562 933 256 397
4 largest firms 550............................................ 1 308 784 16.5 277 465 66 142 24 3808 largest firms 638............................................ 1 559 713 19.6 353 221 85 326 31 10520 largest firms 707........................................... 1 898 708 23.9 465 395 112 973 40 16450 largest firms 814........................................... 2 237 597 28.2 559 833 136 751 48 296
7139404 Ice skating rinks
All firms 381........................................... 298 737 100.0 78 587 19 552 8 870
4 largest firms 22............................................ 31 953 10.7 7 467 1 765 8738 largest firms 27............................................ 46 238 15.5 11 231 2 714 1 29220 largest firms 40........................................... 78 496 26.3 20 311 4 749 2 11650 largest firms 74........................................... 134 494 45.0 35 263 8 552 3 743
7139405 Roller skating rinks
All firms 1 611........................................... 416 339 100.0 111 912 28 316 19 416
4 largest firms 13............................................ 20 603 4.9 5 224 1 504 6668 largest firms 21............................................ 28 545 6.9 7 645 2 142 1 03620 largest firms 46........................................... 46 057 11.1 12 894 3 487 1 81450 largest firms 88........................................... 78 573 18.9 21 930 5 726 3 163
ARTS, ENTERTAINMENT, & RECREATIONmSUBJECT SERIES SUMMARY 51U.S. Census Bureau, 1997 Economic Census Apr. 30, 2001
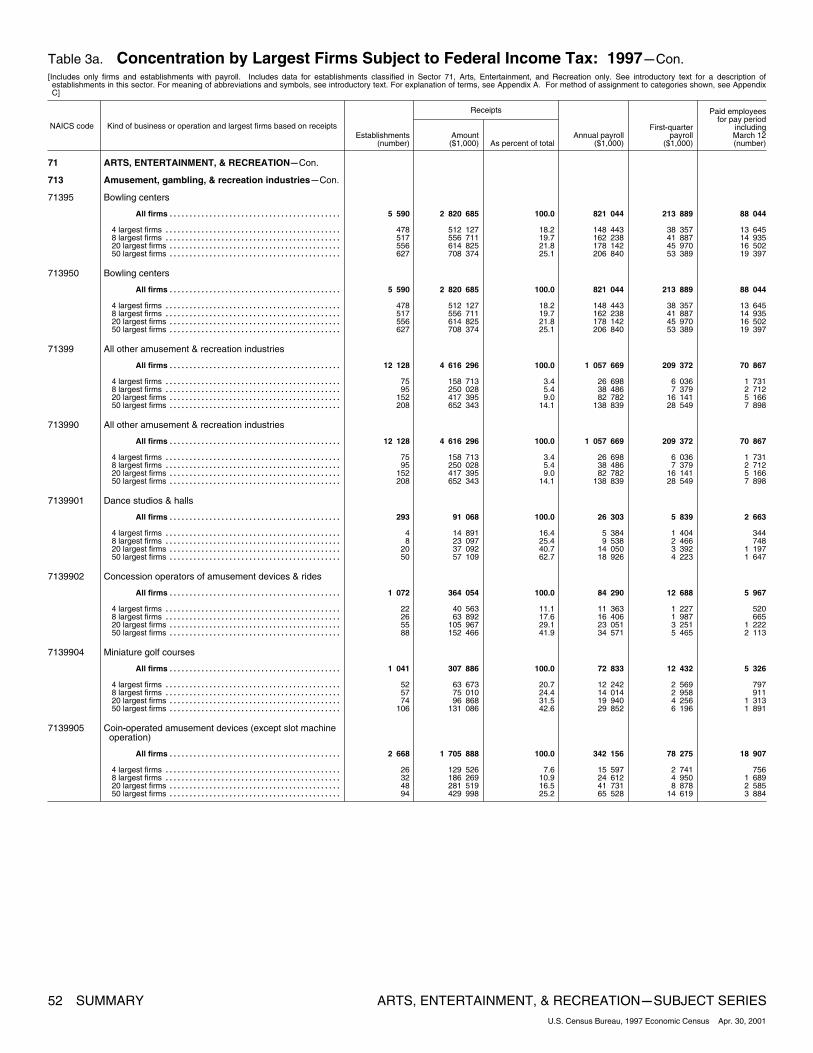
Table 3a. Concentration by Largest Firms Subject to Federal Income Tax: 1997mCon.[Includes only firms and establishments with payroll. Includes data for establishments classified in Sector 71, Arts, Entertainment, and Recreation only. See introductory text for a description ofestablishments in this sector. For meaning of abbreviations and symbols, see introductory text. For explanation of terms, see Appendix A. For method of assignment to categories shown, see AppendixC]
NAICS code Kind of business or operation and largest firms based on receipts
Receipts
Establishments(number)
Amount($1,000) As percent of total
Annual payroll($1,000)
First~quarterpayroll
($1,000)
Paid employeesfor pay period
includingMarch 12(number)
71 ARTS, ENTERTAINMENT, & RECREATIONmCon.
713 Amusement, gambling, & recreation industriesmCon.
71395 Bowling centers
All firms 5 590........................................... 2 820 685 100.0 821 044 213 889 88 044
4 largest firms 478............................................ 512 127 18.2 148 443 38 357 13 6458 largest firms 517............................................ 556 711 19.7 162 238 41 887 14 93520 largest firms 556........................................... 614 825 21.8 178 142 45 970 16 50250 largest firms 627........................................... 708 374 25.1 206 840 53 389 19 397
713950 Bowling centers
All firms 5 590........................................... 2 820 685 100.0 821 044 213 889 88 044
4 largest firms 478............................................ 512 127 18.2 148 443 38 357 13 6458 largest firms 517............................................ 556 711 19.7 162 238 41 887 14 93520 largest firms 556........................................... 614 825 21.8 178 142 45 970 16 50250 largest firms 627........................................... 708 374 25.1 206 840 53 389 19 397
71399 All other amusement & recreation industries
All firms 12 128........................................... 4 616 296 100.0 1 057 669 209 372 70 867
4 largest firms 75............................................ 158 713 3.4 26 698 6 036 1 7318 largest firms 95............................................ 250 028 5.4 38 486 7 379 2 71220 largest firms 152........................................... 417 395 9.0 82 782 16 141 5 16650 largest firms 208........................................... 652 343 14.1 138 839 28 549 7 898
713990 All other amusement & recreation industries
All firms 12 128........................................... 4 616 296 100.0 1 057 669 209 372 70 867
4 largest firms 75............................................ 158 713 3.4 26 698 6 036 1 7318 largest firms 95............................................ 250 028 5.4 38 486 7 379 2 71220 largest firms 152........................................... 417 395 9.0 82 782 16 141 5 16650 largest firms 208........................................... 652 343 14.1 138 839 28 549 7 898
7139901 Dance studios & halls
All firms 293........................................... 91 068 100.0 26 303 5 839 2 663
4 largest firms 4............................................ 14 891 16.4 5 384 1 404 3448 largest firms 8............................................ 23 097 25.4 9 538 2 466 74820 largest firms 20........................................... 37 092 40.7 14 050 3 392 1 19750 largest firms 50........................................... 57 109 62.7 18 926 4 223 1 647
7139902 Concession operators of amusement devices & rides
All firms 1 072........................................... 364 054 100.0 84 290 12 688 5 967
4 largest firms 22............................................ 40 563 11.1 11 363 1 227 5208 largest firms 26............................................ 63 892 17.6 16 406 1 987 66520 largest firms 55........................................... 105 967 29.1 23 051 3 251 1 22250 largest firms 88........................................... 152 466 41.9 34 571 5 465 2 113
7139904 Miniature golf courses
All firms 1 041........................................... 307 886 100.0 72 833 12 432 5 326
4 largest firms 52............................................ 63 673 20.7 12 242 2 569 7978 largest firms 57............................................ 75 010 24.4 14 014 2 958 91120 largest firms 74........................................... 96 868 31.5 19 940 4 256 1 31350 largest firms 106........................................... 131 086 42.6 29 852 6 196 1 891
7139905 Coin~operated amusement devices (except slot machineoperation)
All firms 2 668........................................... 1 705 888 100.0 342 156 78 275 18 907
4 largest firms 26............................................ 129 526 7.6 15 597 2 741 7568 largest firms 32............................................ 186 269 10.9 24 612 4 950 1 68920 largest firms 48........................................... 281 519 16.5 41 731 8 878 2 58550 largest firms 94........................................... 429 998 25.2 65 528 14 619 3 884
52 SUMMARY ARTS, ENTERTAINMENT, & RECREATIONmSUBJECT SERIESU.S. Census Bureau, 1997 Economic Census Apr. 30, 2001

Table 3b. Concentration by Largest Firms Exempt From Federal Income Tax: 1997[Includes only firms and establishments with payroll. Includes data for establishments classified in Sector 71, Arts, Entertainment, and Recreation only. See introductory text for a description ofestablishments in this sector. For meaning of abbreviations and symbols, see introductory text. For explanation of terms, see Appendix A. For method of assignment to categories shown, see AppendixC]
NAICS code Kind of business or operation and largest firms based on revenue
Revenue
Establishments(number)
Amount($1,000) As percent of total
Annual payroll($1,000)
First~quarterpayroll
($1,000)
Paid employeesfor pay period
includingMarch 12(number)
71 ARTS, ENTERTAINMENT, & RECREATIONAll firms 19 463........................................... 19 626 564 100.0 6 683 417 1 466 590 380 287
4 largest firms 5............................................ 775 321 4.0 213 150 51 457 8 0848 largest firms 15............................................ 1 198 613 6.1 321 715 76 239 12 30920 largest firms 29........................................... 1 987 101 10.1 530 637 127 866 18 23850 largest firms 139........................................... 3 153 440 16.1 876 380 211 395 30 695
711 Performing arts, spectator sports, & relatedindustries
All firms 4 624........................................... 4 875 904 100.0 1 621 537 392 820 90 831
4 largest firms 4............................................ 377 883 7.8 179 630 47 662 5 8088 largest firms 8............................................ 576 503 11.8 258 942 64 602 7 08520 largest firms 26........................................... 999 002 20.5 396 947 100 548 11 80050 largest firms 58........................................... 1 607 221 33.0 600 066 148 385 20 162
7111 Performing arts companiesAll firms 3 316........................................... 3 298 514 100.0 1 273 094 312 889 70 201
4 largest firms 4............................................ 348 985 10.6 160 058 41 066 4 9808 largest firms 8............................................ 524 126 15.9 242 780 60 066 7 15520 largest firms 22........................................... 851 135 25.8 372 544 93 097 10 20650 largest firms 55........................................... 1 304 012 39.5 546 771 134 539 17 517
71111 Theater companies & dinner theatersAll firms 1 647........................................... 1 775 964 100.0 630 617 152 172 32 806
4 largest firms 4............................................ 330 323 18.6 155 272 39 363 4 7978 largest firms 8............................................ 423 522 23.8 182 453 46 394 5 62220 largest firms 20........................................... 603 785 34.0 233 283 58 397 8 90950 largest firms 58........................................... 887 973 50.0 330 285 82 892 13 384
711110 Theater companies & dinner theatersAll firms 1 647........................................... 1 775 964 100.0 630 617 152 172 32 806
4 largest firms 4............................................ 330 323 18.6 155 272 39 363 4 7978 largest firms 8............................................ 423 522 23.8 182 453 46 394 5 62220 largest firms 20........................................... 603 785 34.0 233 283 58 397 8 90950 largest firms 58........................................... 887 973 50.0 330 285 82 892 13 384
7111101 Opera companiesAll firms 147........................................... 593 608 100.0 235 218 60 120 9 400
4 largest firms 4............................................ 317 101 53.4 149 619 38 419 4 5178 largest firms 8............................................ 378 817 63.8 169 559 43 022 5 43420 largest firms 24........................................... 477 149 80.4 203 146 51 921 6 98550 largest firms 56........................................... 554 575 93.4 225 652 57 752 8 351
7111102 Theater companiesAll firms 1 500........................................... 1 182 356 100.0 395 399 92 052 23 406
4 largest firms 4............................................ 106 360 9.0 31 547 7 933 1 0108 largest firms 8............................................ 169 251 14.3 50 801 12 523 2 60420 largest firms 22........................................... 317 888 26.9 89 902 22 375 4 86650 largest firms 55........................................... 531 096 44.9 170 979 41 008 8 781
71112 Dance companiesAll firms 371........................................... 323 306 100.0 131 019 32 486 6 821
4 largest firms 5............................................ 72 473 22.4 34 599 7 967 1 3168 largest firms 9............................................ 107 046 33.1 50 260 11 652 1 94620 largest firms 21........................................... 166 872 51.6 74 783 17 591 3 00950 largest firms 52........................................... 238 256 73.7 100 993 24 890 4 410
711120 Dance companiesAll firms 371........................................... 323 306 100.0 131 019 32 486 6 821
4 largest firms 5............................................ 72 473 22.4 34 599 7 967 1 3168 largest firms 9............................................ 107 046 33.1 50 260 11 652 1 94620 largest firms 21........................................... 166 872 51.6 74 783 17 591 3 00950 largest firms 52........................................... 238 256 73.7 100 993 24 890 4 410
71113 Musical groups & artistsAll firms 1 211........................................... 1 154 012 100.0 498 783 125 431 29 768
4 largest firms 4............................................ 193 803 16.8 87 508 20 703 2 3588 largest firms 8............................................ 319 203 27.7 144 723 35 588 3 47120 largest firms 21........................................... 542 154 47.0 250 711 62 138 6 04850 largest firms 52........................................... 735 123 63.7 342 352 85 448 9 697
711130 Musical groups & artists
All firms 1 211........................................... 1 154 012 100.0 498 783 125 431 29 768
4 largest firms 4............................................ 193 803 16.8 87 508 20 703 2 3588 largest firms 8............................................ 319 203 27.7 144 723 35 588 3 47120 largest firms 21........................................... 542 154 47.0 250 711 62 138 6 04850 largest firms 52........................................... 735 123 63.7 342 352 85 448 9 697
7111301 Symphony orchestras & chamber music organizations
All firms 698........................................... 1 038 206 100.0 466 868 118 076 26 975
4 largest firms 4............................................ 193 803 18.7 87 508 20 703 2 3588 largest firms 8............................................ 319 203 30.7 144 723 35 588 3 47120 largest firms 21........................................... 542 154 52.2 250 711 62 138 6 04850 largest firms 52........................................... 735 011 70.8 343 195 85 776 9 904
ARTS, ENTERTAINMENT, & RECREATIONmSUBJECT SERIES SUMMARY 53U.S. Census Bureau, 1997 Economic Census Apr. 30, 2001
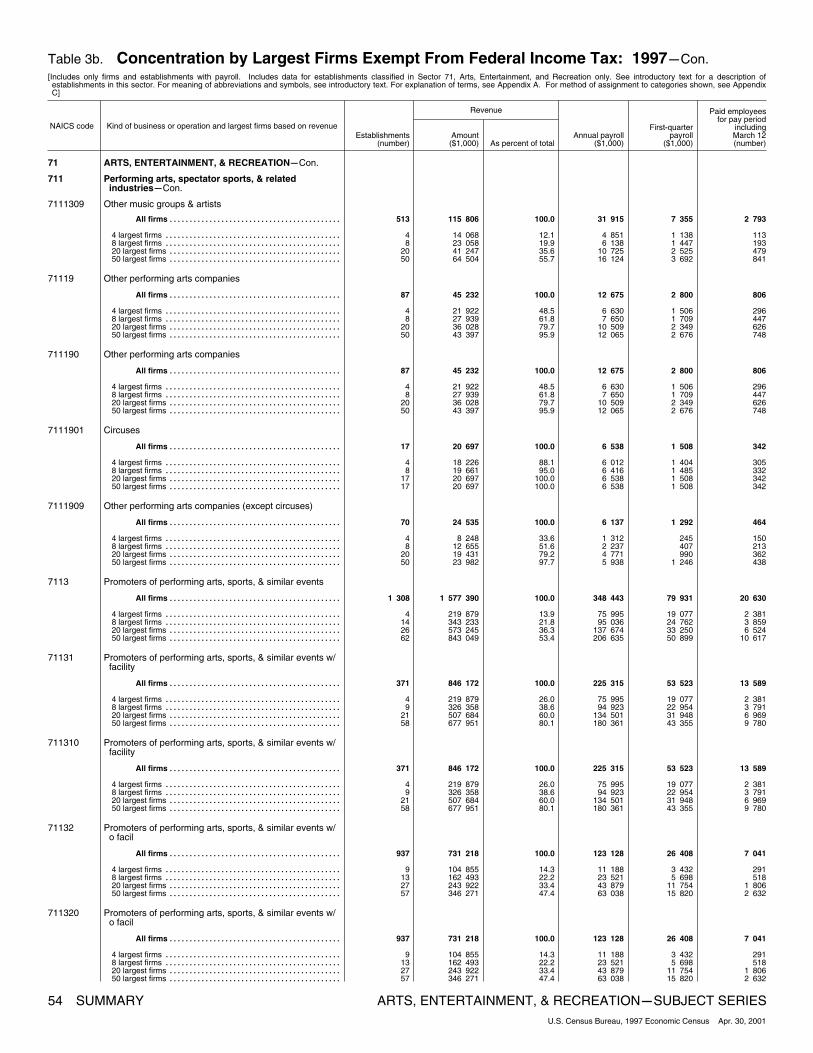
Table 3b. Concentration by Largest Firms Exempt From Federal Income Tax: 1997mCon.[Includes only firms and establishments with payroll. Includes data for establishments classified in Sector 71, Arts, Entertainment, and Recreation only. See introductory text for a description ofestablishments in this sector. For meaning of abbreviations and symbols, see introductory text. For explanation of terms, see Appendix A. For method of assignment to categories shown, see AppendixC]
NAICS code Kind of business or operation and largest firms based on revenue
Revenue
Establishments(number)
Amount($1,000) As percent of total
Annual payroll($1,000)
First~quarterpayroll
($1,000)
Paid employeesfor pay period
includingMarch 12(number)
71 ARTS, ENTERTAINMENT, & RECREATIONmCon.
711 Performing arts, spectator sports, & relatedindustriesmCon.
7111309 Other music groups & artists
All firms 513........................................... 115 806 100.0 31 915 7 355 2 793
4 largest firms 4............................................ 14 068 12.1 4 851 1 138 1138 largest firms 8............................................ 23 058 19.9 6 138 1 447 19320 largest firms 20........................................... 41 247 35.6 10 725 2 525 47950 largest firms 50........................................... 64 504 55.7 16 124 3 692 841
71119 Other performing arts companies
All firms 87........................................... 45 232 100.0 12 675 2 800 806
4 largest firms 4............................................ 21 922 48.5 6 630 1 506 2968 largest firms 8............................................ 27 939 61.8 7 650 1 709 44720 largest firms 20........................................... 36 028 79.7 10 509 2 349 62650 largest firms 50........................................... 43 397 95.9 12 065 2 676 748
711190 Other performing arts companies
All firms 87........................................... 45 232 100.0 12 675 2 800 806
4 largest firms 4............................................ 21 922 48.5 6 630 1 506 2968 largest firms 8............................................ 27 939 61.8 7 650 1 709 44720 largest firms 20........................................... 36 028 79.7 10 509 2 349 62650 largest firms 50........................................... 43 397 95.9 12 065 2 676 748
7111901 Circuses
All firms 17........................................... 20 697 100.0 6 538 1 508 342
4 largest firms 4............................................ 18 226 88.1 6 012 1 404 3058 largest firms 8............................................ 19 661 95.0 6 416 1 485 33220 largest firms 17........................................... 20 697 100.0 6 538 1 508 34250 largest firms 17........................................... 20 697 100.0 6 538 1 508 342
7111909 Other performing arts companies (except circuses)
All firms 70........................................... 24 535 100.0 6 137 1 292 464
4 largest firms 4............................................ 8 248 33.6 1 312 245 1508 largest firms 8............................................ 12 655 51.6 2 237 407 21320 largest firms 20........................................... 19 431 79.2 4 771 990 36250 largest firms 50........................................... 23 982 97.7 5 938 1 246 438
7113 Promoters of performing arts, sports, & similar events
All firms 1 308........................................... 1 577 390 100.0 348 443 79 931 20 630
4 largest firms 4............................................ 219 879 13.9 75 995 19 077 2 3818 largest firms 14............................................ 343 233 21.8 95 036 24 762 3 85920 largest firms 26........................................... 573 245 36.3 137 674 33 250 6 52450 largest firms 62........................................... 843 049 53.4 206 635 50 899 10 617
71131 Promoters of performing arts, sports, & similar events w/facility
All firms 371........................................... 846 172 100.0 225 315 53 523 13 589
4 largest firms 4............................................ 219 879 26.0 75 995 19 077 2 3818 largest firms 9............................................ 326 358 38.6 94 923 22 954 3 79120 largest firms 21........................................... 507 684 60.0 134 501 31 948 6 96950 largest firms 58........................................... 677 951 80.1 180 361 43 355 9 780
711310 Promoters of performing arts, sports, & similar events w/facility
All firms 371........................................... 846 172 100.0 225 315 53 523 13 589
4 largest firms 4............................................ 219 879 26.0 75 995 19 077 2 3818 largest firms 9............................................ 326 358 38.6 94 923 22 954 3 79120 largest firms 21........................................... 507 684 60.0 134 501 31 948 6 96950 largest firms 58........................................... 677 951 80.1 180 361 43 355 9 780
71132 Promoters of performing arts, sports, & similar events w/o facil
All firms 937........................................... 731 218 100.0 123 128 26 408 7 041
4 largest firms 9............................................ 104 855 14.3 11 188 3 432 2918 largest firms 13............................................ 162 493 22.2 23 521 5 698 51820 largest firms 27........................................... 243 922 33.4 43 879 11 754 1 80650 largest firms 57........................................... 346 271 47.4 63 038 15 820 2 632
711320 Promoters of performing arts, sports, & similar events w/o facil
All firms 937........................................... 731 218 100.0 123 128 26 408 7 041
4 largest firms 9............................................ 104 855 14.3 11 188 3 432 2918 largest firms 13............................................ 162 493 22.2 23 521 5 698 51820 largest firms 27........................................... 243 922 33.4 43 879 11 754 1 80650 largest firms 57........................................... 346 271 47.4 63 038 15 820 2 632
54 SUMMARY ARTS, ENTERTAINMENT, & RECREATIONmSUBJECT SERIESU.S. Census Bureau, 1997 Economic Census Apr. 30, 2001
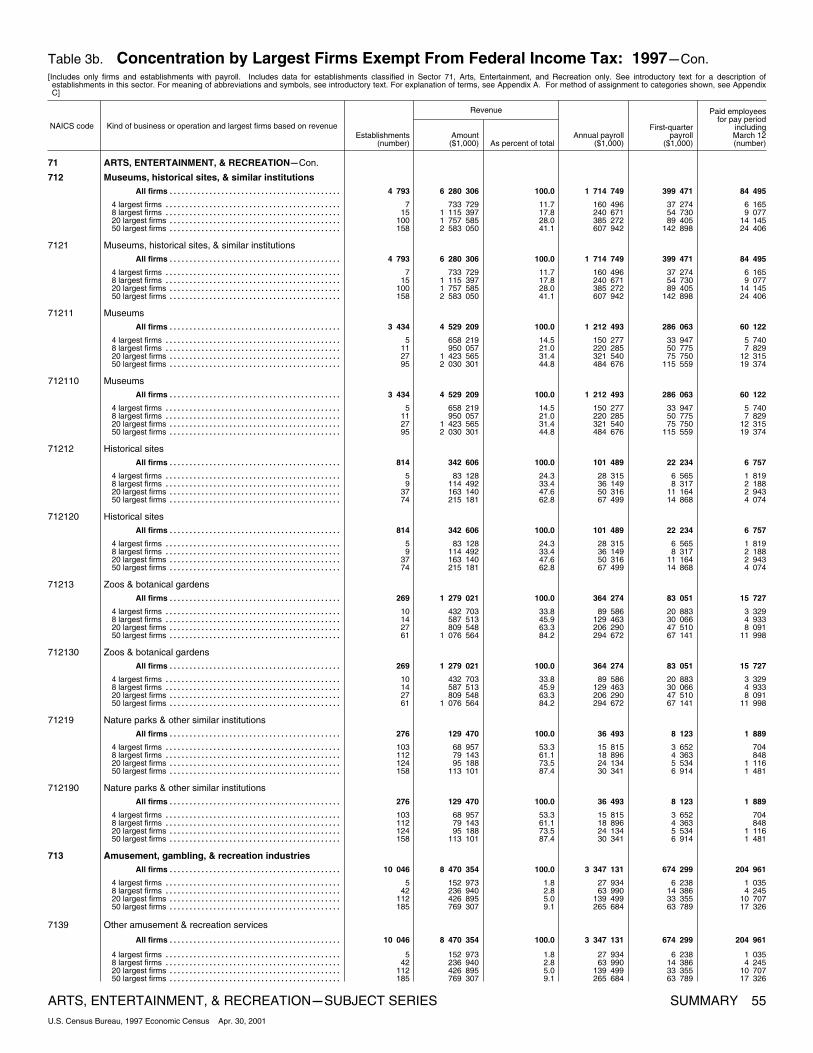
Table 3b. Concentration by Largest Firms Exempt From Federal Income Tax: 1997mCon.[Includes only firms and establishments with payroll. Includes data for establishments classified in Sector 71, Arts, Entertainment, and Recreation only. See introductory text for a description ofestablishments in this sector. For meaning of abbreviations and symbols, see introductory text. For explanation of terms, see Appendix A. For method of assignment to categories shown, see AppendixC]
NAICS code Kind of business or operation and largest firms based on revenue
Revenue
Establishments(number)
Amount($1,000) As percent of total
Annual payroll($1,000)
First~quarterpayroll
($1,000)
Paid employeesfor pay period
includingMarch 12(number)
71 ARTS, ENTERTAINMENT, & RECREATIONmCon.
712 Museums, historical sites, & similar institutionsAll firms 4 793........................................... 6 280 306 100.0 1 714 749 399 471 84 495
4 largest firms 7............................................ 733 729 11.7 160 496 37 274 6 1658 largest firms 15............................................ 1 115 397 17.8 240 671 54 730 9 07720 largest firms 100........................................... 1 757 585 28.0 385 272 89 405 14 14550 largest firms 158........................................... 2 583 050 41.1 607 942 142 898 24 406
7121 Museums, historical sites, & similar institutionsAll firms 4 793........................................... 6 280 306 100.0 1 714 749 399 471 84 495
4 largest firms 7............................................ 733 729 11.7 160 496 37 274 6 1658 largest firms 15............................................ 1 115 397 17.8 240 671 54 730 9 07720 largest firms 100........................................... 1 757 585 28.0 385 272 89 405 14 14550 largest firms 158........................................... 2 583 050 41.1 607 942 142 898 24 406
71211 MuseumsAll firms 3 434........................................... 4 529 209 100.0 1 212 493 286 063 60 122
4 largest firms 5............................................ 658 219 14.5 150 277 33 947 5 7408 largest firms 11............................................ 950 057 21.0 220 285 50 775 7 82920 largest firms 27........................................... 1 423 565 31.4 321 540 75 750 12 31550 largest firms 95........................................... 2 030 301 44.8 484 676 115 559 19 374
712110 MuseumsAll firms 3 434........................................... 4 529 209 100.0 1 212 493 286 063 60 122
4 largest firms 5............................................ 658 219 14.5 150 277 33 947 5 7408 largest firms 11............................................ 950 057 21.0 220 285 50 775 7 82920 largest firms 27........................................... 1 423 565 31.4 321 540 75 750 12 31550 largest firms 95........................................... 2 030 301 44.8 484 676 115 559 19 374
71212 Historical sitesAll firms 814........................................... 342 606 100.0 101 489 22 234 6 757
4 largest firms 5............................................ 83 128 24.3 28 315 6 565 1 8198 largest firms 9............................................ 114 492 33.4 36 149 8 317 2 18820 largest firms 37........................................... 163 140 47.6 50 316 11 164 2 94350 largest firms 74........................................... 215 181 62.8 67 499 14 868 4 074
712120 Historical sitesAll firms 814........................................... 342 606 100.0 101 489 22 234 6 757
4 largest firms 5............................................ 83 128 24.3 28 315 6 565 1 8198 largest firms 9............................................ 114 492 33.4 36 149 8 317 2 18820 largest firms 37........................................... 163 140 47.6 50 316 11 164 2 94350 largest firms 74........................................... 215 181 62.8 67 499 14 868 4 074
71213 Zoos & botanical gardensAll firms 269........................................... 1 279 021 100.0 364 274 83 051 15 727
4 largest firms 10............................................ 432 703 33.8 89 586 20 883 3 3298 largest firms 14............................................ 587 513 45.9 129 463 30 066 4 93320 largest firms 27........................................... 809 548 63.3 206 290 47 510 8 09150 largest firms 61........................................... 1 076 564 84.2 294 672 67 141 11 998
712130 Zoos & botanical gardensAll firms 269........................................... 1 279 021 100.0 364 274 83 051 15 727
4 largest firms 10............................................ 432 703 33.8 89 586 20 883 3 3298 largest firms 14............................................ 587 513 45.9 129 463 30 066 4 93320 largest firms 27........................................... 809 548 63.3 206 290 47 510 8 09150 largest firms 61........................................... 1 076 564 84.2 294 672 67 141 11 998
71219 Nature parks & other similar institutionsAll firms 276........................................... 129 470 100.0 36 493 8 123 1 889
4 largest firms 103............................................ 68 957 53.3 15 815 3 652 7048 largest firms 112............................................ 79 143 61.1 18 896 4 363 84820 largest firms 124........................................... 95 188 73.5 24 134 5 534 1 11650 largest firms 158........................................... 113 101 87.4 30 341 6 914 1 481
712190 Nature parks & other similar institutionsAll firms 276........................................... 129 470 100.0 36 493 8 123 1 889
4 largest firms 103............................................ 68 957 53.3 15 815 3 652 7048 largest firms 112............................................ 79 143 61.1 18 896 4 363 84820 largest firms 124........................................... 95 188 73.5 24 134 5 534 1 11650 largest firms 158........................................... 113 101 87.4 30 341 6 914 1 481
713 Amusement, gambling, & recreation industriesAll firms 10 046........................................... 8 470 354 100.0 3 347 131 674 299 204 961
4 largest firms 5............................................ 152 973 1.8 27 934 6 238 1 0358 largest firms 42............................................ 236 940 2.8 63 990 14 386 4 24520 largest firms 112........................................... 426 895 5.0 139 499 33 355 10 70750 largest firms 185........................................... 769 307 9.1 265 684 63 789 17 326
7139 Other amusement & recreation services
All firms 10 046........................................... 8 470 354 100.0 3 347 131 674 299 204 961
4 largest firms 5............................................ 152 973 1.8 27 934 6 238 1 0358 largest firms 42............................................ 236 940 2.8 63 990 14 386 4 24520 largest firms 112........................................... 426 895 5.0 139 499 33 355 10 70750 largest firms 185........................................... 769 307 9.1 265 684 63 789 17 326
ARTS, ENTERTAINMENT, & RECREATIONmSUBJECT SERIES SUMMARY 55U.S. Census Bureau, 1997 Economic Census Apr. 30, 2001

Table 3b. Concentration by Largest Firms Exempt From Federal Income Tax: 1997mCon.[Includes only firms and establishments with payroll. Includes data for establishments classified in Sector 71, Arts, Entertainment, and Recreation only. See introductory text for a description ofestablishments in this sector. For meaning of abbreviations and symbols, see introductory text. For explanation of terms, see Appendix A. For method of assignment to categories shown, see AppendixC]
NAICS code Kind of business or operation and largest firms based on revenue
Revenue
Establishments(number)
Amount($1,000) As percent of total
Annual payroll($1,000)
First~quarterpayroll
($1,000)
Paid employeesfor pay period
includingMarch 12(number)
71 ARTS, ENTERTAINMENT, & RECREATIONmCon.
713 Amusement, gambling, & recreation industriesmCon.
71391 Golf courses & country clubs
All firms 3 212........................................... 5 582 855 100.0 2 291 482 455 103 115 960
4 largest firms 6............................................ 73 938 1.3 28 489 6 452 1 3348 largest firms 20............................................ 128 516 2.3 51 928 13 222 2 74020 largest firms 33........................................... 261 112 4.7 108 545 26 981 5 39450 largest firms 66........................................... 512 868 9.2 206 971 48 239 9 847
713910 Golf courses & country clubs
All firms 3 212........................................... 5 582 855 100.0 2 291 482 455 103 115 960
4 largest firms 6............................................ 73 938 1.3 28 489 6 452 1 3348 largest firms 20............................................ 128 516 2.3 51 928 13 222 2 74020 largest firms 33........................................... 261 112 4.7 108 545 26 981 5 39450 largest firms 66........................................... 512 868 9.2 206 971 48 239 9 847
71394 Fitness & recreational sports centers
All firms 4 679........................................... 2 217 294 100.0 858 762 178 147 75 706
4 largest firms 15............................................ 151 208 6.8 28 558 6 034 1 3248 largest firms 45............................................ 224 082 10.1 55 644 12 887 4 43920 largest firms 99........................................... 382 848 17.3 116 967 27 435 9 59750 largest firms 224........................................... 591 863 26.7 200 612 46 455 16 554
713940 Fitness & recreational sports centers
All firms 4 679........................................... 2 217 294 100.0 858 762 178 147 75 706
4 largest firms 15............................................ 151 208 6.8 28 558 6 034 1 3248 largest firms 45............................................ 224 082 10.1 55 644 12 887 4 43920 largest firms 99........................................... 382 848 17.3 116 967 27 435 9 59750 largest firms 224........................................... 591 863 26.7 200 612 46 455 16 554
71399 All other amusement & recreation industries
All firms 2 155........................................... 670 205 100.0 196 887 41 049 13 295
4 largest firms 4............................................ 50 439 7.5 12 147 2 745 4358 largest firms 20............................................ 77 321 11.5 19 704 4 419 68920 largest firms 35........................................... 125 921 18.8 38 234 8 410 1 49150 largest firms 89........................................... 209 710 31.3 68 305 15 213 3 082
713990 All other amusement & recreation industries
All firms 2 155........................................... 670 205 100.0 196 887 41 049 13 295
4 largest firms 4............................................ 50 439 7.5 12 147 2 745 4358 largest firms 20............................................ 77 321 11.5 19 704 4 419 68920 largest firms 35........................................... 125 921 18.8 38 234 8 410 1 49150 largest firms 89........................................... 209 710 31.3 68 305 15 213 3 082
56 SUMMARY ARTS, ENTERTAINMENT, & RECREATIONmSUBJECT SERIESU.S. Census Bureau, 1997 Economic Census Apr. 30, 2001

Appendix A.Explanation of Terms
ANNUAL PAYROLL
Payroll includes all forms of compensation, such assalaries, wages, commissions, dismissal pay, bonuses,vacation allowances, sick-leave pay, and employee contri-butions to qualified pension plans paid during the year toall employees. Also included are tips and gratuitiesreceived by employees from patrons and reported toemployers and the value of payments in kind (e.g., freemeals and lodging). If an employee works at more thanone location, the payroll is included in the one locationwhere they spend most of their time. Also included aresalaries of professional service organizations or associa-tions which operate under state professional corporationstatutes and file a corporate Federal income tax return.Excluded are payrolls of departments or concessions oper-ated by other companies at the establishment. For corpo-rations, payroll includes amounts paid to officers andexecutives; for unincorporated businesses, it does notinclude profit or other compensation of proprietors orpartners. Payroll is reported before deductions for socialsecurity, income tax, insurance, union dues, etc. This defi-nition of payroll is the same as that used by the InternalRevenue Service (IRS) on Form 941.
EXPENSES ($1,000)
Includes program service grants, specified assistance toindividuals, benefits paid to or for members, payroll,employee benefits, payroll taxes, interest and rentexpenses, cost of supplies used for operation, cost of mer-chandise sold, depreciation expenses, fundraisingexpenses, contracted or purchased services, and otherexpenses charged to operations during 1997. Expensesexclude outlays for the purchase of real estate; construc-tion and all other capital improvements; funds invested;assessments or dues paid to the parent or other chaptersof the same organization; incomes taxes; sales and othertaxes collected directly from customers or clients and paiddirectly to a local, state, or Federal tax agency; and, forfundraising organizations, funds transferred to charitiesand other organizations.
FIRST-QUARTER PAYROLL ($1,000)
Represents payroll paid to persons employed at anytime during the quarter January to March 1997.
NUMBER OF ESTABLISHMENTS
An establishment is a single physical location at whichbusiness is conducted and/or services are provided. It isnot necessarily identical with a company or enterprise,
which may consist of one establishment or more. Eco-nomic census figures represent a summary of reports forindividual establishments rather than companies. Forcases where a census report was received, separate infor-mation was obtained for each location where businesswas conducted. When administrative records of other Fed-eral agencies were used instead of a census report, noinformation was available on the number of locationsoperated. Each economic census establishment was tabu-lated according to the physical location at which the busi-ness was conducted. The count of establishments repre-sents those in business at any time during 1997.
When two activities or more were carried on at a singlelocation under a single ownership, all activities generallywere grouped together as a single establishment. Theentire establishment was classified on the basis of itsmajor activity and all data for it were included in that clas-sification. However, when distinct and separate economicactivities (for which different industry classification codeswere appropriate) were conducted at a single locationunder a single ownership, separate establishment reportsfor each of the different activities were obtained in thecensus. An establishment is included in the census if it isan employer, the establishment has $1,000 in payroll, andwas in operation at any time during 1997. Leased servicedepartments (separately owned businesses operated asdepartments or concessions of other service establish-ments or of retail businesses, such as a separately ownedshoeshine parlor in a barber shop, or a beauty shop in adepartment store) are treated as separate service estab-lishments for census purposes. Leased retail departmentslocated in service establishments (e.g., a gift shop locatedin a hotel) are considered separate retail establishments.
NUMBER OF PAID EMPLOYEES FOR PAY PERIODINCLUDING MARCH 12
Paid employees consists of full-time and part-timeemployees, including salaried officers and executives ofcorporations, who were on the payroll during the payperiod including March 12. Included are employees onpaid sick leave, paid holidays, and paid vacations; andmembers of a professional service organization or associa-tion which operates under state professional corporationstatutes and files a corporate Federal income tax return.Not included are proprietors and partners of unincorpo-rated businesses, and employees of departments or con-cessions operated by other companies at the establish-ment. The definition of paid employees is the same as thatused on IRS Form 941.
APPENDIX A A–1ARTS, ENTERTAINMENT, & RECREATION
U.S. Census Bureau, 1997 Economic Census

RECEIPTS/REVENUE ($1,000)
Receipts (basic dollar volume measure for service estab-lishments of firms subject to Federal income tax). Includesreceipts from customers or clients for services rendered,from the use of facilities, and from merchandise sold dur-ing 1997 whether or not payment was received in 1997.For advertising agencies, travel industries, and other ser-vice establishments operating on a commission basis,receipts include commissions, fees, and other operatingincome, NOT gross billings and sales. Excise taxes ongasoline, liquor, tobacco, etc., which are paid by themanufacturer or wholesaler and passed on in the cost ofgoods purchased by the service establishment, are alsoincluded. The establishments share of receipts fromdepartments, concessions, and vending and amusementmachines operated by others are included as part ofreceipts. Receipts also include the total value of servicecontracts, market value of compensation received in lieuof cash, amounts received for work subcontracted to oth-ers, and dues and assessments from members and affili-ates. Receipts from services provided to foreign customersfrom U.S. locations, including services preformed for for-eign parent firms, subsidiaries, and branches are included.
Receipts are net after deductions for refunds and allow-ances for merchandise returned by customers. Receipts donot include sales, occupancy, admissions, or other taxescollected from customers and remitted directly by the firmto a local, state, or Federal tax agency, nor do they includeincome from such sources as contributions, gifts, andgrants; dividends, interest, and investments; or sale orrental of real estate. Also excluded are receipts (gross) ofdepartments and concessions which are operated by oth-ers; sales of used equipment rented or leased to custom-ers; domestic intracompany transfers; receipts of foreign
subsidiaries; and other nonoperating income, such as roy-alties, franchise fees, etc. Receipts do not include servicereceipts of manufacturers, wholesalers, retail establish-ments, or other businesses whose primary activity is otherthan service. They do, however, include receipts otherthan from services rendered (e.g., sale of merchandise toindividuals or other businesses) by establishments prima-rily engaged in performing services and classified in theservice industries.
Revenue (basic dollar volume measure for firms exemptfrom Federal income tax). Includes revenue from custom-ers or clients for services rendered and merchandise soldduring 1997, whether or not payment was received in1997, and gross sales of merchandise, minus returns andallowances. Also included are income from interest, divi-dends, gross rents (including display space rentals andshare of receipts from departments operated by othercompanies), gross contributions, gifts, grants (whether ornot restricted for use in operations), royalties, dues andassessments from members and affiliates, commissionsearned from the sale of merchandise owned by others(including commissions from vending machine operators),and gross receipts from fundraising activities. Receiptsfrom taxable business activities of firms exempt from Fed-eral income tax (unrelated business income) are alsoincluded in revenue.
Revenue does not include sales, admissions, or othertaxes collected by the organization from customers or cli-ents and paid directly to a local, state, or Federal taxagency; income from the sale of real estate, investments,or other assets (except inventory held for resale); grossreceipts of departments, concessions, etc., that are oper-ated by others; and amounts transferred to operatingfunds from capital or reserve funds.
A–2 APPENDIX A ARTS, ENTERTAINMENT, & RECREATION
U.S. Census Bureau, 1997 Economic Census

Appendix B.NAICS Codes, Titles, and Descriptions
71 ARTS, ENTERTAINMENT, AND RECREATION
The Arts, Entertainment, and Recreation sector includesa wide range of establishments that operate facilities orprovide services to meet varied cultural, entertainment,and recreational interests of their patrons. This sectorcomprises (1) establishments that are involved in produc-ing, promoting, or participating in live performances,events, or exhibits intended for public viewing; (2) estab-lishments that preserve and exhibit objects and sites ofhistorical, cultural, or educational interest; and (3) estab-lishments that operate facilities or provide services thatenable patrons to participate in recreational activities orpursue amusement, hobby, and leisure time interests.
Some establishments that provide cultural, entertain-ment, or recreational facilities and services are classifiedin other sectors. Excluded from this sector are: (1) estab-lishments that provide both accommodations and recre-ational facilities, such as hunting and fishing camps andresort and casino hotels are classified in Subsector 721,Accommodation; (2) restaurants and night clubs that pro-vide live entertainment in addition to the sale of food andbeverages are classified in Subsector 722, Food Servicesand Drinking Places; (3) motion picture theaters, librariesand archives, and publishers of newspapers, magazines,books, periodicals, and computer software are classified inSector 51, Information; and (4) establishments using trans-portation equipment to provide recreational and entertain-ment services, such as those operating sightseeing buses,dinner cruises, or helicopter rides are classified in Subsec-tor 487, Scenic and Sightseeing Transportation.
711 Performing Arts, Spectator Sports, andRelated Industries
Industries in the Performing Arts, Spectator Sports, andRelated Industries subsector group establishments thatproduce or organize and promote live presentationsinvolving the performances of actors and actresses, sing-ers, dancers, musical groups and artists, athletes, andother entertainers, including independent (i.e., freelance)entertainers and the establishments that manage theircareers. The classification recognizes four basic processes:(1) producing (i.e., presenting) events; (2) organizing,managing, and/or promoting events; (3) managing andrepresenting entertainers; and (4) providing the artistic,creative and technical skills necessary to the production of
these live events. Also, this subsector contains four indus-tries for performing arts companies. Each is defined on thebasis of the particular skills of the entertainers involved inthe presentations.
The industry structure for this subsector makes a cleardistinction between performing arts companies and per-forming artists (i.e., independent or freelance). Althoughnot unique to arts and entertainment, freelancing is a par-ticularly important phenomenon in this Performing Arts,Spectator Sports, and Related Industries subsector. Distin-guishing this activity from the production activity is ameaningful process differentiation. This approach, how-ever, is difficult to implement in the case of musicalgroups (i.e., companies) and artists, especially popgroups. These establishments tend to be more looselyorganized and it can be difficult to distinguish companiesfrom freelancers. For this reason, NAICS includes oneindustry that covers both musical groups and musical art-ists.
This subsector contains two industries for IndustryGroup 7113, Promoters of Performing Arts, Sports, andSimilar Events, one for those that operate facilities andanother for those that do not. This is because there aresignificant differences in cost structures between thosepromoters that manage and provide the staff to operatefacilities and those that do not. In addition to promoterswithout facilities other industries in this subsector includeestablishments that may operate without permanent facili-ties. These types of establishments include: performingarts companies, musical groups and artists, spectatorsports, and independent (i.e., freelance) artists, writers,and performers.
Excluded from this subsector are nightclubs. Somenightclubs promote live entertainment on a regular basisand it can be argued that they could be classified in Indus-try Group 7113, Promoters of Performing Arts, Sports, andSimilar Events with Facilities. However, since most of theseestablishments function as any other drinking place whenthey do not promote entertainment and because most oftheir revenue is derived from sale of food and beverages,they are classified in Subsector 722, Food Services andDrinking Places.
7111 Performing Arts Companies
This industry group comprises establishments primarilyengaged in producing live presentations involving the per-formances of actors and actresses, singers, dancers, musi-cal groups and artists, and other performing artists.
APPENDIX B B–1ARTS, ENTERTAINMENT, & RECREATION
U.S. Census Bureau, 1997 Economic Census

71111 Theater Companies and Dinner Theaters
This industry comprises (1) companies, groups, or the-aters primarily engaged in producing the following livetheatrical presentations: musicals; operas; plays; and com-edy, improvisational, mime, and puppet shows and (2)establishments, commonly known as dinner theaters,engaged in producing live theatrical productions and inproviding food and beverages for consumption on the pre-mises. Theater groups or companies may or may not oper-ate their own theater or other facility for staging theirshows.
711110 Theater Companies and Dinner Theaters
This industry comprises (1) companies, groups, or the-aters primarily engaged in producing the following livetheatrical presentations: musicals; operas; plays; and com-edy, improvisational, mime, and puppet shows and (2)establishments, commonly known as dinner theaters,engaged in producing live theatrical productions and inproviding food and beverages for consumption on the pre-mises. Theater groups or companies may or may not oper-ate their own theater or other facility for staging theirshows.
The data published with NAICS code 711110 are com-prised of these parts of the following SIC industries:
5812 (pt) Dinner Theaters
7922 (pt) Opera Companies
7922 (pt) Theater Companies
7111101 Opera Companies
Establishments primarily engaged in producing operas.
7111102 Theater Companies
Establishments primarily engaged in producing live the-atrical presentations, such as musicals, plays, and puppetand mime shows. Theater groups or companies may ormay not operate their own theater or other facility forstaging their shows.
7111103 Dinner Theaters
Establishments primarily engaged in producing livetheoretical productions and in providing food and bever-ages for consumption on the premises.
71112 Dance Companies
This industry comprises companies, groups, or theatersprimarily engaged in producing all types of live theatricaldance (e.g., ballet, contemporary dance, folk dance) pre-sentations. Dance companies or groups may or may notoperate their own theater or other facility for staging theirshows.
711120 Dance Companies
This industry comprises companies, groups, or theatersprimarily engaged in producing all types of live theatricaldance (e.g., ballet, contemporary dance, folk dance) pre-sentations. Dance companies or groups may or may notoperate their own theater or other facility for staging theirshows.
The data published with NAICS code 711120 are com-prised of this part of the following SIC industry:
7922 (pt) Dance Companies
71113 Musical Groups and Artists
This industry comprises (1) groups primarily engagedin producing live musical entertainment (except theatricalmusical or opera productions) and (2) independent (i.e.,freelance) artists primarily engaged in providing live musi-cal entertainment. Musical groups and artists may performin front of a live audience or in a studio, and may or maynot operate their own facilities for staging their shows.
711130 Musical Groups and Artists
This industry comprises (1) groups primarily engagedin producing live musical entertainment (except theatricalmusical or opera productions) and (2) independent (i.e.,freelance) artists primarily engaged in providing live musi-cal entertainment. Musical groups and artists may performin front of a live audience or in a studio, and may or maynot operate their own facilities for staging their shows.
The data published with NAICS code 711130 are com-prised of these parts of the following SIC industries:
7929 (pt) Symphony Orchestras and Chamber MusicOrganizations
7929 (pt) Other Music Groups and Artists
7111301 Symphony Orchestras and ChamberMusic Organizations
Establishments primarily engaged in operating sym-phony orchestra and chamber music organizations. Theseestablishments may or may not operate their own facilitiesfor staging their shows. These establishments are orga-nized to present their musical specialty.
7111309 Other Music Groups and Artists
Establishments primarily engaged in providing musicalentertainment (except operas, musical theater, symphonyorchestras, and chamber music organizations). Musicalgroups and artists may or may not operate their ownfacilities for staging their shows. This industry alsoincludes independent or freelance musicians and vocalists.
71119 Other Performing Arts Companies
This industry comprises companies or groups (excepttheater companies, dance companies, musical groups, andartists) primarily engaged in producing live theatrical pre-sentations.
B–2 APPENDIX B ARTS, ENTERTAINMENT, & RECREATION
U.S. Census Bureau, 1997 Economic Census

711190 Other Performing Arts Companies
This industry comprises companies or groups (excepttheater companies, dance companies, musical groups, andartists) primarily engaged in producing live theatrical pre-sentations.
The data published with NAICS code 711190 are com-prised of these parts of the following SIC industries:
7929 (pt) Other Performing Arts Companies (Such AsIce Skating or Magic Shows)
7999 (pt) Circuses and Traveling Carnival Companies
7111901 Circuses
Establishments primarily engaged in the operation ofcircuses having acrobatic and/or animal shows and indi-vidual circus acts. Side shows are included here.
7111909 Other Performing Art Companies (ExceptCircuses)
Establishments primarily engaged in producing live per-forming arts presentations (except theater companies,dance companies, and musical groups and artists).
7112 Spectator Sports
This industry comprises (1) sports teams or clubs pri-marily participating in live sporting events before a payingaudience; (2) establishments primarily engaged in operat-ing racetracks; (3) independent athletes engaged in par-ticipating in live sporting or racing events before a payingaudience; (4) owners of racing participants, such as cars,dogs, and horses, primarily engaged in entering them inracing events or other spectator sports events; and (5)establishments, such as sports trainers, primarily engagedin providing specialized services to support participants insports events or competitions. The sports teams and clubsincluded in this industry may or may not operate theirown arena, stadium, or other facility for presenting theirgames or other spectator sports events.
71121 Spectator Sports
This industry comprises (1) sports teams or clubs pri-marily participating in live sporting events before a payingaudience; (2) establishments primarily engaged in operat-ing racetracks; (3) independent athletes engaged in par-ticipating in live sporting or racing events before a payingaudience; (4) owners of racing participants, such as cars,dogs, and horses, primarily engaged in entering them inracing events or other spectator sports events; and (5)establishments, such as sports trainers, primarily engagedin providing specialized services to support participants insports events or competitions. The sports teams and clubsincluded in this industry may or may not operate theirown arena, stadium, or other facility for presenting theirgames or other spectator sports events.
711211 Sports Teams and Clubs
This U.S. industry comprises professional or semipro-fessional sports teams or clubs primarily engaged in par-ticipating in live sporting events, such as baseball, basket-ball, football, hockey, soccer, and jai alai games, before apaying audience. These establishments may or may notoperate their own arena, stadium, or other facility for pre-senting these events.
The data published with NAICS code 711211 are com-prised of these parts of the following SIC industries:
7941 (pt) Baseball Clubs
7941 (pt) Football Clubs
7941 (pt) Other Professional Sports Clubs
7112111 Football Clubs
Establishments primarily engaged in operating profes-sional or semiprofessional football clubs.
7112112 Baseball Clubs
Establishments primarily engaged in operating profes-sional or semiprofessional baseball clubs.
7112119 Other Professional Sports Clubs
Establishments primarily engaged in operating profes-sional or semiprofessional sports clubs (except baseballclubs and football clubs).
711212 Racetracks
This U.S. industry comprises establishments primarilyengaged in operating racetracks. These establishmentsmay also present and /or promote the events, such asauto, dog, and horse races, held in these facilities.
The data published with NAICS code 711212 are com-prised of these parts of the following SIC industries:
7948 (pt) Auto Racetrack Operation
7948 (pt) Dog Racetrack Operation
7948 (pt) Horse Racetrack Operation
7112121 Dog Racetrack Operation
Establishments primarily engaged in operating dogracetracks and promoting dog racing.
7112122 Auto Racetrack Operation
Establishments primarily engaged in operating autoracetracks. These establishments may also present and/orpromote events.
7112123 Horse Racetrack Operation
Establishments primarily engaged in operating horseracetracks. These establishments also present and or pro-mote events.
APPENDIX B B–3ARTS, ENTERTAINMENT, & RECREATION
U.S. Census Bureau, 1997 Economic Census
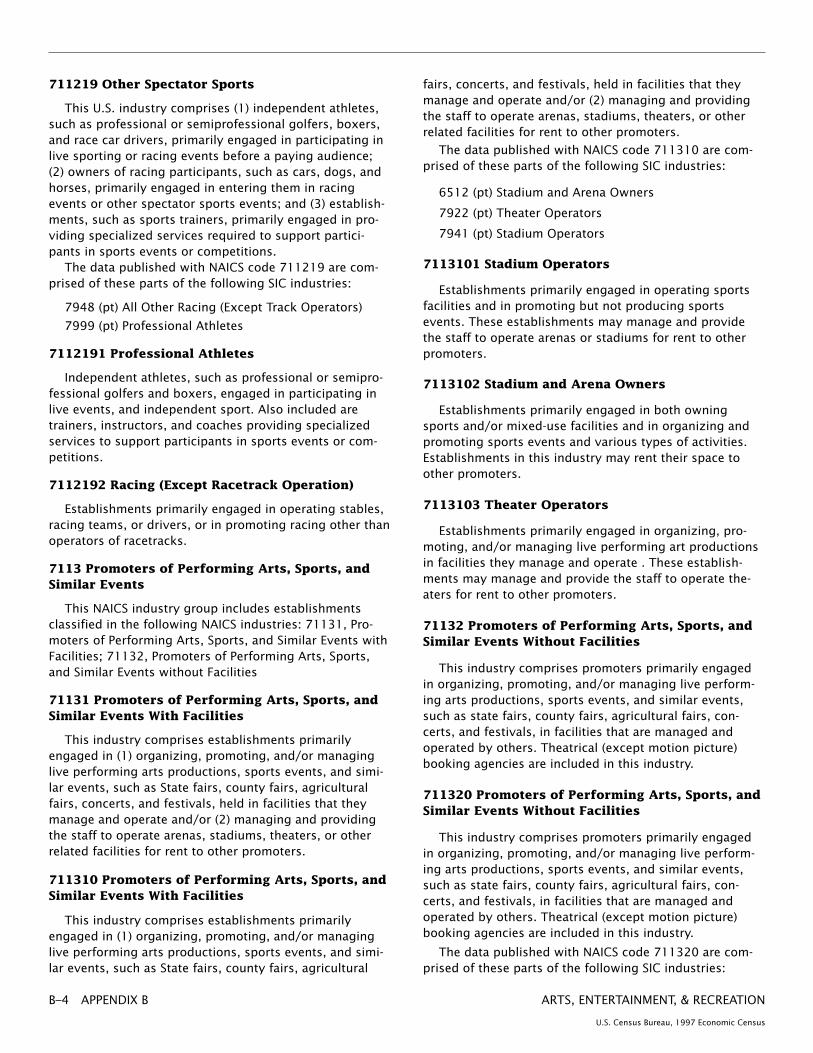
711219 Other Spectator Sports
This U.S. industry comprises (1) independent athletes,such as professional or semiprofessional golfers, boxers,and race car drivers, primarily engaged in participating inlive sporting or racing events before a paying audience;(2) owners of racing participants, such as cars, dogs, andhorses, primarily engaged in entering them in racingevents or other spectator sports events; and (3) establish-ments, such as sports trainers, primarily engaged in pro-viding specialized services required to support partici-pants in sports events or competitions.
The data published with NAICS code 711219 are com-prised of these parts of the following SIC industries:
7948 (pt) All Other Racing (Except Track Operators)
7999 (pt) Professional Athletes
7112191 Professional Athletes
Independent athletes, such as professional or semipro-fessional golfers and boxers, engaged in participating inlive events, and independent sport. Also included aretrainers, instructors, and coaches providing specializedservices to support participants in sports events or com-petitions.
7112192 Racing (Except Racetrack Operation)
Establishments primarily engaged in operating stables,racing teams, or drivers, or in promoting racing other thanoperators of racetracks.
7113 Promoters of Performing Arts, Sports, andSimilar Events
This NAICS industry group includes establishmentsclassified in the following NAICS industries: 71131, Pro-moters of Performing Arts, Sports, and Similar Events withFacilities; 71132, Promoters of Performing Arts, Sports,and Similar Events without Facilities
71131 Promoters of Performing Arts, Sports, andSimilar Events With Facilities
This industry comprises establishments primarilyengaged in (1) organizing, promoting, and/or managinglive performing arts productions, sports events, and simi-lar events, such as State fairs, county fairs, agriculturalfairs, concerts, and festivals, held in facilities that theymanage and operate and/or (2) managing and providingthe staff to operate arenas, stadiums, theaters, or otherrelated facilities for rent to other promoters.
711310 Promoters of Performing Arts, Sports, andSimilar Events With Facilities
This industry comprises establishments primarilyengaged in (1) organizing, promoting, and/or managinglive performing arts productions, sports events, and simi-lar events, such as State fairs, county fairs, agricultural
fairs, concerts, and festivals, held in facilities that theymanage and operate and/or (2) managing and providingthe staff to operate arenas, stadiums, theaters, or otherrelated facilities for rent to other promoters.
The data published with NAICS code 711310 are com-prised of these parts of the following SIC industries:
6512 (pt) Stadium and Arena Owners
7922 (pt) Theater Operators
7941 (pt) Stadium Operators
7113101 Stadium Operators
Establishments primarily engaged in operating sportsfacilities and in promoting but not producing sportsevents. These establishments may manage and providethe staff to operate arenas or stadiums for rent to otherpromoters.
7113102 Stadium and Arena Owners
Establishments primarily engaged in both owningsports and/or mixed-use facilities and in organizing andpromoting sports events and various types of activities.Establishments in this industry may rent their space toother promoters.
7113103 Theater Operators
Establishments primarily engaged in organizing, pro-moting, and/or managing live performing art productionsin facilities they manage and operate . These establish-ments may manage and provide the staff to operate the-aters for rent to other promoters.
71132 Promoters of Performing Arts, Sports, andSimilar Events Without Facilities
This industry comprises promoters primarily engagedin organizing, promoting, and/or managing live perform-ing arts productions, sports events, and similar events,such as state fairs, county fairs, agricultural fairs, con-certs, and festivals, in facilities that are managed andoperated by others. Theatrical (except motion picture)booking agencies are included in this industry.
711320 Promoters of Performing Arts, Sports, andSimilar Events Without Facilities
This industry comprises promoters primarily engagedin organizing, promoting, and/or managing live perform-ing arts productions, sports events, and similar events,such as state fairs, county fairs, agricultural fairs, con-certs, and festivals, in facilities that are managed andoperated by others. Theatrical (except motion picture)booking agencies are included in this industry.
The data published with NAICS code 711320 are com-prised of these parts of the following SIC industries:
B–4 APPENDIX B ARTS, ENTERTAINMENT, & RECREATION
U.S. Census Bureau, 1997 Economic Census
7922 (pt) Producers of Radio and Television, (ExceptTape Producers)
7922 (pt) Theatrical Promoters
7941 (pt) Sports Promoters
7999 (pt) Carnivals (Except Traveling CarnivalCompanies)
7999 (pt) Fairs (State, County, etc.)
7113201 Producers of Radio and Television(Except Tape Producers)
Establishments primarily engaged in producing showsfor live presentation on radio, television, in night clubs,etc. Producers of shows taped for radio or television pre-sentation are included here if the shows are taped byother than the producers, i.e., the program is produced bya nonnetwork affiliated producer, but the taping is doneby the network or station on which the show is presented.
7113202 Sports Promoters
Establishments primarily engaged in presenting andpromoting athletic events in facilities that are managedand operated by others. Independent promoters of ama-teur sports events are included in this industry.
7113203 Theatrical Promoters
Establishments primarily engaged in organizing, pro-moting, and/or managing live performing arts productionsor similar events in facilities managed and operated byothers.
7113204 Carnivals (Except Traveling CarnivalCompanies)
Establishments primarily engaged in promoting events,known as carnivals, which do not have any fixed exhibi-tions site.
7113205 Fairs (State, County, etc.)
Establishments primarily engaged in arranging andoperating the events, exhibitions, space, and relatedactivities usually associated with county, state, or similarfairs.
7114 Agents and Managers for Artists, Athletes,Entertainers, and Other Public Figures
This industry comprises establishments of agents andmanagers primarily engaged in representing and/or man-aging creative and performing artists, sports figures,entertainers, and other public figures. The representationand management includes activities, such as representingclients in contract negotiations; managing or organizingclient’s financial affairs; and generally promoting thecareers of their clients.
71141 Agents and Managers for Artists, Athletes,Entertainers, and Other Public Figures
This industry comprises establishments of agents andmanagers primarily engaged in representing and/or man-aging creative and performing artists, sports figures,entertainers, and other public figures. The representationand management includes activities, such as representingclients in contract negotiations; managing or organizingclient’s financial affairs; and generally promoting thecareers of their clients.
711410 Agents and Managers for Artists, Athletes,Entertainers, and Other Public Figures
This industry comprises establishments of agents andmanagers primarily engaged in representing and/or man-aging creative and performing artists, sports figures,entertainers, and other public figures. The representationand management includes activities, such as representingclients in contract negotiations; managing or organizingclient’s financial affairs; and generally promoting thecareers of their clients.
The data published with NAICS code 711410 are com-prised of these parts of the following SIC industries:
7389 (pt) Agents and Brokers for NonperformingArtists
7922 (pt) Theatrical Agents
7941 (pt) Sports Agents
7114101 Sports Agents
Establishments primarily engaged in representingand/or managing the careers of sports figures. The repre-sentation and management includes activities, such asrepresenting clients in contract negotiations, managing ororganizing clients’ financial affairs, and generally promot-ing the careers of their clients.
7114102 Theatrical Agents
Establishments primarily engaged in representingand/or managing performing artists’ careers. These estab-lishments represent their clients in contract negotiations,manage or organize their financial affairs, and generallypromote the careers of their clients.
7114103 Agents and Brokers for NonperformingArtists
Establishments primarily engaged in representingand/or managing public figures (except sports figures andperforming artists).
7115 Independent Artists, Writers, and Performers
This industry comprises independent (i.e., freelance)individuals primarily engaged in performing in artistic pro-ductions, in creating artistic and cultural works or produc-tions, or in providing technical expertise necessary for
APPENDIX B B–5ARTS, ENTERTAINMENT, & RECREATION
U.S. Census Bureau, 1997 Economic Census

these productions. This industry also includes athletes andother celebrities exclusively engaged in endorsing prod-ucts and making speeches or public appearances forwhich they receive a fee.
71151 Independent Artists, Writers, andPerformers
This industry comprises independent (i.e., freelance)individuals primarily engaged in performing in artistic pro-ductions, in creating artistic and cultural works or produc-tions, or in providing technical expertise necessary forthese productions. This industry also includes athletes andother celebrities exclusively engaged in endorsing prod-ucts and making speeches or public appearances forwhich they receive a fee.
711510 Independent Artists, Writers, andPerformers
This industry comprises independent (i.e., freelance)individuals primarily engaged in performing in artistic pro-ductions, in creating artistic and cultural works or produc-tions, or in providing technical expertise necessary forthese productions. This industry also includes athletes andother celebrities exclusively engaged in endorsing prod-ucts and making speeches or public appearances forwhich they receive a fee.
The data published with NAICS code 711510 are com-prised of these parts of the following SIC industries:
7819 (pt) Film Directors and Other Motion PictureProduction Artists and Technicians,Independent
7929 (pt) Actors and Actresses
8999 (pt) Authors, Composers and OtherArts-Related Services
7115101 Authors, Composers, and OtherArts-Related Services
Independent individuals primarily engaged in writingbooks and articles, composing music, painting, sculptur-ing, and in similar creative arts-related activities.
7115102 Actors and Actresses
Independent or freelance actors and actresses andother performing artists regardless of the stage (e.g., the-ater, television, film) on which they are performing theircraft.
7115103 Independent Motion Picture ProductionArtists and Technicians
Independent or freelance creative artists (except per-forming artists) or technicians engaged in the productionof motion picture, television, or other video productions.
712 Museums, Historical Sites, and SimilarInstitutions
Industries in the Museums, Historical Sites, and SimilarInstitutions subsector engage in the preservation andexhibition of objects, sites, and natural wonders of histori-cal, cultural, and/or educational value.
7121 Museums, Historical Sites, and SimilarInstitutions
This NAICS industry group includes establishmentsclassified in the following NAICS industries: 71211, Muse-ums; 71212, Historical Sites; 71213, Zoos and BotanicalGardens; and 71219, Nature Parks and Other Similar Insti-tutions.
71211 Museums
This industry comprises establishments primarilyengaged in the preservation and exhibition of objects ofhistorical, cultural, and/or educational value.
712110 Museums
This industry comprises establishments primarilyengaged in the preservation and exhibition of objects ofhistorical, cultural, and/or educational value.
The data published with NAICS code 712110 are com-prised of this part of the following SIC industry:
8412 (pt) Museums
71212 Historical Sites
This industry comprises establishments primarilyengaged in the preservation and exhibition of sites, build-ings, forts, or communities that describe events or per-sons of particular historical interest. Archeological sites,battlefields, historical ships, and pioneer villages areincluded in this industry.
712120 Historical Sites
This industry comprises establishments primarilyengaged in the preservation and exhibition of sites, build-ings, forts, or communities that describe events or per-sons of particular historical interest. Archeological sites,battlefields, historical ships, and pioneer villages areincluded in this industry.
The data published with NAICS code 712120 are com-prised of this part of the following SIC industry:
8412 (pt) Historical Sites
71213 Zoos and Botanical Gardens
This industry comprises establishments primarilyengaged in the preservation and exhibition of live plantand animal life displays.
B–6 APPENDIX B ARTS, ENTERTAINMENT, & RECREATION
U.S. Census Bureau, 1997 Economic Census

712130 Zoos and Botanical Gardens
This industry comprises establishments primarilyengaged in the preservation and exhibition of live plantand animal life displays.
The data published with NAICS code 712130 are com-prised of this part of the following SIC industry:
8422 (pt) Zoos and Botanical Gardens
71219 Nature Parks and Other Similar Institutions
This industry comprises establishments primarilyengaged in the preservation and exhibition of naturalareas or settings.
712190 Nature Parks and Other SimilarInstitutions
This industry comprises establishments primarilyengaged in the preservation and exhibition of naturalareas or settings.
The data published with NAICS code 712190 are com-prised of these parts of the following SIC industries:
7999 (pt) Caverns and Miscellaneous CommercialParks
8422 (pt) Natural Parks and Reserves
7121901 Nature Parks and Reserves
Establishments primarily engaged in the preservationand exhibition of natural areas or settings.
7121902 Caverns and Miscellaneous CommercialParks
Establishments primarily engaged in the preservationand exhibition of caverns and miscellaneous commercialparks.
713 Amusement, Gambling, and RecreationIndustries
Industries in the Amusement, Gambling, and RecreationIndustries subsector (1) operate facilities where patronscan primarily engage in sports, recreation, amusement, orgambling activities and/or (2) provide other amusementand recreation services, such as supplying and servicingamusement devices in places of business operated by oth-ers; operating sports teams, clubs, or leagues engaged inplaying games for recreational purposes; and guidingtours without using transportation equipment.
This subsector does not cover all establishments pro-viding recreational services. Other sectors of NAICS alsoprovide recreational services. Providers of recreational ser-vices are often engaged in processes classified in othersectors of NAICS. For example, operators of resorts andhunting and fishing camps provide both accommodationand recreational facilities and services. These establish-ments are classified in Subsector 721, Accommodation,
partly to reflect the significant costs associated with theprovision of accommodation services and partly to ensureconsistency with international standards. Likewise, estab-lishments using transportation equipment to provide rec-reational and entertainment services, such as those oper-ating sightseeing buses, dinner cruises, or helicopterrides, are classified in Subsector 48-49, Transportation andWarehousing.
The industry groups in this subsector highlight particu-lar types of activities: amusement parks and arcades, gam-bling industries, and other amusement and recreationindustries. The groups, however, are not all inclusive ofthe activity. The Gambling Industries industry group doesnot provide for full coverage of gambling activities. Forexample, casino hotels are classified in Subsector 721,Accommodation; and horse and dog racing tracks are clas-sified in Industry Group 7112, Spectator Sports.
7131 Amusement Parks and Arcades
This industry group comprises establishments primarilyengaged in operating amusement parks and amusementarcades and parlors.
71311 Amusement and Theme Parks
This industry comprises establishments, known asamusement or theme parks, primarily engaged in operat-ing a variety of attractions, such as mechanical rides,water rides, games, shows, theme exhibits, refreshmentstands, and picnic grounds. These establishments maylease space to others on a concession basis.
713110 Amusement and Theme Parks
This industry comprises establishments, known asamusement or theme parks, primarily engaged in operat-ing a variety of attractions, such as mechanical rides,water rides, games, shows, theme exhibits, refreshmentstands, and picnic grounds. These establishments maylease space to others on a concession basis.
The data published with NAICS code 713110 are com-prised of the following SIC industry:
7996 Amusement Parks
7131101 Waterparks
Establishments primarily engaged in operating water-parks. Waterparks are amusement parks where most, ifnot all, of the rides are water in nature.
7131102 Amusement Parks (Except Waterparks)
Establishments primarily engaged in operating amuse-ment or theme parks. These establishments offer a varietyof attractions, such as mechanical rides, games, shows,theme exhibits, refreshment stands, and picnic grounds.These establishments may lease space to others on a con-cession basis.
APPENDIX B B–7ARTS, ENTERTAINMENT, & RECREATION
U.S. Census Bureau, 1997 Economic Census
71312 Amusement Arcades
This industry comprises establishments primarilyengaged in operating amusement (except gambling, bil-liard, or pool) arcades and parlors.
713120 Amusement Arcades
This industry comprises establishments primarilyengaged in operating amusement (except gambling, bil-liard, or pool) arcades and parlors.
The data published with NAICS code 713120 are com-prised of this part of the following SIC industry:
7993 (pt) Arcades and Family Fun Centers
7132 Gambling Industries
This industry group comprises establishments (exceptcasino hotels) primarily engaged in operating gamblingfacilities, such as casinos, bingo halls, and video gamingterminals, or in the provision of gambling services, suchas lotteries and off-track betting. Casino hotels are classi-fied in Industry 72112.
71321 Casinos (Except Casino Hotels)
This industry comprises establishments primarilyengaged in operating gambling facilities that offer tablewagering games along with other gambling activities,such as slot machines and sports betting. These establish-ments often provide food and beverage services. Includedin this industry are floating casinos (i.e., gambling cruises,riverboat casinos).
713210 Casinos (Except Casino Hotels)
This industry comprises establishments primarilyengaged in operating gambling facilities that offer tablewagering games along with other gambling activities,such as slot machines and sports betting. These establish-ments often provide food and beverage services. Includedin this industry are floating casinos (i.e., gambling cruises,riverboat casinos).
The data published with NAICS code 713210 are com-prised of this part of the following SIC industry:
7999 (pt) Casinos, (Except Casino Hotels)
71329 Other Gambling Industries
This industry comprises establishments primarilyengaged in operating gambling facilities (except casinosor casino hotels) or providing gambling services.
713290 Other Gambling Industries
This industry comprises establishments primarilyengaged in operating gambling facilities (except casinosor casino hotels) or providing gambling services.
The data published with NAICS code 713290 are com-prised of these parts of the following SIC industries:
7993 (pt) Slot Machine Operators
7999 (pt) Lottery, Bingo, Bookie, and Other BettingOperations
7132901 Slot Machine Operators
Establishments primarily engaged in operating slotmachines either in their own or other places of business.
7132902 Lottery, Bingo, Bookie, and Other BettingOperations
Establishments primarily engaged in operating gam-bling facilities or providing gambling services (except casi-nos or operators of coin-operated gambling devices), suchas bingo games, bookies, lotteries, and off-track betting.
7139 Other Amusement and Recreation Industries
This NAICS industry group includes establishmentsclassified in the following NAICS industries: 71391, GolfCourses and Country Clubs; 71392, Skiing Facilities;71393, Marinas; 71394, Fitness and Recreational SportsCenters; 71395, Bowling Centers; and 71399, All OtherAmusements and Recreation Industries.
71391 Golf Courses and Country Clubs
This industry comprises (1) establishments primarilyengaged in operating golf courses (except miniature) and(2) establishments primarily engaged in operating golfcourses, along with dining facilities and other recreationalfacilities that are known as country clubs. These establish-ments often provide food and beverage services, equip-ment rental services, and golf instruction services.
713910 Golf Courses and Country Clubs
This industry comprises (1) establishments primarilyengaged in operating golf courses (except miniature) and(2) establishments primarily engaged in operating golfcourses, along with dining facilities and other recreationalfacilities that are known as country clubs. These establish-ments often provide food and beverage services, equip-ment rental services, and golf instruction services.
The data published with NAICS code 713910 are com-prised of these parts of the following SIC industries:
7992 Public Golf Courses
7997 (pt) Membership Golf Clubs
7139101 Membership Golf Clubs
Establishments primarily engaged in operating golfcourses, including country clubs, which are restricted touse by members and their guests. These establishmentsoften provide dining and other recreational facilities.
B–8 APPENDIX B ARTS, ENTERTAINMENT, & RECREATION
U.S. Census Bureau, 1997 Economic Census

7139102 Public Golf Courses
Establishments primarily engaged in operating golfcourses open to the general pubic on a fee basis. Theseestablishments often provide food and beverage services,equipment rental services, and golf instruction services,but are classified here regardless of the primary source ofincome.
71392 Skiing Facilities
This industry comprises establishments engaged in (1)operating downhill, cross-country, or related skiing areasand/or (2) operating equipment, such as ski lifts and tows.These establishments often provide food and beverageservices, equipment rental services, and ski instructionservices. Four season resorts without accommodations areincluded in this industry.
713920 Skiing Facilities
This industry comprises establishments engaged in (1)operating downhill, cross-country, or related skiing areasand/or (2) operating equipment, such as ski lifts and tows.These establishments often provide food and beverageservices, equipment rental services, and ski instructionservices. Four season resorts without accommodations areincluded in this industry.
The data published with NAICS code 713920 are com-prised of this part of the following SIC industry:
7999 (pt) Skiing Facilities
71393 Marinas
This industry comprises establishments, commonlyknown as marinas, engaged in operating docking and/orstorage facilities for pleasure craft owners, with or withoutone or more related activities, such as retailing fuel andmarine supplies; and repairing, maintaining, or rentingpleasure boats.
713930 Marinas
This industry comprises establishments, commonlyknown as marinas, engaged in operating docking and/orstorage facilities for pleasure craft owners, with or withoutone or more related activities, such as retailing fuel andmarine supplies; and repairing, maintaining, or rentingpleasure boats.
The data published with NAICS code 713930 are com-prised of the following SIC industry:
4493 Marinas
71394 Fitness and Recreational Sports Centers
This industry comprises establishments primarilyengaged in operating fitness and recreational sports facili-ties featuring exercise and other active physical fitnessconditioning or recreational sports activities, such asswimming, skating, or racquet sports.
713940 Fitness and Recreational Sports Centers
This industry comprises establishments primarilyengaged in operating fitness and recreational sports facili-ties featuring exercise and other active physical fitnessconditioning or recreational sports activities, such asswimming, skating, or racquet sports.
The data published with NAICS code 713940 are com-prised of these parts of the following SIC industries:
7991 Gymnasiums, Athletic Clubs, and PhysicalFitness Centers
7997 (pt) Membership Recreation Clubs WithFacilities
7999 (pt) Ice Skating Rinks
7999 (pt) Nonmembership Recreation Facilities
7999 (pt) Roller Skating Rinks
7139401 Nonmembership Recreation Facilities
Establishments primarily engaged in operating recre-ation facilities which do not restrict access based on mem-bership.
7139402 Gymnasiums, Athletic Clubs, and PhysicalFitness Centers
Establishments primarily engaged in operating member-ship and nonmembership gymnasiums, athletic clubs, andother physical fitness centers for activities, such as weightreducing, strength development, or weight training.
7139403 Membership Recreation Clubs WithFacilities
Establishments primarily engaged in operating sportsand recreational clubs (except golf and country clubs)which are restricted to use by members and their guests.These establishments have their own facilities.
7139404 Ice Skating Rinks
Establishments primarily engaged in operating ice skat-ing rinks open to the general public.
7139405 Roller Skating Rinks
Establishments primarily engaged in operating rollerskating rinks open to the general public.
71395 Bowling Centers
This industry comprises establishments engaged inoperating bowling centers. These establishments oftenprovide food and beverage services.
713950 Bowling Centers
This industry comprises establishments engaged inoperating bowling centers. These establishments oftenprovide food and beverage services.
APPENDIX B B–9ARTS, ENTERTAINMENT, & RECREATION
U.S. Census Bureau, 1997 Economic Census

The data published with NAICS code 713950 are com-prised of the following SIC industry:
7933 Bowling Centers
71399 All Other Amusement and RecreationIndustries
This industry comprises establishments (except amuse-ment parks and arcades; gambling industries; golf coursesand country clubs; skiing facilities; marinas; fitness andrecreational sports centers; and bowling centers) primarilyengaged in providing recreational and amusement ser-vices.
713990 All Other Amusement and RecreationIndustries
This industry comprises establishments (except amuse-ment parks and arcades; gambling industries; golf coursesand country clubs; skiing facilities; marinas; fitness andrecreational sports centers; and bowling centers) primarilyengaged in providing recreational and amusement ser-vices.
The data published with NAICS code 713990 are com-prised of these parts of the following SIC industries:
7911 (pt) Dance Halls
7993 (pt) Coin-Operated Amusement Devices,(Except Slot Machine Operation)
7997 (pt) Membership Sports and Recreation ClubsWithout Facilities
7999 (pt) Concession Operators or AmusementDevices and Rides
7999 (pt) Miniature Golf Courses
7999 (pt) Amusements and Recreation, NEC
7139901 Dance Studios and Halls
Establishments primarily engaged in operating dancehalls or ballrooms.
7139902 Concession Operators of AmusementDevices and Rides
Establishments primarily engaged in operatingattendant-controlled mechanical rides or amusementdevices in amusement parks, carnivals, circuses, fairs, orshopping malls.
7139903 Membership Sports and Recreation ClubsWithout Facilities
Establishments primarily engaged in operating member-ship sports and recreational clubs, without facilities, whichare restricted to use by members and their guests.
7139904 Miniature Golf Courses
Establishments primarily engaged in operating minia-ture golf courses.
7139905 Coin-Operated Amusement Devices,(Except Slot Machine Operation)
Establishments primarily engaged in operating coin-operated amusement devices or rides (except gamingdevices), such as juke boxes, pinball machines, mechani-cal games, and similar types of amusement equipment, inplaces of business operated by others.
7139909 All Other Miscellaneous Amusement andRecreation Services
Establishments primarily engaged in providing amuse-ment and recreation services (except amusement parksand arcades, gambling industries, skating rinks, golfcourses and country clubs, skiing facilities, marinas, fit-ness and recreational sports centers, dance halls, bowlingcenters, amusement device operation).
B–10 APPENDIX B ARTS, ENTERTAINMENT, & RECREATION
U.S. Census Bureau, 1997 Economic Census
Appendix C.Coverage and Methodology
MAIL/NONMAIL UNIVERSE
For this sector, large- and medium-size firms, plus allfirms known to operate more than one establishment,were sent questionnaires to be completed and returned tothe Census Bureau by mail. For most very small firms,data from existing administrative records of other Federalagencies were used instead. These records provided basicinformation on location, kind of business, receipts, pay-roll, number of employees, and legal form of organization.
Firms in the 1997 Economic Census were divided intothe mail universe and nonmail universe. The coverage ofand the method of obtaining census information fromeach are described below:
1. The mail universe consisted of firms for which infor-mation was obtained by means of a mail canvass andincluded:
a. Large employers, i.e., all multiestablishment firms,and all employer firms with payroll above a speci-fied cutoff (The term ‘‘employers’’ refers to firmswith one or more paid employees at any time dur-ing 1997 as shown in the active administrativerecords of other Federal agencies.).
b. A sample of small employers, i.e., single-establishment firms with payroll below a specifiedcutoff, in classifications for which specialized dataprecluded reliance solely on administrative recordssources.
2. The nonmail universe consisted of firms that were notrequired to file a regular census return and included:
a. Selected small employers, i.e., single-establishmentfirms with payroll below a specified cutoff.Although the payroll cutoff varied by kind of busi-ness, small employers in the nonmail universe gen-erally included firms with less than 10 employeesand represented about 10 percent of total receiptsof establishments covered in the census. Data onreceipts, payroll, and employment for smallemployers in the nonmail universe were derived orestimated from administrative records of other Fed-eral agencies.
b. All taxable nonemployers, i.e., all firms subject toFederal income tax with no paid employees during1997. Receipts information for these firms wasobtained from administrative records of other Fed-eral agencies. Although consisting of many firms,
nonemployers accounted for less than 10-percentof total receipts of all establishments covered inthe census. The census included only those nonem-ployer firms which reported a receipts volume of$1,000 or more during 1997. Establishmentsexempt from Federal income tax with no paidemployees were excluded as in previous censuses.Data for nonemployers are not included in thisreport, but are released as part of the ‘‘Core Busi-ness Statistics Series.’’
INDUSTRY CLASSIFICATION OF ESTABLISHMENTS
The classifications for all establishments in this sectorwere assigned in accordance with the 1997 North Ameri-can Industry Classification System (NAICS) Manual, UnitedStates. NAICS is a common classification system devel-oped by the United States, Canada, and Mexico. This sys-tem replaces the 1987 Standard Industrial Classification(SIC) that was used in previous censuses. Appendix A ofthe 1997 NAICS manual provides information on the com-parability between the 1987 SIC and the 1997 NAICS.More information on NAICS is available in the NAICSmanual and at www.census.gov/naics.
The method of assigning classifications, and the levelof detail at which establishments were classified, differedbetween the mail and nonmail universe as follows:
1. The mail universe.Establishments in the mail universe were classified
on the basis of their self-designation, sources ofreceipts, and other industry-specific inquiries.
2. The nonmail universe.
a. Selected small employers were classified on thebasis of the most current kind-of-business classifi-cation available from one of the Census Bureau’scurrent sample surveys or the 1992 Economic Cen-sus. Otherwise, the classification was obtainedfrom administrative records of other Federal agen-cies. If the census or administrative record classifi-cations proved inadequate (none corresponded to a1997 Economic Census classification in the detailrequired for employers), the firm was sent a briefinquiry requesting information necessary to assigna 1997 census kind-of-business code.
b. Nonemployers were classified on the basis ofinformation obtained from administrative recordsof other Federal agencies.
APPENDIX C C–1ARTS, ENTERTAINMENT, & RECREATION
U.S. Census Bureau, 1997 Economic Census
METHOD OF ASSIGNING TAX STATUS
For kind-of-business classifications where there weresubstantial numbers of taxable and tax-exempt establish-ments, establishments were classified based on the Fed-eral income tax filing requirement for the establishment ororganization. This classification was based primarily onthe response to an inquiry on the census questionnaire.Establishments that indicated that all or part of theirincome was exempt from Federal income tax under provi-sions of section 501 of the Internal Revenue Service (IRS)code were classified as tax-exempt; establishments indi-cating no such exemption were classified as taxable. Allgovernment-operated hospitals were classified as tax-exempt. For establishments in the nonmail universe, thetax status classification was based upon the type of taxreturn filed by the firm or organization.
For selected kind-of-business classifications that arecomprised primarily of tax-exempt establishments, allestablishments in those classifications were defined astax-exempt. All establishments in the remaining kind-of-business classifications (comprised primarily of taxableestablishments) were defined as taxable.
RELIABILITY OF DATA
All data compiled for this sector are subject to nonsam-pling errors. Nonsampling errors can be attributed tomany sources: inability to identify all cases in the actualuniverse; definition and classification difficulties; differ-ences in the interpretation of questions; errors in record-ing or coding the data obtained; and other errors of collec-tion, response, coverage, processing, and estimation formissing or misreported data.
Data presented in the Miscellaneous Subjects and theSources of Receipt or Revenue reports for this sector aresubject to sampling errors as well as nonsampling errors.Specifically, these data are estimated based on informationobtained from census questionnaires mailed to all largeemployers and to a sample of small employers in the uni-verse. Sampling errors affect these estimates insofar asthey may differ from results that would be obtained froma complete enumeration.
The accuracy of these tabulated data is determined bythe joint effects of the various nonsampling errors or bythe joint effects of sampling and nonsampling errors. Nodirect measurement of these effects has been obtainedexcept for estimation for missing or misreported data;however, precautionary steps were taken in all phases ofthe collection, processing, and tabulation of the data in aneffort to minimize the effects of nonsampling errors.
The Census Bureau obtains limited informationextracted from administrative records of other Federalagencies. This information is used in conjunction withother information available to the Census Bureau todevelop estimates for nonemployers, small employers,and other establishments for which responses were notreceived in time for publication.
TREATMENT OF NONRESPONSE
Census report forms included two different types ofinquiries, ‘‘basic’’ and ‘‘industry-specific.’’ Data for thebasic inquiries, which include location, kind of business oroperation, receipts or revenue, payroll, number of employ-ees, and legal form of organization, were available from acombination of sources for all establishments. Data forindustry-specific inquiries, tailored to the particular kindsof business or operation covered by the report, were avail-able only from the establishments in the mail universethat completed the appropriate inquiries on the question-naire.
Data for industry-specific inquiries in this sector wereexpanded in most cases to account for establishmentsthat did not respond to the particular inquiry for whichdata are presented. Data presented for industry-specificinquiries based on a December 31 reference date wereexpanded in direct relationship to total receipts or revenueof only those establishments in business at the end of theyear. Unless otherwise noted in specific reports, data forother industry-specific inquiries were expanded in directrelationship to total receipts or revenue of all establish-ments included in the category. In a few cases expansionon the basis of the receipts or revenue item was notappropriate, and another basic data item was used as thebasis for expansion of reported data to account for nonre-spondents.
All reports in which data were expanded to account fornonmail employers and nonrespondents include a cover-age indicator for each publication category, which showsthe receipts or revenue of establishments responding tothe industry-specific inquiry as a percent of total receiptsor revenue for all establishments for which data areshown. For some inquiries, coverage is determined by theratio of total payroll or employment of establishmentsresponding to the inquiry to total payroll or employmentof all establishments in the category.
ESTABLISHMENT AND FIRM SIZE CATEGORIES
The Establishment and Firm Size report represents arecompilation of data collected in the 1997 Economic Cen-sus for the Arts, Entertainment, and Recreation Sector andis divided into three categories: establishment size, firmsize, and legal form of organization.
Establishment size. Only establishments which oper-ated for the entire year have been classified into the vari-ous receipt/revenue and employment size groups used inthe establishment size tables. An establishment is classi-fied as ‘‘operated for the entire year’’ if it operated 10months or more during the year. Data for establishmentswhich reported that they were in operation fewer than 10months are separately summarized as ‘‘not operated forthe entire year.’’
Firm size. Only firms which operated for the entire yearhave been classified into the various receipt/revenue and
C–2 APPENDIX C ARTS, ENTERTAINMENT, & RECREATION
U.S. Census Bureau, 1997 Economic Census

employment size groups used in the firm size tables. Afirm may be either a single establishment (single unit) firmor a multiestablishment (multiunit) firm. A single unit firmis a firm with only one establishment engaged in eco-nomic activities. A multiunit firm is a firm with two estab-lishments or more engaged in economic activities. A multi-unit firm may, however, operate only one establishmentclassified in service industries. Firm size groups are basedon aggregate data for all establishments operated by thesame firm in the kind-of-business classification, group, ortotal for which data are presented. For example, a firmoperates two service establishments: a musical theater
company (NAICS 711110) and a dance company (NAICS711120). At each of the two most detailed levels of classi-fication, each of the establishments is a single unit oper-ated by a multiunit firm. At the performing arts, spectatorsports, and related industries major group level (NAICS711), it is a two-establishment multiunit firm. A firm isconsidered to have ‘‘operated for the entire year’’ if any ofits establishments at that NAICS level operated 10 monthsor more during the year. Data for firms which reportedthat none of their establishments operated 10 months ormore are separately summarized as ‘‘not operated entireyear.’’
APPENDIX C C–3ARTS, ENTERTAINMENT, & RECREATION
U.S. Census Bureau, 1997 Economic Census

Appendix D.Geographic Notes
Not applicable for this report.
APPENDIX D D–11997 ECONOMIC CENSUS
U.S. Census Bureau, 1997 Economic Census

Appendix E.Metropolitan Areas
Not applicable for this report.
APPENDIX E E–11997 ECONOMIC CENSUS
U.S. Census Bureau, 1997 Economic Census

EC97S7
1S-SM
19
97
Sum
mary
1997EconomicCensus
Arts,
Enterta
inm
ent,
and
Recrea
tionSu
bject
SeriesU
SC
EN
SU
SB
UR
EA
U