Embed Size (px)
Citation preview
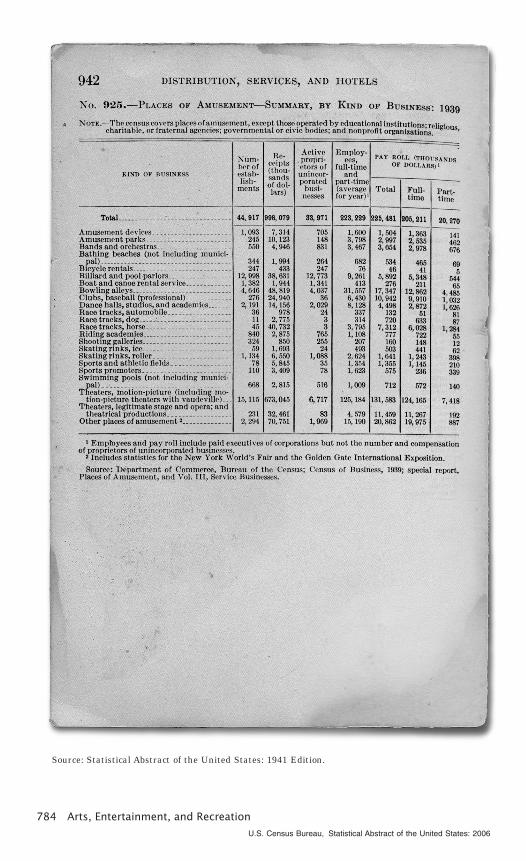
Source: Statistical Abstract of the United States: 1941 Edition.
784 Arts, Entertainment, and Recreation
U.S. Census Bureau, Statistical Abstract of the United States: 2006
Section 26
Arts, Entertainment, and Recreation
This section presents data on the arts,entertainment, and recreation economicsector of the economy, and personal rec-reational activities, the arts and humani-ties, and domestic and foreign travel.
Arts, Entertainment, and RecreationIndustry—The U.S. Census Bureau’s Serv-ice Annual Survey, Arts, Entertainment,and Recreation Sector, provides estimatesof operation revenue of taxable firms andrevenues and expenses of firms exemptfrom federal taxes for industries in thissector of the economy. Data beginning1998 are based on the North AmericanIndustry Classification System (NAICS).Most establishments were previously clas-sified in the Standard Industrial Classifica-tion (SIC) in services, some in retail trade.
This new sector is comprised of industrieswhich existed previously, were revisedfrom previous industry definitions, or arecompletely new industries. Among thosewhich existed previously are amusementand theme parks. Revised industriesinclude museums. New industries includetheater companies and dinner theaters.The following URL contains detailedinformation about NAICS and providesa comparison of the SIC and NAICS<http://www.census.gov/epcd/www/naics.html>. See also the text in Section15, Business Enterprise.
The 1997 Economic Census was the firsteconomic census to cover the new Infor-mation Sector of the economy. The Cen-sus, conducted every 5 years, for theyears ending ‘‘2’’ and ‘‘7,’’ provides infor-mation on the number of establishments,receipts, payroll and paid employees forthe U.S. and various geographic levels.
Recreation and leisure activities—Data on the participation in various recre-ation and leisure time activities are basedon several sample surveys. Data on par-ticipation in fishing, hunting, and otherforms of wildlife-associated recreation are
published periodically by the U.S. Depart-ment of Interior, Fish and Wildlife Service.The most recent data are from the 2001survey. Data on participation in varioussports recreation activities are publishedby the National Sporting Goods Associa-tion. Mediamark, Inc. also conducts peri-odic surveys on sports and leisure activi-ties, as well as other topics.
Parks and recreation—The Departmentof the Interior has responsibility foradministering the national parks. TheNational Park Service publishes informa-tion on visits to national park areas in itsannual report, National Park StatisticalAbstract. The National Parks: Index (year)is an annual report which contains briefdescriptions, with acreages, of each areaadministered by the service, plus certain‘‘related’’ areas. The annual Federal Recre-ation Fee Report summarizes the prioryear’s recreation fee receipts and recre-ation visitation statistics for seven federalland managing agencies. Statistics forstate parks are compiled by the NationalAssociation of State Park Directors.
Travel— Statistics on arrivals and depar-tures to the United States are reported bythe International Trade Administration(ITA), Office of Travel & Tourism Industries(OTTI). Data on domestic travel, businessreceipts and employment of the travelindustry, and travel expenditures are pub-lished by the research department of theTravel Industry Association (TIA) and thenational nonprofit center for travel andtourism research located in Washington,DC. Other data on household transporta-tion characteristics are in Section 23,Transportation.
Statistical reliability—For a discussionof statistical collection and estimation,sampling procedures, and measures ofstatistical reliability applicable to CensusBureau data, see Appendix III.
Arts, Entertainment, and Recreation 785
U.S. Census Bureau, Statistical Abstract of the United States: 2006
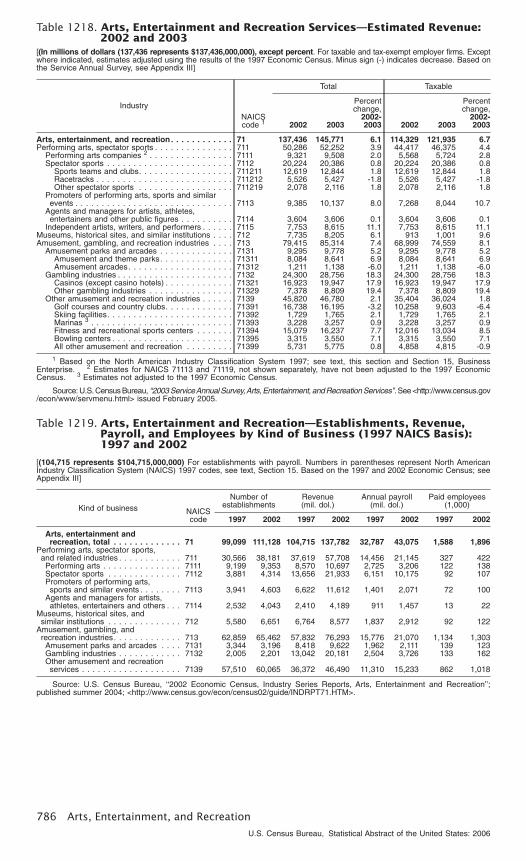
Table 1218. Arts, Entertainment and Recreation Services—Estimated Revenue:2002 and 2003
[(In millions of dollars (137,436 represents $137,436,000,000), except percent. For taxable and tax-exempt employer firms. Exceptwhere indicated, estimates adjusted using the results of the 1997 Economic Census. Minus sign (-) indicates decrease. Based onthe Service Annual Survey, see Appendix III]
IndustryNAICScode 1
Total Taxable
2002 2003
Percentchange,
2002-2003 2002 2003
Percentchange,
2002-2003
Arts, entertainment, and recreation. . . . . . . . . . . . 71 137,436 145,771 6.1 114,329 121,935 6.7Performing arts, spectator sports . . . . . . . . . . . . . . . 711 50,286 52,252 3.9 44,417 46,375 4.4
Performing arts companies 2 . . . . . . . . . . . . . . . . 7111 9,321 9,508 2.0 5,568 5,724 2.8Spectator sports . . . . . . . . . . . . . . . . . . . . . . . . 7112 20,224 20,386 0.8 20,224 20,386 0.8
Sports teams and clubs. . . . . . . . . . . . . . . . . . 711211 12,619 12,844 1.8 12,619 12,844 1.8Racetracks . . . . . . . . . . . . . . . . . . . . . . . . . . 711212 5,526 5,427 -1.8 5,526 5,427 -1.8Other spectator sports . . . . . . . . . . . . . . . . . . 711219 2,078 2,116 1.8 2,078 2,116 1.8
Promoters of performing arts, sports and similarevents . . . . . . . . . . . . . . . . . . . . . . . . . . . . . . 7113 9,385 10,137 8.0 7,268 8,044 10.7
Agents and managers for artists, athletes,entertainers and other public figures . . . . . . . . . . 7114 3,604 3,606 0.1 3,604 3,606 0.1
Independent artists, writers, and performers . . . . . . 7115 7,753 8,615 11.1 7,753 8,615 11.1Museums, historical sites, and similar institutions . . . . 712 7,735 8,205 6.1 913 1,001 9.6Amusement, gambling, and recreation industries . . . . 713 79,415 85,314 7.4 68,999 74,559 8.1
Amusement parks and arcades . . . . . . . . . . . . . . 7131 9,295 9,778 5.2 9,295 9,778 5.2Amusement and theme parks. . . . . . . . . . . . . . 71311 8,084 8,641 6.9 8,084 8,641 6.9Amusement arcades. . . . . . . . . . . . . . . . . . . . 71312 1,211 1,138 -6.0 1,211 1,138 -6.0
Gambling industries . . . . . . . . . . . . . . . . . . . . . . 7132 24,300 28,756 18.3 24,300 28,756 18.3Casinos (except casino hotels) . . . . . . . . . . . . . 71321 16,923 19,947 17.9 16,923 19,947 17.9Other gambling industries . . . . . . . . . . . . . . . . 71329 7,378 8,809 19.4 7,378 8,809 19.4
Other amusement and recreation industries . . . . . . 7139 45,820 46,780 2.1 35,404 36,024 1.8Golf courses and country clubs. . . . . . . . . . . . . 71391 16,738 16,195 -3.2 10,258 9,603 -6.4Skiing facilities. . . . . . . . . . . . . . . . . . . . . . . . 71392 1,729 1,765 2.1 1,729 1,765 2.1Marinas 3 . . . . . . . . . . . . . . . . . . . . . . . . . . . 71393 3,228 3,257 0.9 3,228 3,257 0.9Fitness and recreational sports centers . . . . . . . 71394 15,079 16,237 7.7 12,016 13,034 8.5Bowling centers . . . . . . . . . . . . . . . . . . . . . . . 71395 3,315 3,550 7.1 3,315 3,550 7.1All other amusement and recreation . . . . . . . . . 71399 5,731 5,775 0.8 4,858 4,815 -0.9
1 Based on the North American Industry Classification System 1997; see text, this section and Section 15, BusinessEnterprise. 2 Estimates for NAICS 71113 and 71119, not shown separately, have not been adjusted to the 1997 EconomicCensus. 3 Estimates not adjusted to the 1997 Economic Census.
Source: U.S. Census Bureau, ‘‘2003 ServiceAnnual Survey,Arts, Entertainment, and Recreation Services’’. See <http://www.census.gov/econ/www/servmenu.html> issued February 2005.
Table 1219. Arts, Entertainment and Recreation—Establishments, Revenue,Payroll, and Employees by Kind of Business (1997 NAICS Basis):1997 and 2002
[(104,715 represents $104,715,000,000) For establishments with payroll. Numbers in parentheses represent North AmericanIndustry Classification System (NAICS) 1997 codes, see text, Section 15. Based on the 1997 and 2002 Economic Census; seeAppendix III]
Kind of business NAICScode
Number ofestablishments
Revenue(mil. dol.)
Annual payroll(mil. dol.)
Paid employees(1,000)
1997 2002 1997 2002 1997 2002 1997 2002
Arts, entertainment andrecreation, total . . . . . . . . . . . . . 71 99,099 111,128 104,715 137,782 32,787 43,075 1,588 1,896
Performing arts, spectator sports,and related industries . . . . . . . . . . . . 711 30,566 38,181 37,619 57,708 14,456 21,145 327 422Performing arts . . . . . . . . . . . . . . . 7111 9,199 9,353 8,570 10,697 2,725 3,206 122 138Spectator sports . . . . . . . . . . . . . . 7112 3,881 4,314 13,656 21,933 6,151 10,175 92 107Promoters of performing arts,sports and similar events . . . . . . . . 7113 3,941 4,603 6,622 11,612 1,401 2,071 72 100
Agents and managers for artists,athletes, entertainers and others . . . 7114 2,532 4,043 2,410 4,189 911 1,457 13 22
Museums, historical sites, andsimilar institutions . . . . . . . . . . . . . . 712 5,580 6,651 6,764 8,577 1,837 2,912 92 122
Amusement, gambling, andrecreation industries . . . . . . . . . . . . . 713 62,859 65,462 57,832 76,293 15,776 21,070 1,134 1,303Amusement parks and arcades . . . . 7131 3,344 3,196 8,418 9,622 1,962 2,111 139 123Gambling industries . . . . . . . . . . . . 7132 2,005 2,201 13,042 20,181 2,504 3,726 133 162Other amusement and recreationservices . . . . . . . . . . . . . . . . . . . 7139 57,510 60,065 36,372 46,490 11,310 15,233 862 1,018
Source: U.S. Census Bureau, ‘‘2002 Economic Census, Industry Series Reports, Arts, Entertainment and Recreation’’;published summer 2004; <http://www.census.gov/econ/census02/guide/INDRPT71.HTM>.
786 Arts, Entertainment, and Recreation
U.S. Census Bureau, Statistical Abstract of the United States: 2006
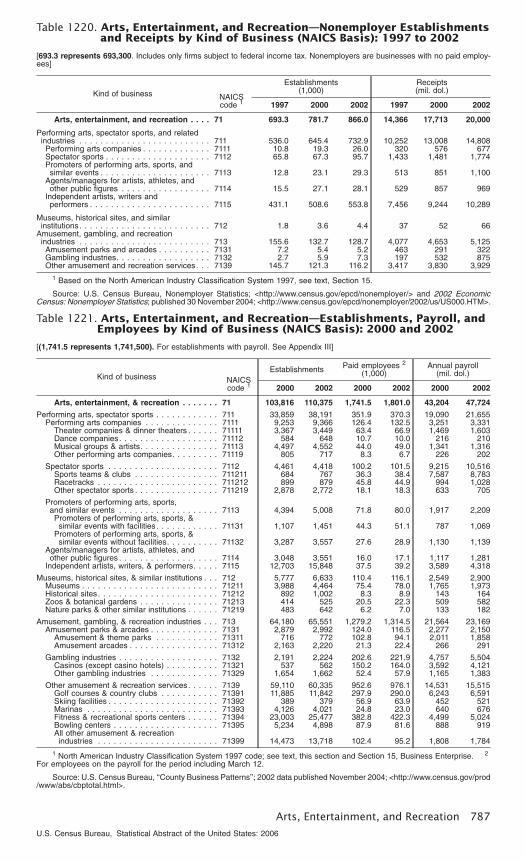
Table 1220. Arts, Entertainment, and Recreation—Nonemployer Establishmentsand Receipts by Kind of Business (NAICS Basis): 1997 to 2002
[693.3 represents 693,300. Includes only firms subject to federal income tax. Nonemployers are businesses with no paid employ-ees]
Kind of business NAICScode 1
Establishments(1,000)
Receipts(mil. dol.)
1997 2000 2002 1997 2000 2002
Arts, entertainment, and recreation . . . . 71 693.3 781.7 866.0 14,366 17,713 20,000
Performing arts, spectator sports, and relatedindustries . . . . . . . . . . . . . . . . . . . . . . . . . 711 536.0 645.4 732.9 10,252 13,008 14,808Performing arts companies . . . . . . . . . . . . . 7111 10.8 19.3 26.0 320 576 677Spectator sports . . . . . . . . . . . . . . . . . . . . 7112 65.8 67.3 95.7 1,433 1,481 1,774Promoters of performing arts, sports, andsimilar events . . . . . . . . . . . . . . . . . . . . . 7113 12.8 23.1 29.3 513 851 1,100
Agents/managers for artists, athletes, andother public figures . . . . . . . . . . . . . . . . . 7114 15.5 27.1 28.1 529 857 969
Independent artists, writers andperformers . . . . . . . . . . . . . . . . . . . . . . . 7115 431.1 508.6 553.8 7,456 9,244 10,289
Museums, historical sites, and similarinstitutions. . . . . . . . . . . . . . . . . . . . . . . . . 712 1.8 3.6 4.4 37 52 66
Amusement, gambling, and recreationindustries . . . . . . . . . . . . . . . . . . . . . . . . . 713 155.6 132.7 128.7 4,077 4,653 5,125Amusement parks and arcades . . . . . . . . . . 7131 7.2 5.4 5.2 463 291 322Gambling industries. . . . . . . . . . . . . . . . . . 7132 2.7 5.9 7.3 197 532 875Other amusement and recreation services. . . 7139 145.7 121.3 116.2 3,417 3,830 3,929
1 Based on the North American Industry Classification System 1997, see text, Section 15.
Source: U.S. Census Bureau, Nonemployer Statistics; <http://www.census.gov/epcd/nonemployer/> and 2002 EconomicCensus: Nonemployer Statistics; published 30 November 2004; <http://www.census.gov/epcd/nonemployer/2002/us/US000.HTM>.
Table 1221. Arts, Entertainment, and Recreation—Establishments, Payroll, andEmployees by Kind of Business (NAICS Basis): 2000 and 2002
[(1,741.5 represents 1,741,500). For establishments with payroll. See Appendix III]
Kind of business NAICScode 1
Establishments Paid employees 2
(1,000)Annual payroll
(mil. dol.)
2000 2002 2000 2002 2000 2002
Arts, entertainment, & recreation . . . . . . . 71 103,816 110,375 1,741.5 1,801.0 43,204 47,724
Performing arts, spectator sports . . . . . . . . . . . . 711 33,859 38,191 351.9 370.3 19,090 21,655Performing arts companies . . . . . . . . . . . . . . 7111 9,253 9,366 126.4 132.5 3,251 3,331
Theater companies & dinner theaters . . . . . . 71111 3,367 3,449 63.4 66.9 1,469 1,603Dance companies. . . . . . . . . . . . . . . . . . . 71112 584 648 10.7 10.0 216 210Musical groups & artists. . . . . . . . . . . . . . . 71113 4,497 4,552 44.0 49.0 1,341 1,316Other performing arts companies. . . . . . . . . 71119 805 717 8.3 6.7 226 202
Spectator sports . . . . . . . . . . . . . . . . . . . . . 7112 4,461 4,418 100.2 101.5 9,215 10,516Sports teams & clubs . . . . . . . . . . . . . . . . 711211 684 767 36.3 38.4 7,587 8,783Racetracks . . . . . . . . . . . . . . . . . . . . . . . 711212 899 879 45.8 44.9 994 1,028Other spectator sports . . . . . . . . . . . . . . . . 711219 2,878 2,772 18.1 18.3 633 705
Promoters of performing arts, sports,and similar events . . . . . . . . . . . . . . . . . . . 7113 4,394 5,008 71.8 80.0 1,917 2,209Promoters of performing arts, sports, &similar events with facilities . . . . . . . . . . . . 71131 1,107 1,451 44.3 51.1 787 1,069
Promoters of performing arts, sports, &similar events without facilities. . . . . . . . . . 71132 3,287 3,557 27.6 28.9 1,130 1,139
Agents/managers for artists, athletes, andother public figures . . . . . . . . . . . . . . . . . . . 7114 3,048 3,551 16.0 17.1 1,117 1,281
Independent artists, writers, & performers. . . . . 7115 12,703 15,848 37.5 39.2 3,589 4,318
Museums, historical sites, & similar institutions . . . 712 5,777 6,633 110.4 116.1 2,549 2,900Museums . . . . . . . . . . . . . . . . . . . . . . . . . . 71211 3,988 4,464 75.4 78.0 1,765 1,973Historical sites . . . . . . . . . . . . . . . . . . . . . . . 71212 892 1,002 8.3 8.9 143 164Zoos & botanical gardens . . . . . . . . . . . . . . . 71213 414 525 20.5 22.3 509 582Nature parks & other similar institutions . . . . . . 71219 483 642 6.2 7.0 133 182
Amusement, gambling, & recreation industries . . . 713 64,180 65,551 1,279.2 1,314.5 21,564 23,169Amusement parks & arcades . . . . . . . . . . . . . 7131 2,879 2,992 124.0 116.5 2,277 2,150
Amusement & theme parks . . . . . . . . . . . . 71311 716 772 102.8 94.1 2,011 1,858Amusement arcades . . . . . . . . . . . . . . . . . 71312 2,163 2,220 21.3 22.4 266 291
Gambling industries . . . . . . . . . . . . . . . . . . . 7132 2,191 2,224 202.6 221.9 4,757 5,504Casinos (except casino hotels) . . . . . . . . . . 71321 537 562 150.2 164.0 3,592 4,121Other gambling industries . . . . . . . . . . . . . 71329 1,654 1,662 52.4 57.9 1,165 1,383
Other amusement & recreation services. . . . . . 7139 59,110 60,335 952.6 976.1 14,531 15,515Golf courses & country clubs . . . . . . . . . . . 71391 11,885 11,842 297.9 290.0 6,243 6,591Skiing facilities . . . . . . . . . . . . . . . . . . . . . 71392 389 379 56.9 63.9 452 521Marinas . . . . . . . . . . . . . . . . . . . . . . . . . 71393 4,126 4,021 24.8 23.0 640 676Fitness & recreational sports centers . . . . . . 71394 23,003 25,477 382.8 422.3 4,499 5,024Bowling centers . . . . . . . . . . . . . . . . . . . . 71395 5,234 4,898 87.9 81.6 888 919All other amusement & recreationindustries . . . . . . . . . . . . . . . . . . . . . . . 71399 14,473 13,718 102.4 95.2 1,808 1,784
1 North American Industry Classification System 1997 code; see text, this section and Section 15, Business Enterprise. 2
For employees on the payroll for the period including March 12.
Source: U.S. Census Bureau, ‘‘County Business Patterns’’; 2002 data published November 2004; <http://www.census.gov/prod/www/abs/cbptotal.html>.
Arts, Entertainment, and Recreation 787
U.S. Census Bureau, Statistical Abstract of the United States: 2006
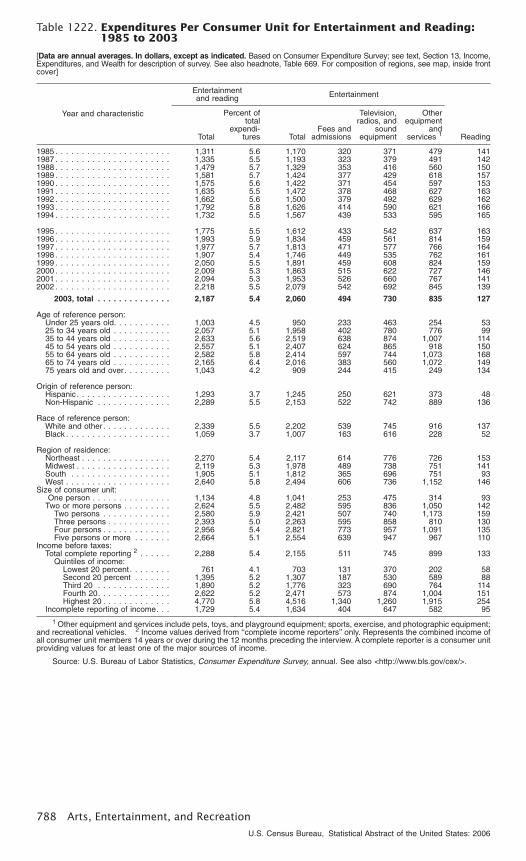
Table 1222. Expenditures Per Consumer Unit for Entertainment and Reading:1985 to 2003
[Data are annual averages. In dollars, except as indicated. Based on Consumer Expenditure Survey; see text, Section 13, Income,Expenditures, and Wealth for description of survey. See also headnote, Table 669. For composition of regions, see map, inside frontcover]
Year and characteristic
Entertainmentand reading Entertainment
ReadingTotal
Percent oftotal
expendi-tures Total
Fees andadmissions
Television,radios, and
soundequipment
Otherequipment
andservices 1
1985 . . . . . . . . . . . . . . . . . . . . . . 1,311 5.6 1,170 320 371 479 1411987 . . . . . . . . . . . . . . . . . . . . . . 1,335 5.5 1,193 323 379 491 1421988 . . . . . . . . . . . . . . . . . . . . . . 1,479 5.7 1,329 353 416 560 1501989 . . . . . . . . . . . . . . . . . . . . . . 1,581 5.7 1,424 377 429 618 1571990 . . . . . . . . . . . . . . . . . . . . . . 1,575 5.6 1,422 371 454 597 1531991 . . . . . . . . . . . . . . . . . . . . . . 1,635 5.5 1,472 378 468 627 1631992 . . . . . . . . . . . . . . . . . . . . . . 1,662 5.6 1,500 379 492 629 1621993 . . . . . . . . . . . . . . . . . . . . . . 1,792 5.8 1,626 414 590 621 1661994 . . . . . . . . . . . . . . . . . . . . . . 1,732 5.5 1,567 439 533 595 165
1995 . . . . . . . . . . . . . . . . . . . . . . 1,775 5.5 1,612 433 542 637 1631996 . . . . . . . . . . . . . . . . . . . . . . 1,993 5.9 1,834 459 561 814 1591997 . . . . . . . . . . . . . . . . . . . . . . 1,977 5.7 1,813 471 577 766 1641998 . . . . . . . . . . . . . . . . . . . . . . 1,907 5.4 1,746 449 535 762 1611999 . . . . . . . . . . . . . . . . . . . . . . 2,050 5.5 1,891 459 608 824 1592000 . . . . . . . . . . . . . . . . . . . . . . 2,009 5.3 1,863 515 622 727 1462001 . . . . . . . . . . . . . . . . . . . . . . 2,094 5.3 1,953 526 660 767 1412002 . . . . . . . . . . . . . . . . . . . . . . 2,218 5.5 2,079 542 692 845 139
2003, total . . . . . . . . . . . . . . 2,187 5.4 2,060 494 730 835 127
Age of reference person:Under 25 years old. . . . . . . . . . . 1,003 4.5 950 233 463 254 5325 to 34 years old . . . . . . . . . . . 2,057 5.1 1,958 402 780 776 9935 to 44 years old . . . . . . . . . . . 2,633 5.6 2,519 638 874 1,007 11445 to 54 years old . . . . . . . . . . . 2,557 5.1 2,407 624 865 918 15055 to 64 years old . . . . . . . . . . . 2,582 5.8 2,414 597 744 1,073 16865 to 74 years old . . . . . . . . . . . 2,165 6.4 2,016 383 560 1,072 14975 years old and over . . . . . . . . . 1,043 4.2 909 244 415 249 134
Origin of reference person:Hispanic . . . . . . . . . . . . . . . . . . 1,293 3.7 1,245 250 621 373 48Non-Hispanic . . . . . . . . . . . . . . 2,289 5.5 2,153 522 742 889 136
Race of reference person:White and other . . . . . . . . . . . . . 2,339 5.5 2,202 539 745 916 137Black . . . . . . . . . . . . . . . . . . . . 1,059 3.7 1,007 163 616 228 52
Region of residence:Northeast . . . . . . . . . . . . . . . . . 2,270 5.4 2,117 614 776 726 153Midwest . . . . . . . . . . . . . . . . . . 2,119 5.3 1,978 489 738 751 141South . . . . . . . . . . . . . . . . . . . 1,905 5.1 1,812 365 696 751 93West . . . . . . . . . . . . . . . . . . . . 2,640 5.8 2,494 606 736 1,152 146
Size of consumer unit:One person . . . . . . . . . . . . . . . 1,134 4.8 1,041 253 475 314 93
Two or more persons . . . . . . . . . 2,624 5.5 2,482 595 836 1,050 142Two persons . . . . . . . . . . . . . 2,580 5.9 2,421 507 740 1,173 159Three persons . . . . . . . . . . . . 2,393 5.0 2,263 595 858 810 130Four persons . . . . . . . . . . . . . 2,956 5.4 2,821 773 957 1,091 135Five persons or more . . . . . . . 2,664 5.1 2,554 639 947 967 110
Income before taxes:Total complete reporting 2 . . . . . . 2,288 5.4 2,155 511 745 899 133
Quintiles of income:Lowest 20 percent . . . . . . . . 761 4.1 703 131 370 202 58Second 20 percent . . . . . . . 1,395 5.2 1,307 187 530 589 88Third 20 . . . . . . . . . . . . . . 1,890 5.2 1,776 323 690 764 114Fourth 20. . . . . . . . . . . . . . 2,622 5.2 2,471 573 874 1,004 151Highest 20 . . . . . . . . . . . . . 4,770 5.8 4,516 1,340 1,260 1,915 254
Incomplete reporting of income. . . 1,729 5.4 1,634 404 647 582 95
1 Other equipment and services include pets, toys, and playground equipment; sports, exercise, and photographic equipment;and recreational vehicles. 2 Income values derived from ‘‘complete income reporters’’ only. Represents the combined income ofall consumer unit members 14 years or over during the 12 months preceding the interview. A complete reporter is a consumer unitproviding values for at least one of the major sources of income.
Source: U.S. Bureau of Labor Statistics, Consumer Expenditure Survey, annual. See also <http://www.bls.gov/cex/>.
788 Arts, Entertainment, and Recreation
U.S. Census Bureau, Statistical Abstract of the United States: 2006

Table 1223. Personal Consumption Expenditures for Recreation: 1990 to 2003[In billions of dollars (290.2 represents $290,200,000,000), except percent. Represents market value of purchases of goodsand services by individuals and nonprofit institutions. See also headnote from Table 418]
Type of product or service 1990 1995 1999 2000 2001 2002 2003
Total recreation expenditures . . . . . . . . . . . . . . . . . 290.2 418.1 546.1 585.7 604.0 628.3 660.7Percent of total personal consumption 1 . . . . . . . . . . . 7.6 8.4 8.7 8.7 8.6 8.5 8.5
Books and maps . . . . . . . . . . . . . . . . . . . . . . . . . . . . . . 16.2 23.2 31.5 33.7 34.6 36.9 38.5Magazines, newspapers, and sheet music . . . . . . . . . . . . . 21.6 27.5 33.5 35.0 35.0 35.3 36.6Nondurable toys and sport supplies . . . . . . . . . . . . . . . . . . 32.8 44.4 54.7 56.6 57.6 59.0 60.2Wheel goods, sports and photographic equipment 2 . . . . . . . 29.7 39.7 52.6 57.6 59.2 60.6 68.0Video and audio products, computer equipment, andmusical instruments . . . . . . . . . . . . . . . . . . . . . . . . . . . 53.0 81.5 108.1 116.6 115.5 119.1 121.3Video and audio goods, including musical instruments . . . . 44.1 57.2 67.8 72.8 73.6 74.9 75.2
Computers, peripherals, and software . . . . . . . . . . . . . 8.9 24.3 40.4 43.8 42.0 44.2 46.1Radio and television repair. . . . . . . . . . . . . . . . . . . . . . . . 3.2 3.6 4.1 4.2 4.0 4.0 4.0Flowers, seeds, and potted plants . . . . . . . . . . . . . . . . . . . 10.9 14.0 17.1 18.0 18.0 18.0 18.8Admissions to specified spectator amusements . . . . . . . . . . 15.1 21.1 28.4 30.4 32.2 34.6 35.6
Motion picture theaters . . . . . . . . . . . . . . . . . . . . . . . . 5.1 5.6 7.9 8.6 9.0 9.6 9.9Legitimate theaters and opera, and entertainmentsof nonprofit institutions 3 . . . . . . . . . . . . . . . . . . . . . . . 5.2 8.1 9.9 10.3 10.9 11.5 11.6
Spectator sports 4 . . . . . . . . . . . . . . . . . . . . . . . . . . . . 4.8 7.4 10.6 11.5 12.4 13.5 14.1Clubs and fraternal organizations except insurance 5 . . . . . . 13.5 17.4 18.0 19.0 20.0 21.1 22.1Commercial participant amusements 6 . . . . . . . . . . . . . . . . 25.2 48.8 68.8 75.8 79.6 83.5 89.2Pari-mutuel net receipts. . . . . . . . . . . . . . . . . . . . . . . . . . 3.5 3.7 4.9 5.0 5.1 5.3 5.3Other 7 . . . . . . . . . . . . . . . . . . . . . . . . . . . . . . . . . . . . . 65.4 93.4 124.3 133.9 143.2 151.1 160.9
1 See Table 658. 2 Includes boats and pleasure aircraft. 3 Except athletic. 4 Consists of admissions to professional andamateur athletic events and to racetracks, including horse, dog, and auto. 5 Consists of current expenditures (includingconsumption of fixed capital) of nonprofit clubs and fraternal organizations and dues and fees paid to proprietary clubs.6 Consists of billiard parlors; bowling alleys; dancing, riding, shooting, skating, and swimming places; amusement devices andparks; golf courses; sightseeing buses and guides; private flying operations; casino gambling; and other commercial participantamusements. 7 Consists of net receipts of lotteries and expenditures for purchases of pets and pet care services, cable TV, filmprocessing, photographic studios, sporting and recreation camps, video cassette rentals, and recreational services, not elsewhereclassified.
Source: U.S. Department of Commerce, Bureau of Economic Analysis, National Income and Product Accounts, 1929−2003;and Survey of Current Business. See also <http://www.bea.doc.gov/bea/dn/nipaweb/selecttable.asp?selected=N> (revised as 5August 2004).
Table 1224. Performing Arts—Selected Data: 1985 to 2003[Sales, receipts and expenditures in millions of dollars (209 represents $209,000,000). For season ending in year shown,except as indicated]
Item 1985 1990 1995 1997 1998 1999 2000 2001 2002 2003
Legitimate theater: 1
Broadway shows:New productions . . . . . . . . . . . . 33 40 33 37 33 39 37 28 37 36Attendance (mil.) . . . . . . . . . . . . 7.3 8.0 9.0 10.6 11.5 11.7 11.4 11.9 11.0 11.4Playing weeks 2, 3 . . . . . . . . . . . 1,078 1,070 1,120 1,349 1,442 1,441 1,464 1,484 1,434 1,544Gross ticket sales . . . . . . . . . . . 209 282 406 499 558 588 603 666 643 721
Broadway road tours:Attendance (mil.) . . . . . . . . . . . . 8.2 11.1 15.6 17.6 15.2 14.6 11.7 11.0 11.7 12.4Playing weeks. . . . . . . . . . . . . . 993 944 1,242 1,334 1,127 1,082 888 823 863 877Gross ticket sales . . . . . . . . . . . 226 367 701 782 721 707 572 541 593 642
Nonprofit professional theatres: 4
Companies reporting 5 . . . . . . . . . . 217 185 215 197 189 313 262 363 1,146 1,274Gross income. . . . . . . . . . . . . . . . 234.7 307.6 444.4 565.0 570.0 740.0 791.0 961.1 1,436.0 1,481.0
Earned income . . . . . . . . . . . . . 146.1 188.4 281.2 349.9 342.0 442.0 466.0 554.5 761.0 787.0Contributed income . . . . . . . . . . 88.6 119.2 163.1 215.1 228.0 298.0 325.0 406.6 675.0 694.0
Gross expenses . . . . . . . . . . . . . . 239.3 306.3 444.9 526.6 518.5 701.0 708.0 923.6 1,405.0 1,476.0Productions . . . . . . . . . . . . . . . . . 2,710 2,265 2,646 2,295 2,135 3,921 3,241 4,787 10,000 13,000Performances. . . . . . . . . . . . . . . . 52,341 46,131 56,608 51,453 46,628 64,556 66,123 81,828 157,000 170,000Total attendance (mil.) . . . . . . . . . . 14.2 15.2 18.6 17.2 14.6 18.0 22.0 21.1 32.2 34.3
OPERA America professionalmember companies: 6
Number of companies reporting7 . . . 97 98 88 91 89 95 98 96 86 89Expenses 7 . . . . . . . . . . . . . . . . . 216.4 321.2 435.0 534.1 556.3 591.1 636.7 685.1 684.4 691.6Performances 8 . . . . . . . . . . . . . . 1,909 2,336 2,251 2,137 2,222 2,200 2,153 2,031 1,868.0 1,730Total attendance (mil.) 8, 9 . . . . . . . 6.7 7.5 6.5 6.9 6.6 6.6 6.7 6.5 4.9 5.9Main season attendance (mil.) 8, 10 . 3.3 4.1 3.9 4.0 3.7 4.0 4.3 4.2 3.2 3.1
Symphony orchestras: 11
Concerts . . . . . . . . . . . . . . . . . . . 19,573 18,931 29,328 26,906 31,766 31,549 33,154 36,437 37,118 38,182Attendance (mil.). . . . . . . . . . . . . . 24.0 24.7 30.9 31.9 32.2 30.8 31.7 31.5 30.3 27.8Gross revenue . . . . . . . . . . . . . . . 252.4 377.5 536.2 575.5 627.6 671.8 734.0 774.7 763.6 781.2Operating expenses . . . . . . . . . . . 426.1 621.7 858.8 937.1 1,012.0 1,088.0 1,126.3 1,285.9 1,311.9 1,314.8Support . . . . . . . . . . . . . . . . . . . . 188.1 257.8 351.0 401.1 459.7 486.0 521.0 559.6 580.0 575.7
1 Source: The League of American Theaters and Producers, Inc, New York, NY. For season ending in year shown. 2 Allshows (new productions and holdovers from previous seasons). 3 Eight performances constitute one playing week. 4 Source:Theatre Communications Group, New York, NY. For years ending on or prior to August 31. 5 Beginning in 2002, nonprofit theatredata is based on survey responses and extrapolated data from IRS Form 990. 6 Source: OPERA America, Washington, DC. Foryears ending on or prior to August 31. 7 U.S. companies. 8 Prior to 1993, and for 1999, U.S. and Canadian companies; 1993to 1998, U.S. companies only, ‘‘2000 - 2004 U.S. companies only’’. 9 Includes educational performances, outreach, etc. 10 Forpaid performances. 11 Source: American Symphony Orchestra League, Inc., New York, NY. For years ending August 31. Priorto 1995, represents 254 U.S. orchestras; beginning 1995, represents all U.S. orchestras, excluding college/university and youthorchestras. Also, beginning 1995, data based on 1,200 orchestras.
Source: Compiled from sources listed in footnotes; <http://www.broadway.org>; <http://www.tcg.org>; <http://www.operaam.org>;<http://www.symphony.org>.
Arts, Entertainment, and Recreation 789
U.S. Census Bureau, Statistical Abstract of the United States: 2006
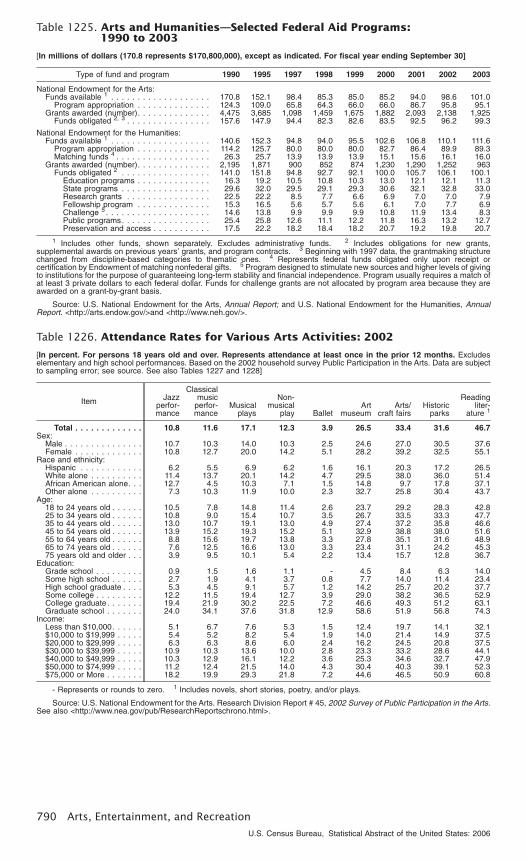
Table 1225. Arts and Humanities—Selected Federal Aid Programs:1990 to 2003
[In millions of dollars (170.8 represents $170,800,000), except as indicated. For fiscal year ending September 30]
Type of fund and program 1990 1995 1997 1998 1999 2000 2001 2002 2003
National Endowment for the Arts:Funds available 1 . . . . . . . . . . . . . . . . . . . 170.8 152.1 98.4 85.3 85.0 85.2 94.0 98.6 101.0
Program appropriation . . . . . . . . . . . . . . 124.3 109.0 65.8 64.3 66.0 66.0 86.7 95.8 95.1Grants awarded (number). . . . . . . . . . . . . . 4,475 3,685 1,098 1,459 1,675 1,882 2,093 2,138 1,925
Funds obligated 2, 3 . . . . . . . . . . . . . . . . 157.6 147.9 94.4 82.3 82.6 83.5 92.5 96.2 99.3
National Endowment for the Humanities:Funds available 1 . . . . . . . . . . . . . . . . . . . 140.6 152.3 94.8 94.0 95.5 102.6 106.8 110.1 111.6
Program appropriation . . . . . . . . . . . . . . 114.2 125.7 80.0 80.0 80.0 82.7 86.4 89.9 89.3Matching funds 4 . . . . . . . . . . . . . . . . . . 26.3 25.7 13.9 13.9 13.9 15.1 15.6 16.1 16.0
Grants awarded (number). . . . . . . . . . . . . . 2,195 1,871 900 852 874 1,230 1,290 1,252 963Funds obligated 2 . . . . . . . . . . . . . . . . . 141.0 151.8 94.8 92.7 92.1 100.0 105.7 106.1 100.1
Education programs . . . . . . . . . . . . . . 16.3 19.2 10.5 10.8 10.3 13.0 12.1 12.1 11.3State programs . . . . . . . . . . . . . . . . . 29.6 32.0 29.5 29.1 29.3 30.6 32.1 32.8 33.0Research grants . . . . . . . . . . . . . . . . 22.5 22.2 8.5 7.7 6.6 6.9 7.0 7.0 7.9Fellowship program . . . . . . . . . . . . . . 15.3 16.5 5.6 5.7 5.6 6.1 7.0 7.7 6.9Challenge 5 . . . . . . . . . . . . . . . . . . . . 14.6 13.8 9.9 9.9 9.9 10.8 11.9 13.4 8.3Public programs. . . . . . . . . . . . . . . . . 25.4 25.8 12.6 11.1 12.2 11.8 16.3 13.2 12.7Preservation and access . . . . . . . . . . . 17.5 22.2 18.2 18.4 18.2 20.7 19.2 19.8 20.7
1 Includes other funds, shown separately. Excludes administrative funds. 2 Includes obligations for new grants,supplemental awards on previous years’ grants, and program contracts. 3 Beginning with 1997 data, the grantmaking structurechanged from discipline-based categories to thematic ones. 4 Represents federal funds obligated only upon receipt orcertification by Endowment of matching nonfederal gifts. 5 Program designed to stimulate new sources and higher levels of givingto institutions for the purpose of guaranteeing long-term stability and financial independence. Program usually requires a match ofat least 3 private dollars to each federal dollar. Funds for challenge grants are not allocated by program area because they areawarded on a grant-by-grant basis.
Source: U.S. National Endowment for the Arts, Annual Report; and U.S. National Endowment for the Humanities, AnnualReport. <http://arts.endow.gov/>and <http://www.neh.gov/>.
Table 1226. Attendance Rates for Various Arts Activities: 2002
[In percent. For persons 18 years old and over. Represents attendance at least once in the prior 12 months. Excludeselementary and high school performances. Based on the 2002 household survey Public Participation in the Arts. Data are subjectto sampling error; see source. See also Tables 1227 and 1228]
Item Jazzperfor-mance
Classicalmusic
perfor-mance
Musicalplays
Non-musical
play BalletArt
museumArts/
craft fairsHistoric
parks
Readingliter-
ature 1
Total . . . . . . . . . . . . . 10.8 11.6 17.1 12.3 3.9 26.5 33.4 31.6 46.7Sex:
Male . . . . . . . . . . . . . . . 10.7 10.3 14.0 10.3 2.5 24.6 27.0 30.5 37.6Female . . . . . . . . . . . . . 10.8 12.7 20.0 14.2 5.1 28.2 39.2 32.5 55.1
Race and ethnicity:Hispanic . . . . . . . . . . . . 6.2 5.5 6.9 6.2 1.6 16.1 20.3 17.2 26.5White alone . . . . . . . . . . 11.4 13.7 20.1 14.2 4.7 29.5 38.0 36.0 51.4African American alone. . . 12.7 4.5 10.3 7.1 1.5 14.8 9.7 17.8 37.1Other alone . . . . . . . . . . 7.3 10.3 11.9 10.0 2.3 32.7 25.8 30.4 43.7
Age:18 to 24 years old . . . . . . 10.5 7.8 14.8 11.4 2.6 23.7 29.2 28.3 42.825 to 34 years old . . . . . . 10.8 9.0 15.4 10.7 3.5 26.7 33.5 33.3 47.735 to 44 years old . . . . . . 13.0 10.7 19.1 13.0 4.9 27.4 37.2 35.8 46.645 to 54 years old . . . . . . 13.9 15.2 19.3 15.2 5.1 32.9 38.8 38.0 51.655 to 64 years old . . . . . . 8.8 15.6 19.7 13.8 3.3 27.8 35.1 31.6 48.965 to 74 years old . . . . . . 7.6 12.5 16.6 13.0 3.3 23.4 31.1 24.2 45.375 years old and older . . . 3.9 9.5 10.1 5.4 2.2 13.4 15.7 12.8 36.7
Education:Grade school . . . . . . . . . 0.9 1.5 1.6 1.1 - 4.5 8.4 6.3 14.0Some high school . . . . . . 2.7 1.9 4.1 3.7 0.8 7.7 14.0 11.4 23.4High school graduate . . . . 5.3 4.5 9.1 5.7 1.2 14.2 25.7 20.2 37.7Some college . . . . . . . . . 12.2 11.5 19.4 12.7 3.9 29.0 38.2 36.5 52.9College graduate. . . . . . . 19.4 21.9 30.2 22.5 7.2 46.6 49.3 51.2 63.1Graduate school . . . . . . . 24.0 34.1 37.6 31.8 12.9 58.6 51.9 56.8 74.3
Income:Less than $10,000. . . . . . 5.1 6.7 7.6 5.3 1.5 12.4 19.7 14.1 32.1$10,000 to $19,999 . . . . . 5.4 5.2 8.2 5.4 1.9 14.0 21.4 14.9 37.5$20,000 to $29,999 . . . . . 6.3 6.3 8.6 6.0 2.4 16.2 24.5 20.8 37.5$30,000 to $39,999 . . . . . 10.9 10.3 13.6 10.0 2.8 23.3 33.2 28.6 44.1$40,000 to $49,999 . . . . . 10.3 12.9 16.1 12.2 3.6 25.3 34.6 32.7 47.9$50,000 to $74,999 . . . . . 11.2 12.4 21.5 14.0 4.3 30.4 40.3 39.1 52.3$75,000 or More . . . . . . . 18.2 19.9 29.3 21.8 7.2 44.6 46.5 50.9 60.8
- Represents or rounds to zero. 1 Includes novels, short stories, poetry, and/or plays.
Source: U.S. National Endowment for the Arts. Research Division Report # 45, 2002 Survey of Public Participation in the Arts.See also <http://www.nea.gov/pub/ResearchReportschrono.html>.
790 Arts, Entertainment, and Recreation
U.S. Census Bureau, Statistical Abstract of the United States: 2006
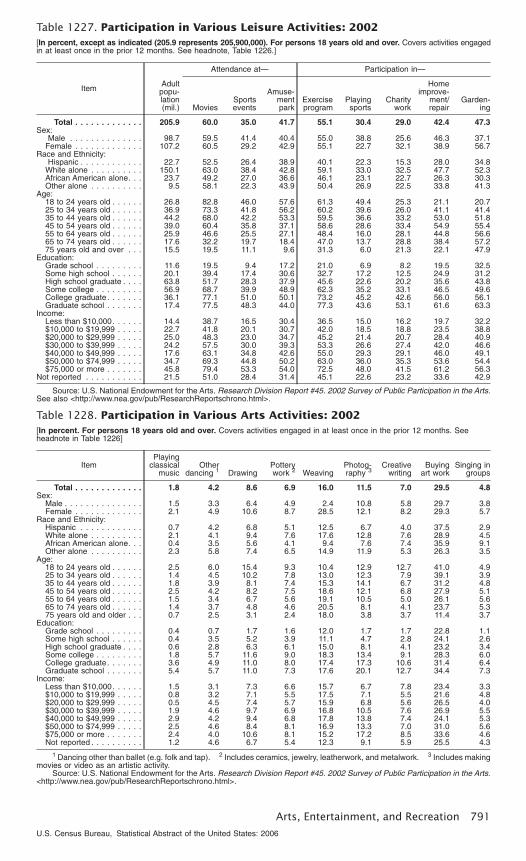
Table 1227. Participation in Various Leisure Activities: 2002[In percent, except as indicated (205.9 represents 205,900,000). For persons 18 years old and over. Covers activities engagedin at least once in the prior 12 months. See headnote, Table 1226.]
ItemAdult
popu-lation(mil.)
Attendance at— Participation in—
MoviesSportsevents
Amuse-mentpark
Exerciseprogram
Playingsports
Charitywork
Homeimprove-
ment/repair
Garden-ing
Total . . . . . . . . . . . . . 205.9 60.0 35.0 41.7 55.1 30.4 29.0 42.4 47.3Sex:
Male . . . . . . . . . . . . . . 98.7 59.5 41.4 40.4 55.0 38.8 25.6 46.3 37.1Female . . . . . . . . . . . . . 107.2 60.5 29.2 42.9 55.1 22.7 32.1 38.9 56.7
Race and Ethnicity:Hispanic . . . . . . . . . . . . 22.7 52.5 26.4 38.9 40.1 22.3 15.3 28.0 34.8
White alone . . . . . . . . . . 150.1 63.0 38.4 42.8 59.1 33.0 32.5 47.7 52.3African American alone. . . 23.7 49.2 27.0 36.6 46.1 23.1 22.7 26.3 30.3Other alone . . . . . . . . . . 9.5 58.1 22.3 43.9 50.4 26.9 22.5 33.8 41.3
Age:18 to 24 years old . . . . . . 26.8 82.8 46.0 57.6 61.3 49.4 25.3 21.1 20.725 to 34 years old . . . . . . 36.9 73.3 41.8 56.2 60.2 39.6 26.0 41.1 41.435 to 44 years old . . . . . . 44.2 68.0 42.2 53.3 59.5 36.6 33.2 53.0 51.845 to 54 years old . . . . . . 39.0 60.4 35.8 37.1 58.6 28.6 33.4 54.9 55.455 to 64 years old . . . . . . 25.9 46.6 25.5 27.1 48.4 16.0 28.1 44.8 56.665 to 74 years old . . . . . . 17.6 32.2 19.7 18.4 47.0 13.7 28.8 38.4 57.275 years old and over . . . 15.5 19.5 11.1 9.6 31.3 6.0 21.3 22.1 47.9
Education:Grade school . . . . . . . . . 11.6 19.5 9.4 17.2 21.0 6.9 8.2 19.5 32.5Some high school . . . . . . 20.1 39.4 17.4 30.6 32.7 17.2 12.5 24.9 31.2High school graduate . . . . 63.8 51.7 28.3 37.9 45.6 22.6 20.2 35.6 43.8Some college . . . . . . . . . 56.9 68.7 39.9 48.9 62.3 35.2 33.1 46.5 49.6College graduate. . . . . . . 36.1 77.1 51.0 50.1 73.2 45.2 42.6 56.0 56.1Graduate school . . . . . . . 17.4 77.5 48.3 44.0 77.3 43.6 53.1 61.6 63.3
Income:Less than $10,000. . . . . . 14.4 38.7 16.5 30.4 36.5 15.0 16.2 19.7 32.2$10,000 to $19,999 . . . . . 22.7 41.8 20.1 30.7 42.0 18.5 18.8 23.5 38.8$20,000 to $29,999 . . . . . 25.0 48.3 23.0 34.7 45.2 21.4 20.7 28.4 40.9$30,000 to $39,999 . . . . . 24.2 57.5 30.0 39.3 53.3 26.6 27.4 42.0 46.6$40,000 to $49,999 . . . . . 17.6 63.1 34.8 42.6 55.0 29.3 29.1 46.0 49.1$50,000 to $74,999 . . . . . 34.7 69.3 44.8 50.2 63.0 36.0 35.3 53.6 54.4$75,000 or more . . . . . . . 45.8 79.4 53.3 54.0 72.5 48.0 41.5 61.2 56.3
Not reported . . . . . . . . . . . 21.5 51.0 28.4 31.4 45.1 22.6 23.2 33.6 42.9
Source: U.S. National Endowment for the Arts. Research Division Report #45. 2002 Survey of Public Participation in the Arts.See also <http://www.nea.gov/pub/ResearchReportschrono.html>.
Table 1228. Participation in Various Arts Activities: 2002[In percent. For persons 18 years old and over. Covers activities engaged in at least once in the prior 12 months. Seeheadnote in Table 1226]
ItemPlaying
classicalmusic
Otherdancing 1 Drawing
Potterywork 2 Weaving
Photog-raphy 3
Creativewriting
Buyingart work
Singing ingroups
Total . . . . . . . . . . . . . 1.8 4.2 8.6 6.9 16.0 11.5 7.0 29.5 4.8Sex:
Male . . . . . . . . . . . . . . . 1.5 3.3 6.4 4.9 2.4 10.8 5.8 29.7 3.8Female . . . . . . . . . . . . . 2.1 4.9 10.6 8.7 28.5 12.1 8.2 29.3 5.7
Race and Ethnicity:Hispanic . . . . . . . . . . . . 0.7 4.2 6.8 5.1 12.5 6.7 4.0 37.5 2.9White alone . . . . . . . . . . 2.1 4.1 9.4 7.6 17.6 12.8 7.6 28.9 4.5African American alone. . . 0.4 3.5 5.6 4.1 9.4 7.6 7.4 35.9 9.1Other alone . . . . . . . . . . 2.3 5.8 7.4 6.5 14.9 11.9 5.3 26.3 3.5
Age:18 to 24 years old . . . . . . 2.5 6.0 15.4 9.3 10.4 12.9 12.7 41.0 4.925 to 34 years old . . . . . . 1.4 4.5 10.2 7.8 13.0 12.3 7.9 39.1 3.935 to 44 years old . . . . . . 1.8 3.9 8.1 7.4 15.3 14.1 6.7 31.2 4.845 to 54 years old . . . . . . 2.5 4.2 8.2 7.5 18.6 12.1 6.8 27.9 5.155 to 64 years old . . . . . . 1.5 3.4 6.7 5.6 19.1 10.5 5.0 26.1 5.665 to 74 years old . . . . . . 1.4 3.7 4.8 4.6 20.5 8.1 4.1 23.7 5.375 years old and older . . . 0.7 2.5 3.1 2.4 18.0 3.8 3.7 11.4 3.7
Education:Grade school . . . . . . . . . 0.4 0.7 1.7 1.6 12.0 1.7 1.7 22.8 1.1Some high school . . . . . . 0.4 3.5 5.2 3.9 11.1 4.7 2.8 24.1 2.6High school graduate . . . . 0.6 2.8 6.3 6.1 15.0 8.1 4.1 23.2 3.4Some college . . . . . . . . . 1.8 5.7 11.6 9.0 18.3 13.4 9.1 28.3 6.0College graduate. . . . . . . 3.6 4.9 11.0 8.0 17.4 17.3 10.6 31.4 6.4Graduate school . . . . . . . 5.4 5.7 11.0 7.3 17.6 20.1 12.7 34.4 7.3
Income:Less than $10,000. . . . . . 1.5 3.1 7.3 6.6 15.7 6.7 7.8 23.4 3.3$10,000 to $19,999 . . . . . 0.8 3.2 7.1 5.5 17.5 7.1 5.5 21.6 4.8$20,000 to $29,999 . . . . . 0.5 4.5 7.4 5.7 15.9 6.8 5.6 26.5 4.0$30,000 to $39,999 . . . . . 1.9 4.6 9.7 6.9 16.8 10.5 7.6 26.9 5.5$40,000 to $49,999 . . . . . 2.9 4.2 9.4 6.8 17.8 13.8 7.4 24.1 5.3$50,000 to $74,999 . . . . . 2.5 4.6 8.4 8.1 16.9 13.3 7.0 31.0 5.6$75,000 or more . . . . . . . 2.4 4.0 10.6 8.1 15.2 17.2 8.5 33.6 4.6Not reported . . . . . . . . . . 1.2 4.6 6.7 5.4 12.3 9.1 5.9 25.5 4.3
1 Dancing other than ballet (e.g. folk and tap). 2 Includes ceramics, jewelry, leatherwork, and metalwork. 3 Includes makingmovies or video as an artistic activity.
Source: U.S. National Endowment for the Arts. Research Division Report #45. 2002 Survey of Public Participation in the Arts.<http://www.nea.gov/pub/ResearchReportschrono.html>.
Arts, Entertainment, and Recreation 791
U.S. Census Bureau, Statistical Abstract of the United States: 2006
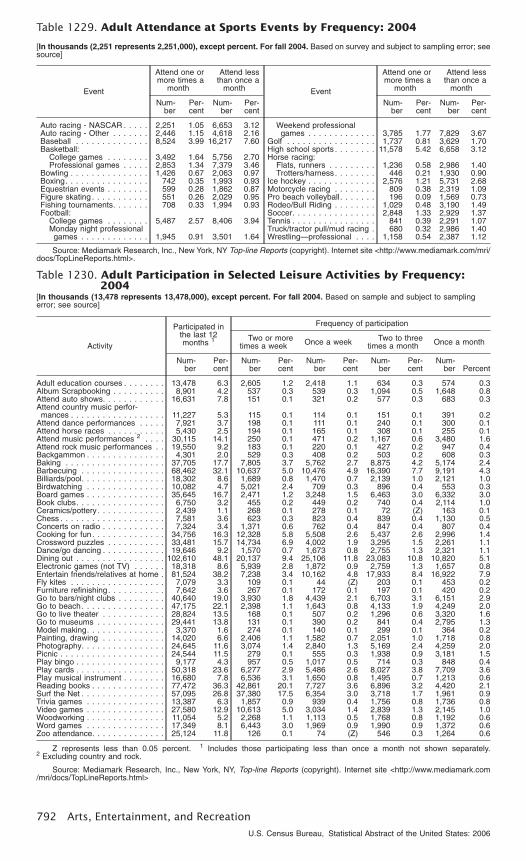
Table 1229. Adult Attendance at Sports Events by Frequency: 2004
[In thousands (2,251 represents 2,251,000), except percent. For fall 2004. Based on survey and subject to sampling error; seesource]
Event
Attend one ormore times a
month
Attend lessthan once a
month
Num-ber
Per-cent
Num-ber
Per-cent
Auto racing - NASCAR . . . . . 2,251 1.05 6,653 3.12Auto racing - Other . . . . . . . 2,446 1.15 4,618 2.16Baseball . . . . . . . . . . . . . . 8,524 3.99 16,217 7.60Basketball:
College games . . . . . . . . 3,492 1.64 5,756 2.70Professional games . . . . . 2,853 1.34 7,379 3.46
Bowling . . . . . . . . . . . . . . . 1,426 0.67 2,063 0.97Boxing. . . . . . . . . . . . . . . . 742 0.35 1,993 0.93Equestrian events . . . . . . . . 599 0.28 1,862 0.87Figure skating . . . . . . . . . . . 551 0.26 2,029 0.95Fishing tournaments. . . . . . . 708 0.33 1,994 0.93Football:
College games . . . . . . . . 5,487 2.57 8,406 3.94Monday night professionalgames . . . . . . . . . . . . . 1,945 0.91 3,501 1.64
Event
Attend one ormore times a
month
Attend lessthan once a
month
Num-ber
Per-cent
Num-ber
Per-cent
Weekend professionalgames . . . . . . . . . . . . . 3,785 1.77 7,829 3.67
Golf . . . . . . . . . . . . . . . . . 1,737 0.81 3,629 1.70High school sports . . . . . . . . 11,578 5.42 6,658 3.12Horse racing:
Flats, runners . . . . . . . . . 1,236 0.58 2,986 1.40Trotters/harness . . . . . . . . 446 0.21 1,930 0.90
Ice hockey . . . . . . . . . . . . . 2,576 1.21 5,731 2.68Motorcycle racing . . . . . . . . 809 0.38 2,319 1.09Pro beach volleyball. . . . . . . 196 0.09 1,569 0.73Rodeo/Bull Riding . . . . . . . . 1,029 0.48 3,190 1.49Soccer. . . . . . . . . . . . . . . . 2,848 1.33 2,929 1.37Tennis . . . . . . . . . . . . . . . . 841 0.39 2,291 1.07Truck/tractor pull/mud racing . 680 0.32 2,986 1.40Wrestling—professional . . . . 1,158 0.54 2,387 1.12
Source: Mediamark Research, Inc., New York, NY Top-line Reports (copyright). Internet site <http://www.mediamark.com/mri/docs/TopLineReports.html>.
Table 1230. Adult Participation in Selected Leisure Activities by Frequency:2004
[In thousands (13,478 represents 13,478,000), except percent. For fall 2004. Based on sample and subject to samplingerror; see source]
Activity
Participated inthe last 12months 1
Frequency of participation
Two or moretimes a week Once a week Two to three
times a month Once a month
Num-ber
Per-cent
Num-ber
Per-cent
Num-ber
Per-cent
Num-ber
Per-cent
Num-ber Percent
Adult education courses . . . . . . . . 13,478 6.3 2,605 1.2 2,418 1.1 634 0.3 574 0.3Album Scrapbooking . . . . . . . . . . 8,901 4.2 537 0.3 539 0.3 1,094 0.5 1,648 0.8Attend auto shows. . . . . . . . . . . . 16,631 7.8 151 0.1 321 0.2 577 0.3 683 0.3Attend country music perfor-mances . . . . . . . . . . . . . . . . . . 11,227 5.3 115 0.1 114 0.1 151 0.1 391 0.2
Attend dance performances . . . . . 7,921 3.7 198 0.1 111 0.1 240 0.1 300 0.1Attend horse races . . . . . . . . . . . 5,430 2.5 194 0.1 165 0.1 308 0.1 255 0.1Attend music performances 2 . . . . 30,115 14.1 250 0.1 471 0.2 1,167 0.6 3,480 1.6Attend rock music performances . . 19,550 9.2 183 0.1 220 0.1 427 0.2 947 0.4Backgammon . . . . . . . . . . . . . . . 4,301 2.0 529 0.3 408 0.2 503 0.2 608 0.3Baking . . . . . . . . . . . . . . . . . . . 37,705 17.7 7,805 3.7 5,762 2.7 8,875 4.2 5,174 2.4Barbecuing . . . . . . . . . . . . . . . . 68,462 32.1 10,637 5.0 10,476 4.9 16,390 7.7 9,191 4.3Billiards/pool. . . . . . . . . . . . . . . . 18,302 8.6 1,689 0.8 1,470 0.7 2,139 1.0 2,121 1.0Birdwatching . . . . . . . . . . . . . . . 10,082 4.7 5,021 2.4 709 0.3 896 0.4 553 0.3Board games . . . . . . . . . . . . . . . 35,645 16.7 2,471 1.2 3,248 1.5 6,463 3.0 6,332 3.0Book clubs. . . . . . . . . . . . . . . . . 6,750 3.2 455 0.2 449 0.2 740 0.4 2,114 1.0Ceramics/pottery . . . . . . . . . . . . . 2,439 1.1 268 0.1 278 0.1 72 (Z) 163 0.1Chess . . . . . . . . . . . . . . . . . . . . 7,581 3.6 623 0.3 823 0.4 839 0.4 1,130 0.5Concerts on radio . . . . . . . . . . . . 7,324 3.4 1,371 0.6 762 0.4 847 0.4 807 0.4Cooking for fun . . . . . . . . . . . . . . 34,756 16.3 12,328 5.8 5,508 2.6 5,437 2.6 2,996 1.4Crossword puzzles . . . . . . . . . . . 33,481 15.7 14,734 6.9 4,002 1.9 3,295 1.5 2,261 1.1Dance/go dancing . . . . . . . . . . . . 19,646 9.2 1,570 0.7 1,673 0.8 2,755 1.3 2,321 1.1Dining out . . . . . . . . . . . . . . . . . 102,610 48.1 20,137 9.4 25,106 11.8 23,083 10.8 10,820 5.1Electronic games (not TV) . . . . . . 18,318 8.6 5,939 2.8 1,872 0.9 2,759 1.3 1,657 0.8Entertain friends/relatives at home . 81,524 38.2 7,238 3.4 10,162 4.8 17,933 8.4 16,922 7.9Fly kites . . . . . . . . . . . . . . . . . . 7,079 3.3 109 0.1 44 (Z) 203 0.1 453 0.2Furniture refinishing . . . . . . . . . . . 7,642 3.6 267 0.1 172 0.1 197 0.1 420 0.2Go to bars/night clubs . . . . . . . . . 40,640 19.0 3,930 1.8 4,439 2.1 6,703 3.1 6,151 2.9Go to beach. . . . . . . . . . . . . . . . 47,175 22.1 2,398 1.1 1,643 0.8 4,133 1.9 4,249 2.0Go to live theater . . . . . . . . . . . . 28,824 13.5 168 0.1 507 0.2 1,296 0.6 3,320 1.6Go to museums . . . . . . . . . . . . . 29,441 13.8 131 0.1 390 0.2 841 0.4 2,795 1.3Model making. . . . . . . . . . . . . . . 3,370 1.6 274 0.1 140 0.1 299 0.1 364 0.2Painting, drawing . . . . . . . . . . . . 14,020 6.6 2,406 1.1 1,582 0.7 2,051 1.0 1,718 0.8Photography. . . . . . . . . . . . . . . . 24,645 11.6 3,074 1.4 2,840 1.3 5,169 2.4 4,259 2.0Picnic . . . . . . . . . . . . . . . . . . . . 24,544 11.5 279 0.1 555 0.3 1,938 0.9 3,181 1.5Play bingo . . . . . . . . . . . . . . . . . 9,177 4.3 957 0.5 1,017 0.5 714 0.3 848 0.4Play cards . . . . . . . . . . . . . . . . . 50,318 23.6 6,277 2.9 5,486 2.6 8,027 3.8 7,709 3.6Play musical instrument . . . . . . . . 16,680 7.8 6,536 3.1 1,650 0.8 1,495 0.7 1,213 0.6Reading books . . . . . . . . . . . . . . 77,472 36.3 42,861 20.1 7,727 3.6 6,896 3.2 4,420 2.1Surf the Net . . . . . . . . . . . . . . . . 57,095 26.8 37,380 17.5 6,354 3.0 3,718 1.7 1,961 0.9Trivia games . . . . . . . . . . . . . . . 13,387 6.3 1,857 0.9 939 0.4 1,756 0.8 1,736 0.8Video games . . . . . . . . . . . . . . . 27,580 12.9 10,613 5.0 3,034 1.4 2,839 1.3 2,145 1.0Woodworking . . . . . . . . . . . . . . . 11,054 5.2 2,268 1.1 1,113 0.5 1,768 0.8 1,192 0.6Word games . . . . . . . . . . . . . . . 17,349 8.1 6,443 3.0 1,969 0.9 1,990 0.9 1,372 0.6Zoo attendance. . . . . . . . . . . . . . 25,124 11.8 126 0.1 74 (Z) 546 0.3 1,264 0.6
Z represents less than 0.05 percent. 1 Includes those participating less than once a month not shown separately.2 Excluding country and rock.
Source: Mediamark Research, Inc., New York, NY, Top-line Reports (copyright). Internet site <http://www.mediamark.com/mri/docs/TopLineReports.html>
792 Arts, Entertainment, and Recreation
U.S. Census Bureau, Statistical Abstract of the United States: 2006
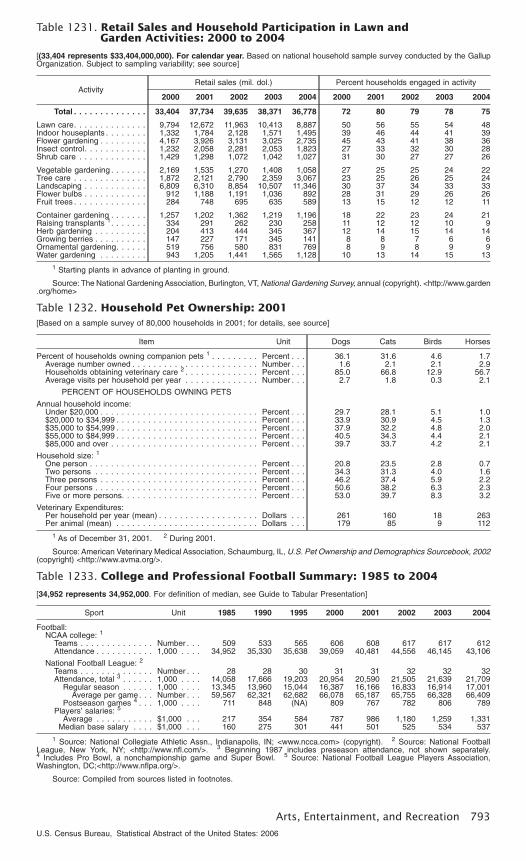
Table 1231. Retail Sales and Household Participation in Lawn andGarden Activities: 2000 to 2004
[(33,404 represents $33,404,000,000). For calendar year. Based on national household sample survey conducted by the GallupOrganization. Subject to sampling variability; see source]
ActivityRetail sales (mil. dol.) Percent households engaged in activity
2000 2001 2002 2003 2004 2000 2001 2002 2003 2004
Total . . . . . . . . . . . . . . 33,404 37,734 39,635 38,371 36,778 72 80 79 78 75
Lawn care. . . . . . . . . . . . . . 9,794 12,672 11,963 10,413 8,887 50 56 55 54 48Indoor houseplants . . . . . . . . 1,332 1,784 2,128 1,571 1,495 39 46 44 41 39Flower gardening . . . . . . . . . 4,167 3,926 3,131 3,025 2,735 45 43 41 38 36Insect control. . . . . . . . . . . . 1,232 2,058 2,281 2,053 1,823 27 33 32 30 28Shrub care . . . . . . . . . . . . . 1,429 1,298 1,072 1,042 1,027 31 30 27 27 26
Vegetable gardening . . . . . . . 2,169 1,535 1,270 1,408 1,058 27 25 25 24 22Tree care . . . . . . . . . . . . . . 1,872 2,121 2,790 2,359 3,067 23 25 26 25 24Landscaping . . . . . . . . . . . . 6,809 6,310 8,854 10,507 11,346 30 37 34 33 33Flower bulbs . . . . . . . . . . . . 912 1,188 1,191 1,036 892 28 31 29 26 26Fruit trees . . . . . . . . . . . . . . 284 748 695 635 589 13 15 12 12 11
Container gardening . . . . . . . 1,257 1,202 1,362 1,219 1,196 18 22 23 24 21Raising transplants 1. . . . . . . 334 291 262 230 258 11 12 12 10 9Herb gardening . . . . . . . . . . 204 413 444 345 367 12 14 15 14 14Growing berries . . . . . . . . . . 147 227 171 345 141 8 8 7 6 6Ornamental gardening. . . . . . 519 756 580 831 769 8 9 8 9 9Water gardening . . . . . . . . . 943 1,205 1,441 1,565 1,128 10 13 14 15 13
1 Starting plants in advance of planting in ground.
Source: The National Gardening Association, Burlington, VT, National Gardening Survey, annual (copyright). <http://www.garden.org/home>
Table 1232. Household Pet Ownership: 2001[Based on a sample survey of 80,000 households in 2001; for details, see source]
Item Unit Dogs Cats Birds Horses
Percent of households owning companion pets 1 . . . . . . . . . Percent . . . 36.1 31.6 4.6 1.7Average number owned . . . . . . . . . . . . . . . . . . . . . . . . Number . . . 1.6 2.1 2.1 2.9Households obtaining veterinary care 2 . . . . . . . . . . . . . . Percent . . . 85.0 66.8 12.9 56.7Average visits per household per year . . . . . . . . . . . . . . Number . . . 2.7 1.8 0.3 2.1
PERCENT OF HOUSEHOLDS OWNING PETS
Annual household income:Under $20,000 . . . . . . . . . . . . . . . . . . . . . . . . . . . . . . Percent . . . 29.7 28.1 5.1 1.0$20,000 to $34,999 . . . . . . . . . . . . . . . . . . . . . . . . . . . Percent . . . 33.9 30.9 4.5 1.3$35,000 to $54,999 . . . . . . . . . . . . . . . . . . . . . . . . . . . Percent . . . 37.9 32.2 4.8 2.0$55,000 to $84,999 . . . . . . . . . . . . . . . . . . . . . . . . . . . Percent . . . 40.5 34.3 4.4 2.1$85,000 and over . . . . . . . . . . . . . . . . . . . . . . . . . . . . Percent . . . 39.7 33.7 4.2 2.1
Household size: 1
One person . . . . . . . . . . . . . . . . . . . . . . . . . . . . . . . . Percent . . . 20.8 23.5 2.8 0.7Two persons . . . . . . . . . . . . . . . . . . . . . . . . . . . . . . . Percent . . . 34.3 31.3 4.0 1.6Three persons . . . . . . . . . . . . . . . . . . . . . . . . . . . . . . Percent . . . 46.2 37.4 5.9 2.2Four persons . . . . . . . . . . . . . . . . . . . . . . . . . . . . . . . Percent . . . 50.6 38.2 6.3 2.3Five or more persons. . . . . . . . . . . . . . . . . . . . . . . . . . Percent . . . 53.0 39.7 8.3 3.2
Veterinary Expenditures:Per household per year (mean) . . . . . . . . . . . . . . . . . . . Dollars . . . 261 160 18 263Per animal (mean) . . . . . . . . . . . . . . . . . . . . . . . . . . . Dollars . . . 179 85 9 112
1 As of December 31, 2001. 2 During 2001.
Source: American Veterinary Medical Association, Schaumburg, IL, U.S. Pet Ownership and Demographics Sourcebook, 2002(copyright) <http://www.avma.org/>.
Table 1233. College and Professional Football Summary: 1985 to 2004
[34,952 represents 34,952,000. For definition of median, see Guide to Tabular Presentation]
Sport Unit 1985 1990 1995 2000 2001 2002 2003 2004
Football:NCAA college: 1
Teams . . . . . . . . . . . . . . Number . . . 509 533 565 606 608 617 617 612Attendance . . . . . . . . . . . 1,000 . . . . 34,952 35,330 35,638 39,059 40,481 44,556 46,145 43,106
National Football League: 2
Teams . . . . . . . . . . . . . . Number . . . 28 28 30 31 31 32 32 32Attendance, total 3 . . . . . . 1,000 . . . . 14,058 17,666 19,203 20,954 20,590 21,505 21,639 21,709
Regular season . . . . . . 1,000 . . . . 13,345 13,960 15,044 16,387 16,166 16,833 16,914 17,001Average per game. . . Number . . . 59,567 62,321 62,682 66,078 65,187 65,755 66,328 66,409
Postseason games 4 . . . 1,000 . . . . 711 848 (NA) 809 767 782 806 789Players’ salaries: 5
Average . . . . . . . . . . . $1,000 . . . 217 354 584 787 986 1,180 1,259 1,331Median base salary . . . . $1,000 . . . 160 275 301 441 501 525 534 537
1 Source: National Collegiate Athletic Assn., Indianapolis, IN; <www.ncca.com> (copyright). 2 Source: National FootballLeague, New York, NY; <http://www.nfl.com/>. 3 Beginning 1987 includes preseason attendance, not shown separately.4 Includes Pro Bowl, a nonchampionship game and Super Bowl. 5 Source: National Football League Players Association,Washington, DC;<http://www.nflpa.org/>.
Source: Compiled from sources listed in footnotes.
Arts, Entertainment, and Recreation 793
U.S. Census Bureau, Statistical Abstract of the United States: 2006

Table 1234. Selected Recreational Activities: 1985 to 2004[8,042 represents 8,042,000]
Activity Unit 1985 1990 1995 2000 2001 2002 2003 2004
Adult golfers (eight roundsor more) 1 2 . . . . . . . . . . . . . . 1,000 . . . 8,042 11,835 11,581 14,072 12,028 12,853 13,381 12,750
Golf facilities . . . . . . . . . . . . . . Number. . 12,346 12,846 14,074 15,489 15,689 15,827 15,899 16,057Tennis players 3 . . . . . . . . . . . . 1,000 . . . 13,000 21,000 17,820 22,900 22,000 23,200 24,100 24,000Tenpin bowling: 4
Establishments . . . . . . . . . . . Number. . 8,275 7,611 7,049 6,247 6,022 5,973 5,811 5,761.0Membership, total 5 . . . . . . . . 1,000 . . . 8,064 6,588 4,925 3,756 3,553 3,382 3,246 3,112.0
Skiing 6
Skier visits 7. . . . . . . . . . . . . Million. . . 51.4 50.0 52.7 52.2 57.3 54.4 57.6 57.1Operating resorts . . . . . . . . . Number. . 727 591 520 503 490 493 490 494
Motion picture screens 8 . . . . . . 1,000 . . . 21 24 28 38 37 36 37 37Receipts, box office . . . . . . . . Mil. dol.. . 3,749 5,022 5,494 7,661 8,413 9,520 9,489 9,539Attendance . . . . . . . . . . . . . Million. . . 1,056 1,189 1,263 1,421 1,487 1,639 1,574 1,536
Boating: 9
Recreational boats owned 10 . . 1,000 . . . 13,778 15,987 15,375 16,820 17,030 17,340 17,360 17,610Retail expenditures onboating 11 . . . . . . . . . . . . . Mil. dol.. . 13,284 13,731 17,226 27,066 29,710 31,563 30,283 32,953
Retail units purchased:Total all boats 12 . . . . . . . . 1,000 . . . 675 525 664 577 880 844 838 870
Outboard boats . . . . . . . 1,000 . . . 305 227 231 241 218 212 207 217Inboard boats . . . . . . . . 1,000 . . . 17 15 12 24 22 22 19 20
1 Source: National Golf Foundation, Jupiter, FL. 2 Definition for golfer has changed to persons 18 years of age and over.Data for all the years shown have been revised. 3 Source: Tennis Industry Association, Hilton Head, SC. Players for persons 12years old and over who played at least once. 4 Source: Bowling Headquarters, Greendale, WI. 5 Membership totals are forU.S., Canada, and for U.S. military personnel worldwide. 6 Source: National Ski Areas Association, Kottke National End ofSeason Survey 2003/04, final report (copyright). 7 Represents one person visiting a ski area for all or any part of a day or nightfor the purpose of skiing, snowboarding or other downhill sliding. Data are estimated and are for the season ending in the yearshown. 8 Source: Motion Picture Association of America, Inc., Encino, CA. 9 Source: National Marine ManufacturersAssociation, Chicago, IL. (copyright). 10 2004 data are estimated. 11 Represents estimated expenditures for new and usedboats, motors and engines, accessories, safety equipment, fuel, insurance, docking, maintenance, launching, storage, repairs, andother expenses. 12 Includes other boats not shown separately.
Source: Compiled from sources listed in footnotes.
Table 1235. Selected Spectator Sports: 1985 to 2004[47,742 represents 47,742,000]
Sport Unit 1985 1990 1995 2000 2001 2002 2003 2004
Baseball, major leagues: 1
Attendance. . . . . . . . . . . . . 1,000 . . . 47,742 55,512 51,288 74,339 73,881 69,428 69,501 74,822Regular season . . . . . . . . 1,000 . . . 46,824 54,824 50,469 72,748 72,267 67,859 67,568 73,023
National League . . . . . . 1,000 . . . 22,292 24,492 25,110 39,851 39,558 36,949 36,661 40,221American League . . . . . 1,000 . . . 24,532 30,332 25,359 32,898 32,709 30,910 30,908 32,802
Playoffs 2 . . . . . . . . . . . . 1,000 . . . 591 479 533 1,314 1,247 1,262 1,568 1,625World Series . . . . . . . . . . 1,000 . . . 327 209 286 277 366 306 365 174
Players’ salaries: 3
Average . . . . . . . . . . . . . $1,000 . . 371 598 1,111 1,896 2,139 2,296 2,372 2,313Basketball: 4 5
NCAA—Men’s college:Teams . . . . . . . . . . . . . . Number. . 753 767 868 932 937 936 967 981Attendance . . . . . . . . . . . 1,000 . . . 26,584 28,741 28,548 29,025 28,949 29,395 30,124 30,761
NCAA—Women’s college:Teams . . . . . . . . . . . . . . Number. . 746 782 864 956 958 975 1,009 1,008Attendance . . . . . . . . . . . 1,000 . . . 2,072 2,777 4,962 8,698 8,825 9,533 10,164 10,016
Pro: 6
Teams . . . . . . . . . . . . . . Number. . 23 27 27 29 29 29 29 30Attendance, total . . . . . . . 1,000 . . . 11,534 18,586 19,883 21,503 21,436 21,571 21,760 22,953
Regular season . . . . . . 1,000 . . . 10,506 17,369 18,516 20,059 19,956 20,182 20,074 21,296Average per game. . . Number. . 11,141 15,690 16,727 16,870 16,784 16,974 16,883 17,314
Playoffs. . . . . . . . . . . . 1,000 . . . 985 1,203 1,347 1,427 1,460 1,370 1,685 1,639Average per game. . . Number. . 14,479 16,704 18,457 19,202 20,565 19,296 19,152 19,507
All-Star game. . . . . . . . Number. . 43,146 14,810 18,755 18,325 20,374 19,581 19,445 18,227National Hockey League: 7
Regular season attendance. . 1,000 . . . 11,634 12,580 9,234 18,800 20,373 20,615 20,409 22,065Playoffs attendance . . . . . . . 1,000 . . . 1,108 1,356 1,329 1,525 1,584 1,691 1,636 1,709
Professional rodeo: 8
Rodeos . . . . . . . . . . . . . . . Number. . 617 754 739 688 668 666 657 671Performances . . . . . . . . . . . Number. . 1,887 2,159 2,217 2,081 2,015 2,207 1,949 1,982Members . . . . . . . . . . . . . . Number. . 5,239 5,693 6,894 6,255 5,913 6,209 6,158 6,247Permit-holders (rookies) . . . . Number. . 2,534 3,290 3,835 3,249 2,544 2,543 3,121 2,990Total prize money . . . . . . . . Mil dol. . . 15.1 18.2 24.5 32.3 33.1 33.3 34.3 35.5
1 Source: Major League Baseball (previously, The National League of Professional Baseball Clubs), New York, NY, NationalLeague Green Book; and The American League of Professional Baseball Clubs, New York, NY, American League Red Book.2 Beginning 1997, two rounds of playoffs were played. Prior years had one round. 3 Source: Major League Baseball PlayersAssociation, New York, NY. 4 Season ending in year shown. 5 Source: National Collegiate Athletic Assn., Indianapolis, IN(copyright). For women’s attendance total, excludes double-headers with men’s teams. 6 Source: National Basketball Assn.,New York, NY. For season ending in year shown. 7 For season ending in year shown. Source: National Hockey League,Montreal, Quebec. 8 Source: Professional Rodeo Cowboys Association, Colorado Springs, CO., Official Professional RodeoMedia Guide, annual (copyright).
Source: Compiled from sources listed in footnotes.
794 Arts, Entertainment, and Recreation
U.S. Census Bureau, Statistical Abstract of the United States: 2006

Table 1236. High School Students Engaged in Organized Physical Activity bySex, Race and Hispanic Origin: 2003
[In percent. For students in grades 9 to 12. Based on the Youth Risk Behavior Survey, a school-based survey and subject tosampling error; for details see source]
Characteristic
Enrolled in physical education class
Played on a sportsteamTotal Attended daily
Exercised 20minutes or more per
class 1
All students. . . . . . . . . . . . 55.7 28.4 80.3 57.6
Male . . . . . . . . . . . . . . . . . . . . 58.5 30.4 84.5 64.0Grade 9 . . . . . . . . . . . . . . . . 70.8 37.7 84.8 65.0Grade 10. . . . . . . . . . . . . . . . 63.0 33.5 83.2 62.0Grade 11 . . . . . . . . . . . . . . . . 50.5 26.0 83.7 66.3Grade 12. . . . . . . . . . . . . . . . 44.5 21.4 87.2 62.3
Female. . . . . . . . . . . . . . . . . . . 52.8 26.4 75.3 51.0Grade 9 . . . . . . . . . . . . . . . . 71.2 38.0 75.7 55.2Grade 10. . . . . . . . . . . . . . . . 58.0 29.1 77.0 53.9Grade 11 . . . . . . . . . . . . . . . . 40.8 19.2 71.6 47.8Grade 12. . . . . . . . . . . . . . . . 34.6 15.2 74.9 45.9
White, non-Hispanic . . . . . . . . . . 53.7 24.9 81.5 60.8Male. . . . . . . . . . . . . . . . . . . 55.9 26.8 85.8 65.4Female . . . . . . . . . . . . . . . . . 51.5 23.1 76.6 55.9
Black, non-Hispanic . . . . . . . . . . 56.0 33.0 74.0 53.2Male. . . . . . . . . . . . . . . . . . . 63.1 37.1 80.0 67.5Female . . . . . . . . . . . . . . . . . 49.3 29.0 66.7 39.6
Hispanic . . . . . . . . . . . . . . . . . . 58.8 36.7 78.2 49.5Male. . . . . . . . . . . . . . . . . . . 61.4 39.5 82.5 56.2Female . . . . . . . . . . . . . . . . . 56.1 34.0 73.5 42.8
1 For students enrolled in physical education classes.
Source: U.S. Centers for Disease Control and Prevention, Atlanta, GA, Youth Risk Behavior Surveillance—United States,2003, Morbidity and Mortality Weekly Report, Vol. 53, No. SS-2, May 21, 2004. See also <http://www.cdc.gov/mmwr/preview/mmwrhtml/ss5302a1.htm>.
Table 1237. Participation in High School Athletic Programs by Sex:1972 to 2004
[Data based on number of state associations reporting and may underrepresent the number of schools with and participants inathletic programs]
YearParticipants 1
Sex and sportMost popular sports,
2003-2004 2
Males Females Schools Participants
1972-73 . . . . . . . . . . . . . . . 3,770,621 817,073 MALE1973-74 . . . . . . . . . . . . . . . 4,070,125 1,300,1691975-76 . . . . . . . . . . . . . . . 4,109,021 1,645,039 Football (11-player) . . . . . . . . . . 13,680 1,032,6821977-78 . . . . . . . . . . . . . . . 4,367,442 2,083,040 Basketball . . . . . . . . . . . . . . . . 17,389 544,8111978-79 . . . . . . . . . . . . . . . 3,709,512 1,854,400 Track & field (outdoor) . . . . . . . . 15,221 504,8011979-80 . . . . . . . . . . . . . . . 3,517,829 1,750,264 Baseball . . . . . . . . . . . . . . . . . 14,984 457,1461980-81 . . . . . . . . . . . . . . . 3,503,124 1,853,789 Soccer . . . . . . . . . . . . . . . . . . 10,219 349,7851981-82 . . . . . . . . . . . . . . . 3,409,081 1,810,671 Wrestling . . . . . . . . . . . . . . . . . 9,526 238,7001982-83 . . . . . . . . . . . . . . . 3,355,558 1,779,972 Cross country . . . . . . . . . . . . . . 12,649 196,4281983-84 . . . . . . . . . . . . . . . 3,303,599 1,747,346 Golf . . . . . . . . . . . . . . . . . . . . 12,921 163,3411984-85 . . . . . . . . . . . . . . . 3,354,284 1,757,884 Tennis . . . . . . . . . . . . . . . . . . . 9,427 152,938
Swimming & diving . . . . . . . . . . 5,758 96,5621985-86 . . . . . . . . . . . . . . . 3,344,275 1,807,1211986-87 . . . . . . . . . . . . . . . 3,364,082 1,836,356 FEMALE1987-88 . . . . . . . . . . . . . . . 3,425,777 1,849,6841988-89 . . . . . . . . . . . . . . . 3,416,844 1,839,352 Basketball . . . . . . . . . . . . . . . . 17,061 457,9861989-90 . . . . . . . . . . . . . . . 3,398,192 1,858,659 Track & field (outdoor) . . . . . . . . 15,089 418,3221990-91 . . . . . . . . . . . . . . . 3,406,355 1,892,316 Volleyball . . . . . . . . . . . . . . . . . 14,181 396,3221991-92 . . . . . . . . . . . . . . . 3,429,853 1,940,801 Softball (fast pitch). . . . . . . . . . . 14,181 362,4681992-93 . . . . . . . . . . . . . . . 3,416,389 1,997,489 Soccer . . . . . . . . . . . . . . . . . . 9,490 309,0321993-94 . . . . . . . . . . . . . . . 3,472,967 2,130,315 Cross country . . . . . . . . . . . . . . 9,559 167,7581994-95 . . . . . . . . . . . . . . . 3,536,359 2,240,461 Tennis . . . . . . . . . . . . . . . . . . . 12,235 166,287
Swimming & diving . . . . . . . . . . 6,176 144,5651995-96 . . . . . . . . . . . . . . . 3,634,052 2,367,936 Competitive spirit squads . . . . . . 3,693 89,4431996-97 . . . . . . . . . . . . . . . 3,706,225 2,474,043 Golf . . . . . . . . . . . . . . . . . . . . 8,171 63,1731997-98 . . . . . . . . . . . . . . . 3,763,120 2,570,3331998-99 . . . . . . . . . . . . . . . 3,832,352 2,652,7261999-00 . . . . . . . . . . . . . . . 3,861,749 2,675,8742000-01 . . . . . . . . . . . . . . . 3,921,069 2,784,1542001-02 . . . . . . . . . . . . . . . 3,960,517 2,806,9982002-03 . . . . . . . . . . . . . . . 3,988,738 2,856,3582003-04 . . . . . . . . . . . . . . . 4,038,253 2,865,299
1 A participant is counted in the number of sports participated in. 2 Ten most popular sports for each sex in terms of numberof participants.
Source: National Federation of State High School Associations, Indianapolis, IN, The 2003−2004 High School AthleticsParticipation Survey (copyright). <http://www.nfhs.org/scriptcontent/Index.cfm>.
Arts, Entertainment, and Recreation 795
U.S. Census Bureau, Statistical Abstract of the United States: 2006
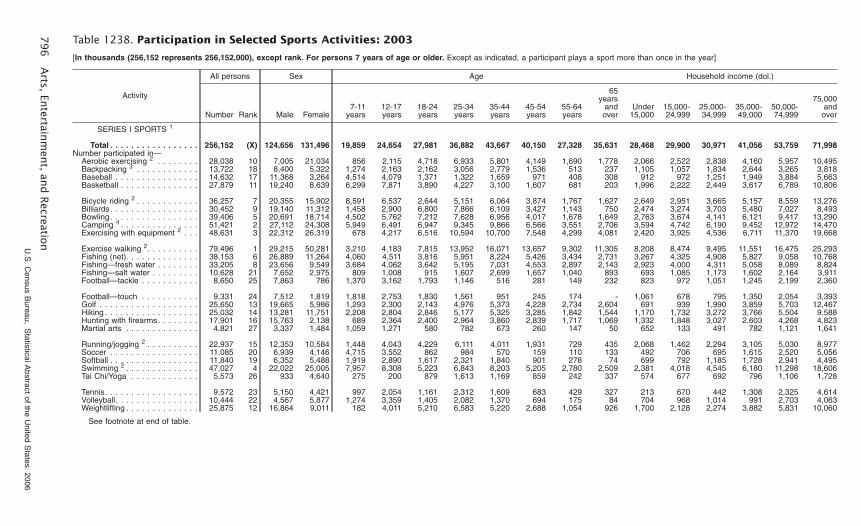
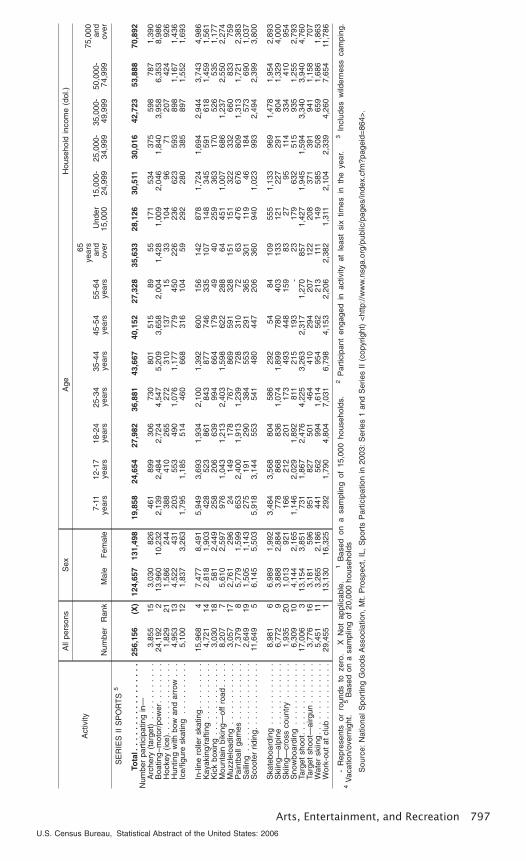
Table 1238. Participation in Selected Sports Activities: 2003
[In thousands (256,152 represents 256,152,000), except rank. For persons 7 years of age or older. Except as indicated, a participant plays a sport more than once in the year]
Activity
All persons Sex Age Household income (dol.)
Number Rank Male Female7-11
years12-17years
18-24years
25-34years
35-44years
45-54years
55-64years
65years
andover
Under15,000
15,000-24,999
25,000-34,999
35,000-49,000
50,000-74,999
75,000andover
SERIES I SPORTS 1
Total . . . . . . . . . . . . . . . . . 256,152 (X) 124,656 131,496 19,859 24,654 27,981 36,882 43,667 40,150 27,328 35,631 28,468 29,900 30,971 41,056 53,759 71,998Number participated in—
Aerobic exercising 2 . . . . . . . . 28,038 10 7,005 21,034 856 2,115 4,718 6,933 5,801 4,149 1,690 1,778 2,066 2,522 2,838 4,160 5,957 10,495Backpacking 3 . . . . . . . . . . . . 13,722 18 8,400 5,322 1,274 2,163 2,162 3,056 2,779 1,536 513 237 1,105 1,057 1,834 2,644 3,265 3,818Baseball . . . . . . . . . . . . . . . . 14,632 17 11,368 3,264 4,514 4,079 1,371 1,322 1,659 971 408 308 912 972 1,251 1,949 3,884 5,663Basketball . . . . . . . . . . . . . . . 27,879 11 19,240 8,639 6,299 7,871 3,890 4,227 3,100 1,607 681 203 1,996 2,222 2,449 3,617 6,789 10,806
Bicycle riding 2 . . . . . . . . . . . . 36,257 7 20,355 15,902 8,591 6,537 2,644 5,151 6,064 3,874 1,767 1,627 2,649 2,951 3,665 5,157 8,559 13,276Billiards. . . . . . . . . . . . . . . . . 30,452 9 19,140 11,312 1,458 2,900 6,800 7,866 6,109 3,427 1,143 750 2,474 3,274 3,703 5,480 7,027 8,493Bowling. . . . . . . . . . . . . . . . . 39,406 5 20,691 18,714 4,502 5,762 7,212 7,628 6,956 4,017 1,678 1,649 2,763 3,674 4,141 6,121 9,417 13,290Camping 4 . . . . . . . . . . . . . . . 51,421 2 27,112 24,308 5,949 6,491 6,947 9,345 9,866 6,566 3,551 2,706 3,594 4,742 6,190 9,452 12,972 14,470Exercising with equipment 2 . . . 48,631 3 22,312 26,319 678 4,217 6,516 10,594 10,700 7,548 4,299 4,081 2,420 3,925 4,536 6,711 11,370 19,668
Exercise walking 2. . . . . . . . . . 79,496 1 29,215 50,281 3,210 4,183 7,815 13,952 16,071 13,657 9,302 11,305 8,208 8,474 9,495 11,551 16,475 25,293Fishing (net). . . . . . . . . . . . . . 38,153 6 26,889 11,264 4,060 4,511 3,816 5,951 8,224 5,426 3,434 2,731 3,267 4,325 4,908 5,827 9,058 10,768Fishing—fresh water . . . . . . . . 33,205 8 23,656 9,549 3,684 4,062 3,642 5,195 7,031 4,553 2,897 2,143 2,923 4,000 4,311 5,058 8,089 8,824Fishing—salt water . . . . . . . . . 10,628 21 7,652 2,975 809 1,008 915 1,607 2,699 1,657 1,040 893 693 1,085 1,173 1,602 2,164 3,911Football—tackle . . . . . . . . . . . 8,650 25 7,863 786 1,370 3,162 1,793 1,146 516 281 149 232 823 972 1,051 1,245 2,199 2,360
Football—touch . . . . . . . . . . . 9,331 24 7,512 1,819 1,818 2,753 1,830 1,561 951 245 174 - 1,061 678 795 1,350 2,054 3,393Golf . . . . . . . . . . . . . . . . . . . 25,650 13 19,665 5,986 1,293 2,300 2,143 4,976 5,373 4,228 2,734 2,604 691 939 1,990 3,859 5,703 12,467Hiking . . . . . . . . . . . . . . . . . . 25,032 14 13,281 11,751 2,208 2,804 2,846 5,177 5,325 3,285 1,842 1,544 1,170 1,732 3,272 3,766 5,504 9,588Hunting with firearms. . . . . . . . 17,901 16 15,763 2,138 689 2,364 2,400 2,964 3,860 2,839 1,717 1,069 1,332 1,848 3,027 2,603 4,268 4,823Martial arts . . . . . . . . . . . . . . 4,821 27 3,337 1,484 1,059 1,271 580 782 673 260 147 50 652 133 491 782 1,121 1,641
Running/jogging 2 . . . . . . . . . . 22,937 15 12,353 10,584 1,448 4,043 4,229 6,111 4,011 1,931 729 435 2,068 1,462 2,294 3,105 5,030 8,977Soccer . . . . . . . . . . . . . . . . . 11,085 20 6,939 4,146 4,715 3,552 862 984 570 159 110 133 492 706 695 1,615 2,520 5,056Softball . . . . . . . . . . . . . . . . . 11,840 19 6,352 5,488 1,919 2,890 1,617 2,321 1,840 901 278 74 699 792 1,185 1,728 2,941 4,495Swimming 2 . . . . . . . . . . . . . . 47,027 4 22,022 25,005 7,957 8,308 5,223 6,843 8,203 5,205 2,780 2,509 2,381 4,018 4,545 6,180 11,298 18,606Tai Chi/Yoga . . . . . . . . . . . . . 5,573 26 933 4,640 275 200 879 1,613 1,169 859 242 337 574 677 692 796 1,106 1,728
Tennis. . . . . . . . . . . . . . . . . . 9,572 23 5,150 4,421 997 2,054 1,161 2,312 1,609 683 429 327 213 670 442 1,308 2,325 4,614Volleyball. . . . . . . . . . . . . . . . 10,444 22 4,567 5,877 1,274 3,359 1,405 2,082 1,370 694 175 84 704 968 1,014 991 2,703 4,063Weightlifting . . . . . . . . . . . . . . 25,875 12 16,864 9,011 182 4,011 5,210 6,583 5,220 2,688 1,054 926 1,700 2,128 2,274 3,882 5,831 10,060
See footnote at end of table.
79
6A
rts,En
tertainm
ent,
and
Recreatio
nU.S
.C
ensusB
ureau,S
tatisticalAbstract
ofthe
United
States:
2006
Act
ivity
All
pers
ons
Sex
Age
Hou
seho
ldin
com
e(d
ol.)
Num
ber
Ran
kM
ale
Fem
ale
7-11
year
s12
-17
year
s18
-24
year
s25
-34
year
s35
-44
year
s45
-54
year
s55
-64
year
s
65ye
ars
and
over
Und
er15
,000
15,0
00-
24,9
9925
,000
-34
,999
35,0
00-
49,9
9950
,000
-74
,999
75,0
00 and
over
SE
RIE
SII
SP
OR
TS
5
Tota
l..
..
..
..
..
..
..
..
.25
6,15
6(X
)12
4,65
713
1,49
819
,858
24,6
5427
,982
36,8
8143
,667
40,1
5227
,328
35,6
3328
,126
30,5
1130
,016
42,7
2353
,888
70,8
92N
umbe
rpa
rtic
ipat
ing
in—
Arc
hery
(tar
get)
..
..
..
..
..
.3,
855
153,
030
826
461
899
306
730
801
515
8955
171
534
375
598
787
1,39
0B
oatin
g−m
otor
/pow
er.
..
..
..
.24
,192
213
,960
10,2
322,
139
2,48
42,
724
4,54
75,
209
3,65
82,
004
1,42
81,
009
2,04
61,
840
3,95
86,
353
8,98
6H
ocke
y(ic
e).
..
..
..
..
..
..
.1,
829
211,
586
244
388
410
265
272
310
137
1533
104
9671
207
424
926
Hun
ting
with
bow
and
arro
w.
..
4,95
313
4,52
243
120
355
349
01,
076
1,17
777
945
022
623
662
359
389
81,
167
1,43
6Ic
e/fig
ure
skat
ing
..
..
..
..
..
5,10
012
1,83
73,
263
1,79
51,
185
514
460
668
316
104
5929
228
038
589
71,
552
1,69
3
In-li
nero
ller
skat
ing
..
..
..
..
.15
,968
47,
477
8,49
15,
949
3,69
31,
934
2,10
01,
392
600
156
142
878
1,72
41,
694
2,94
43,
743
4,98
6K
ayak
ing/
rafti
ng.
..
..
..
..
..
4,72
114
2,81
81,
903
428
523
861
843
877
746
335
107
148
345
591
618
1,45
91,
561
Kic
kbo
..
..
..
..
..
..
..
3,03
018
581
2,44
925
820
663
999
466
417
949
4025
936
317
052
653
51,
177
Mou
ntai
nbi
king
—of
fro
ad.
..
..
8,20
77
5,61
02,
597
976
1,04
31,
213
2,40
31,
598
622
288
6445
11,
007
686
1,23
72,
550
2,27
4M
uzzl
eloa
ding
..
..
..
..
..
..
3,05
717
2,76
129
624
149
178
767
869
591
328
151
151
322
332
660
833
759
Pai
ntba
llga
mes
..
..
..
..
..
.7,
379
85,
779
1,59
965
32,
400
1,91
31,
239
728
310
7263
476
676
809
1,31
31,
721
2,38
3S
ailin
g.
..
..
..
..
..
..
..
..
2,64
919
1,50
51,
143
275
191
290
384
553
291
365
301
119
4618
457
369
01,
037
Sco
oter
ridin
g.
..
..
..
..
..
..
11,6
495
6,14
55,
503
5,91
83,
144
553
541
480
447
206
360
940
1,02
399
32,
494
2,39
93,
800
Ska
tebo
ardi
ng.
..
..
..
..
..
.8,
981
66,
989
1,99
23,
484
3,56
880
458
629
254
8410
955
51,
133
969
1,47
81,
954
2,89
3S
kiin
g—al
pine
..
..
..
..
..
..
6,77
29
3,88
82,
884
778
868
836
1,07
41,
899
780
403
133
121
227
291
804
1,32
94,
000
Ski
ing—
cros
sco
untr
y.
..
..
..
1,93
520
1,01
392
116
621
220
117
349
344
815
983
2795
114
334
410
954
Sno
wbo
ardi
ng.
..
..
..
..
..
.6,
309
104,
144
2,16
51,
146
2,02
91,
892
811
215
193
-23
179
632
515
935
1,25
52,
793
Targ
etsh
oot.
..
..
..
..
..
..
.17
,006
313
,154
3,85
173
11,
867
2,47
64,
225
3,26
32,
317
1,27
085
71,
427
1,94
51,
594
3,34
03,
940
4,76
0Ta
rget
shoo
t—ai
rgun
..
..
..
..
3,77
616
3,18
159
695
182
750
146
441
029
420
712
220
837
139
194
11,
158
707
Wat
ersk
iing
..
..
..
..
..
..
..
5,45
111
3,26
52,
186
441
562
994
1,61
495
456
221
311
114
958
550
865
91,
686
1,86
3W
ork-
out
atcl
ub.
..
..
..
..
..
29,4
551
13,1
3016
,325
292
1,79
04,
804
7,03
16,
798
4,15
32,
206
2,38
21,
311
2,10
42,
339
4,26
07,
654
11,7
86
-R
epre
sent
sor
roun
dsto
zero
.X
Not
appl
icab
le.
1B
ased
ona
sam
plin
gof
15,0
00ho
useh
olds
.2
Par
ticip
ant
enga
ged
inac
tivity
atle
ast
six
times
inth
eye
ar.
3In
clud
esw
ilder
ness
cam
ping
.4
Vac
atio
n/ov
erni
ght.
5B
ased
ona
sam
plin
gof
20,0
00ho
useh
olds
Sou
rce:
Nat
iona
lSpo
rtin
gG
oods
Ass
ocia
tion,
Mt.
Pro
spec
t,IL
,S
port
sP
artic
ipat
ion
in20
03:
Ser
ies
1an
dS
erie
sII
(cop
yrig
ht)
<ht
tp://
ww
w.n
sga.
org/
publ
ic/p
ages
/inde
x.cf
m?p
agei
d=86
4>.
Arts, Entertainment, and Recreation 797
U.S. Census Bureau, Statistical Abstract of the United States: 2006
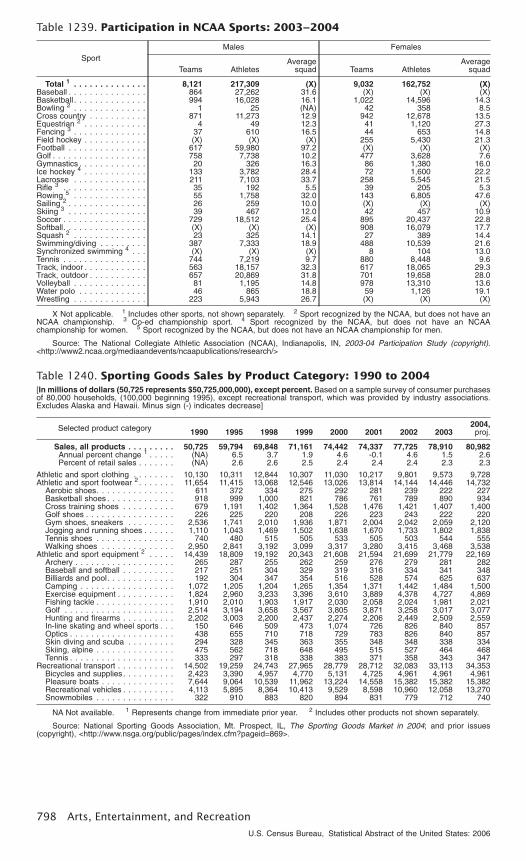
Table 1239. Participation in NCAA Sports: 2003−2004
SportMales Females
Teams AthletesAverage
squad Teams AthletesAverage
squad
Total 1 . . . . . . . . . . . . . . 8,121 217,309 (X) 9,032 162,752 (X)Baseball . . . . . . . . . . . . . . . 864 27,262 31.6 (X) (X) (X)Basketball . . . . . . . . . . . . . . 994 16,028 16.1 1,022 14,596 14.3Bowling 2 . . . . . . . . . . . . . . 1 25 (NA) 42 358 8.5Cross country . . . . . . . . . . . 871 11,273 12.9 942 12,678 13.5Equestrian 2 . . . . . . . . . . . . 4 49 12.3 41 1,120 27.3Fencing 3 . . . . . . . . . . . . . . 37 610 16.5 44 653 14.8Field hockey . . . . . . . . . . . . (X) (X) (X) 255 5,430 21.3Football . . . . . . . . . . . . . . . 617 59,980 97.2 (X) (X) (X)Golf . . . . . . . . . . . . . . . . . . 758 7,738 10.2 477 3,628 7.6Gymnastics . . . . . . . . . . . . . 20 326 16.3 86 1,380 16.0Ice hockey 4 . . . . . . . . . . . . 133 3,782 28.4 72 1,600 22.2Lacrosse . . . . . . . . . . . . . . 211 7,103 33.7 258 5,545 21.5Rifle 3 . . . . . . . . . . . . . . . . 35 192 5.5 39 205 5.3Rowing 5 . . . . . . . . . . . . . . 55 1,758 32.0 143 6,805 47.6Sailing 2 . . . . . . . . . . . . . . . 26 259 10.0 (X) (X) (X)Skiing 3 . . . . . . . . . . . . . . . 39 467 12.0 42 457 10.9Soccer . . . . . . . . . . . . . . . . 729 18,512 25.4 895 20,437 22.8Softball. . . . . . . . . . . . . . . . (X) (X) (X) 908 16,079 17.7Squash 2 . . . . . . . . . . . . . . 23 325 14.1 27 389 14.4Swimming/diving . . . . . . . . . 387 7,333 18.9 488 10,539 21.6Synchronized swimming 4 . . . (X) (X) (X) 8 104 13.0Tennis . . . . . . . . . . . . . . . . 744 7,219 9.7 880 8,448 9.6Track, indoor . . . . . . . . . . . . 563 18,157 32.3 617 18,065 29.3Track, outdoor . . . . . . . . . . . 657 20,869 31.8 701 19,658 28.0Volleyball . . . . . . . . . . . . . . 81 1,195 14.8 978 13,310 13.6Water polo . . . . . . . . . . . . . 46 865 18.8 59 1,126 19.1Wrestling . . . . . . . . . . . . . . 223 5,943 26.7 (X) (X) (X)
X Not applicable. 1 Includes other sports, not shown separately. 2 Sport recognized by the NCAA, but does not have anNCAA championship. 3 Co-ed championship sport. 4 Sport recognized by the NCAA, but does not have an NCAAchampionship for women. 5 Sport recognized by the NCAA, but does not have an NCAA championship for men.
Source: The National Collegiate Athletic Association (NCAA), Indianapolis, IN, 2003-04 Participation Study (copyright).<http://www2.ncaa.org/mediaandevents/ncaapublications/research/>
Table 1240. Sporting Goods Sales by Product Category: 1990 to 2004[In millions of dollars (50,725 represents $50,725,000,000), except percent. Based on a sample survey of consumer purchasesof 80,000 households, (100,000 beginning 1995), except recreational transport, which was provided by industry associations.Excludes Alaska and Hawaii. Minus sign (-) indicates decrease]
Selected product category 1990 1995 1998 1999 2000 2001 2002 20032004,
proj.
Sales, all products . . . . . . . . . 50,725 59,794 69,848 71,161 74,442 74,337 77,725 78,910 80,982Annual percent change 1 . . . . . (NA) 6.5 3.7 1.9 4.6 -0.1 4.6 1.5 2.6Percent of retail sales . . . . . . . (NA) 2.6 2.6 2.5 2.4 2.4 2.4 2.3 2.3
Athletic and sport clothing . . . . . . . . 10,130 10,311 12,844 10,307 11,030 10,217 9,801 9,573 9,728Athletic and sport footwear 2 . . . . . . . 11,654 11,415 13,068 12,546 13,026 13,814 14,144 14,446 14,732
Aerobic shoes. . . . . . . . . . . . . . . 611 372 334 275 292 281 239 222 227Basketball shoes . . . . . . . . . . . . . 918 999 1,000 821 786 761 789 890 934Cross training shoes . . . . . . . . . . 679 1,191 1,402 1,364 1,528 1,476 1,421 1,407 1,400Golf shoes . . . . . . . . . . . . . . . . . 226 225 220 208 226 223 243 222 220Gym shoes, sneakers . . . . . . . . . 2,536 1,741 2,010 1,936 1,871 2,004 2,042 2,059 2,120Jogging and running shoes . . . . . . 1,110 1,043 1,469 1,502 1,638 1,670 1,733 1,802 1,838Tennis shoes . . . . . . . . . . . . . . . 740 480 515 505 533 505 503 544 555Walking shoes . . . . . . . . . . . . . . 2,950 2,841 3,192 3,099 3,317 3,280 3,415 3,468 3,538
Athletic and sport equipment 2 . . . . . 14,439 18,809 19,192 20,343 21,608 21,594 21,699 21,779 22,169Archery . . . . . . . . . . . . . . . . . . . 265 287 255 262 259 276 279 281 282Baseball and softball . . . . . . . . . . 217 251 304 329 319 316 334 341 348Billiards and pool. . . . . . . . . . . . . 192 304 347 354 516 528 574 625 637Camping . . . . . . . . . . . . . . . . . . 1,072 1,205 1,204 1,265 1,354 1,371 1,442 1,484 1,500Exercise equipment . . . . . . . . . . . 1,824 2,960 3,233 3,396 3,610 3,889 4,378 4,727 4,869Fishing tackle . . . . . . . . . . . . . . . 1,910 2,010 1,903 1,917 2,030 2,058 2,024 1,981 2,021Golf . . . . . . . . . . . . . . . . . . . . . 2,514 3,194 3,658 3,567 3,805 3,871 3,258 3,017 3,077Hunting and firearms . . . . . . . . . . 2,202 3,003 2,200 2,437 2,274 2,206 2,449 2,509 2,559In-line skating and wheel sports . . . 150 646 509 473 1,074 726 826 840 857Optics . . . . . . . . . . . . . . . . . . . . 438 655 710 718 729 783 826 840 857Skin diving and scuba . . . . . . . . . 294 328 345 363 355 348 348 338 334Skiing, alpine . . . . . . . . . . . . . . . 475 562 718 648 495 515 527 464 468Tennis . . . . . . . . . . . . . . . . . . . . 333 297 318 338 383 371 358 343 347
Recreational transport . . . . . . . . . . . 14,502 19,259 24,743 27,965 28,779 28,712 32,083 33,113 34,353Bicycles and supplies. . . . . . . . . . 2,423 3,390 4,957 4,770 5,131 4,725 4,961 4,961 4,961Pleasure boats . . . . . . . . . . . . . . 7,644 9,064 10,539 11,962 13,224 14,558 15,382 15,382 15,382Recreational vehicles . . . . . . . . . . 4,113 5,895 8,364 10,413 9,529 8,598 10,960 12,058 13,270Snowmobiles . . . . . . . . . . . . . . . 322 910 883 820 894 831 779 712 740
NA Not available. 1 Represents change from immediate prior year. 2 Includes other products not shown separately.
Source: National Sporting Goods Association, Mt. Prospect, IL, The Sporting Goods Market in 2004; and prior issues(copyright), <http://www.nsga.org/public/pages/index.cfm?pageid=869>.
798 Arts, Entertainment, and Recreation
U.S. Census Bureau, Statistical Abstract of the United States: 2006
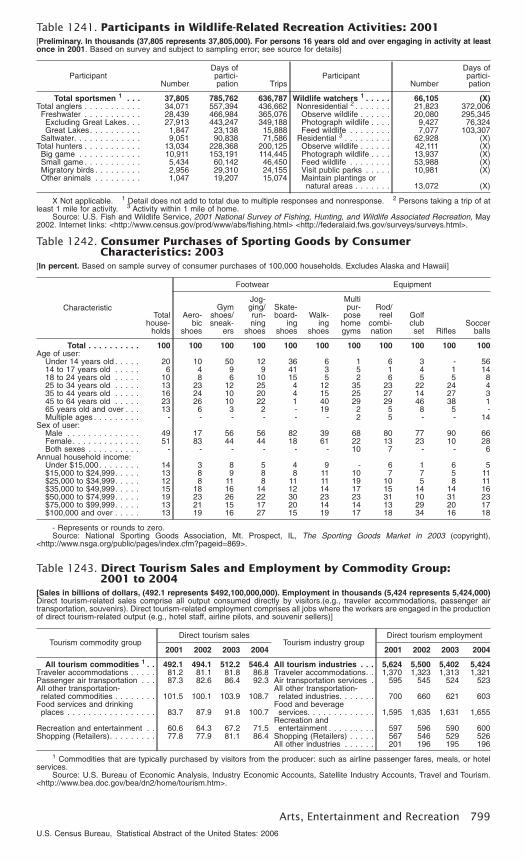
Table 1241. Participants in Wildlife-Related Recreation Activities: 2001[Preliminary. In thousands (37,805 represents 37,805,000). For persons 16 years old and over engaging in activity at leastonce in 2001. Based on survey and subject to sampling error; see source for details]
ParticipantNumber
Days ofpartici-pation Trips
ParticipantNumber
Days ofpartici-pation
Total sportsmen 1 . . . 37,805 785,762 636,787 Wildlife watchers 1 . . . . . 66,105 (X)Total anglers . . . . . . . . . . . 34,071 557,394 436,662 Nonresidential 2 . . . . . . . 21,823 372,006Freshwater . . . . . . . . . . . 28,439 466,984 365,076 Observe wildlife . . . . . . 20,080 295,345Excluding Great Lakes. . . 27,913 443,247 349,188 Photograph wildlife . . . . 9,427 76,324Great Lakes. . . . . . . . . . 1,847 23,138 15,888 Feed wildlife . . . . . . . . 7,077 103,307
Saltwater. . . . . . . . . . . . . 9,051 90,838 71,586 Residential 3 . . . . . . . . . 62,928 (X)Total hunters . . . . . . . . . . . 13,034 228,368 200,125 Observe wildlife . . . . . . 42,111 (X)Big game . . . . . . . . . . . . 10,911 153,191 114,445 Photograph wildlife . . . . 13,937 (X)Small game . . . . . . . . . . . 5,434 60,142 46,450 Feed wildlife . . . . . . . . 53,988 (X)Migratory birds . . . . . . . . . 2,956 29,310 24,155 Visit public parks . . . . . 10,981 (X)Other animals . . . . . . . . . 1,047 19,207 15,074 Maintain plantings or
natural areas . . . . . . . 13,072 (X)
X Not applicable. 1 Detail does not add to total due to multiple responses and nonresponse. 2 Persons taking a trip of atleast 1 mile for activity. 3 Activity within 1 mile of home.
Source: U.S. Fish and Wildlife Service, 2001 National Survey of Fishing, Hunting, and Wildlife Associated Recreation, May2002. Internet links: <http://www.census.gov/prod/www/abs/fishing.html> <http://federalaid.fws.gov/surveys/surveys.html>.
Table 1242. Consumer Purchases of Sporting Goods by ConsumerCharacteristics: 2003
[In percent. Based on sample survey of consumer purchases of 100,000 households. Excludes Alaska and Hawaii]
CharacteristicTotal
house-holds
Footwear Equipment
Aero-bic
shoes
Gymshoes/sneak-
ers
Jog-ging/run-ning
shoes
Skate-board-
ingshoes
Walk-ing
shoes
Multipur-
posehomegyms
Rod/reel
combi-nation
Golfclubset Rifles
Soccerballs
Total . . . . . . . . . . 100 100 100 100 100 100 100 100 100 100 100Age of user:
Under 14 years old . . . . . 20 10 50 12 36 6 1 6 3 - 5614 to 17 years old . . . . . 6 4 9 9 41 3 5 1 4 1 1418 to 24 years old . . . . . 10 8 6 10 15 5 2 6 5 5 825 to 34 years old . . . . . 13 23 12 25 4 12 35 23 22 24 435 to 44 years old . . . . . 16 24 10 20 4 15 25 27 14 27 345 to 64 years old . . . . . 23 26 10 22 1 40 29 29 46 38 165 years old and over . . . 13 6 3 2 - 19 2 5 8 5 -Multiple ages . . . . . . . . . - - - - - - 2 5 - - 14
Sex of user:Male . . . . . . . . . . . . . . 49 17 56 56 82 39 68 80 77 90 66Female. . . . . . . . . . . . . 51 83 44 44 18 61 22 13 23 10 28Both sexes . . . . . . . . . . - - - - - - 10 7 - - 6
Annual household income:Under $15,000. . . . . . . . 14 3 8 5 4 9 - 6 1 6 5$15,000 to $24,999. . . . . 13 8 9 8 8 11 10 7 7 5 11$25,000 to $34,999. . . . . 12 8 11 8 11 11 19 10 5 8 11$35,000 to $49,999. . . . . 15 18 16 14 12 14 17 15 14 14 16$50,000 to $74,999. . . . . 19 23 26 22 30 23 23 31 10 31 23$75,000 to $99,999. . . . . 13 21 15 17 20 14 14 13 29 20 17$100,000 and over . . . . . 13 19 16 27 15 19 17 18 34 16 18
- Represents or rounds to zero.Source: National Sporting Goods Association, Mt. Prospect, IL, The Sporting Goods Market in 2003 (copyright),
<http://www.nsga.org/public/pages/index.cfm?pageid=869>.
Table 1243. Direct Tourism Sales and Employment by Commodity Group:2001 to 2004
[Sales in billions of dollars, (492.1 represents $492,100,000,000). Employment in thousands (5,424 represents 5,424,000)Direct tourism-related sales comprise all output consumed directly by visitors.(e.g., traveler accommodations, passenger airtransportation, souvenirs). Direct tourism-related employment comprises all jobs where the workers are engaged in the productionof direct tourism-related output (e.g., hotel staff, airline pilots, and souvenir sellers)]
Tourism commodity groupDirect tourism sales
Tourism industry groupDirect tourism employment
2001 2002 2003 2004 2001 2002 2003 2004
All tourism commodities 1 . . 492.1 494.1 512.2 546.4 All tourism industries . . . 5,624 5,500 5,402 5,424Traveler accommodations . . . . . 81.2 81.1 81.8 86.8 Traveler accommodations. . 1,370 1,323 1,313 1,321Passenger air transportation . . . 87.3 82.6 86.4 92.3 Air transportation services . 595 545 524 523All other transportation-related commodities . . . . . . . . 101.5 100.1 103.9 108.7
All other transportation-related industries. . . . . . . 700 660 621 603
Food services and drinkingplaces . . . . . . . . . . . . . . . . . 83.7 87.9 91.8 100.7
Food and beverageservices. . . . . . . . . . . . . 1,595 1,635 1,631 1,655
Recreation and entertainment . . 60.6 64.3 67.2 71.5Recreation andentertainment . . . . . . . . . 597 596 590 600
Shopping (Retailers). . . . . . . . . 77.8 77.9 81.1 86.4 Shopping (Retailers) . . . . . 567 546 529 526All other industries . . . . . . 201 196 195 196
1 Commodities that are typically purchased by visitors from the producer: such as airline passenger fares, meals, or hotelservices.
Source: U.S. Bureau of Economic Analysis, Industry Economic Accounts, Satellite Industry Accounts, Travel and Tourism.<http://www.bea.doc.gov/bea/dn2/home/tourism.htm>.
Arts, Entertainment and Recreation 799
U.S. Census Bureau, Statistical Abstract of the United States: 2006

Table 1244. National Park System—Summary: 1990 to 2004[For year ending September 30, except as noted. (986 represents $986,000,000) Includes data for five areas in Puerto Ricoand Virgin Islands, one area in American Samoa, and one area in Guam]
Item 1990 1995 1999 2000 2001 2002 2003 2004
Finances (mil. dol.): 1
Expenditures reported . . . . . . . . . . . . . 986 1,445 1,530 1,833 1,985 2,161 2,315 2,371Salaries and wages . . . . . . . . . . . . . 459 633 733 799 840 876 934 956Improvements, maintenance . . . . . . . 160 234 289 299 305 311 344 332Construction . . . . . . . . . . . . . . . . . . 109 192 62 215 199 296 293 354Other . . . . . . . . . . . . . . . . . . . . . . 259 386 446 520 641 678 744 729
Funds available . . . . . . . . . . . . . . . . . 1,506 2,225 2,972 3,316 3,642 3,940 4,099 4,087Appropriations. . . . . . . . . . . . . . . . . 1,053 1,325 1,867 1,881 2,241 2,257 2,298 2,388Other 2 . . . . . . . . . . . . . . . . . . . . . 453 900 1,105 1,435 1,401 1,683 1,801 1,699
Revenue from operations . . . . . . . . . . . 79 106 215 234 246 245 274 264Recreation visits (millions): 3
All areas . . . . . . . . . . . . . . . . . . . . . . 258.7 269.6 287.1 285.9 279.9 277.3 266.1 276.9National parks 4 . . . . . . . . . . . . . . . 57.7 64.8 64.3 66.1 64.1 64.5 63.4 63.8National monuments . . . . . . . . . . . . 23.9 23.5 24.3 23.8 21.8 20.3 20.0 19.8National historical, commemorative,archaeological 5. . . . . . . . . . . . . . . 57.5 56.9 72.6 72.2 66.7 70.2 66.6 77.0
National parkways . . . . . . . . . . . . . . 29.1 31.3 34.6 34.0 34.4 35.7 31.1 31.7National recreation areas 4 . . . . . . . . 47.2 53.7 52.8 50.0 48.3 48.2 47.7 46.6National seashores and lakeshores. . . 23.3 22.5 22.7 22.5 22.2 23.3 22.6 21.3National Capital Parks . . . . . . . . . . . 7.5 5.5 3.9 5.4 4.6 3.8 3.5 4.7
Recreation overnight stays (millions). . . . 17.6 16.8 15.9 15.4 15.3 14.7 14.2 13.7In commercial lodgings . . . . . . . . . . . 3.9 3.8 3.7 3.7 3.6 3.5 3.5 3.5In Park Service campgrounds . . . . . . 7.9 7.1 6.2 5.9 5.7 5.8 5.7 5.4In backcountry . . . . . . . . . . . . . . . . 1.7 2.2 2.0 1.9 2.0 1.9 1.8 1.7Other . . . . . . . . . . . . . . . . . . . . . . 4.2 3.7 4.1 3.8 3.9 3.5 3.2 3.1
Land (1,000 acres): 6
Total . . . . . . . . . . . . . . . . . . . . . . . . . 76,362 77,355 78,166 78,153 78,943 78,811 79,006 79,023Parks . . . . . . . . . . . . . . . . . . . . . . 46,089 49,307 49,859 49,785 49,862 49,639 49,823 49,892Recreation areas . . . . . . . . . . . . . . . 3,344 3,353 3,404 3,388 3,388 3,390 3,391 3,391Other . . . . . . . . . . . . . . . . . . . . . . 26,929 24,695 24,903 24,980 25,693 25,782 25,792 25,740
Acquisition, net . . . . . . . . . . . . . . . . . . 21 27 44 187 20 115 135 13
1 Financial data are those associated with the National Park System. Certain other functions of the National Park Service(principally the activities absorbed from the former Heritage Conservation and Recreation Service in 1981) are excluded.2 Includes funds carried over from prior years. 3 For calendar year. Includes other areas, not shown separately. 4 For 1990,combined data for North Cascades National Park and two adjacent National Recreation Areas are included in National Parkstotal. 5 Includes military areas. 6 Federal land only, as of December 31. Federal land acreages, in addition to National ParkService administered lands, also include lands within national park system area boundaries but under the administration of otheragencies. Year-to-year changes in the Federal lands figures include changes in the acreages of these other lands and hence oftendiffer from ‘‘net acquisition.’’
Source: U.S. National Park Service, Visits, National Park StatisticalAbstract, annual; and unpublished data. <http://www2.nature.nps.gov/stats/>.
Table 1245. State Parks and Recreation Areas by State: 2003
[For year ending June 30 (13,571 represents 13,571,000). Data are shown as reported by state park directors. In somestates, park agency has under its control forests, fish and wildlife areas, and/or other areas. In other states, agency isresponsible for state parks only]
State
Acreage(1,000)
Visitors(1,000) 1
Revenue
Total($1,000)
Percentof oper-
atingexpen-ditures
United States. . . 13,571 734,990 666,231 36.4
Alabama . . . . . . . . 50 4,871 23,897 74.7Alaska . . . . . . . . . 3,353 4,301 1,478 25.4Arizona . . . . . . . . . 61 2,201 5,302 31.7Arkansas. . . . . . . . 52 9,970 14,003 43.4California. . . . . . . . 1,481 85,779 58,065 20.0Colorado . . . . . . . . 360 11,378 17,861 67.3Connecticut . . . . . . 202 7,033 - -Delaware. . . . . . . . 24 5,549 7,758 42.6Florida . . . . . . . . . 602 18,241 32,075 45.6Georgia . . . . . . . . 84 12,405 27,114 47.4Hawaii . . . . . . . . . 28 4,499 1,759 25.2Idaho . . . . . . . . . . 45 2,438 4,055 20.5Illinois . . . . . . . . . . 327 37,137 16,851 29.8Indiana . . . . . . . . . 179 14,798 35,683 81.6Iowa. . . . . . . . . . . 63 14,534 3,431 29.4Kansas . . . . . . . . . 32 8,250 5,736 68.9Kentucky. . . . . . . . 45 7,668 47,559 62.2Louisiana . . . . . . . 41 2,064 200 1.1Maine . . . . . . . . . . 99 2,542 - -Maryland. . . . . . . . 266 10,219 14,361 33.8Massachusetts . . . . 295 10,512 2,199 7.1Michigan . . . . . . . . 286 22,430 24,098 46.7Minnesota . . . . . . . 220 7,782 7,588 26.5Mississippi. . . . . . . 24 3,051 6,542 48.0
State
Acreage(1,000)
Visitors(1,000) 1
Revenue
Total($1,000)
Percentof oper-
atingexpen-ditures
Missouri . . . . . . . . 140 17,016 3,949 14.1Montana . . . . . . . . 71 1,575 1,228 20.1Nebraska . . . . . . . 135 9,726 12,697 63.1Nevada. . . . . . . . . 133 3,288 2,357 26.9New Hampshire . . . 86 5,472 8,500 100.0New Jersey . . . . . . 380 14,943 2,324 6.4New Mexico. . . . . . 91 3,983 3,838 22.8New York . . . . . . . 1,532 57,001 54,103 33.1North Carolina . . . . 171 13,213 3,187 11.0North Dakota . . . . . 17 1,134 776 29.0Ohio. . . . . . . . . . . 164 57,238 29,501 45.2Oklahoma . . . . . . . 72 14,247 22,989 55.0Oregon . . . . . . . . . 95 39,244 15,414 37.2Pennsylvania . . . . . 290 36,031 16,925 21.4Rhode Island . . . . . 9 6,572 - -South Carolina . . . . 80 7,544 13,769 58.0South Dakota. . . . . 105 9,081 7,541 60.4Tennessee. . . . . . . 154 27,020 32,516 50.7Texas . . . . . . . . . . 668 17,620 13,385 26.4Utah. . . . . . . . . . . 122 5,806 7,991 46.6Vermont . . . . . . . . 69 674 5,827 93.1Virginia . . . . . . . . . 62 5,623 6,578 38.2Washington . . . . . . 259 44,991 15,720 32.7West Virginia . . . . . 196 8,343 18,862 61.0Wisconsin . . . . . . . 132 15,739 8,648 43.8Wyoming. . . . . . . . 119 2,214 - -
-Represents or rounds to zero. 1 Includes overnight visitors.Source: The NationalAssociation of State Park Directors, Raleigh, NC, 2004 Annual Information Exchange; <http://www.indiana.edu
/naspd/>.
800 Arts, Entertainment, and Recreation
U.S. Census Bureau, Statistical Abstract of the United States: 2006
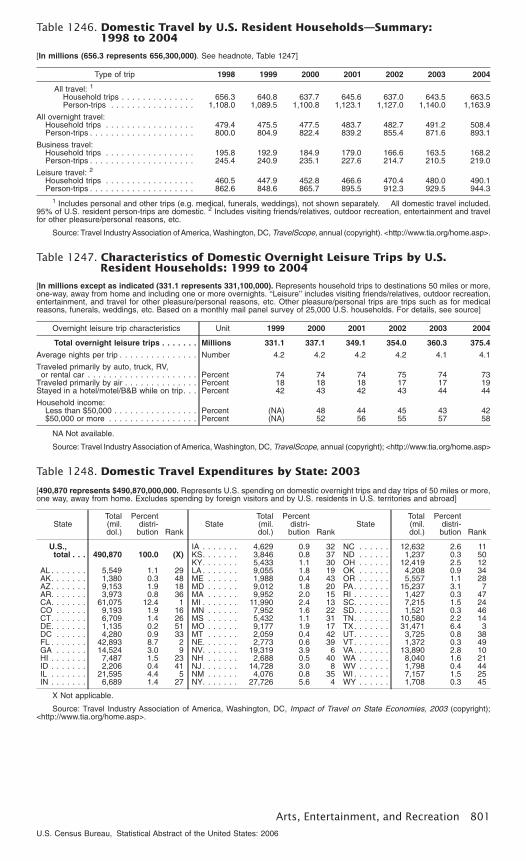
Table 1246. Domestic Travel by U.S. Resident Households—Summary:1998 to 2004
[In millions (656.3 represents 656,300,000). See headnote, Table 1247]
Type of trip 1998 1999 2000 2001 2002 2003 2004
All travel: 1
Household trips . . . . . . . . . . . . . . 656.3 640.8 637.7 645.6 637.0 643.5 663.5Person-trips . . . . . . . . . . . . . . . . 1,108.0 1,089.5 1,100.8 1,123.1 1,127.0 1,140.0 1,163.9
All overnight travel:Household trips . . . . . . . . . . . . . . . . . 479.4 475.5 477.5 483.7 482.7 491.2 508.4Person-trips . . . . . . . . . . . . . . . . . . . . 800.0 804.9 822.4 839.2 855.4 871.6 893.1
Business travel:Household trips . . . . . . . . . . . . . . . . . 195.8 192.9 184.9 179.0 166.6 163.5 168.2Person-trips . . . . . . . . . . . . . . . . . . . . 245.4 240.9 235.1 227.6 214.7 210.5 219.0
Leisure travel: 2
Household trips . . . . . . . . . . . . . . . . . 460.5 447.9 452.8 466.6 470.4 480.0 490.1Person-trips . . . . . . . . . . . . . . . . . . . . 862.6 848.6 865.7 895.5 912.3 929.5 944.3
1 Includes personal and other trips (e.g. medical, funerals, weddings), not shown separately. All domestic travel included.95% of U.S. resident person-trips are domestic. 2 Includes visiting friends/relatives, outdoor recreation, entertainment and travelfor other pleasure/personal reasons, etc.
Source: Travel IndustryAssociation ofAmerica, Washington, DC, TravelScope, annual (copyright). <http://www.tia.org/home.asp>.
Table 1247. Characteristics of Domestic Overnight Leisure Trips by U.S.Resident Households: 1999 to 2004
[In millions except as indicated (331.1 represents 331,100,000). Represents household trips to destinations 50 miles or more,one-way, away from home and including one or more overnights. ‘‘Leisure’’ includes visiting friends/relatives, outdoor recreation,entertainment, and travel for other pleasure/personal reasons, etc. Other pleasure/personal trips are trips such as for medicalreasons, funerals, weddings, etc. Based on a monthly mail panel survey of 25,000 U.S. households. For details, see source]
Overnight leisure trip characteristics Unit 1999 2000 2001 2002 2003 2004
Total overnight leisure trips . . . . . . . Millions 331.1 337.1 349.1 354.0 360.3 375.4
Average nights per trip . . . . . . . . . . . . . . . Number 4.2 4.2 4.2 4.2 4.1 4.1
Traveled primarily by auto, truck, RV,or rental car . . . . . . . . . . . . . . . . . . . . . Percent 74 74 74 75 74 73
Traveled primarily by air . . . . . . . . . . . . . . Percent 18 18 18 17 17 19Stayed in a hotel/motel/B&B while on trip. . . Percent 42 43 42 43 44 44
Household income:Less than $50,000 . . . . . . . . . . . . . . . . Percent (NA) 48 44 45 43 42$50,000 or more . . . . . . . . . . . . . . . . . Percent (NA) 52 56 55 57 58
NA Not available.
Source: Travel Industry Association of America, Washington, DC, TravelScope, annual (copyright); <http://www.tia.org/home.asp>
Table 1248. Domestic Travel Expenditures by State: 2003
[490,870 represents $490,870,000,000. Represents U.S. spending on domestic overnight trips and day trips of 50 miles or more,one way, away from home. Excludes spending by foreign visitors and by U.S. residents in U.S. territories and abroad]
StateTotal(mil.dol.)
Percentdistri-
bution Rank
U.S.,total . . . 490,870 100.0 (X)
AL . . . . . . . 5,549 1.1 29AK. . . . . . . 1,380 0.3 48AZ. . . . . . . 9,153 1.9 18AR. . . . . . . 3,973 0.8 36CA. . . . . . . 61,075 12.4 1CO . . . . . . 9,193 1.9 16CT. . . . . . . 6,709 1.4 26DE. . . . . . . 1,135 0.2 51DC . . . . . . 4,280 0.9 33FL . . . . . . . 42,893 8.7 2GA . . . . . . 14,524 3.0 9HI . . . . . . . 7,487 1.5 23ID . . . . . . . 2,206 0.4 41IL . . . . . . . 21,595 4.4 5IN . . . . . . . 6,689 1.4 27
StateTotal(mil.dol.)
Percentdistri-
bution Rank
IA . . . . . . . 4,629 0.9 32KS. . . . . . . 3,846 0.8 37KY. . . . . . . 5,433 1.1 30LA . . . . . . . 9,055 1.8 19ME . . . . . . 1,988 0.4 43MD . . . . . . 9,012 1.8 20MA . . . . . . 9,952 2.0 15MI . . . . . . . 11,990 2.4 13MN . . . . . . 7,952 1.6 22MS . . . . . . 5,432 1.1 31MO . . . . . . 9,177 1.9 17MT . . . . . . 2,059 0.4 42NE. . . . . . . 2,773 0.6 39NV. . . . . . . 19,319 3.9 6NH . . . . . . 2,688 0.5 40NJ . . . . . . . 14,728 3.0 8NM . . . . . . 4,076 0.8 35NY. . . . . . . 27,726 5.6 4
StateTotal(mil.dol.)
Percentdistri-
bution Rank
NC . . . . . . 12,632 2.6 11ND . . . . . . 1,237 0.3 50OH . . . . . . 12,419 2.5 12OK . . . . . . 4,208 0.9 34OR . . . . . . 5,557 1.1 28PA. . . . . . . 15,237 3.1 7RI . . . . . . . 1,427 0.3 47SC. . . . . . . 7,215 1.5 24SD. . . . . . . 1,521 0.3 46TN. . . . . . . 10,580 2.2 14TX. . . . . . . 31,471 6.4 3UT. . . . . . . 3,725 0.8 38VT. . . . . . . 1,372 0.3 49VA. . . . . . . 13,890 2.8 10WA . . . . . . 8,040 1.6 21WV . . . . . . 1,798 0.4 44WI . . . . . . . 7,157 1.5 25WY . . . . . . 1,708 0.3 45
X Not applicable.
Source: Travel Industry Association of America, Washington, DC, Impact of Travel on State Economies, 2003 (copyright);<http://www.tia.org/home.asp>.
Arts, Entertainment, and Recreation 801
U.S. Census Bureau, Statistical Abstract of the United States: 2006
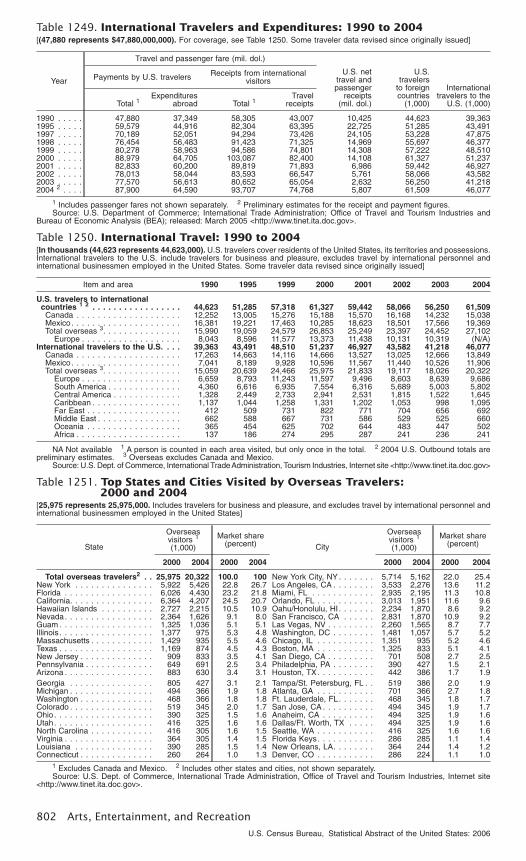
Table 1249. International Travelers and Expenditures: 1990 to 2004[(47,880 represents $47,880,000,000). For coverage, see Table 1250. Some traveler data revised since originally issued]
Year
Travel and passenger fare (mil. dol.)
U.S. nettravel andpassenger
receipts(mil. dol.)
U.S.travelers
to foreigncountries
(1,000)
Internationaltravelers to the
U.S. (1,000)
Payments by U.S. travelers Receipts from internationalvisitors
Total 1Expenditures
abroad Total 1Travel
receipts
1990 . . . . . 47,880 37,349 58,305 43,007 10,425 44,623 39,3631995 . . . . . 59,579 44,916 82,304 63,395 22,725 51,285 43,4911997 . . . . . 70,189 52,051 94,294 73,426 24,105 53,228 47,8751998 . . . . . 76,454 56,483 91,423 71,325 14,969 55,697 46,3771999 . . . . . 80,278 58,963 94,586 74,801 14,308 57,222 48,5102000 . . . . . 88,979 64,705 103,087 82,400 14,108 61,327 51,2372001 . . . . . 82,833 60,200 89,819 71,893 6,986 59,442 46,9272002 . . . . . 78,013 58,044 83,593 66,547 5,761 58,066 43,5822003 . . . . . 77,570 56,613 80,652 65,054 2,632 56,250 41,2182004 2 . . . . 87,900 64,590 93,707 74,768 5,807 61,509 46,077
1 Includes passenger fares not shown separately. 2 Preliminary estimates for the receipt and payment figures.Source: U.S. Department of Commerce; International Trade Administration; Office of Travel and Tourism Industries and
Bureau of Economic Analysis (BEA); released: March 2005 <http://www.tinet.ita.doc.gov>.
Table 1250. International Travel: 1990 to 2004[In thousands (44,623 represents 44,623,000). U.S. travelers cover residents of the United States, its territories and possessions.International travelers to the U.S. include travelers for business and pleasure, excludes travel by international personnel andinternational businessmen employed in the United States. Some traveler data revised since originally issued]
Item and area 1990 1995 1999 2000 2001 2002 2003 2004
U.S. travelers to internationalcountries 1 2 . . . . . . . . . . . . . . . . . 44,623 51,285 57,318 61,327 59,442 58,066 56,250 61,509Canada . . . . . . . . . . . . . . . . . . . . 12,252 13,005 15,276 15,188 15,570 16,168 14,232 15,038Mexico. . . . . . . . . . . . . . . . . . . . . 16,381 19,221 17,463 10,285 18,623 18,501 17,566 19,369Total overseas 3. . . . . . . . . . . . . . . 15,990 19,059 24,579 26,853 25,249 23,397 24,452 27,102
Europe . . . . . . . . . . . . . . . . . . . 8,043 8,596 11,577 13,373 11,438 10,131 10,319 (N/A)International travelers to the U.S. . . . 39,363 43,491 48,510 51,237 46,927 43,582 41,218 46,077
Canada . . . . . . . . . . . . . . . . . . . . 17,263 14,663 14,116 14,666 13,527 13,025 12,666 13,849Mexico. . . . . . . . . . . . . . . . . . . . . 7,041 8,189 9,928 10,596 11,567 11,440 10,526 11,906Total overseas 3. . . . . . . . . . . . . . . 15,059 20,639 24,466 25,975 21,833 19,117 18,026 20,322
Europe . . . . . . . . . . . . . . . . . . . 6,659 8,793 11,243 11,597 9,496 8,603 8,639 9,686South America . . . . . . . . . . . . . . 4,360 6,616 6,935 7,554 6,316 5,689 5,003 5,802Central America . . . . . . . . . . . . . 1,328 2,449 2,733 2,941 2,531 1,815 1,522 1,645Caribbean . . . . . . . . . . . . . . . . . 1,137 1,044 1,258 1,331 1,202 1,053 998 1,095Far East . . . . . . . . . . . . . . . . . . 412 509 731 822 771 704 656 692Middle East . . . . . . . . . . . . . . . . 662 588 667 731 586 529 525 660Oceania . . . . . . . . . . . . . . . . . . 365 454 625 702 644 483 447 502Africa . . . . . . . . . . . . . . . . . . . . 137 186 274 295 287 241 236 241
NA Not available 1 A person is counted in each area visited, but only once in the total. 2 2004 U.S. Outbound totals arepreliminary estimates. 3 Overseas excludes Canada and Mexico.
Source: U.S. Dept. of Commerce, International TradeAdministration, Tourism Industries, Internet site <http://www.tinet.ita.doc.gov>
Table 1251. Top States and Cities Visited by Overseas Travelers:2000 and 2004
[25,975 represents 25,975,000. Includes travelers for business and pleasure, and excludes travel by international personnel andinternational businessmen employed in the United States]
State
Overseasvisitors 1
(1,000)
Market share(percent) City
Overseasvisitors 1
(1,000)
Market share(percent)
2000 2004 2000 2004 2000 2004 2000 2004
Total overseas travelers2 . . 25,975 20,322 100.0 100 New York City, NY . . . . . . . 5,714 5,162 22.0 25.4New York . . . . . . . . . . . . . . . 5,922 5,426 22.8 26.7 Los Angeles, CA . . . . . . . . 3,533 2,276 13.6 11.2Florida . . . . . . . . . . . . . . . . . 6,026 4,430 23.2 21.8 Miami, FL . . . . . . . . . . . . 2,935 2,195 11.3 10.8California. . . . . . . . . . . . . . . . 6,364 4,207 24.5 20.7 Orlando, FL . . . . . . . . . . . 3,013 1,951 11.6 9.6Hawaiian Islands . . . . . . . . . . 2,727 2,215 10.5 10.9 Oahu/Honolulu, HI . . . . . . . 2,234 1,870 8.6 9.2Nevada. . . . . . . . . . . . . . . . . 2,364 1,626 9.1 8.0 San Francisco, CA . . . . . . 2,831 1,870 10.9 9.2Guam . . . . . . . . . . . . . . . . . . 1,325 1,036 5.1 5.1 Las Vegas, NV . . . . . . . . . 2,260 1,565 8.7 7.7Illinois . . . . . . . . . . . . . . . . . . 1,377 975 5.3 4.8 Washington, DC . . . . . . . . 1,481 1,057 5.7 5.2Massachusetts . . . . . . . . . . . . 1,429 935 5.5 4.6 Chicago, IL . . . . . . . . . . . 1,351 935 5.2 4.6Texas . . . . . . . . . . . . . . . . . . 1,169 874 4.5 4.3 Boston, MA . . . . . . . . . . . 1,325 833 5.1 4.1New Jersey . . . . . . . . . . . . . . 909 833 3.5 4.1 San Diego, CA . . . . . . . . . 701 508 2.7 2.5Pennsylvania . . . . . . . . . . . . . 649 691 2.5 3.4 Philadelphia, PA . . . . . . . . 390 427 1.5 2.1Arizona . . . . . . . . . . . . . . . . . 883 630 3.4 3.1 Houston, TX. . . . . . . . . . . 442 386 1.7 1.9Georgia . . . . . . . . . . . . . . . . 805 427 3.1 2.1 Tampa/St. Petersburg, FL . . 519 386 2.0 1.9Michigan . . . . . . . . . . . . . . . . 494 366 1.9 1.8 Atlanta, GA . . . . . . . . . . . 701 366 2.7 1.8Washington . . . . . . . . . . . . . . 468 366 1.8 1.8 Ft. Lauderdale, FL. . . . . . . 468 345 1.8 1.7Colorado . . . . . . . . . . . . . . . . 519 345 2.0 1.7 San Jose, CA . . . . . . . . . . 494 345 1.9 1.7Ohio. . . . . . . . . . . . . . . . . . . 390 325 1.5 1.6 Anaheim, CA . . . . . . . . . . 494 325 1.9 1.6Utah. . . . . . . . . . . . . . . . . . . 416 325 1.6 1.6 Dallas/Ft. Worth, TX . . . . . 494 325 1.9 1.6North Carolina . . . . . . . . . . . . 416 305 1.6 1.5 Seattle, WA . . . . . . . . . . . 416 325 1.6 1.6Virginia . . . . . . . . . . . . . . . . . 364 305 1.4 1.5 Florida Keys. . . . . . . . . . . 286 285 1.1 1.4Louisiana . . . . . . . . . . . . . . . 390 285 1.5 1.4 New Orleans, LA. . . . . . . . 364 244 1.4 1.2Connecticut . . . . . . . . . . . . . . 260 264 1.0 1.3 Denver, CO . . . . . . . . . . . 286 224 1.1 1.0
1 Excludes Canada and Mexico. 2 Includes other states and cities, not shown separately.Source: U.S. Dept. of Commerce, International Trade Administration, Office of Travel and Tourism Industries, Internet site
<http://www.tinet.ita.doc.gov>.
802 Arts, Entertainment, and Recreation
U.S. Census Bureau, Statistical Abstract of the United States: 2006

Table 1252. Impact of International Travel on States’ Economies: 2003[Preliminary. (64,509.0 represents $64,509,000,000)]
State Travelexpendi-
tures(mil. dol.)
Travelgener-
atedpayroll
(mil. dol.)
Travelgener-
atedemploy-
ment(1,000)
Travelgener-
atedtax
receipts(mil. dol.)
U.S., total . . . 64,509.0 18,425.2 814.5 10,291.6AL . . . . . . . . . (NA) (NA) (NA) (NA)AK . . . . . . . . . (NA) (NA) (NA) (NA)AZ . . . . . . . . . 1,384.0 462.7 20.9 221.1AR . . . . . . . . . (NA) (NA) (NA) (NA)CA . . . . . . . . . 10,485.1 3,122.5 130.2 1,770.0CO . . . . . . . . . 616.4 213.5 9.8 135.1CT . . . . . . . . . 202.4 42.2 1.8 32.5DE . . . . . . . . . (NA) (NA) (NA) (NA)DC . . . . . . . . . 1,400.9 345.4 12.7 207.2FL. . . . . . . . . . 13,372.4 3,942.3 187.8 2,076.5GA . . . . . . . . . 1,124.5 457.7 16.3 257.3HI . . . . . . . . . . 5,416.0 1,504.0 62.3 783.8ID . . . . . . . . . . (NA) (NA) (NA) (NA)IL . . . . . . . . . . 1,368.4 416.1 18.2 282.5IN . . . . . . . . . . 209.1 57.9 3.2 33.1IA . . . . . . . . . . (NA) (NA) (NA) (NA)KS . . . . . . . . . (NA) (NA) (NA) (NA)KY . . . . . . . . . (NA) (NA) (NA) (NA)LA . . . . . . . . . 363.6 82.3 4.6 49.5ME . . . . . . . . . (NA) (NA) (NA) (NA)MD . . . . . . . . . 319.0 101.3 4.4 64.9MA . . . . . . . . . 1,246.6 372.1 14.3 222.3MI. . . . . . . . . . 582.0 171.8 7.5 106.9MN . . . . . . . . . 329.7 128.7 5.7 101.1MS . . . . . . . . . (NA) (NA) (NA) (NA)
State Travelexpendi-
tures(mil. dol.)
Travelgener-
atedpayroll
(mil. dol.)
Travelgener-
atedemploy-
ment(1,000)
Travelgener-
atedtax
receipts(mil. dol.)
MO . . . . . . . . . 121.4 40.0 2.0 23.3MT . . . . . . . . . (NA) (NA) (NA) (NA)NE . . . . . . . . . (NA) (NA) (NA) (NA)NV . . . . . . . . . 2,021.1 758.2 34.8 291.4NH . . . . . . . . . 120.7 21.4 1.2 11.6NJ. . . . . . . . . . 688.5 224.4 9.2 127.0NM . . . . . . . . . (NA) (NA) (NA) (NA)NY . . . . . . . . . 7,708.0 2,422.8 89.4 1,582.5NC . . . . . . . . . 417.8 134.4 6.8 73.3ND . . . . . . . . . (NA) (NA) (NA) (NA)OH . . . . . . . . . 556.0 133.6 7.2 96.9OK . . . . . . . . . (NA) (NA) (NA) (NA)OR . . . . . . . . . 303.0 79.8 4.3 45.9PA . . . . . . . . . 1,181.6 378.8 16.5 204.6RI . . . . . . . . . . (NA) (NA) (NA) (NA)SC . . . . . . . . . 514.2 117.7 7.8 76.4SD . . . . . . . . . (NA) (NA) (NA) (NA)TN . . . . . . . . . 270.0 77.2 3.9 58.8TX . . . . . . . . . 3,118.7 1,058.7 47.8 573.5UT . . . . . . . . . 318.3 123.9 7.2 66.0VT . . . . . . . . . (NA) (NA) (NA) (NA)VA . . . . . . . . . 413.7 120.8 6.2 66.4WA . . . . . . . . . 779.0 219.0 10.2 138.6WV . . . . . . . . . (NA) (NA) (NA) (NA)WI. . . . . . . . . . 229.2 64.5 4.0 39.6WY . . . . . . . . . (NA) (NA) (NA) (NA)
1 NA not available due to small sample size for international visitors.
Source: Travel Industry Association of America, Washington, DC, Impact of Travel on State Economies, 2003 Edition(copyright); <http://www.tia.org/default.asp>.
Table 1253. Foreign Visitors for Pleasure Admitted by Country of Citizenship:1990 to 2003
[In thousands (13,418 represents 13,418,000). For years ending September 30. Represents non-U.S. citizens admitted tothe country for a temporary period of time (also known as nonimmigrants)]
Country 1990 1995 2000 2003
All countries 1 . . . . . 13,418 17,612 30,511 20,143
Europe 1 . . . . . . . . . . . . . 5,383 7,012 11,806 8,331Austria . . . . . . . . . . . . . 87 146 182 95Belgium . . . . . . . . . . . . 95 153 254 119Czech Republic . . . . . . . (X) 12 44 24Denmark . . . . . . . . . . . 75 78 150 111Finland . . . . . . . . . . . . 83 47 95 54France . . . . . . . . . . . . . 566 738 1,113 758Germany 2 . . . . . . . . . . 969 1,550 1,925 1,033Greece . . . . . . . . . . . . 43 44 60 33Hungary . . . . . . . . . . . . 15 29 58 25Iceland. . . . . . . . . . . . . 10 14 27 18Ireland . . . . . . . . . . . . . 81 126 325 298Italy . . . . . . . . . . . . . . . 308 427 626 483Netherlands . . . . . . . . . 214 308 559 405Norway . . . . . . . . . . . . 80 71 144 96Poland . . . . . . . . . . . . . 55 36 116 93Portugal . . . . . . . . . . . . 30 40 86 64Russia . . . . . . . . . . . . . (X) 33 74 38Spain. . . . . . . . . . . . . . 183 248 370 334Sweden . . . . . . . . . . . . 230 142 321 173Switzerland. . . . . . . . . . 236 321 400 196United Kingdom. . . . . . . 1,899 2,342 4,671 3,744
Asia 1 . . . . . . . . . . . . . . . 3,830 5,666 7,853 4,612China 3 . . . . . . . . . . . . 187 378 656 277Hong Kong . . . . . . . . . . 111 162 195 40India . . . . . . . . . . . . . . 75 75 253 198Indonesia . . . . . . . . . . . 28 44 62 31Israel . . . . . . . . . . . . . . 128 160 319 191Japan . . . . . . . . . . . . . 2,846 3,986 4,946 3,000Korea . . . . . . . . . . . . . 120 427 606 478Malaysia. . . . . . . . . . . . 27 40 64 21Pakistan. . . . . . . . . . . . 27 27 47 32Philippines . . . . . . . . . . 76 85 163 135Saudi Arabia . . . . . . . . . 33 45 67 6Singapore. . . . . . . . . . . 32 61 131 43Thailand. . . . . . . . . . . . 25 59 76 30Turkey . . . . . . . . . . . . . 20 27 93 51
Country 1990 1995 2000 2003
United Arab Emirates . . . 7 14 36 2Africa 1 . . . . . . . . . . . . . . 105 137 327 192
Egypt. . . . . . . . . . . . . . 16 16 44 17Nigeria . . . . . . . . . . . . . 11 10 27 36South Africa . . . . . . . . . 26 59 114 51
Oceania 1 . . . . . . . . . . . . 562 478 748 570Australia. . . . . . . . . . . . 380 327 535 398New Zealand 4 . . . . . . . 153 115 170 160
North America 1 . . . . . . . . 2,463 2,240 6,501 4,979Canada . . . . . . . . . . . . 119 127 277 16Mexico. . . . . . . . . . . . . 1,061 893 3,972 3,568Caribbean 1 . . . . . . . . . 963 831 1,404 841
Aruba . . . . . . . . . . . . 10 19 24 7Bahamas, The . . . . . . 332 234 377 268Barbados . . . . . . . . . 34 36 57 33British Virgin Islands . . 8 9 31 4Cayman Islands . . . . . 31 31 53 19Dominican Republic . . 137 138 195 136Haiti . . . . . . . . . . . . . 57 43 72 58Jamaica . . . . . . . . . . 132 130 240 144Netherlands Antilles . . 31 32 43 8Trinidad and Tobago . . 81 64 133 96
Central America 1. . . . . . 320 387 792 554Costa Rica . . . . . . . . 62 91 172 96El Salvador . . . . . . . . 46 63 175 156Guatemala . . . . . . . . 91 99 177 128Honduras . . . . . . . . . 52 37 87 66Nicaragua . . . . . . . . . 13 28 47 31Panama . . . . . . . . . . 43 54 106 59
South America 1 . . . . . . . . 1,016 1,978 2,867 1,294Argentina . . . . . . . . . . . 136 320 515 119Bolivia . . . . . . . . . . . . . 14 16 48 19Brazil . . . . . . . . . . . . . . 300 710 706 273Chile . . . . . . . . . . . . . . 54 117 194 81Colombia . . . . . . . . . . . 122 174 411 254Ecuador . . . . . . . . . . . . 57 77 122 102Peru . . . . . . . . . . . . . . 97 98 190 144Uruguay . . . . . . . . . . . . 16 37 66 39Venezuela . . . . . . . . . . 199 400 570 234
X Not applicable. 1 Includes other countries and countries unknown, not shown separately. 2 Data for 1990 are for formerWest Germany. 3 Includes People’s Republic of China and Taiwan. 4 Prior to fiscal year 1995, data for Niue are included in NewZealand.
Source: U.S. Department of Homeland Security, Office of Immigration Statistics, 2003 Yearbook of Immigration Statistics,. Seealso <http://www.uscis.gov/graphics/shared/aboutus/statistics/ybpage.htm>.
Arts, Entertainment, and Recreation 803
U.S. Census Bureau, Statistical Abstract of the United States: 2006
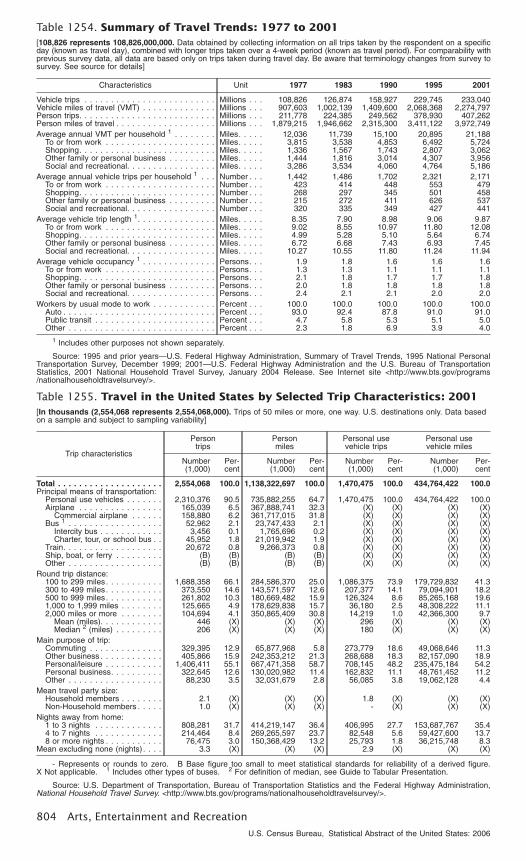
Table 1254. Summary of Travel Trends: 1977 to 2001[108,826 represents 108,826,000,000. Data obtained by collecting information on all trips taken by the respondent on a specificday (known as travel day), combined with longer trips taken over a 4-week period (known as travel period). For comparability withprevious survey data, all data are based only on trips taken during travel day. Be aware that terminology changes from survey tosurvey. See source for details]
Characteristics Unit 1977 1983 1990 1995 2001
Vehicle trips . . . . . . . . . . . . . . . . . . . . . . . . . Millions . . . 108,826 126,874 158,927 229,745 233,040Vehicle miles of travel (VMT) . . . . . . . . . . . . . . Millions . . . 907,603 1,002,139 1,409,600 2,068,368 2,274,797Person trips. . . . . . . . . . . . . . . . . . . . . . . . . . Millions . . . 211,778 224,385 249,562 378,930 407,262Person miles of travel . . . . . . . . . . . . . . . . . . . Millions . . . 1,879,215 1,946,662 2,315,300 3,411,122 3,972,749Average annual VMT per household 1 . . . . . . . . Miles. . . . . 12,036 11,739 15,100 20,895 21,188
To or from work . . . . . . . . . . . . . . . . . . . . . Miles. . . . . 3,815 3,538 4,853 6,492 5,724Shopping. . . . . . . . . . . . . . . . . . . . . . . . . . Miles. . . . . 1,336 1,567 1,743 2,807 3,062Other family or personal business . . . . . . . . . Miles. . . . . 1,444 1,816 3,014 4,307 3,956Social and recreational. . . . . . . . . . . . . . . . . Miles. . . . . 3,286 3,534 4,060 4,764 5,186
Average annual vehicle trips per household 1 . . . Number . . . 1,442 1,486 1,702 2,321 2,171To or from work . . . . . . . . . . . . . . . . . . . . . Number . . . 423 414 448 553 479Shopping. . . . . . . . . . . . . . . . . . . . . . . . . . Number . . . 268 297 345 501 458Other family or personal business . . . . . . . . . Number . . . 215 272 411 626 537Social and recreational. . . . . . . . . . . . . . . . . Number . . . 320 335 349 427 441
Average vehicle trip length 1. . . . . . . . . . . . . . . Miles. . . . . 8.35 7.90 8.98 9.06 9.87To or from work . . . . . . . . . . . . . . . . . . . . . Miles. . . . . 9.02 8.55 10.97 11.80 12.08Shopping. . . . . . . . . . . . . . . . . . . . . . . . . . Miles. . . . . 4.99 5.28 5.10 5.64 6.74Other family or personal business . . . . . . . . . Miles. . . . . 6.72 6.68 7.43 6.93 7.45Social and recreational. . . . . . . . . . . . . . . . . Miles. . . . . 10.27 10.55 11.80 11.24 11.94
Average vehicle occupancy 1 . . . . . . . . . . . . . . Persons. . . 1.9 1.8 1.6 1.6 1.6To or from work . . . . . . . . . . . . . . . . . . . . . Persons. . . 1.3 1.3 1.1 1.1 1.1Shopping. . . . . . . . . . . . . . . . . . . . . . . . . . Persons. . . 2.1 1.8 1.7 1.7 1.8Other family or personal business . . . . . . . . . Persons. . . 2.0 1.8 1.8 1.8 1.8Social and recreational. . . . . . . . . . . . . . . . . Persons. . . 2.4 2.1 2.1 2.0 2.0
Workers by usual mode to work . . . . . . . . . . . . Percent . . . 100.0 100.0 100.0 100.0 100.0Auto . . . . . . . . . . . . . . . . . . . . . . . . . . . . . Percent . . . 93.0 92.4 87.8 91.0 91.0Public transit . . . . . . . . . . . . . . . . . . . . . . . Percent . . . 4.7 5.8 5.3 5.1 5.0Other . . . . . . . . . . . . . . . . . . . . . . . . . . . . Percent . . . 2.3 1.8 6.9 3.9 4.0
1 Includes other purposes not shown separately.
Source: 1995 and prior years—U.S. Federal Highway Administration, Summary of Travel Trends, 1995 National PersonalTransportation Survey, December 1999; 2001—U.S. Federal Highway Administration and the U.S. Bureau of TransportationStatistics, 2001 National Household Travel Survey, January 2004 Release. See Internet site <http://www.bts.gov/programs/nationalhouseholdtravelsurvey/>.
Table 1255. Travel in the United States by Selected Trip Characteristics: 2001[In thousands (2,554,068 represents 2,554,068,000). Trips of 50 miles or more, one way. U.S. destinations only. Data basedon a sample and subject to sampling variability]
Trip characteristics
Persontrips
Personmiles
Personal usevehicle trips
Personal usevehicle miles
Number(1,000)
Per-cent
Number(1,000)
Per-cent
Number(1,000)
Per-cent
Number(1,000)
Per-cent
Total . . . . . . . . . . . . . . . . . . . . 2,554,068 100.0 1,138,322,697 100.0 1,470,475 100.0 434,764,422 100.0Principal means of transportation:
Personal use vehicles . . . . . . . 2,310,376 90.5 735,882,255 64.7 1,470,475 100.0 434,764,422 100.0Airplane . . . . . . . . . . . . . . . . 165,039 6.5 367,888,741 32.3 (X) (X) (X) (X)
Commercial airplane . . . . . . 158,880 6.2 361,717,015 31.8 (X) (X) (X) (X)Bus 1 . . . . . . . . . . . . . . . . . . 52,962 2.1 23,747,433 2.1 (X) (X) (X) (X)
Intercity bus . . . . . . . . . . . . 3,456 0.1 1,765,696 0.2 (X) (X) (X) (X)Charter, tour, or school bus . . 45,952 1.8 21,019,942 1.9 (X) (X) (X) (X)
Train. . . . . . . . . . . . . . . . . . . 20,672 0.8 9,266,373 0.8 (X) (X) (X) (X)Ship, boat, or ferry . . . . . . . . . (B) (B) (B) (B) (X) (X) (X) (X)Other . . . . . . . . . . . . . . . . . . (B) (B) (B) (B) (X) (X) (X) (X)
Round trip distance:100 to 299 miles. . . . . . . . . . . 1,688,358 66.1 284,586,370 25.0 1,086,375 73.9 179,729,832 41.3300 to 499 miles. . . . . . . . . . . 373,550 14.6 143,571,597 12.6 207,377 14.1 79,094,901 18.2500 to 999 miles. . . . . . . . . . . 261,802 10.3 180,669,482 15.9 126,324 8.6 85,265,168 19.61,000 to 1,999 miles . . . . . . . . 125,665 4.9 178,629,838 15.7 36,180 2.5 48,308,222 11.12,000 miles or more . . . . . . . . 104,694 4.1 350,865,409 30.8 14,219 1.0 42,366,300 9.7
Mean (miles). . . . . . . . . . . . 446 (X) (X) (X) 296 (X) (X) (X)Median 2 (miles) . . . . . . . . . 206 (X) (X) (X) 180 (X) (X) (X)
Main purpose of trip:Commuting . . . . . . . . . . . . . . 329,395 12.9 65,877,968 5.8 273,779 18.6 49,068,646 11.3Other business . . . . . . . . . . . . 405,866 15.9 242,353,212 21.3 268,688 18.3 82,157,090 18.9Personal/leisure . . . . . . . . . . . 1,406,411 55.1 667,471,358 58.7 708,145 48.2 235,475,184 54.2Personal business. . . . . . . . . . 322,645 12.6 130,020,982 11.4 162,832 11.1 48,761,452 11.2Other . . . . . . . . . . . . . . . . . . 88,230 3.5 32,031,679 2.8 56,085 3.8 19,062,128 4.4
Mean travel party size:Household members . . . . . . . . 2.1 (X) (X) (X) 1.8 (X) (X) (X)Non-Household members . . . . . 1.0 (X) (X) (X) - (X) (X) (X)
Nights away from home:1 to 3 nights . . . . . . . . . . . . . 808,281 31.7 414,219,147 36.4 406,995 27.7 153,687,767 35.44 to 7 nights . . . . . . . . . . . . . 214,464 8.4 269,265,597 23.7 82,548 5.6 59,427,600 13.78 or more nights . . . . . . . . . . . 76,475 3.0 150,368,429 13.2 25,793 1.8 36,215,748 8.3
Mean excluding none (nights) . . . . 3.3 (X) (X) (X) 2.9 (X) (X) (X)
- Represents or rounds to zero. B Base figure too small to meet statistical standards for reliability of a derived figure.X Not applicable. 1 Includes other types of buses. 2 For definition of median, see Guide to Tabular Presentation.
Source: U.S. Department of Transportation, Bureau of Transportation Statistics and the Federal Highway Administration,National Household Travel Survey. <http://www.bts.gov/programs/nationalhouseholdtravelsurvey/>.
804 Arts, Entertainment and Recreation
U.S. Census Bureau, Statistical Abstract of the United States: 2006
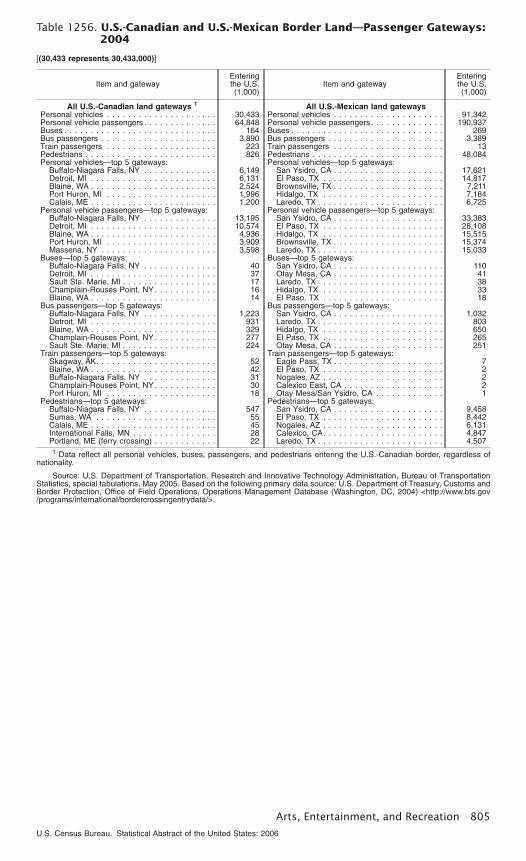
Table 1256. U.S.-Canadian and U.S.-Mexican Border Land—Passenger Gateways:2004
[(30,433 represents 30,433,000)]
Item and gatewayEnteringthe U.S.(1,000)
All U.S.-Canadian land gateways 1
Personal vehicles . . . . . . . . . . . . . . . . . . . . . 30,433Personal vehicle passengers . . . . . . . . . . . . . . 64,848Buses . . . . . . . . . . . . . . . . . . . . . . . . . . . . . 164Bus passengers . . . . . . . . . . . . . . . . . . . . . . 3,890Train passengers . . . . . . . . . . . . . . . . . . . . . 223Pedestrians . . . . . . . . . . . . . . . . . . . . . . . . . 826Personal vehicles—top 5 gateways:
Buffalo-Niagara Falls, NY . . . . . . . . . . . . . . 6,149Detroit, MI . . . . . . . . . . . . . . . . . . . . . . . . 6,131Blaine, WA . . . . . . . . . . . . . . . . . . . . . . . . 2,524Port Huron, MI . . . . . . . . . . . . . . . . . . . . . 1,996Calais, ME . . . . . . . . . . . . . . . . . . . . . . . . 1,200
Personal vehicle passengers—top 5 gateways:Buffalo-Niagara Falls, NY . . . . . . . . . . . . . . 13,195Detroit, MI . . . . . . . . . . . . . . . . . . . . . . . . 10,574Blaine, WA . . . . . . . . . . . . . . . . . . . . . . . . 4,936Port Huron, MI . . . . . . . . . . . . . . . . . . . . . 3,909Massena, NY . . . . . . . . . . . . . . . . . . . . . . 3,598
Buses—top 5 gateways:Buffalo-Niagara Falls, NY . . . . . . . . . . . . . . 40Detroit, MI . . . . . . . . . . . . . . . . . . . . . . . . 37Sault Ste. Marie, MI . . . . . . . . . . . . . . . . . . 17Champlain-Rouses Point, NY . . . . . . . . . . . . 16Blaine, WA . . . . . . . . . . . . . . . . . . . . . . . . 14
Bus passengers—top 5 gateways:Buffalo-Niagara Falls, NY . . . . . . . . . . . . . . 1,223Detroit, MI . . . . . . . . . . . . . . . . . . . . . . . . 931Blaine, WA . . . . . . . . . . . . . . . . . . . . . . . . 329Champlain-Rouses Point, NY . . . . . . . . . . . . 277Sault Ste. Marie, MI . . . . . . . . . . . . . . . . . . 224
Train passengers—top 5 gateways:Skagway, AK. . . . . . . . . . . . . . . . . . . . . . . 52Blaine, WA . . . . . . . . . . . . . . . . . . . . . . . . 42Buffalo-Niagara Falls, NY . . . . . . . . . . . . . . 31Champlain-Rouses Point, NY . . . . . . . . . . . . 30Port Huron, MI . . . . . . . . . . . . . . . . . . . . . 18
Pedestrians—top 5 gateways:Buffalo-Niagara Falls, NY . . . . . . . . . . . . . . 547Sumas, WA . . . . . . . . . . . . . . . . . . . . . . . 55Calais, ME . . . . . . . . . . . . . . . . . . . . . . . . 45International Falls, MN . . . . . . . . . . . . . . . . 28Portland, ME (ferry crossing) . . . . . . . . . . . . 22
Item and gatewayEnteringthe U.S.(1,000)
All U.S.-Mexican land gatewaysPersonal vehicles . . . . . . . . . . . . . . . . . . . . . 91,342Personal vehicle passengers . . . . . . . . . . . . . . 190,937Buses . . . . . . . . . . . . . . . . . . . . . . . . . . . . . 269Bus passengers . . . . . . . . . . . . . . . . . . . . . . 3,389Train passengers . . . . . . . . . . . . . . . . . . . . . 13Pedestrians . . . . . . . . . . . . . . . . . . . . . . . . . 48,084Personal vehicles—top 5 gateways:
San Ysidro, CA . . . . . . . . . . . . . . . . . . . . . 17,621El Paso, TX . . . . . . . . . . . . . . . . . . . . . . . 14,817Brownsville, TX . . . . . . . . . . . . . . . . . . . . . 7,211Hidalgo, TX . . . . . . . . . . . . . . . . . . . . . . . 7,184Laredo, TX . . . . . . . . . . . . . . . . . . . . . . . . 6,725
Personal vehicle passengers—top 5 gateways:San Ysidro, CA . . . . . . . . . . . . . . . . . . . . . 33,383El Paso, TX . . . . . . . . . . . . . . . . . . . . . . . 28,108Hidalgo, TX . . . . . . . . . . . . . . . . . . . . . . . 15,515Brownsville, TX . . . . . . . . . . . . . . . . . . . . . 15,374Laredo, TX . . . . . . . . . . . . . . . . . . . . . . . . 15,033
Buses—top 5 gateways:San Ysidro, CA . . . . . . . . . . . . . . . . . . . . . 110Otay Mesa, CA . . . . . . . . . . . . . . . . . . . . . 41Laredo, TX . . . . . . . . . . . . . . . . . . . . . . . . 38Hidalgo, TX . . . . . . . . . . . . . . . . . . . . . . . 33El Paso, TX . . . . . . . . . . . . . . . . . . . . . . . 18
Bus passengers—top 5 gateways:San Ysidro, CA . . . . . . . . . . . . . . . . . . . . . 1,032Laredo, TX . . . . . . . . . . . . . . . . . . . . . . . . 803Hidalgo, TX . . . . . . . . . . . . . . . . . . . . . . . 650El Paso, TX . . . . . . . . . . . . . . . . . . . . . . . 265Otay Mesa, CA . . . . . . . . . . . . . . . . . . . . . 251
Train passengers—top 5 gateways:Eagle Pass, TX . . . . . . . . . . . . . . . . . . . . . 7El Paso, TX . . . . . . . . . . . . . . . . . . . . . . . 2Nogales, AZ . . . . . . . . . . . . . . . . . . . . . . . 2Calexico East, CA . . . . . . . . . . . . . . . . . . . 2Otay Mesa/San Ysidro, CA . . . . . . . . . . . . . 1
Pedestrians—top 5 gateways:San Ysidro, CA . . . . . . . . . . . . . . . . . . . . . 9,458El Paso, TX . . . . . . . . . . . . . . . . . . . . . . . 8,442Nogales, AZ . . . . . . . . . . . . . . . . . . . . . . . 6,131Calexico, CA. . . . . . . . . . . . . . . . . . . . . . . 4,847Laredo, TX . . . . . . . . . . . . . . . . . . . . . . . . 4,507
1 Data reflect all personal vehicles, buses, passengers, and pedestrians entering the U.S.-Canadian border, regardless ofnationality.
Source: U.S. Department of Transportation, Research and Innovative Technology Administration, Bureau of TransportationStatistics, special tabulations, May 2005. Based on the following primary data source: U.S. Department of Treasury, Customs andBorder Protection, Office of Field Operations, Operations Management Database (Washington, DC, 2004) <http://www.bts.gov/programs/international/bordercrossingentrydata/>.
Arts, Entertainment, and Recreation 805
U.S. Census Bureau, Statistical Abstract of the United States: 2006