Embed Size (px)
Citation preview
Writing Sample
Submitted by: Leslie R. Odom, PhD
Institutional Organization: University of North Texas
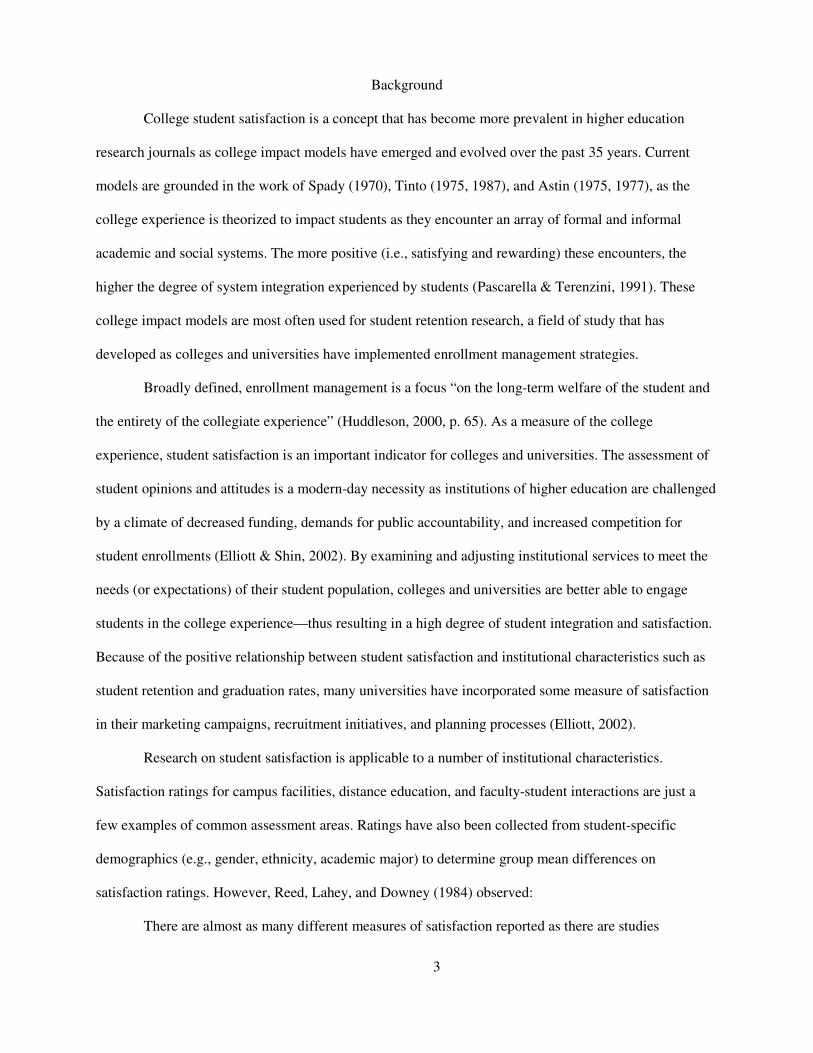
Abstract - College student satisfaction is a concept that has become more prevalent in higher
education research journals. Little attention has been given to the psychometric properties of previous
instrumentation, and few studies have investigated the structure of current satisfaction instrumentation.
This paper: (a) investigated the tenability of the theoretical dimensional structure of the Noel-Levitz
Student Satisfaction Inventory™ (SSI), (b) investigated an alternative factor structure using explanatory
factor analyses (EFA), and (c) used multiple-group CFA procedures to determine whether an alternative
SSI factor structure would be invariant for two demographic variables: gender (men/women) and
race/ethnicity (Caucasian/Other).
For this study, there was little evidence for the multidimensional structure of the SSI. A single
factor, termed General Satisfaction with College, was the lone unidimensional construct that emerged
from the iterative CFA and EFA procedures. A revised 20-item model was developed, and a series of
multigroup CFAs were used to detect measurement invariance for three variables: student gender
andrace/ethnicity. No measurement invariance was noted for the revised 20-item model. Results for the
invariance tests indicated equivalence across the comparison groups for (a) the number of factors, (b) the
pattern of indicator-factor loadings, (c) the factor loadings, and (d) the item error variances. Because little
attention has been given to the psychometric properties of the satisfaction instrumentation, it is
recommended that further research continue on the SSI and any additional instrumentation developed to
measure student satisfaction. It is possible that invariance issues may explain a portion of the inconsistent
findings noted in the review of literature. Although measurement analyses are a time-consuming process,
they are essential for understanding the psychometrics characterized by a set of scores obtained from a
survey, or any other form of assessment instrument.
3
Background
College student satisfaction is a concept that has become more prevalent in higher education
research journals as college impact models have emerged and evolved over the past 35 years. Current
models are grounded in the work of Spady (1970), Tinto (1975, 1987), and Astin (1975, 1977), as the
college experience is theorized to impact students as they encounter an array of formal and informal
academic and social systems. The more positive (i.e., satisfying and rewarding) these encounters, the
higher the degree of system integration experienced by students (Pascarella & Terenzini, 1991). These
college impact models are most often used for student retention research, a field of study that has
developed as colleges and universities have implemented enrollment management strategies.
Broadly defined, enrollment management is a focus “on the long-term welfare of the student and
the entirety of the collegiate experience” (Huddleson, 2000, p. 65). As a measure of the college
experience, student satisfaction is an important indicator for colleges and universities. The assessment of
student opinions and attitudes is a modern-day necessity as institutions of higher education are challenged
by a climate of decreased funding, demands for public accountability, and increased competition for
student enrollments (Elliott & Shin, 2002). By examining and adjusting institutional services to meet the
needs (or expectations) of their student population, colleges and universities are better able to engage
students in the college experience—thus resulting in a high degree of student integration and satisfaction.
Because of the positive relationship between student satisfaction and institutional characteristics such as
student retention and graduation rates, many universities have incorporated some measure of satisfaction
in their marketing campaigns, recruitment initiatives, and planning processes (Elliott, 2002).
Research on student satisfaction is applicable to a number of institutional characteristics.
Satisfaction ratings for campus facilities, distance education, and faculty-student interactions are just a
few examples of common assessment areas. Ratings have also been collected from student-specific
demographics (e.g., gender, ethnicity, academic major) to determine group mean differences on
satisfaction ratings. However, Reed, Lahey, and Downey (1984) observed:
There are almost as many different measures of satisfaction reported as there are studies
4
investigating the construct. This lack of consistency has led to a lack of comparability,
contradictory results, and confusion. (p. 68)
Issues related to instrumentation have been the subject of discussion. Initial research related to student
satisfaction was tenuous, at best, and was the product of unstandardized instruments. Little attention was
given to the psychometric properties of this instrumentation, so college student satisfaction was not
adequately defined, accurately measured, or consistently measured. This severely limited the early
attempts to understand the concept of satisfaction (Reed et al., 1984).
Over the past four decades, student satisfaction measures have improved, but there are still
inconsistencies that plague the satisfaction research. Current instrumentation considers the student as
either an employee or a consumer. This results in slight differences in the operational definitions of
college student satisfaction. Drawing on the definition of job satisfaction, Reed et al. (1984) defined
college student satisfaction “as the student’s emotional reactions to college” (p. 68). Oliver and DeSarbo
(1988) described student satisfaction as a student’s favorable evaluation of the outcomes and experiences
associated with their educational experience. Generally accepted as a short-term attitude (Athiyaman,
1997), student satisfaction varies according to the total college experience (Elliott, 2002). Because the
total experience includes academic, social, physical, and spiritual encounters (Sevier, 1996), student
satisfaction is still considered a “subtle yet complex phenomenon” (Elliott, 2002, p. 272).
Factor analysis techniques are popular methods of instrument development to determine the
satisfaction construct. Beltyukova and Fox (2002) noted that all satisfaction instruments use different
satisfaction subscales determined by different item counts and content. As a result, colleges and
universities are making policy decisions based on varying interpretations of student satisfaction.
Beltyukova and Fox further explained the different instrument structures expose the use of different
operational definitions of student satisfaction and that this is a frequent criticism of research on student
satisfaction.
After half a century of student satisfaction research, further inquiry into the psychometrics of
satisfaction instrumentation appears to have idled. Current research on student satisfaction is frequently
5
limited to information originating from the standard reports of commercial survey instruments.
Unfortunately, many higher education practitioners may assume these commercial services provide
sufficient information to fully understand student satisfaction on their campus. This is an erroneous notion
because additional analyses, that would provide a more informed perspective of student satisfaction, are
possible with the institutional data files provided by a number of satisfaction survey publishers.
Significance of the Study
Research on student satisfaction has diminished as commercial assessment agents have worked to
provide colleges and universities with “easy to administer” student surveys. An over reliance on these
products and their standard analyses gives the impression that student satisfaction is well understood in
higher education. The present study will use institutional data from two SSI survey administrations and
investigate the latent factor structure of the SSI using confirmatory factor analyses (CFA). CFA
procedures are appropriate when tests for specific relational hypotheses are of interest. Gorsuch (1983)
explained the purpose of CFA.
Confirmatory factor analysis is powerful because it provides explicit hypothesis testing for factor
analytic problems. . . .Confirmatory factor analysis is the more theoretically important—and
should be the much more widely used—of the two major factor analytic approaches [EFA and
CFA]. (p. 134)
This study will be of interest to both methodologists and practitioners as one of the most popular
instruments for assessing college student satisfaction is reviewed and findings are placed within the
context of current theory.
College Student Satisfaction Research: Historical Perspectives
According to Gamelin (1953) and Baghban-Cichani (1981), initial research on college student
satisfaction can be traced to the 1920s and 1930s. During these early years, most studies were based on
student faculty and course evaluations (Douglas, 1928; Gutherie, 1927; Heilman & Armentrout, 1936;
Remmers, 1939). One example of this early research is Bird’s study (as cited in Baghban-Cichani, 1981)
6
where he sought the answer to the question: “‘What have been your most satisfying and your most
annoying experiences as a pupil during your entire school and college career?’” (p. 14). Although some of
these early surveys included items related to multiple (e.g., instructor and course) characteristics, these
research findings only provided measures for overall satisfaction (Gamelin). Few formal studies related to
college student satisfaction were conducted by higher education researchers until the early 1940s. One of
the most notable investigations was Berdie’s (1944) modification of Hoppock’s Job Satisfaction Blank to
create a measure of curriculum satisfaction. This study represents the first attempt to investigate college
student satisfaction based on instrumentation specifically designed to test the satisfaction construct.
Additional research was performed by graduate students in the form of dissertations (e.g., Almos,
1956; Ducanis, 1961; Gamelin, 1953; McElheny, 1950) during the 1950s and early 1960s. These studies
were limited to local college student populations, so generalizability beyond the selected samples was not
possible. This work provided an opportunity for the advancement of research on college student
satisfaction, but there was a paucity of research studies during this time. Rand (1968) suggested that the
unwillingness of colleges and universities to make public information regarding student opinion toward
their current institution was a primary factor for the lack of research on college student satisfaction. It is
interesting to note that Gamelin’s dissertation documented the reluctance of two University of Minnesota
College presidents regarding his study. One president said:
“In a college as small as _____, our avenues of communication are by design kept very clear and
very free. I honestly think we are in a better position to know the answers to the questions raised
in your plan than could be derived from some such outside study as you have in mind”. (p. 22)
A second college president stated: “‘I read the [survey] questions myself, and I don’t quite see how _____
College or its students can profit from this undertaking’” (Gamelin, p. 22).
With the onset of student demonstrations, protests, and other acts of civil disobedience through
the early 1970s, the importance of assessing student satisfaction was realized. Betz, Menne, Starr, and
Klingensmith (1971) acknowledged that college student satisfaction is “possibly one of the clearest
indicators of the extent of student unrest” (p. 99). Schmidt and Sedlacek (1972), while also recognizing
7
the relationship between student satisfaction and institutional climate, included an exhortation for further
research on satisfaction:
It seems apparent, on the basis of recent events on college and university campuses, that students
are becoming more and more expressive of their dissatisfaction with certain aspects of their
educational experiences. . . . Nonetheless, so little is known about student dissatisfaction,
alienation, or disaffection with their environment that a systematic study of the phenomenon
seems imperative if some way of dealing with it is to be formulated. (p. 233)
In light of this growing awareness of college student satisfaction as an “ever-present campus variable”
(Betz et al., 1970, p. 99), relatively few studies conducted in the 1970s on postsecondary education
focused on student satisfaction as a substantive area of research (Delucchi, 2003; Morstain, 1977).
However, a series of studies led by Ellen Betz (See Betz et al., 1971; Betz, Starr, & Menne, 1972) during
the early 1970s is worth mentioning because her research involved the development and pilot testing of a
new student satisfaction survey. Aptly named the College Satisfaction Survey (CSS), this instrument was
the first to be developed with proper consideration given to psychometric issues.
Yet, the 1970s were marked by other events that made this decade pivotal to the study of college
student satisfaction for American colleges and universities. Pascarella and Terenzini (1991) attributed two
things to the development of college student research during this time: (a) the increased number of
theories and models for college student development introduced during the late 1960s and early 1970s
and (b) the advances in computing technology that made computers and statistical analysis software
readily available. These two advances resulted in a new research perspective that used regression
techniques to study the “’unique,’ ‘net,’ or ‘unconfounded’ effects of such factors as college
characteristics or individual collegiate experiences on student development” (Pascarella & Terenzini,
1991, p. 3).
The rapid increase in the number of students enrolling in institutions of higher education was
another key occurrence. College and university enrollments were impacted by rising unemployment rates
and large high school graduating classes due to the baby boom of post-World War II (Delucchi, 2003),
8
thus student populations were more diverse. Demographics indicated that a larger percentage of students
were nonwhite, women, and adults over the age of 25 (Levine, as cited in Delucchi; Robinson, 1969;
Sturtz, 1971). Assessing student opinion became more important for the benefit of the institution and the
individual.
Lastly, because of the national economic downturn of the 1970s and the failure of state
legislatures to budget for the growing costs associated with larger student enrollments, many colleges and
universities were placed in a difficult financial position (Delucchi, 2003). As such, public criticism grew
regarding (a) the rising costs for a postsecondary education, (b) the effectiveness of academic programs,
and (c) the value of undergraduate teaching and curriculum (Carnegie Foundation for the Advancement of
Teaching 1977, as cited in Delucchi). These concerns increased pressure for institutional accountability,
and this new era of heightened student consumerism drew more attention to measures of student
satisfaction (Morstain, 1977).
The student as consumer model gained popularity during the 1980s. Litten (1980) contributes this
to the continued practice of decreased funding, increased program and service demands, and declining
enrollments. Market research practices were implemented at many colleges and universities, yet students
were considered to be “input to satisfy the institution’s needs” (Conant, Brown, & Mokwa, 1985, p. 13).
Chadwick and Ward (1987) stated “most studies of students as consumers of higher education have been
flawed by an incomplete view of the marketing concepts” (p. 236). Conant et al. (1985) claimed that the
study of student satisfaction would help to better apply marketing concepts for higher education.
This is not to assert that student satisfaction was not identified as an important construct during
this time. To the contrary, college and university administrators continued to recognize student
satisfaction as a measure of institutional effectiveness (Astin, Korn, & Green, 1987; Cameron, as cited in
Pike, 1991). Hearn (1985), with great foresight, postulated that higher education assessment would be
paralleled by increasing research on student satisfaction. Yet, Bean and Bradley (1986) contended that the
study of college student satisfaction was still relatively uncommon, even though it was a frequently used
construct in college student research relating to issues such as student retention and attrition.
9
Over the past two decades, higher education research has begun to focus on the origins and utility
of college student satisfaction as a construct. Rather than simply reportimg levels of student satisfaction,
the more common practice of prior college student satisfaction research, recent investigations (e.g.,
Beltyukova & Fox, 2002; Benjamin & Hollings, 1995, 1997; Elliott & Shin, 2002) have attempted to
offset the plethora of studies that are “atheoretical, unidimensional, psychological, and focused on student
satisfaction with campus-based services and facilities” (Benjamin & Hollings, 1995, p. 574). Such studies
have imposed a critical eye on college student satisfaction research, a level of scrutiny that has been
missing since the inception of study in this area.
Still, much of the research on college student satisfaction is based on information gathered from
the administration of commercially available instruments that purport to measure college student
satisfaction. Most notable of these instruments are the Noel-Levitz Student Satisfaction Inventory (1994)
and the College Student Survey (Astin, 1993). The general acceptance of survey findings based on the
interpretation of means and standard deviations, although appropriate and necessary for practitioners,
continues to undermine investigations on college student satisfaction based on testable theory and
rigorous statistical methodology. Benjamin and Hollings (1997) explained:
Creating and testing theoretical models encourages rigor in design, shapes data collection and
analysis, and is key to the interpretation of results. However, those concerned with practice may
perceive these strengths as liabilities in that theory can limit choices, increase cost, and
complicate practice. (p. 213)
Benjamin and Hollings’ assessment is accurate. However, based on this review of the history of college
student satisfaction research, it is surprising that an avid interest in the development, investigation, and
subsequent revision of satisfaction theory has been only a recent concern.
College Student Satisfaction Definitions
The definitions of college student satisfaction are many and varied. Originating from research on
job satisfaction, common definitions of student satisfaction have been extrapolated from descriptions of
job satisfaction (Reed et al., 1984). One of the first definitions proposed for college student satisfaction is
10
from Roy’s (1949) College Satisfaction Index. For this instrument, student satisfaction was defined “as an
attitude toward the different phases of the college environment” (as cited in Baghban-Cichani, 1981,
p.16). Numerous other definitions have emerged over the years. For example, Oliver and DeSarbo (1988)
stated: “satisfaction refers to the favorability of a student’s subjective evaluation of the various outcomes
and experiences associated with education” (p. 198). Delucchi (2003) defined student satisfaction as “an
individual’s subjective experience during college and perceptions of the value of various aspects of the
educational process” (p. 9), while Bean and Bradley (1986) defined student satisfaction as “a pleasurable
emotional state resulting from a person’s enactment of the role of being a student” (p. 398). Starr, Betz,
and Menne (1972) simply defined the construct as “the extent to which an individual feels the
environment is meeting his needs” (p. 318).
Other definitions found in the higher education literature are more complex and draw on
psychological terminology. They describe the construct of satisfaction, not necessarily student
satisfaction. Hammer and Organ (1978) described satisfaction as “a person’s attitude toward an
object….that represents a complex assemblage of cognitions (beliefs or knowledge), emotions (feelings,
sentiments or evaluations) and behavioral tendencies” (p. 216). Reed et al. (1984) stated that “satisfaction
can be seen as subjective, a personal experience, evaluative in time, and involving effect [sic] or feeling
on the part of the individual” (p. 68). Although these definitions are not specific to college student
satisfaction per se, they provide some understanding regarding the operational definitions that have been
used to understand the traditional archetype.
College student satisfaction has also been defined according to market research practices. These
definitions are related to “the concepts of expectations, experience, perceived service, and a resulting
evaluation” (Hom, 2002, p. 2). Conant et al. (1985) defined consumer satisfaction “as a determination of
whether the outcomes associated with the use of a product/service reached expected levels or standards of
performance” (p. 13). Kotler and Clarke (1987) provided a similar definition of consumer satisfaction:
“Satisfaction is the state felt by a person who has experienced a performance (or outcome) that has
fulfilled his or her expectation. Satisfaction is thus a function of relative levels of expectation and
11
perceived performance” (p. 72). Oliver (1997) also described consumer satisfaction as a fulfillment
response: “It is a judgment that a product or service feature, or the product or service itself, provided (or
is providing) a pleasurable level of consumption-related fulfillment, including levels of under- or over-
fulfillment” (p. 75). Athiyaman (1997) provided a more succinct definition: “Consumer satisfaction is a
transaction-specific short-term overall attitude” (p. 531). Hom (2002) cautioned academic researchers and
planners regarding the variety of definitions based on customer satisfaction theory (CST). CST
researchers are not in agreement regarding a standard definition.
Research on college student satisfaction requires the formation of clear and precise definitions for
the construct. However, it is apparent from this review that there is no single, universal definition for
college student satisfaction. Guolla (1999) provided an important reminder for the research community by
stating that different definitions imply different constructs and ultimately different measures of college
student satisfaction.
Measuring College Student Satisfaction with the Noel-Levitz SSI
The surveys developed to measure college student satisfaction have been varied regarding the
approaches to measuring the satisfaction construct. The surveys differ in the number of items, scales, and
subscales that are used to assess satisfaction. This certainly implies different theoretical emphases toward
the understanding of satisfaction. There are too many surveys that have been developed to provide an
exhaustive discussion of each one. However, one of the more popular satisfaction instruments will be
used due to its permanence in the higher education literature.
Sample
For both the 2004 and 2007 SSI administrations, courses rather than students were selected for
participation. The total university enrollment for the two semesters was approximately 30,000 students, so
the selected sample sizes for each of the two SSI administrations should have been around 6,000 students.
However, the enrollments for the selected courses totaled 3,200 students in 2004 and 2,200 students in
2007. Both figures were below the suggested guidelines proposed by Noel-Levitz. The reasons for the
selection of a smaller sample size are not known. The number of returned surveys was 1,846 for 2004 and
12
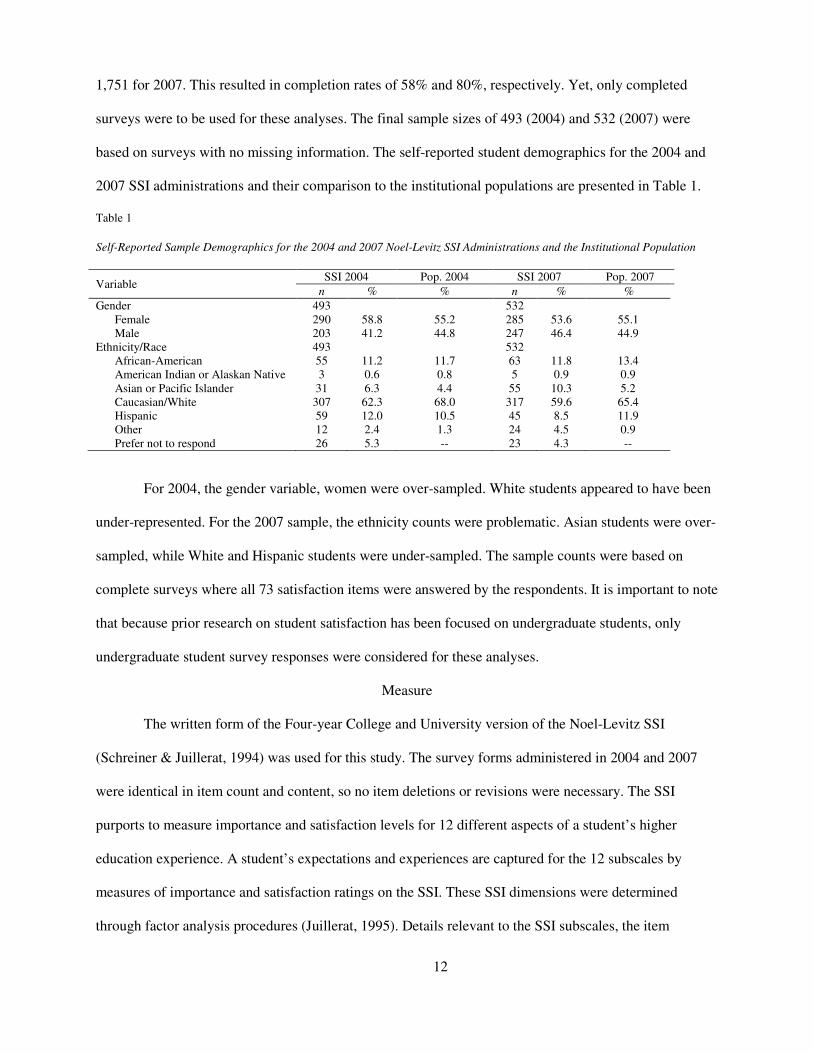
1,751 for 2007. This resulted in completion rates of 58% and 80%, respectively. Yet, only completed
surveys were to be used for these analyses. The final sample sizes of 493 (2004) and 532 (2007) were
based on surveys with no missing information. The self-reported student demographics for the 2004 and
2007 SSI administrations and their comparison to the institutional populations are presented in Table 1.
Table 1
Self-Reported Sample Demographics for the 2004 and 2007 Noel-Levitz SSI Administrations and the Institutional Population
Variable SSI 2004 Pop. 2004 SSI 2007 Pop. 2007
n % % n % %
Gender 493 532
Female 290 58.8 55.2 285 53.6 55.1
Male 203 41.2 44.8 247 46.4 44.9
Ethnicity/Race 493 532
African-American 55 11.2 11.7 63 11.8 13.4
American Indian or Alaskan Native 3 0.6 0.8 5 0.9 0.9
Asian or Pacific Islander 31 6.3 4.4 55 10.3 5.2
Caucasian/White 307 62.3 68.0 317 59.6 65.4
Hispanic 59 12.0 10.5 45 8.5 11.9
Other 12 2.4 1.3 24 4.5 0.9
Prefer not to respond 26 5.3 -- 23 4.3 --
For 2004, the gender variable, women were over-sampled. White students appeared to have been
under-represented. For the 2007 sample, the ethnicity counts were problematic. Asian students were over-
sampled, while White and Hispanic students were under-sampled. The sample counts were based on
complete surveys where all 73 satisfaction items were answered by the respondents. It is important to note
that because prior research on student satisfaction has been focused on undergraduate students, only
undergraduate student survey responses were considered for these analyses.
Measure
The written form of the Four-year College and University version of the Noel-Levitz SSI
(Schreiner & Juillerat, 1994) was used for this study. The survey forms administered in 2004 and 2007
were identical in item count and content, so no item deletions or revisions were necessary. The SSI
purports to measure importance and satisfaction levels for 12 different aspects of a student’s higher
education experience. A student’s expectations and experiences are captured for the 12 subscales by
measures of importance and satisfaction ratings on the SSI. These SSI dimensions were determined
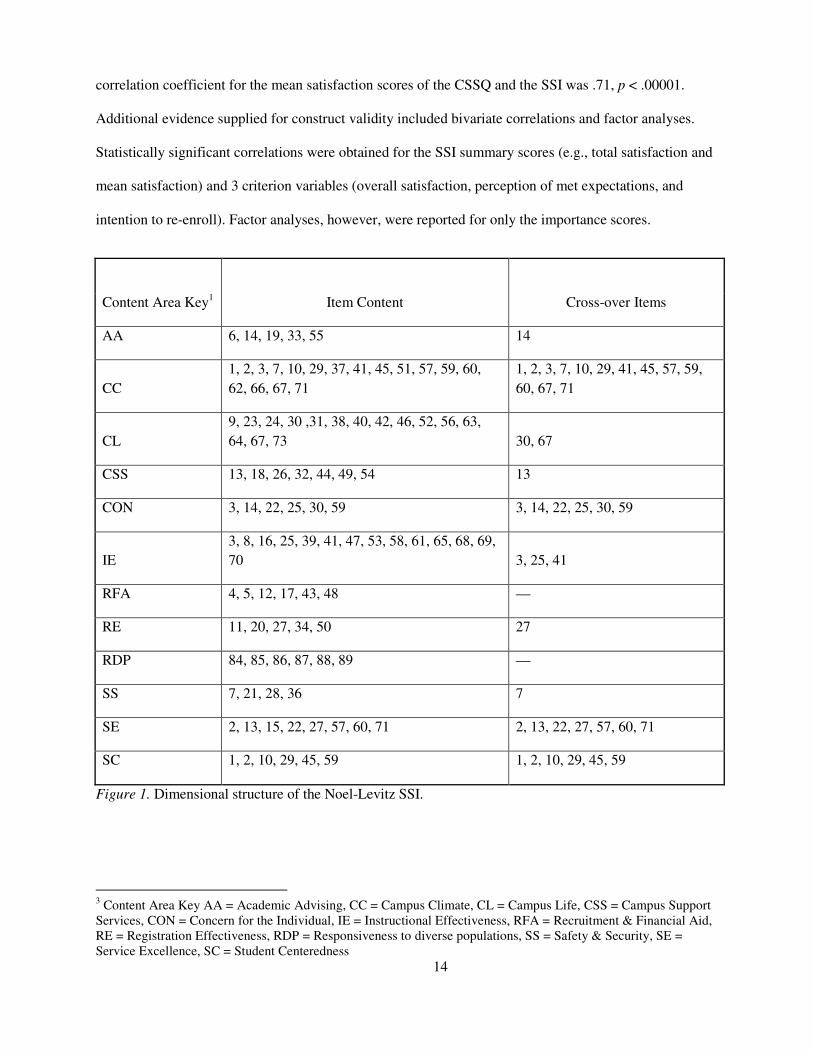
through factor analysis procedures (Juillerat, 1995). Details relevant to the SSI subscales, the item

13
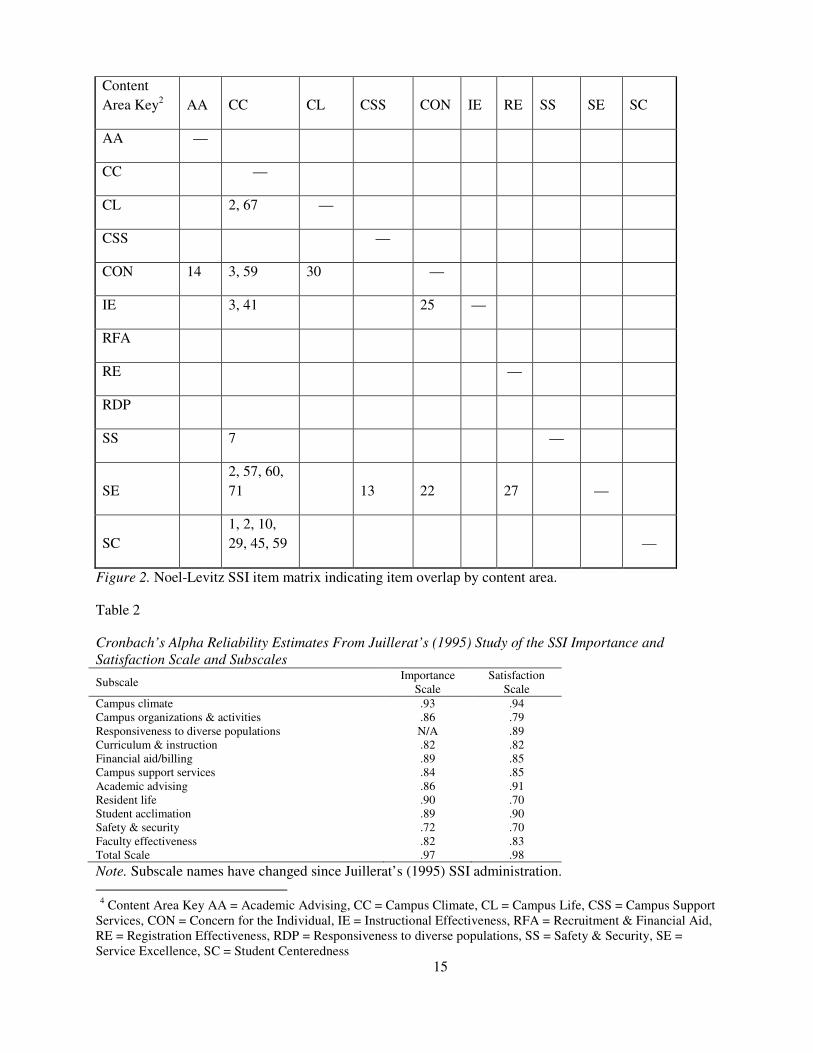
content, and item placement are presented in Figure 1. Because a number of items overlapped (termed
cross-over items) one or more subscales, a second graphic was created to demonstrate the extent of the
overlap (see Figure 2). These figures helped to note the Student Centeredness subscale was subsumed by
the Campus Climate subscale and that items SAT35 and SAT72 were not attributed to a subscale.
The SSI allows respondents to provide an importance and a satisfaction rating for 73 SSI items.
Item response scales are based on a 7-point Likert-type scale with response options ranging from “not
important/satisfied at all” (1) to “very important/satisfied” (7). Options are included for “does not apply”
and “not available /not used” for the importance and satisfaction scales, respectively. The SSI also
includes 14 demographic items to facilitate further item analyses.
Noel-Levitz, Inc. prepares a series of reports to help college and university administrators
interpret survey results. These reports are designed to provide information specifying both institutional
strengths and weaknesses. The standard SSI reports include frequency and percentage values for the
sample demographics. Descriptive statistics for institutional ratings of importance, satisfaction, and a gap
measure (the difference between importance and satisfaction measures) for the subscales are provided.
Standard data analyses include statistical tests for mean score differences between institutional and
national comparison groups. Only attitudinal measures of student satisfaction are of interest for this study.
Importance and gap measures will not be considered.
The development process and the psychometric properties of the SSI were discussed in detail by
Juillerat (1995). Reliability estimates were calculated for the importance and satisfaction scales and
subscales. Reliability values were .97 and .98, respectively. Reliabilities were calculated for the 11
importance and satisfaction subscales (see Table 2). The values ranged from .72 for safety and security to
.93 for campus climate. No reliability analyses were conducted for subgroups (e.g., gender, race). Test-
retest reliability was also determined based on a three-week time frame. For the two primary instrument
scales, the test-retest reliability coefficient was .85 for importance and .84 for satisfaction.
Juillerat (1995) also conducted a validation study with scores from the CSSQ. The Pearson r
14
correlation coefficient for the mean satisfaction scores of the CSSQ and the SSI was .71, p < .00001.
Additional evidence supplied for construct validity included bivariate correlations and factor analyses.
Statistically significant correlations were obtained for the SSI summary scores (e.g., total satisfaction and
mean satisfaction) and 3 criterion variables (overall satisfaction, perception of met expectations, and
intention to re-enroll). Factor analyses, however, were reported for only the importance scores.
Content Area Key1 Item Content Cross-over Items
AA 6, 14, 19, 33, 55 14
CC
1, 2, 3, 7, 10, 29, 37, 41, 45, 51, 57, 59, 60,
62, 66, 67, 71
1, 2, 3, 7, 10, 29, 41, 45, 57, 59,
60, 67, 71
CL
9, 23, 24, 30 ,31, 38, 40, 42, 46, 52, 56, 63,
64, 67, 73 30, 67
CSS 13, 18, 26, 32, 44, 49, 54 13
CON 3, 14, 22, 25, 30, 59 3, 14, 22, 25, 30, 59
IE
3, 8, 16, 25, 39, 41, 47, 53, 58, 61, 65, 68, 69,
70 3, 25, 41
RFA 4, 5, 12, 17, 43, 48 —
RE 11, 20, 27, 34, 50 27
RDP 84, 85, 86, 87, 88, 89 —
SS 7, 21, 28, 36 7
SE 2, 13, 15, 22, 27, 57, 60, 71 2, 13, 22, 27, 57, 60, 71
SC 1, 2, 10, 29, 45, 59 1, 2, 10, 29, 45, 59
Figure 1. Dimensional structure of the Noel-Levitz SSI.
3 Content Area Key AA = Academic Advising, CC = Campus Climate, CL = Campus Life, CSS = Campus Support
Services, CON = Concern for the Individual, IE = Instructional Effectiveness, RFA = Recruitment & Financial Aid,
RE = Registration Effectiveness, RDP = Responsiveness to diverse populations, SS = Safety & Security, SE =
Service Excellence, SC = Student Centeredness
15
Content
Area Key2 AA CC CL CSS CON IE RE SS SE SC
AA —
CC —
CL 2, 67 —
CSS —
CON 14 3, 59 30 —
IE 3, 41 25 —
RFA
RE —
RDP
SS 7 —
SE
2, 57, 60,
71 13 22 27 —
SC
1, 2, 10,
29, 45, 59 —
Figure 2. Noel-Levitz SSI item matrix indicating item overlap by content area.
Table 2
Cronbach’s Alpha Reliability Estimates From Juillerat’s (1995) Study of the SSI Importance and
Satisfaction Scale and Subscales
Subscale Importance
Scale
Satisfaction
Scale
Campus climate .93 .94
Campus organizations & activities .86 .79
Responsiveness to diverse populations N/A .89
Curriculum & instruction .82 .82
Financial aid/billing .89 .85
Campus support services .84 .85
Academic advising .86 .91
Resident life .90 .70
Student acclimation .89 .90
Safety & security .72 .70
Faculty effectiveness .82 .83
Total Scale .97 .98
Note. Subscale names have changed since Juillerat’s (1995) SSI administration.
24
Content Area Key AA = Academic Advising, CC = Campus Climate, CL = Campus Life, CSS = Campus Support
Services, CON = Concern for the Individual, IE = Instructional Effectiveness, RFA = Recruitment & Financial Aid,
RE = Registration Effectiveness, RDP = Responsiveness to diverse populations, SS = Safety & Security, SE =
Service Excellence, SC = Student Centeredness
16
Procedures
Survey Administration
The SSI administrations occurred during the fall semesters of 2004 and 2007. Stratified random
samples were created based on course enrollment files. Specific courses were selected because their
enrollment counts reflected the university student population for demographic characteristics, such as
selected major, classification level, student gender, and student ethnicity. Survey packets were distributed
during the month of October to instructors whose courses were selected for participation. Each survey
packet included an instruction letter for the faculty member, student information letters, and the SSI
survey forms. The surveys were completed during class time, collected, and returned to the institutional
research (IR) office. Faculty were sent reminders after two weeks if their survey packets had not been
received by the IR office. All surveys were sent to Noel-Levitz, Inc. for processing. Institutional survey
reports were received approximately four weeks later. Supplementary data files of all survey responses
were also received to facilitate additional data inquiries.
Data Analyses
Several pre-processing analyses will be applied to both institutional SSI data files to ensure a high
level of data integrity is established for the statistical methodologies employed for this study. This data
screening (Tabachnick & Fidell, 2001) will assess the univariate and multivariate distributions of the
items specific to each SSI subscale. SPSS Rel. 14 and EQS Rel. 6.1 (Bentler, 2006) will be used in
tandem for data verification. Univariate descriptive statistics will be available by using either the SPSS or
EQS programs. Multivariate descriptive statistics will also be obtained by using both programs. The EQS
multivaritate normality output displays (a) the Mardia’s normalized estimate statistic and (b) a case
number report detailing five cases with the largest contribution to the normalized estimate. SPSS syntax
(termed MULTINOR) presented by Henson (1999) will also be used to visually assess the multivariate
normality of a set of variables. This code generates SPSS scatter plots of the chi-square values and
17
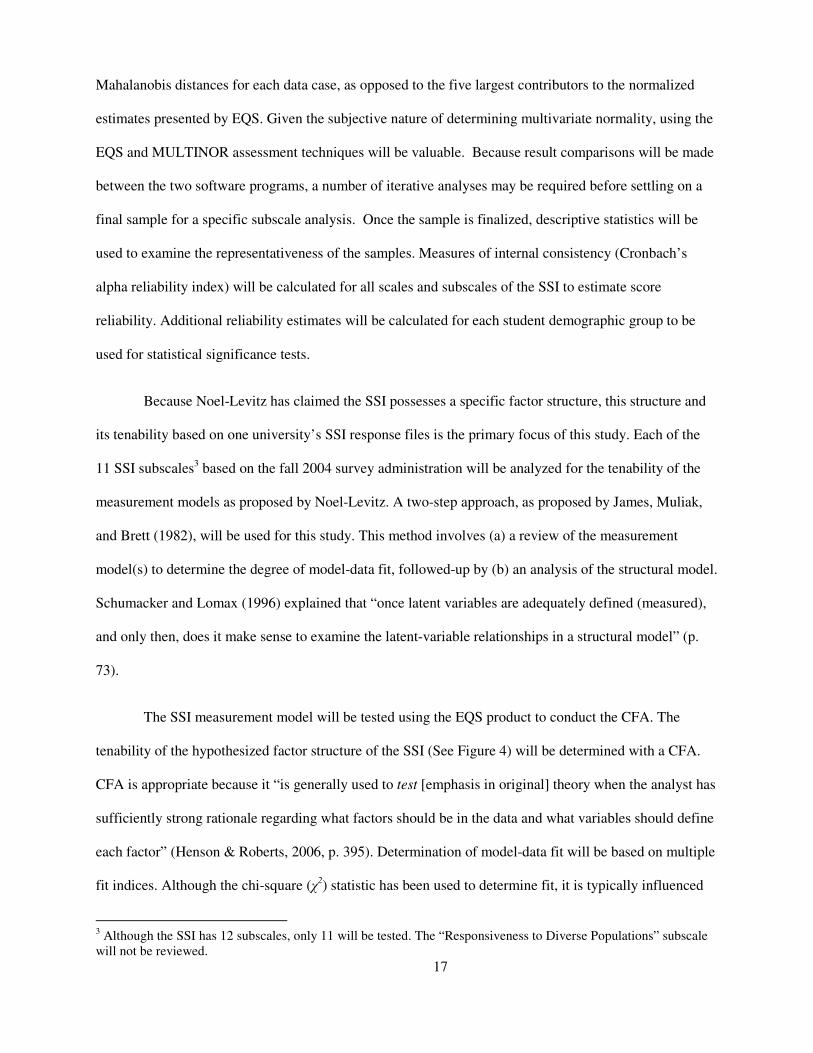
Mahalanobis distances for each data case, as opposed to the five largest contributors to the normalized
estimates presented by EQS. Given the subjective nature of determining multivariate normality, using the
EQS and MULTINOR assessment techniques will be valuable. Because result comparisons will be made
between the two software programs, a number of iterative analyses may be required before settling on a
final sample for a specific subscale analysis. Once the sample is finalized, descriptive statistics will be
used to examine the representativeness of the samples. Measures of internal consistency (Cronbach’s
alpha reliability index) will be calculated for all scales and subscales of the SSI to estimate score
reliability. Additional reliability estimates will be calculated for each student demographic group to be
used for statistical significance tests.
Because Noel-Levitz has claimed the SSI possesses a specific factor structure, this structure and
its tenability based on one university’s SSI response files is the primary focus of this study. Each of the
11 SSI subscales3 based on the fall 2004 survey administration will be analyzed for the tenability of the
measurement models as proposed by Noel-Levitz. A two-step approach, as proposed by James, Muliak,
and Brett (1982), will be used for this study. This method involves (a) a review of the measurement
model(s) to determine the degree of model-data fit, followed-up by (b) an analysis of the structural model.
Schumacker and Lomax (1996) explained that “once latent variables are adequately defined (measured),
and only then, does it make sense to examine the latent-variable relationships in a structural model” (p.
73).
The SSI measurement model will be tested using the EQS product to conduct the CFA. The
tenability of the hypothesized factor structure of the SSI (See Figure 4) will be determined with a CFA.
CFA is appropriate because it “is generally used to test [emphasis in original] theory when the analyst has
sufficiently strong rationale regarding what factors should be in the data and what variables should define
each factor” (Henson & Roberts, 2006, p. 395). Determination of model-data fit will be based on multiple
fit indices. Although the chi-square (χ2) statistic has been used to determine fit, it is typically influenced
3 Although the SSI has 12 subscales, only 11 will be tested. The “Responsiveness to Diverse Populations” subscale
will not be reviewed.
18
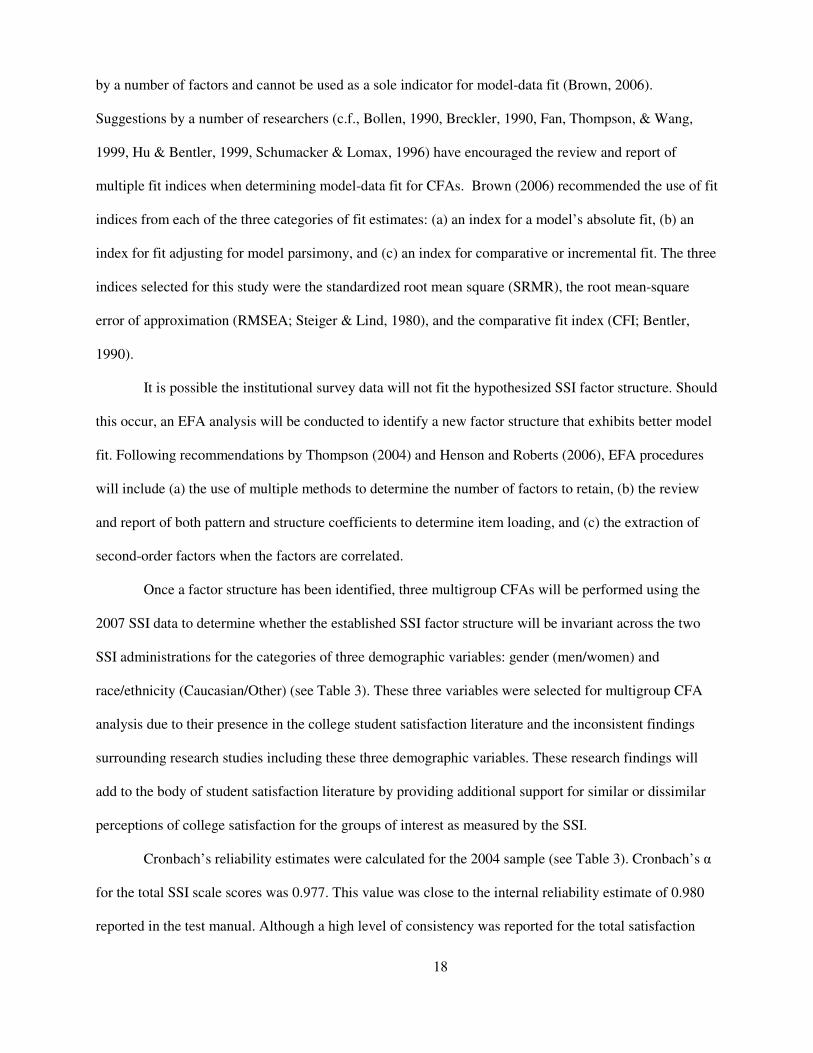
by a number of factors and cannot be used as a sole indicator for model-data fit (Brown, 2006).
Suggestions by a number of researchers (c.f., Bollen, 1990, Breckler, 1990, Fan, Thompson, & Wang,
1999, Hu & Bentler, 1999, Schumacker & Lomax, 1996) have encouraged the review and report of
multiple fit indices when determining model-data fit for CFAs. Brown (2006) recommended the use of fit
indices from each of the three categories of fit estimates: (a) an index for a model’s absolute fit, (b) an
index for fit adjusting for model parsimony, and (c) an index for comparative or incremental fit. The three
indices selected for this study were the standardized root mean square (SRMR), the root mean-square
error of approximation (RMSEA; Steiger & Lind, 1980), and the comparative fit index (CFI; Bentler,
1990).
It is possible the institutional survey data will not fit the hypothesized SSI factor structure. Should
this occur, an EFA analysis will be conducted to identify a new factor structure that exhibits better model
fit. Following recommendations by Thompson (2004) and Henson and Roberts (2006), EFA procedures
will include (a) the use of multiple methods to determine the number of factors to retain, (b) the review
and report of both pattern and structure coefficients to determine item loading, and (c) the extraction of
second-order factors when the factors are correlated.
Once a factor structure has been identified, three multigroup CFAs will be performed using the
2007 SSI data to determine whether the established SSI factor structure will be invariant across the two
SSI administrations for the categories of three demographic variables: gender (men/women) and
race/ethnicity (Caucasian/Other) (see Table 3). These three variables were selected for multigroup CFA
analysis due to their presence in the college student satisfaction literature and the inconsistent findings
surrounding research studies including these three demographic variables. These research findings will
add to the body of student satisfaction literature by providing additional support for similar or dissimilar
perceptions of college satisfaction for the groups of interest as measured by the SSI.
Cronbach’s reliability estimates were calculated for the 2004 sample (see Table 3). Cronbach’s α
for the total SSI scale scores was 0.977. This value was close to the internal reliability estimate of 0.980
reported in the test manual. Although a high level of consistency was reported for the total satisfaction
19
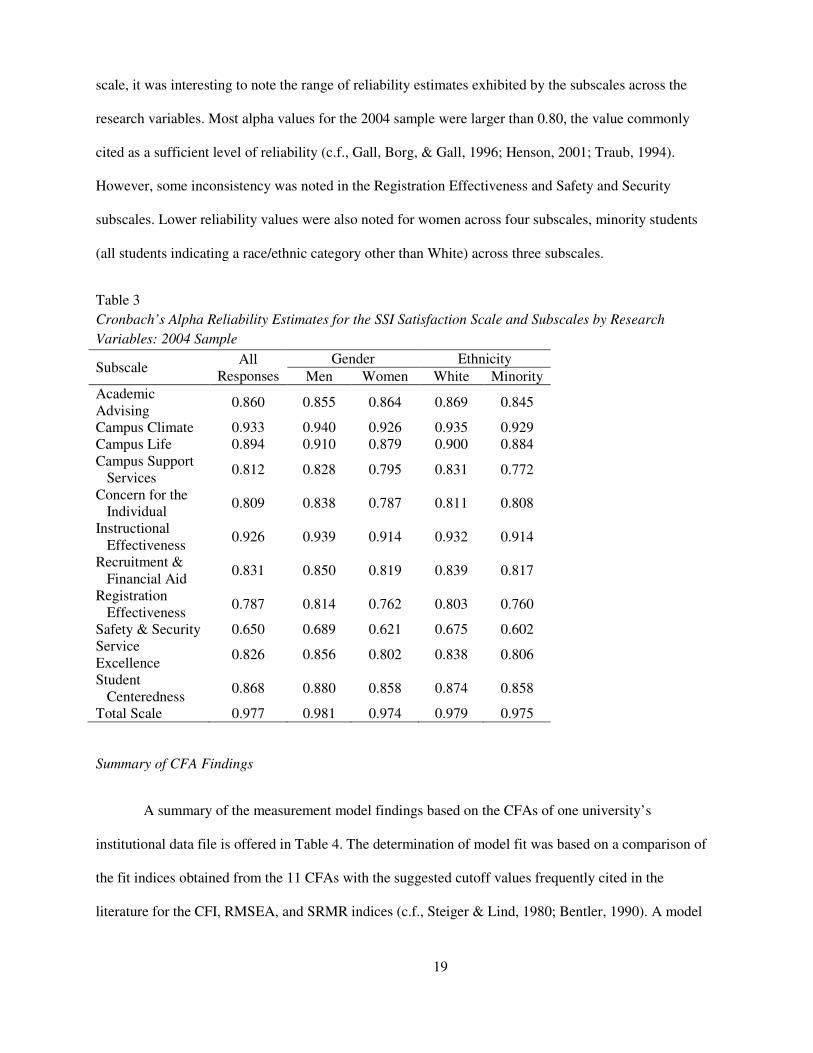
scale, it was interesting to note the range of reliability estimates exhibited by the subscales across the
research variables. Most alpha values for the 2004 sample were larger than 0.80, the value commonly
cited as a sufficient level of reliability (c.f., Gall, Borg, & Gall, 1996; Henson, 2001; Traub, 1994).
However, some inconsistency was noted in the Registration Effectiveness and Safety and Security
subscales. Lower reliability values were also noted for women across four subscales, minority students
(all students indicating a race/ethnic category other than White) across three subscales.
Table 3
Cronbach’s Alpha Reliability Estimates for the SSI Satisfaction Scale and Subscales by Research
Variables: 2004 Sample
Subscale All
Responses
Gender Ethnicity
Men Women White Minority
Academic
Advising 0.860 0.855 0.864 0.869 0.845
Campus Climate 0.933 0.940 0.926 0.935 0.929
Campus Life 0.894 0.910 0.879 0.900 0.884
Campus Support
Services 0.812 0.828 0.795 0.831 0.772
Concern for the
Individual 0.809 0.838 0.787 0.811 0.808
Instructional
Effectiveness 0.926 0.939 0.914 0.932 0.914
Recruitment &
Financial Aid 0.831 0.850 0.819 0.839 0.817
Registration
Effectiveness 0.787 0.814 0.762 0.803 0.760
Safety & Security 0.650 0.689 0.621 0.675 0.602
Service
Excellence 0.826 0.856 0.802 0.838 0.806
Student
Centeredness 0.868 0.880 0.858 0.874 0.858
Total Scale 0.977 0.981 0.974 0.979 0.975
Summary of CFA Findings
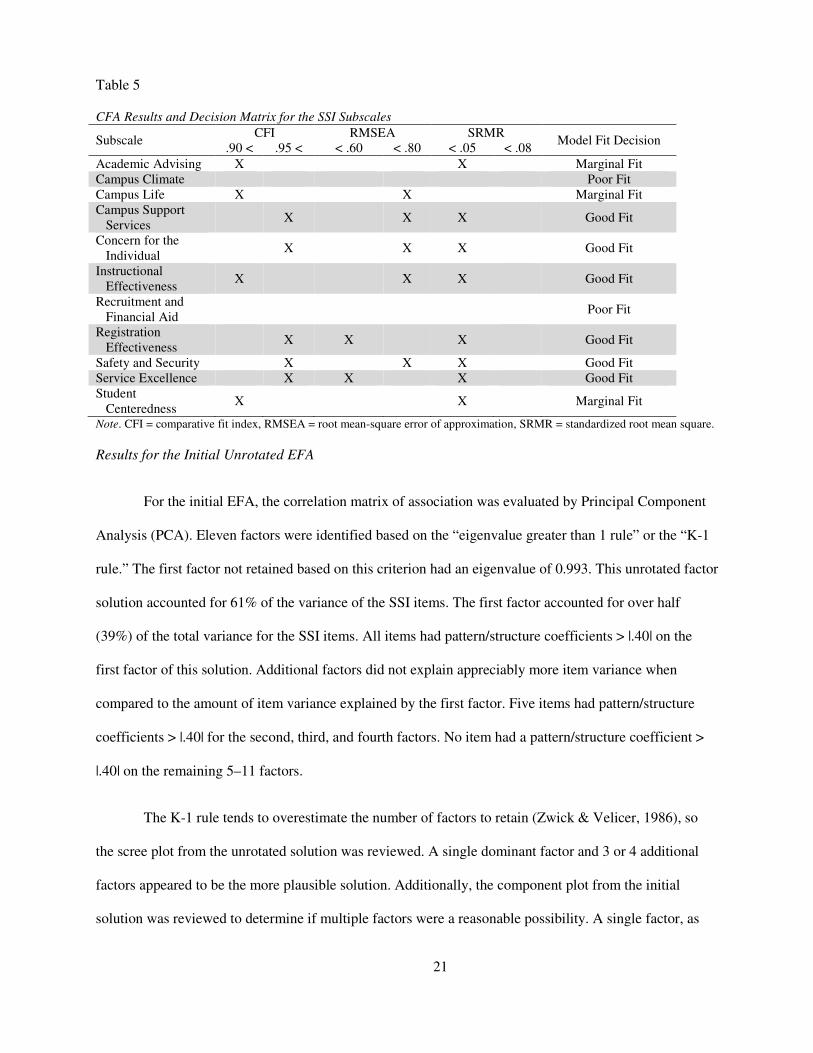
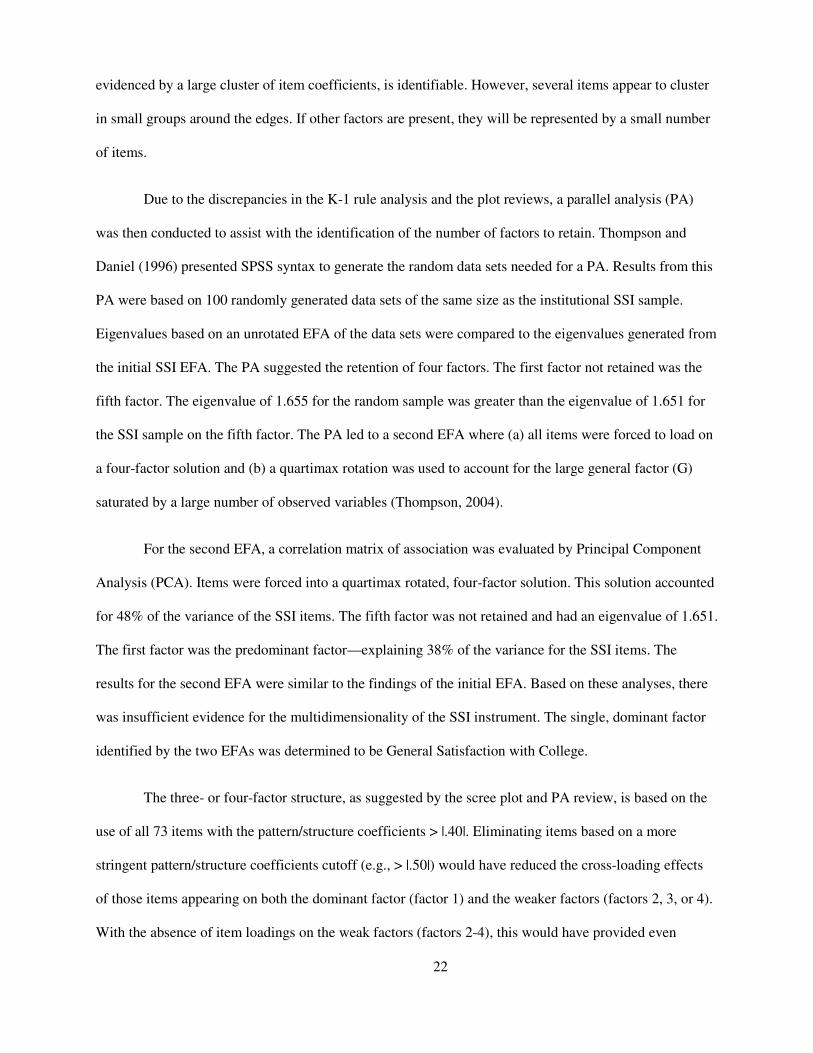
A summary of the measurement model findings based on the CFAs of one university’s
institutional data file is offered in Table 4. The determination of model fit was based on a comparison of
the fit indices obtained from the 11 CFAs with the suggested cutoff values frequently cited in the
literature for the CFI, RMSEA, and SRMR indices (c.f., Steiger & Lind, 1980; Bentler, 1990). A model
20
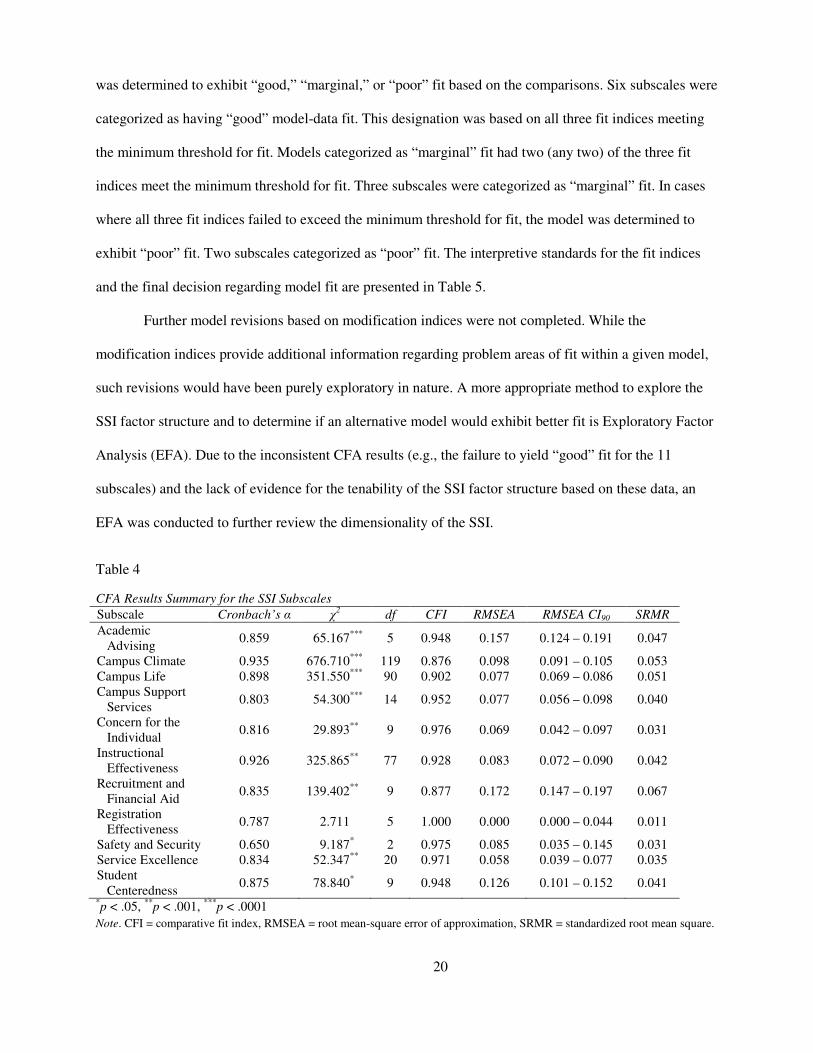
was determined to exhibit “good,” “marginal,” or “poor” fit based on the comparisons. Six subscales were
categorized as having “good” model-data fit. This designation was based on all three fit indices meeting
the minimum threshold for fit. Models categorized as “marginal” fit had two (any two) of the three fit
indices meet the minimum threshold for fit. Three subscales were categorized as “marginal” fit. In cases
where all three fit indices failed to exceed the minimum threshold for fit, the model was determined to
exhibit “poor” fit. Two subscales categorized as “poor” fit. The interpretive standards for the fit indices
and the final decision regarding model fit are presented in Table 5.
Further model revisions based on modification indices were not completed. While the
modification indices provide additional information regarding problem areas of fit within a given model,
such revisions would have been purely exploratory in nature. A more appropriate method to explore the
SSI factor structure and to determine if an alternative model would exhibit better fit is Exploratory Factor
Analysis (EFA). Due to the inconsistent CFA results (e.g., the failure to yield “good” fit for the 11
subscales) and the lack of evidence for the tenability of the SSI factor structure based on these data, an
EFA was conducted to further review the dimensionality of the SSI.
Table 4
CFA Results Summary for the SSI Subscales
Subscale Cronbach’s α χ2 df CFI RMSEA RMSEA CI90 SRMR
Academic
Advising 0.859 65.167
*** 5 0.948 0.157 0.124 – 0.191 0.047
Campus Climate 0.935 676.710***
119 0.876 0.098 0.091 – 0.105 0.053
Campus Life 0.898 351.550***
90 0.902 0.077 0.069 – 0.086 0.051
Campus Support
Services 0.803 54.300
*** 14 0.952 0.077 0.056 – 0.098 0.040
Concern for the
Individual 0.816 29.893
** 9 0.976 0.069 0.042 – 0.097 0.031
Instructional
Effectiveness 0.926 325.865
** 77 0.928 0.083 0.072 – 0.090 0.042
Recruitment and
Financial Aid 0.835 139.402
** 9 0.877 0.172 0.147 – 0.197 0.067
Registration
Effectiveness 0.787 2.711 5 1.000 0.000 0.000 – 0.044 0.011
Safety and Security 0.650 9.187* 2 0.975 0.085 0.035 – 0.145 0.031
Service Excellence 0.834 52.347**
20 0.971 0.058 0.039 – 0.077 0.035
Student
Centeredness 0.875 78.840
* 9 0.948 0.126 0.101 – 0.152 0.041
*p < .05,
**p < .001,
***p < .0001
Note. CFI = comparative fit index, RMSEA = root mean-square error of approximation, SRMR = standardized root mean square.
21
Table 5
CFA Results and Decision Matrix for the SSI Subscales
Subscale CFI RMSEA SRMR
Model Fit Decision .90 < .95 < < .60 < .80 < .05 < .08
Academic Advising X X Marginal Fit
Campus Climate Poor Fit
Campus Life X X Marginal Fit
Campus Support
Services
X X X
Good Fit
Concern for the
Individual
X X X
Good Fit
Instructional
Effectiveness X X X
Good Fit
Recruitment and
Financial Aid
Poor Fit
Registration
Effectiveness
X X X
Good Fit
Safety and Security X X X Good Fit
Service Excellence X X X Good Fit
Student
Centeredness X X
Marginal Fit
Note. CFI = comparative fit index, RMSEA = root mean-square error of approximation, SRMR = standardized root mean square.
Results for the Initial Unrotated EFA
For the initial EFA, the correlation matrix of association was evaluated by Principal Component
Analysis (PCA). Eleven factors were identified based on the “eigenvalue greater than 1 rule” or the “K-1
rule.” The first factor not retained based on this criterion had an eigenvalue of 0.993. This unrotated factor
solution accounted for 61% of the variance of the SSI items. The first factor accounted for over half
(39%) of the total variance for the SSI items. All items had pattern/structure coefficients > |.40| on the
first factor of this solution. Additional factors did not explain appreciably more item variance when
compared to the amount of item variance explained by the first factor. Five items had pattern/structure
coefficients > |.40| for the second, third, and fourth factors. No item had a pattern/structure coefficient >
|.40| on the remaining 5–11 factors.
The K-1 rule tends to overestimate the number of factors to retain (Zwick & Velicer, 1986), so
the scree plot from the unrotated solution was reviewed. A single dominant factor and 3 or 4 additional
factors appeared to be the more plausible solution. Additionally, the component plot from the initial
solution was reviewed to determine if multiple factors were a reasonable possibility. A single factor, as
22
evidenced by a large cluster of item coefficients, is identifiable. However, several items appear to cluster
in small groups around the edges. If other factors are present, they will be represented by a small number
of items.
Due to the discrepancies in the K-1 rule analysis and the plot reviews, a parallel analysis (PA)
was then conducted to assist with the identification of the number of factors to retain. Thompson and
Daniel (1996) presented SPSS syntax to generate the random data sets needed for a PA. Results from this
PA were based on 100 randomly generated data sets of the same size as the institutional SSI sample.
Eigenvalues based on an unrotated EFA of the data sets were compared to the eigenvalues generated from
the initial SSI EFA. The PA suggested the retention of four factors. The first factor not retained was the
fifth factor. The eigenvalue of 1.655 for the random sample was greater than the eigenvalue of 1.651 for
the SSI sample on the fifth factor. The PA led to a second EFA where (a) all items were forced to load on
a four-factor solution and (b) a quartimax rotation was used to account for the large general factor (G)
saturated by a large number of observed variables (Thompson, 2004).
For the second EFA, a correlation matrix of association was evaluated by Principal Component
Analysis (PCA). Items were forced into a quartimax rotated, four-factor solution. This solution accounted
for 48% of the variance of the SSI items. The fifth factor was not retained and had an eigenvalue of 1.651.
The first factor was the predominant factor—explaining 38% of the variance for the SSI items. The
results for the second EFA were similar to the findings of the initial EFA. Based on these analyses, there
was insufficient evidence for the multidimensionality of the SSI instrument. The single, dominant factor
identified by the two EFAs was determined to be General Satisfaction with College.
The three- or four-factor structure, as suggested by the scree plot and PA review, is based on the
use of all 73 items with the pattern/structure coefficients > |.40|. Eliminating items based on a more
stringent pattern/structure coefficients cutoff (e.g., > |.50|) would have reduced the cross-loading effects
of those items appearing on both the dominant factor (factor 1) and the weaker factors (factors 2, 3, or 4).
With the absence of item loadings on the weak factors (factors 2-4), this would have provided even
23
stronger support for the single-factor solution observed in the EFAs.
Because the SSI analysis indicated all items were measuring satisfaction, an attempt was made to
reduce the number of indicators for the satisfaction construct. All 73 items were evaluated based on their
content and their initial pattern/structure coefficient values. The first 20 items with the highest
pattern/structure coefficients were selected for the development of a new model to be tested for
measurement invariance. The coefficients ranged from 0.670 to 0.764 for the satisfaction construct (the
first factor). By squaring the coefficients, the variance accounted for within these selected items was 45%
to 58%. Content for these 20 items appeared to span a variety of aspects of the college experience (e.g.,
college atmosphere, interaction with campus faculty/staff, academic support, student service). The new
model was termed General College Student Satisfaction.
Tests for Measurement Invariance
Determination of measurement invariance for the General Satisfaction construct across the groups
of interest was accomplished by a multistep process as suggested by Byrne (2006). The first step in this
process was the identification of a baseline model that fits each group’s data. This was an important first
step because “if markedly disparate measurement models are obtained between groups, this outcome
would contraindicate further invariance evaluation” (Brown, 2006, p. 271). The baseline model tested for
initial fit across groups within gender, and ethnicity was the single-factor model for the General
Satisfaction construct as measured by 20 SSI items. This model was previously tested and found to
exhibit adequate fit for the 2007 data sample. Both fit and modification indices were reviewed to evaluate
model fit for the baseline models.
Once baseline models were established, tests for configural invariance were conducted. In this
procedure, parameter estimates in the group’s baseline model were estimated simultaneously in a
multigroup analysis. By conducting the group analyses at the same time, the fit of the configural model
supplied the baseline value(s) against which all other invariance models were compared (Byrne, 2006).
The final assessment of invariance concerned the factor loadings and error variances. Equivalence of
24
factor loadings was the primary focus for this analysis because “tests for equivalence of error variances-
covariances are widely considered excessively stringent” (Byrne, 2006, p. 237). However, Byrne (2006)
stated that for the purpose of understanding the performance of a measurement instrument, knowing
whether all parameters (error variances-covariances, item cross-loadings) exhibit equivalence across
groups speaks to item quality and their measurement of the factor(s). Again, fit and modification indices
were reviewed to determine model performance.
Results for Invariance Tests by Student Gender
For this analysis, the complete 2007 SSI data file was split into two separate files, one for men
(n=247) and the other for women (n=285). Multivariate normality was reviewed for both genders using
the MULTINOR scatter plots of the chi-square and Mahalanobis distance for the 20 items. Nine cases
were removed, five from the women’s and four cases from the men’s file. Case removal improved the
MNE values. Descriptive statistics were also calculated and reviewed for each gender. The average
satisfaction rating for men was slightly lower than the rating for women. Score variability was slightly
higher for men. Kurtosis and skewness values were between -1.00 to +1.00 for all 20 items based on the
men’s responses. For the women, items 29 and 72 exhibited leptokurtosis and negative skewness. This
slight departure from normality was determined to be minor, so no additional reviews or case removals
were completed.
EQS code was created for each tested model. Four CFA procedures were run for the gender
variable. Two CFAs were single group solutions to determine the level of fit for the general satisfaction
model by each gender. A review of the fit indices (see Table 6) for the men and women samples indicated
a better model fit for the women. The RMSEA value for the men’s model was out of range for adequate
fit. Yet, a review of the standardized residual matrix suggested that no residual value was determined to
be statistically significant, so all parameter estimates exhibited reasonable fit for the men’s model. A
review of the standardized factor loadings also suggested the latent variable (General Satisfaction)
accounted for 47% to 73% of the variance of the selected SSI items. Based on additional information
25
provided by the CFA solution for the men’s sample, model fit was determined to be sufficient.
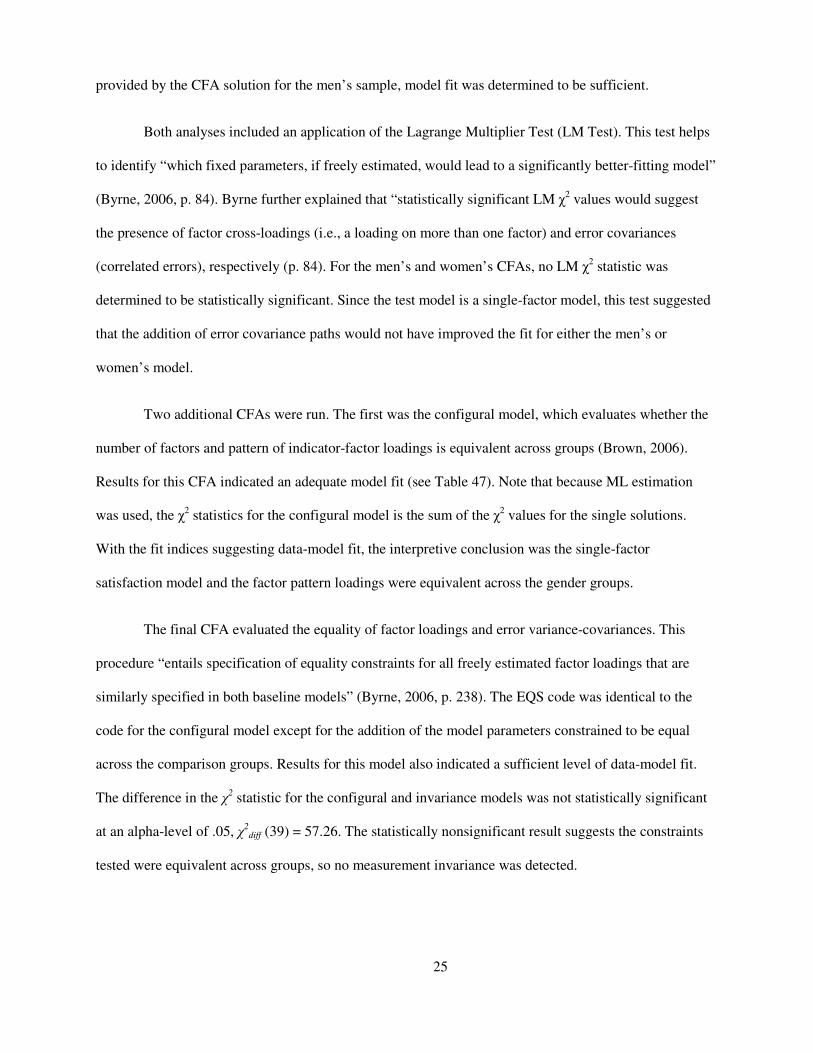
Both analyses included an application of the Lagrange Multiplier Test (LM Test). This test helps
to identify “which fixed parameters, if freely estimated, would lead to a significantly better-fitting model”
(Byrne, 2006, p. 84). Byrne further explained that “statistically significant LM χ2 values would suggest
the presence of factor cross-loadings (i.e., a loading on more than one factor) and error covariances
(correlated errors), respectively (p. 84). For the men’s and women’s CFAs, no LM χ2 statistic was
determined to be statistically significant. Since the test model is a single-factor model, this test suggested
that the addition of error covariance paths would not have improved the fit for either the men’s or
women’s model.
Two additional CFAs were run. The first was the configural model, which evaluates whether the
number of factors and pattern of indicator-factor loadings is equivalent across groups (Brown, 2006).
Results for this CFA indicated an adequate model fit (see Table 47). Note that because ML estimation
was used, the χ2 statistics for the configural model is the sum of the χ
2 values for the single solutions.
With the fit indices suggesting data-model fit, the interpretive conclusion was the single-factor
satisfaction model and the factor pattern loadings were equivalent across the gender groups.
The final CFA evaluated the equality of factor loadings and error variance-covariances. This
procedure “entails specification of equality constraints for all freely estimated factor loadings that are
similarly specified in both baseline models” (Byrne, 2006, p. 238). The EQS code was identical to the
code for the configural model except for the addition of the model parameters constrained to be equal
across the comparison groups. Results for this model also indicated a sufficient level of data-model fit.
The difference in the χ2 statistic for the configural and invariance models was not statistically significant
at an alpha-level of .05, χ2
diff (39) = 57.26. The statistically nonsignificant result suggests the constraints
tested were equivalent across groups, so no measurement invariance was detected.
26
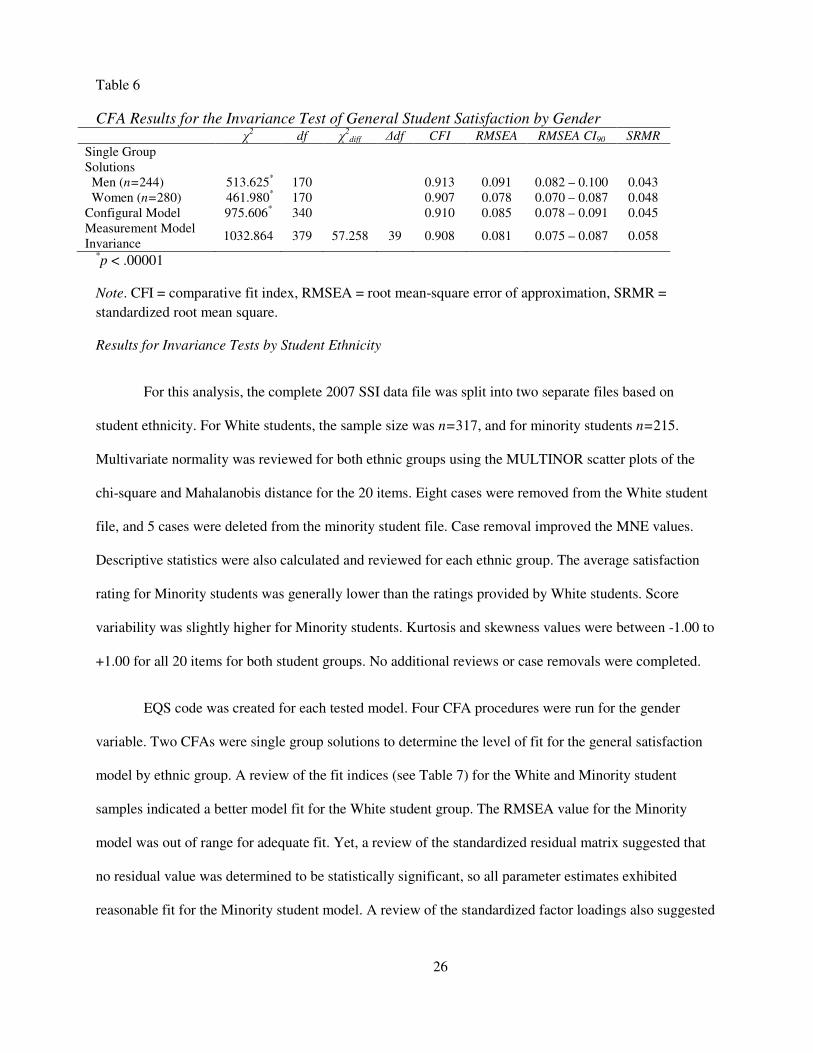
Table 6
CFA Results for the Invariance Test of General Student Satisfaction by Gender χ
2 df χ
2diff ∆df CFI RMSEA RMSEA CI90 SRMR
Single Group
Solutions
Men (n=244) 513.625* 170 0.913 0.091 0.082 – 0.100 0.043
Women (n=280) 461.980* 170 0.907 0.078 0.070 – 0.087 0.048
Configural Model 975.606* 340 0.910 0.085 0.078 – 0.091 0.045
Measurement Model
Invariance 1032.864 379 57.258 39 0.908 0.081 0.075 – 0.087 0.058
*p < .00001
Note. CFI = comparative fit index, RMSEA = root mean-square error of approximation, SRMR =
standardized root mean square.
Results for Invariance Tests by Student Ethnicity
For this analysis, the complete 2007 SSI data file was split into two separate files based on
student ethnicity. For White students, the sample size was n=317, and for minority students n=215.
Multivariate normality was reviewed for both ethnic groups using the MULTINOR scatter plots of the
chi-square and Mahalanobis distance for the 20 items. Eight cases were removed from the White student
file, and 5 cases were deleted from the minority student file. Case removal improved the MNE values.
Descriptive statistics were also calculated and reviewed for each ethnic group. The average satisfaction
rating for Minority students was generally lower than the ratings provided by White students. Score
variability was slightly higher for Minority students. Kurtosis and skewness values were between -1.00 to
+1.00 for all 20 items for both student groups. No additional reviews or case removals were completed.
EQS code was created for each tested model. Four CFA procedures were run for the gender
variable. Two CFAs were single group solutions to determine the level of fit for the general satisfaction
model by ethnic group. A review of the fit indices (see Table 7) for the White and Minority student
samples indicated a better model fit for the White student group. The RMSEA value for the Minority
model was out of range for adequate fit. Yet, a review of the standardized residual matrix suggested that
no residual value was determined to be statistically significant, so all parameter estimates exhibited
reasonable fit for the Minority student model. A review of the standardized factor loadings also suggested
27
the latent variable (General Satisfaction) accounted for 45% to 73% of the variance of the selected SSI
items. Based on additional information provided by the CFA solution for the Minority student sample,
model fit was determined to be sufficient.
Both analyses included an application of the Lagrange Multiplier Test (LM Test). This test helps
to indentify “which fixed parameters, if freely estimated, would lead to a significantly better-fitting
model” (Byrne, 2006, p. 84). Byrne further explained that “statistically significant LM χ2 values would
argue for the presence of factor cross-loadings (i.e., a loading on more than one factor) and error
covariances (correlated errors), respectively (p. 84). For the single solution CFAs, no LM χ2 statistic was
determined to be statistically significant. This test suggested that the addition of error covariance paths
would not have improved the fit for either student group.
Two additional CFAs were run. The first was the configural model which evaluates whether the
number of factors and pattern of indicator-factor loadings is equivalent across groups (Brown, 2006).
Results for this CFA indicated an adequate model fit (see Table 50). With the fit indices suggesting data-
model fit, the interpretive conclusion was the single-factor satisfaction model and the factor pattern
loadings were equivalent across the ethnic groups.
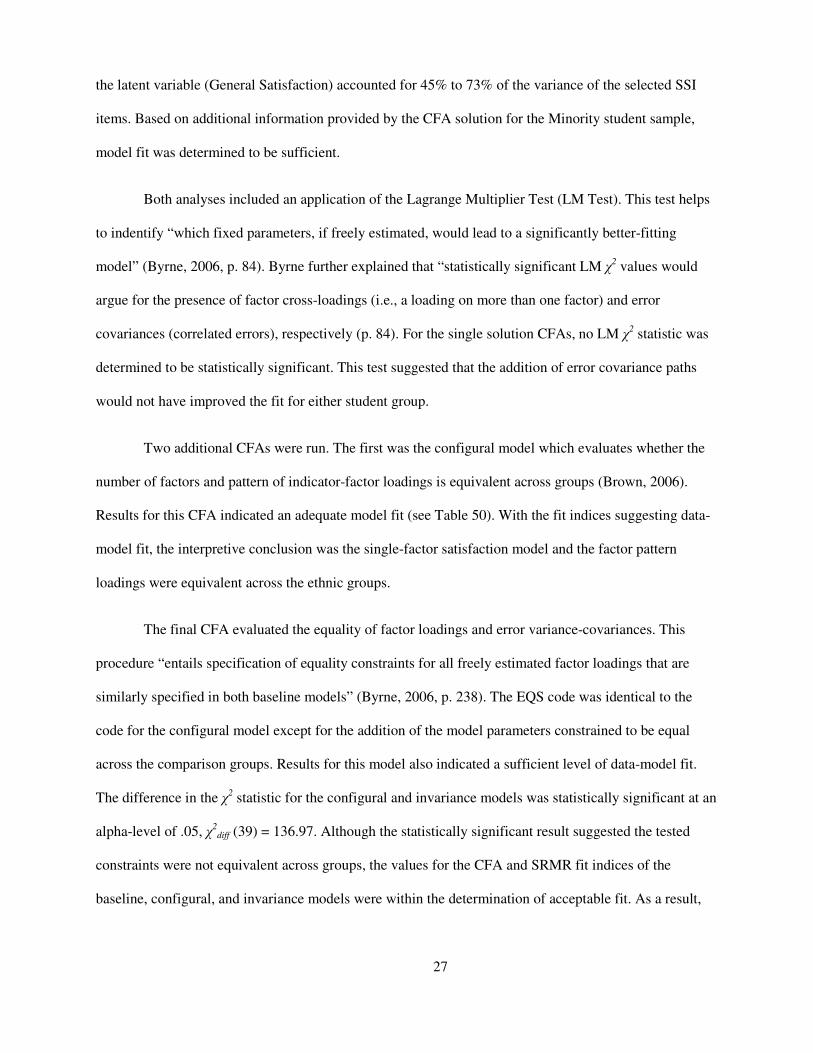
The final CFA evaluated the equality of factor loadings and error variance-covariances. This
procedure “entails specification of equality constraints for all freely estimated factor loadings that are
similarly specified in both baseline models” (Byrne, 2006, p. 238). The EQS code was identical to the
code for the configural model except for the addition of the model parameters constrained to be equal
across the comparison groups. Results for this model also indicated a sufficient level of data-model fit.
The difference in the χ2 statistic for the configural and invariance models was statistically significant at an
alpha-level of .05, χ2
diff (39) = 136.97. Although the statistically significant result suggested the tested
constraints were not equivalent across groups, the values for the CFA and SRMR fit indices of the
baseline, configural, and invariance models were within the determination of acceptable fit. As a result,
28
measurement invariance was determined to be absent from the ethnicity analyses.
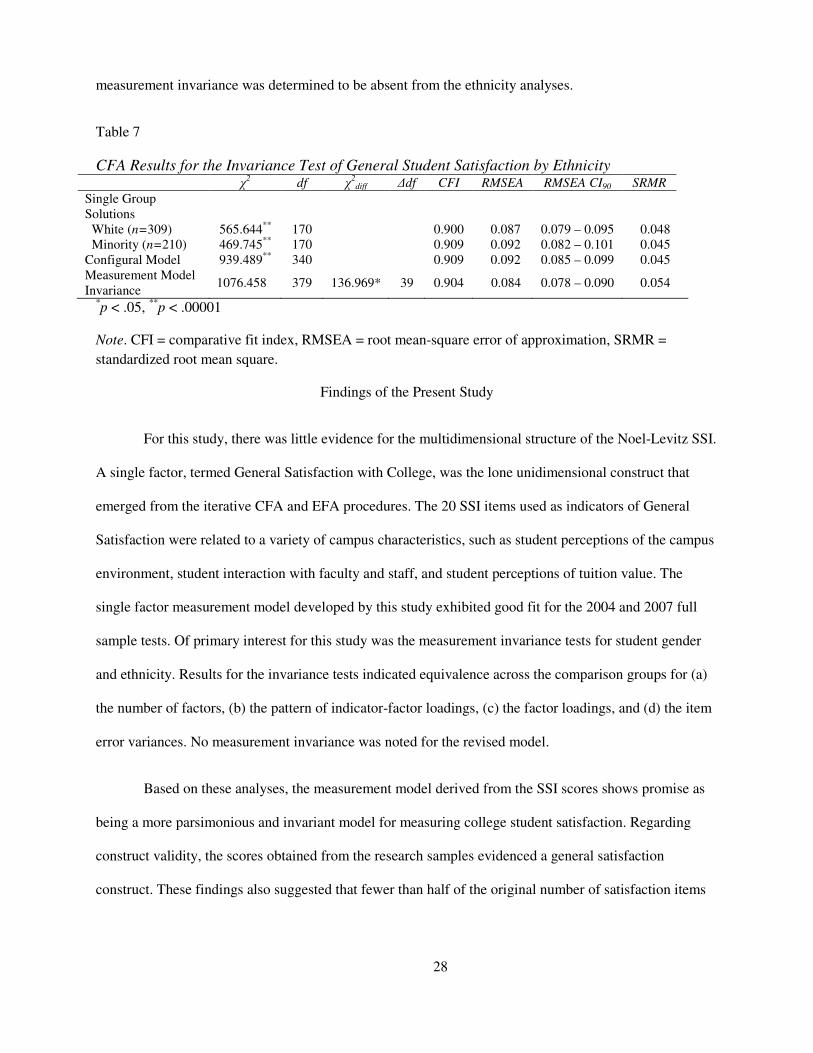
Table 7
CFA Results for the Invariance Test of General Student Satisfaction by Ethnicity χ
2 df χ
2diff ∆df CFI RMSEA RMSEA CI90 SRMR
Single Group
Solutions
White (n=309) 565.644**
170 0.900 0.087 0.079 – 0.095 0.048
Minority (n=210) 469.745**
170 0.909 0.092 0.082 – 0.101 0.045
Configural Model 939.489**
340 0.909 0.092 0.085 – 0.099 0.045
Measurement Model
Invariance 1076.458 379 136.969* 39 0.904 0.084 0.078 – 0.090 0.054
*p < .05,
**p < .00001
Note. CFI = comparative fit index, RMSEA = root mean-square error of approximation, SRMR =
standardized root mean square.
Findings of the Present Study
For this study, there was little evidence for the multidimensional structure of the Noel-Levitz SSI.
A single factor, termed General Satisfaction with College, was the lone unidimensional construct that
emerged from the iterative CFA and EFA procedures. The 20 SSI items used as indicators of General
Satisfaction were related to a variety of campus characteristics, such as student perceptions of the campus
environment, student interaction with faculty and staff, and student perceptions of tuition value. The
single factor measurement model developed by this study exhibited good fit for the 2004 and 2007 full
sample tests. Of primary interest for this study was the measurement invariance tests for student gender
and ethnicity. Results for the invariance tests indicated equivalence across the comparison groups for (a)
the number of factors, (b) the pattern of indicator-factor loadings, (c) the factor loadings, and (d) the item
error variances. No measurement invariance was noted for the revised model.
Based on these analyses, the measurement model derived from the SSI scores shows promise as
being a more parsimonious and invariant model for measuring college student satisfaction. Regarding
construct validity, the scores obtained from the research samples evidenced a general satisfaction
construct. These findings also suggested that fewer than half of the original number of satisfaction items

29
may be used as indicators for the satisfaction construct.
30
REFERENCES
Abrams, C. T. (2006). Comparison of satisfaction of academically under-prepared
students that persist and students that failed to persist at a four-year state
university. Doctoral dissertation, University of Arkansas, 2006.
Abrahamowicz, D. (1988). College involvement, perceptions, and satisfaction: A study of
membership in student organizations. Journal of College Student Development,
29, 233-238.
Allen, M. J., & Yen, W. M. (1979). Introduction to measurement theory. Monterey, CA:
Brooks/Cole.
Almos, K. O. (1956). A study of interrelationships between measured satisfaction with
college and certain academic and personality variables. Doctoral dissertation,
University of Minnesota, 1956.
American College Testing. (1997). Student Opinion Survey. Iowa City, IA: ACT, Inc.
American College Testing. (2002). Survey of Student Opinions. Iowa City, IA: ACT, Inc.
American Educational Research Association, American Psychological Association, &
National Council on Measurement in Education. (1999). Standards for
educational and psychological testing. Washington, DC: American Educational
Research Association.
American Psychological Association (1994). Publication manual of the American
Psychological Association. (4th ed.) Washington, DC: Author.
Astin, A. W. (1975). Preventing students from dropping out. San Francisco: Jossey-Bass.
Astin, A. W. (1977). Four critical years. San Francisco: Jossey-Bass.
Astin, A. W. (1993). What matters in college? Four critical years revisited. San
Francisco: Jossey-Bass.
Astin, A. W., Korn, W., & Green, K. (1987). Retaining and satisfying students.
Educational Record, 68, 36-42.
Athiyaman, A. (1997). Linking student satisfaction and service quality perceptions: The
case of university education. European Journal of Marketing, 31, 528-540.
31
Augelli, A. R., & Hershberger, S. L. (1993). African American undergraduates on a
predominantly white campus: Academic factors, social networks, and campus
climate. Journal of Negro Education, 62(1), 67-81.
Baghban-Cichani, I. (1981). College student satisfaction: A comparative study of selected
foreign and American students at Iowa State University. Doctoral dissertation,
Iowa State University, 1981.
Bailey, B. L., Bauman, C., & Lata, K. A. (1998). Student retention and satisfaction: The
evolution of a predictive model. Paper presented at the Annual Forum of the
Association for Institutional Research, Minneapolis, MN.
Baugh, F. (2002). Correcting effect sizes for score reliability: A reminder that
measurement and substantive issues are linked inextricably. Educational &
Psychological Measurement, 62, 254-263.
Bean, J. P. (1983). The application of a model of turnover in work organizations to the
student attrition process. The Review of Higher Education, 2, 129-148.
Bean, J. P., & Bradley, R. K. (1986). Untangling of satisfaction-performance relationship
for college students. The Journal of Higher Education, 57, 393-412.
Beltyukova, S. A., & Fox, C. (2002). Student satisfaction as a measure of student
development: Towards a universal metric. Journal of College Student
Development, 43, 161-172.
Benjamin, M., & Hollings, A. E. (1995). Toward a theory of student satisfaction: An
exploratory study of the “quality of student life”. Journal of College Student
Development, 36, 574-586.
Benjamin, M., & Hollings, A. (1997). Student satisfaction: Test of an ecological model.
Journal of College Student Development, 38, 213-228.
Bentler, P. M. (2006). EQS structural equations model program (Version 6.1) [Computer
software]. Encino, CA: Multivariate Software.
Berdie, R. F. (1944). The prediction of college achievement and satisfaction. Journal of
Applied Psychology, 28, 239-245.
Berdie, R. F., Pilapil, B., & Im, J. I. (1970). Entrance correlates of university satisfaction.
American Educational Research Journal, 7, 251-266.
32
Betz, E. L., Klingensmith, J. E., & Menne, J. W. (1970). The measurement and analysis
of college student satisfaction. Measurement & Evaluation in Guidance, 3, 110-
118.
Betz, E. L., Menne, J. W., Starr, A. M., & Klingensmith, J. E. (1971). A dimensional
analysis of college student satisfaction. Measurement and Evaluation in
Guidance, 4(2), 99-106.
Betz, E. L., Starr, A. M., & Menne, J. W. (1972). College student satisfaction in ten
public and private colleges and universities. Journal of College Student
Personnel, 13(5), 456-461.
Bowen, C. (2005). A comparison of college satisfaction between homosexual and
heterosexual students. Doctoral dissertation, University of Couth Carolina, 2005.
Brown, J. T. (2004). Student service satisfaction: Differences between traditional and
distance learning students. Doctoral dissertation, Azusa Pacific University, 2004.
Brown, T. A. (2006). Confirmatory factor analysis for applied research. New York:
Guilford Press.
Byrne, B. M. (2006). Structural equation modeling with EQS: Basic concepts,
applications, and programming (2nd ed.). Mahwah, NJ: Lawrence Erlbaum
Associates.
Carter, H. K. (1997). Race and gender differences in self-reported coping strategies and
college satisfaction. Doctoral dissertation, Central Michigan University, 1997.
Campbell, D. T., & Fiske, D. W. (1959). Convergent and discriminant validation by the
multitrait-multimethod matrix. Psychological Bulletin, 56, 81-105.
Campbell, N. R. (1938). Symposium: Measurement and its importance for philosophy.
Aristotelian Society Supplement, 121-142.
Carver, R. (1978). The case against statistical significance testing. Harvard Educational
Review, 48(3), 378-399.
Caws, P. (1959). Definition and measurement in physics. In C. W. Churchman, & P.
Ratoosh (Eds.), Measurement: Definitions and theories (pp. 3-17). New York:
John Wiley & Sons.
33
Chadwick, K., & Ward, J. (1987). Determinants of consumer satisfaction with education:
Implications for college & university administrators. College & University, 236-
246.
Chamberlain, T. C. (1965). The method of multiple working hypotheses. Science, 148,
754-759.
Chavez, G. T. (1985). Chicano, Black, and Anglo students’ satisfaction with their
university experiences. Doctoral dissertation, Arizona State University, 1985.
Chen, F. F. (2007). Sensitivity of goodness of fit indexes to lack of measurement
invariance. Structural Equation Modeling, 14(3), 464-504.
Cheung, G. W., & Rensvold, R. B. (2002). Evaluating goodness-of-fit indexes for testing
measurement invariance. Structural Equation Modeling, 9(2), 233-255.
Cohen, J. (1988). Statistical power for the behavioral sciences. (2nd ed.) Hillsdale, NJ:
Lawrence Erlbaum Associates.
Cohen, J. (1990). Things I have learned (so far). American Psychologist, 1304-1312.
Conant, J. S., Brown, J. J., & Mokwa, M. P. (1985). Students are important customers:
Assessing satisfaction in a higher education context. Journal of Marketing
Education, Summer, 13-20.
Cook, R. (1973). Upperclassmen’s satisfaction with college. In G. F. Nyre (Ed.), Studies
of college students and alumni: Selected dissertations in higher education (pp. 17-
39). Los Angeles: University of California at Los Angeles.
Cook, W. W. (1951). The functions of measurement in the facilitation of learning. In E.
F. Lindquist (Ed.), Educational measurement (pp. 3-46). Washington, DC:
American Council on Education.
Crahen, S. A. (2001). African-American and Caucasian students’ satisfaction with the
college experience at predominantly White universities. Doctoral dissertation,
University of Minnesota, 2001.
Crocker, L. A., & Algina, J. (1986). Introduction to classical and modern test theory. Ft.
Worth, TX: Harcourt Brace Jovanovich College Publishers.
34
Cronbach, L. J. (1971). Test Validation. In R. L. Thorndike (Ed.), Educational
Measurement (2nd ed., pp. 443-507). Washington, DC: American Council on
Education.
Cronbach, L. J. (1984). Essentials of psychological testing. (4th ed.) New York: Harper
and Row.
Cronbach, L. J., & Meehl, P. E. (1955). Construct validity in psychological tests.
Psychological Bulletin, 52, 281-302.
Cross, C. L. (1985). A comparison of collegiate retention rates among Black students in
predominantly Black and White institutions. Doctoral dissertation, The American
University, 1985.
Cuyjet, M. J., & Rode, D. L. (1987). Follow-up of orientation contacts: Effects on
freshman environmental satisfaction. Journal of College Student Personnel,
28(1), 21-28.
Delucchi, M. (2003). Student satisfaction with higher education during the 1970s: A
decade of social change: Vol. 86. Lewiston, NY: The Edwin Mellen Press.
DeVore, J. R. (1983). The ecology of student satisfaction: An empirical study. Doctoral
dissertation, St. Louis University, 1983.
DeVore, J. R., & Handal, P. J. (1981). The College Student Satisfaction Questionnaire: A
test-retest reliability study. Journal of College Student Personnel, 22(4), 299-301.
DeWitz, S. J., & Walsh, W. B. (2002). Self-efficacy and college student satisfaction.
Journal of Career Assessment, 10, 315-326.
Donohue, T. L., & Wong, E. H. (1997). Achievement motivation and college satisfaction
in traditional and nontraditional students. Education, 118, 237-243.
Douglas, H. R. (1928). Rating the effectiveness of college instructors. School and
Sociology, 28, 192-197.
Ducanis, A. J. (1961). Intercollege comparisons of student satisfaction with college life.
Doctoral dissertation, University of Pittsburgh, 1961.
Elliott, K. M. (2002). Key determinants of student satisfaction. Journal of College
Student Retention, 4, 271-279.
35
Elliott, K. M., & Healy, M. A. (2001). Key factors influencing student satisfaction related
to recruitment and retention. Journal of Marketing for Higher Education, 10, 1-
11.
Elliott, K. M., & Shin, D. (2002). Student satisfaction: An alternative approach to
assessing this important concept. Journal of Higher Education, 24, 197-209.
Elrod, M. R. (2002). A comparison of institutional factors and student satisfaction:
Retention implications in a Hispanic-serving community college. Doctoral
dissertation, New Mexico State University, 2002.
Fan, X., Thompson, B., & Wang, L. (1999). Effects of sample size, estimation methods,
and model specification on structural equation modeling fit indexes. Structural
Equation Modeling, 6(1), 56-83.
Farrell, D., & Rusbult, C. E. (1981). Exchange variables as predictors of job satisfaction,
job commitment, and turnover: The impact of rewards, costs, alternatives, and
investments. Organizational Behavior and Human Performance, 27, 78-95.
Franke, F. N. (1976). An exploratory study of possible correlates of college student
satisfaction-dissatisfaction. Doctoral dissertation, University of Pittsburgh, 1976.
Gall, M. D., Borg, W. R., & Gall, J. P. (1996). Educational research: An introduction
(6th ed.). White Plains, NY: Longman.
Gamelin, F. C. (1953). Intercollege comparisons of student satisfaction with college life.
Doctoral dissertation, University of Minnesota, 1953.
Garza, R. T., & Widlak, F. W. (1976). Antecedents of Chicano and Anglo student
perceptions of the university environment. College Student Personnel, 17(4), 295-
299.
Gielow, C. R., & Lee, V. E. (1988, April). The effect of institutional characteristics on
student satisfaction with college. Paper presented at the American Educational
Research Association annual meeting, New Orleans, LA.
Gilner, J. A., & Morgan, G. A. (2000). Research methods in applied settings: An
integrated approach. Mahwah, NJ: Lawrence Erlbaum.
Gluskinos, U. M., & Wainer, H. (1971). A multidimensional analysis of school
satisfaction. American Educational Research Journal, 8(3), 423-434.
36
Gorsuch, R.L. (1983). Factor analysis (2nd ed.). Hillsdale, NJ: Lawrence Erlbaum
Associates.
Green, J. A. (1970). Introduction to measurement and evaluation. New York: Dodd,
Mead & Co.
Gronlund, N. E., & Linn, R. L. (1990). Measurement and evaluation in teaching. (6th
ed.) New York: Macmillan.
Guion, R. M. (1980). On trinitarian doctrines of validity. Professional Psychology, 11,
385-398.
Guolla, M. (1999). Assessing the teaching quality with students satisfaction relationship:
Applied customer satisfaction research in the classroom. Journal of Marketing
Theory & Practice, 7, 87-97.
Gutherie, E. R. (1927). Measuring student opinion of teachers. School and Sociology, 25,
175-177.
Hallenbeck, T. R. (1978). College student satisfaction: An indication of institutional
vitality. NASPA Journal, 16(2), 19-25.
Hammer, W. C., & Organ, W. D. (1978). Organizational behavior. Texas: Business
Publications.
Hatcher, L., Kryter, K., Prus, J. S., & Fitzgerald, V. (1992). Predicting college student
satisfaction, commitment, and attrition from investment model constructs. Journal
of Applied Social Psychology, 22, 1273-1296.
Hearn, J. C. (1985). Determinants of college students’ overall evaluations of their
academic programs. Research in Higher Education, 23, 413-437.
Hecklinger, F. J. (1972). The undecided student is he less satisfied with college? Journal
of College Student Personnel, 13(3), 247-251.
Heilman, J. D., & Armentrout, W. D. (1936). The rating of college teachers on ten traits
by their students. Journal of Educational Psychology, 27, 197-216.
Helmich, D. I. (1999). Individual student characteristics and satisfaction within the
college environment. Doctoral dissertation, Johnson and Wales University, 1999.
37
Henson, R. K. (1999). Multivariate normality: What is it and how is it assesses?
Advances in Social Science Methodology, 5, 193-211.
Henson, R. K. (2001). Understanding internal consistency reliability estimates: A
conceptual primer on coefficient alpha. Measurement & Evaluation in Counseling
& Development, 34, 177-189.
Henson, R. K. (2006). Effect-size measures and meta-analytic thinking in counseling
psychology research. The Counseling Psychologist, 34, 601-629.
Henson, R. K., & Roberts, J. K. (2006). Use of exploratory factor analysis in published
research: Common errors and some comment on improved practice, Educational
& Psychological Measurement, 66(3), 393-416.
Henson, R. K., & Thompson, B. (2002). Characterizing measurement error in scores
across studies: Some recommendations for conducting ‘reliability generalization’
studies. Measurement & Evaluation in Counseling & Development, 35, 113.
Higher Education Research Institute. (2008). CIRP Freshman Survey: Reliability and
Validity. Retrieved August 1, 2008, from
http://www.gseis.ucla.edu/heri/PDFs/CIRP_Reliability_Validity.PDF
Hom, W. (2002). Applying customer satisfaction theory to community college planning
of student services. iJournal: Insight into student services. Retrieved October 26,
2007, from
http://www.ijournal.us/issue_02/ij_issue02_WillardHom_01print.htm
Hopkins, K. D. (1998). Educational and psychological measurement and evaluation. (8th
ed.) Boston: Allyn and Bacon.
Huck, S. W. (2000). Reading statistics and research (3rd ed.). New York: Addison
Wesley Longman.
Huddleson, T., Jr. (2000). Enrollment management. New Directions for Higher
Education, 111, 65-73.
Hurley, T. J. (1999). Student satisfaction in a religious postsecondary setting. Doctoral
dissertation, University of South Dakota, 1999.
Jenks, J., Kahane, J., Bobinski, V., & Piermarini, T. (1979). The relationship between
perceived college student satisfaction and goal-directedness. Measurement &
Evaluation in Guidance, 11(4), 225-229.
38
Johnson, B., & Christensen, L. (2004). Educational research: Quantitative, qualitative,
and mixed approaches. (2nd ed.) Boston: Allyn and Bacon.
Jones, L. V. (1971). The nature of measurement. In R. L. Thorndike (Ed.), Educational
measurement (pp. 335-355). Washington, DC: American Council on Education.
Jones, S. D. (1985). Freshmen students’ involvement, satisfaction, and retention in higher
education. Doctoral dissertation, University of Oregon, 1985.
Juillerat, S. L. (1995). Investigating a two-dimensional approach to the assessment of
student satisfaction: Validation of the Student Satisfaction Inventory. Doctoral
dissertation, Temple University, 1995.
Kapp, G. (1981). College extracurricular activities: Who participates and what are the
benefits? Ann Arbor; University Microfilms International.
Kirk, R. E. (1996). Practical significance: A concept whose time has come. Educational
& Psychological Measurement, 56, 746-759.
Kirk, R. E. (2001). Promoting good statistical practices: Some suggestions. Educational
& Psychological Measurement, 61, 213-218.
Kline, R. B. (2004). Beyond significance testing: Reforming data analysis methods in
behavioral research. Washington, DC: American Psychological Association.
Knox, W. E, Lindsay, P., & Kolb, M. N. (1992). Higher education, college
characteristics, and student experiences: Long-term effects on educational
satisfactions and perceptions. The Journal of Higher Education, 63(3), 303-328.
Koon, J. (1978). An academic review using comparative student evaluation of selected
humanities departments at Berkley. Report prepared by the Office of Academic
Affairs.
Kotler, P., & Clarke, R. N. (1987). Marketing for health care organizations. Englewood
Cliffs, NJ: Prentice-Hall.
Lindeman, R. H., & Merenda, P. F. (1979). Educational measurement (2nd ed.).
Glenview, IL: Scott, Foresman, & Co.
Litten, L. H. (1980). Marketing higher education: Benefits and risks for the American
Academic system. The Journal of Higher Education, 51, 40-59.
39
Liu, E., & Liu, R. (1999). An application of Tinto’s model at a commuter campus.
Education, 119(3), 537-541.
Lord, F. M., & Novick, M. R. (1968). Statistical theories of mental test scores. Reading,
MA: Addison-Wesley Pub. Co.
McElheny, W. T. (1950). An investigation of correlates of male college students’
satisfaction with dormitory living. Doctoral dissertation, University of Iowa,
1950.
McFarlin, D. B., & Rice, R. W. (1992). The role of facet importance as a moderator in
job satisfaction processes. Journal of Organizational Behavior, 13, 41-54.
McKaig, R. N. (1982). A study of the relationship between intensity of participation in
student activities and satisfaction with the university. Doctoral dissertation,
Indiana University, 1982.
Martin, R. D. (1968). Freshman satisfaction with college. Journal of College Student
Personnel, 8, 382-383.
Messick, S. (1975). The standard problem: Meaning and values in measurement and
evaluation. American Psychologist, 30, 955-966.
Messick, S. (1980). Test validity and the ethics of assessment. American Psychologist,
35, 1012-1027.
Messick, S. (1998). Test validity: A matter of consequence. Social Indicators Research,
45, 35-44.
Michalos, A. C. (1991). Global report on student well-being. Volume 1: Life satisfaction
and happiness. New York: Springer-Verlag.
Michalos, A. C. (1993). Global report on student well-being. Volume 4: Religion,
education, recreation, and health. New York: Springer-Verlag.
Morstain, B. R. (1977). An analysis of students’ satisfaction with their academic
program. Journal of Higher Education, 48, 1-16.
Nelson, N., Rosenthal, R., & Rosnow, R. L. (1986). Interpretation of significance levels
and effect sizes by psychological researchers. American Psychologist, 41, 1299-
1301.
40
Netusil, A. J., & Hallenbeck, D. A. (1975). Assessing perceptions of college student
satisfaction. NASPA Journal, 12(4), 263-268.
Noel-Levitz, Inc., (2006). Implementation guidelines. Iowa City, IA: Author.
Noel-Levitz, Inc., (2004). About the Student Satisfaction Inventory™. Iowa City, IA:
Author.
Obiekwe, J. C. (2000). Identifying the latent structures if the Noel-Levitz Student
Satisfaction Inventory (SSI): The community, junior, and technical college
version. Paper presented at the annual meeting of the Association for the Study of
Higher Education, Sacramento, CA.
Okun, M. A. (1991). Moderators of the semester GPA-college satisfaction relation: A
judgment approach. Contemporary Educational Psychology, 16, 73-86.
Okun, M. A., Kardash, C. A., Stock, W. A., Sandler, I. N., & Baumann, D. J. (1986).
Measuring perceptions of the quality of academic life among college students.
Journal of College Student Personnel, 27, 447-451.
Okun, M. A., & Weir, R. M. (1990). Toward a judgment model of college satisfaction.
Educational Psychology Review, 2(1), 59-76.
Oliver, R. L. (1997). Satisfaction: A behavioral perspective on the consumer. New York:
The McGraw-Hill Companies, Inc.
Oliver, R. L., & DeSarbo, W. S. (1988). Response determinants in satisfaction
judgments. Journal of Consumer Research, 14, 495-507.
Onwuegbuzie, A. J., & Daniel, L. G. (2000, November). Reliability generalization: The
importance of considering sample specificity, confidence intervals, and subgroup
differences. Paper presented at the annual meeting of the Mid-South Educational
Research Association, Bowling Green, KY.
Pace, C. R. (1979). Measuring the outcomes of college. San Francisco: Jossey-Bass.
Pascarella, E. T., & Terenzini, P. T. (1991). How college affects students. San Francisco:
Jossey-Bass.
Pedhazur, E. J., & Schmelkin, L. P. (1991). Measurement, design, and analysis: An
integrated approach. Hillsdale, NJ: Lawrence Erlbaum.
41
Pennington, D. C., Zvonkovic, A. M., & Wilson, S. L. (1989). Changes in college
satisfaction across an academic term. Journal of College Student Development,
30, 528-535.
Pervin, L. A., & Rubin, D. B. (1967). Student dissatisfaction with college and the college
dropout: A transactional approach. Journal of Social Psychology, 72, 285-295.
Pike, G. R. (1989). The performance-satisfaction relationship revisited: Specification and
testing a theoretical model. Paper presented at the annual meeting of the
American Educational Research Association, San Francisco.
Pike, G. R. (1991). The effects of background, coursework, and involvement on students’
grades and satisfaction. Research in Higher Education, 32, 15-30.
Pike, G. R. (1993). The relationship between perceived learning and satisfaction with
college: An alternative view. Research in Higher Education, 34, 23.
Polcyn, L. J. (1986). A two-instrument approach to student satisfaction measurement.
College and University, 62, 18-24.
Rand, L. P. (1968). Effect on college choice satisfaction of matching students and
colleges. Personnel & Guidance Journal, 47, 34-39.
Reed, J. G., Lahey, M. A., & Downey, R. G. (1984). Development of the College
Descriptive Index: A measure of student satisfaction. Measurement and
Evaluation in Counseling and Development, 17, 67-82.
Reinhardt, B. (1996). Factors affecting coefficient alpha: A mini Monte Carlo study. In
B. Thompson (Ed.), Advances in Social Science Methodology (Vol. 4, pp. 3-20).
Greenwich, CT: JAI Press.
Remmers, H. H. (1939). Appraisal of college teaching through ratings and student
opinion. In F. D. Brooks (Ed.), The study of college instruction. Yearbook 27,
National Society of College Teacher Education (pp. 227-240). Chicago:
University of Chicago Press.
Reynolds, C. R., Livingston, R. B., & Willson, V. (2006). Measurement and assessment
in education. New York: Pearson Education.
Robinson, A. P. (1986). Personal support, self-esteem and college satisfaction among
older students: An interaction study. Doctoral dissertation, Syracuse University,
1986.
42
Robinson, L. F. (1969). Relationship of student persistence in college to satisfaction with
“environmental” factor. The Journal of Educational Research, 63(1), 6-10.
Rosser, J. (1972). Higher education and the Black American: An overview. Journal of
Afro-American issues, 1, 189-203.
Roszkowski, M. J., & Ricci, R. (2005). Measurement of importance in a student
satisfaction questionnaire: Comparison of the direct and indirect methods for
establishing attribute importance. Journal of College Student Retention, 6, 251-
271.
Roy, H. L. (1950). The construction of a college satisfaction index. Doctoral dissertation,
University of Minnesota, 1950.
Russell, B. (1938). Principles of mathematics. (2nd ed.) New York: Norton.
Sanders, L., & Burton, J. D. (1996). From retention to satisfaction: New outcomes for
assessing the freshman experience. Research in Higher Education, 37(5), 555-
567.
Sauer, M. L. (2003). Relationship of selected student characteristics to student ratings of
importance and levels of satisfaction. Doctoral dissertation, University of Nevada,
Las Vegas, 2003.
Schmidt, D. K., & Sedlacek, W. E. (1972). Variables related to university student
satisfaction. Journal of College Student Personnel, 13, 233-238.
Schreiner, L. A., & Juillerat, S. L. (1994). Student Satisfaction Inventory. Iowa City, IA:
Noel-Levitz Centers, Inc.
Schumacker, R. E., & Lomax, R. G. (1996). A beginner’s guide to structural equation
modeling. Mahwah, NJ: Lawrence Erlbaum Associates.
Sevier, R. A. (1996). Those important things: What every college president needs to
know about marketing and student recruitment. College and University, 71, 9.
Shirk, W. G. (2002). A study of the relationship between student satisfaction and
ethnicity, gender, and grade point average at a private, non-denominational,
midwestern university. Doctoral dissertation, Oral Roberts University, 2002.
43
Spady, W. (1970). Dropouts from higher education: An interdisciplinary review and
synthesis. Interchange, 1, 64-85.
Spady, W. (1971). Dropouts from higher education: Toward an empirical model.
Interchange, 2, 38-62.
Stanley, J. C. (1971). Reliability. In R. L. Thorndike (Ed.), Educational Measurement
(2nd ed., pp. 356-442). Washington, DC: American Council on Education.
Starr, A. M., Betz, E. L., & Menne, J. W. (1971). College Student Satisfaction
Questionnaire (CSSQ). Ames, IA: Central Iowa Associates, Inc.
Starr, A. M., Betz, E. L., & Menne, J. W. (1972). Differences in college student
satisfaction: Academic dropouts, nonacademic dropouts and nondropouts. Journal
of Counseling Psychology, 19, 318-322.
Stevens, S. S. (1951). Mathematics, measurement, and psychophysics. In S. S. Stevens
(Ed.), Handbook of experimental psychology (pp. 1-49). New York: John Wiley
& Sons.
Stevens, S. S. (1962). Measurement, psychophysics, and utility. In C. W. Churchman &
P. Ratoosh (Eds.), Measurement: Definitions and theories (pp. 18-63). New York:
John Wiley & Sons.
Strong, S. R. (1978). Critique of the college student satisfaction questionnaire. In O.K.
Buros (Ed.), The Eighth Mental Measures Yearbook (pp. 524-525). Highland
Park, NJ: Gryphon Press.
Sturtz, S. A. (1971). Age differences in college student satisfaction. Journal of College
Student Personnel, 12, 220-222.
Tabachnick, B. G., & Fidell, L. S. (2001). Using multivariate statistics (4th
Ed.). Boston:
Allyn and Bacon.
Thompson, B. (1993). The use of statistical significance tests in research: Bootstrap and
other alternatives. Journal of Experimental Education, 61, 361-377.
Thompson, B. (1996). AERA editorial policies regarding statistical significance testing:
Three suggested reforms. Educational Researcher, 25(2), 26-30.
Thompson, B. (2001). Significance, effect sizes, stepwise methods, and other issues:
strong arguments move the field. The Journal of Experimental Education, 70, 80-
93.
44
Thompson, B. (2002). ‘Statistical,’ ‘Practical,’ and ‘Clinical,’: How many kinds of
significance do counselors need to consider? Journal of Counseling &
Development, 80, 64-71.
Thompson, B. (2003). Score reliability. Thousand Oaks, CA: Sage Publications.
Thompson, B. (2004). Exploratory and Confirmatory Factor Analysis: Understanding
concepts and applications. Washington, DC: American Psychological
Association.
Thompson, B., & Daniel, L. (1996). Factor analytic evidence for the construct validity of
scores: A historical overview and some guidelines. Educational & Psychological
Measurement, 56, 197-208.
Thompson, B., & Vacha-Haase, T. (2000). Psychometrics is datametrics: The test is not
reliable. Educational & Psychological Measurement, 60, 174-195.
Tinto, V. (1975). Dropout from higher education: A theoretical synthesis of recent
research, Review of Educational Research, 45, 89-125.
Tinto, V. (1987). Leaving college: Rethinking the causes and cures of student attrition.
Chicago: University of Chicago Press.
Torgerson, W. S. (1958). Theory and methods of scaling. New York: John Wiley & Sons.
Traub, R. E. (1994). Reliability for the social sciences. Thousand Oaks, CA: Sage.
Umbach, P. D., & Porter, S. R. (2002). How do academic departments impact student
satisfaction? Research in Higher Education, 41(2), 209-234.
Upcraft, M. L., & Schuh, J. H. (1996). Assessment in student affairs: A guide for
practitioners. The Jossey-Bass Higher & Adult Education Series. New York: John
Wiley & Sons.
Vacha-Haase, T., Henson, R. K., & Caruso, J. C. (2002). Reliability generalization:
Moving toward improved understanding and use of score reliability. Educational
& Psychological Measurement, 62, 562-569.
Vacha-Haase, T., Kogan, L. R., & Thompson, B. (2000). Sample compositions and
variabilities in published studies versus those in test manuals: Validity of score
reliability inductions. Educational & Psychological Measurement, 60, 509-522.
45
Vacha-Haase, T., Nilsson, J. E., Reetz, D. R., Lance, T. S., & Thompson, B. (2000).
Reporting practices and APA editorial policies regarding statistical significance
and effect size. Theory & Psychology, 10(3), 413-425.
Vacha-Haase, T., & Thompson, B. (2004). How to estimate and interpret various effect
sizes. Journal of Counseling Psychology, 51(4), 473-481.
Weir, R. M., & Okun, M. A. (1989). Social support, positive college events, and college
satisfaction: Evidence for boosting effects. Journal of Applied Social Psychology,
19(9), 759-771.
Weiss, D. J., Dawis, R. V., England, G. W., & Lofquist, L. H. (1967). Manual for the
Minnesota Satisfaction Questionnaire. Minnesota Studies in Vocational
Rehabilitation, Vol. 22. Minneapolis, MN: University of Minnesota Industrial
Relations Center.
Wicker, A. H. (2004). The relationship of demographic, aspirational, situational,
employment, and commuting factors to commuter student’s perceptions of
mattering at a large public university. Doctoral dissertation, University of
Maryland, College Park, 2004.
Wilkinson, L., & The APA Task Force on Statistical Inference (1999). Statistical
methods in psychology journals: Guidelines and explanations. American
Psychologist, 54, 594-604.
Willsey, A. D. (1971). College student satisfaction and academic performance. Doctoral
dissertation, State University of New York, 1971.
Witt, P. H., & Handal, P. J. (1984). Person-environment fit: Is satisfaction predicted by
congruency, environment, or personality? Journal of College Student Personnel,
25(6), 503-508.
Zeller, R. A. (1988). Validity. In J. P. Keeves (Ed.), Educational research, methodology,
and measurement: An international handbook (pp. 322-330). New York:
Pergamon Press.
Zwick, W. R., & Velicer, W. F. (1986). Comparison of five rules for determining the
number of components to retain. Psychological Bulletin, 99(3), 432-442.