Embed Size (px)
Citation preview
Submarine slides north of Puerto Rico and their tsunami potential
Uri ten Brink (U.S. Geological Survey, Woods Hole, MA 02543; [email protected])
Eric L. Geist (U.S. Geological Survey, Menlo Park, CA 94025; [email protected])
Patrick Lynett (Texas A&M University, College Station, TX 77843;
Brian Andrews (U.S. Geological Survey, Woods Hole, MA 02543; [email protected])
New multibeam bathymetry of the entire Puerto Rico trench reveals numerous retrograde slopefailures at various scales at the edge of the carbonate platform north of Puerto Rico and the VirginIslands. The slumped material comprises carbonate blocks, which fail, at least in initial stages, as acoherent rock mass. This, combined with the fact that the edge of the carbonate platform is steeperthan most continental slopes, indicates a higher potential for run-up than along many other U.S.coasts. The style of slope failure appears to be rock falls, slide blocks and debris avalanches.Secondary failure of the failed carbonate products and of the underlying forearc sediments and rocksmay lead to debris flows and turbidity flows. Fissures, discovered in the ocean floor near the edge ofthe platform, indicate that the process is expected to continue in the future. One of the slope failures,the Arecibo amphitheater, previously thought to represent a single giant slide with a volume of 900-1500 cu. km, appears to comprise smaller failures. The expected maximum tsunami run-up on thenorthern coast of Puerto Rico from one of these slope failures is <20 m, much lower than previouslyestimated. A recurrence rate of 100s ky was calculated for the largest observed failures along theedge of the carbonate platform north of Puerto Rico using simple assumptions. Smaller landslideswould presumably occur at a higher recurrence rate. Elsewhere around the island, a 20-km widefailure scarp was discovered in the Upper Mona rift and could be associated with the 1918 tsunamiand earthquake that hit northwestern Puerto Rico. Large slope failures were also discovered for thefirst time on the northern side of the Puerto Rico trench. Because Puerto Rico trench slides occur atlarge water depths (~6000 m), have large horizontal and vertical dimensions, and the directivity fromtsunamis emanating from these slides is toward Puerto Rico, they may be of particular concern andmay necessitate further study.
1. IntroductionEvidence for tsunamis generated by submarine slope failures has beenaccumulating during the past decade (e.g., [Ward, 2001]). The highly destructive1998 Papua New Guinea tsunami, for example, was likely amplified in the nearfield by a landslide-generated tsunami, in addition to the seismogenic tsunami[Satake and Tanioka, 2003]. Tsunamis generated by submarine slope failureshave only a local effect, because relatively high-frequency waves are beingexcited by the slides and these high frequencies attenuate quickly with distancefrom the source [Ward, 2001]. However, they can strike with little warning,because of the proximity of the tsunami source to the affected coast and becauseground shaking that triggers offshore landslides may be small or lacking. Hence,it may not be possible to provide civil defense authorities with adequate tsunamiwarning from submarine slides. A better strategy in this case would be tomitigate the hazard by identifying vulnerable coastal regions and modifyingtheir usage, and by educating the public. Numerical simulations of landslides
TEN BRINK ET AL. TSUNAMI POTENTIAL NORTH OF PUERTO RICO
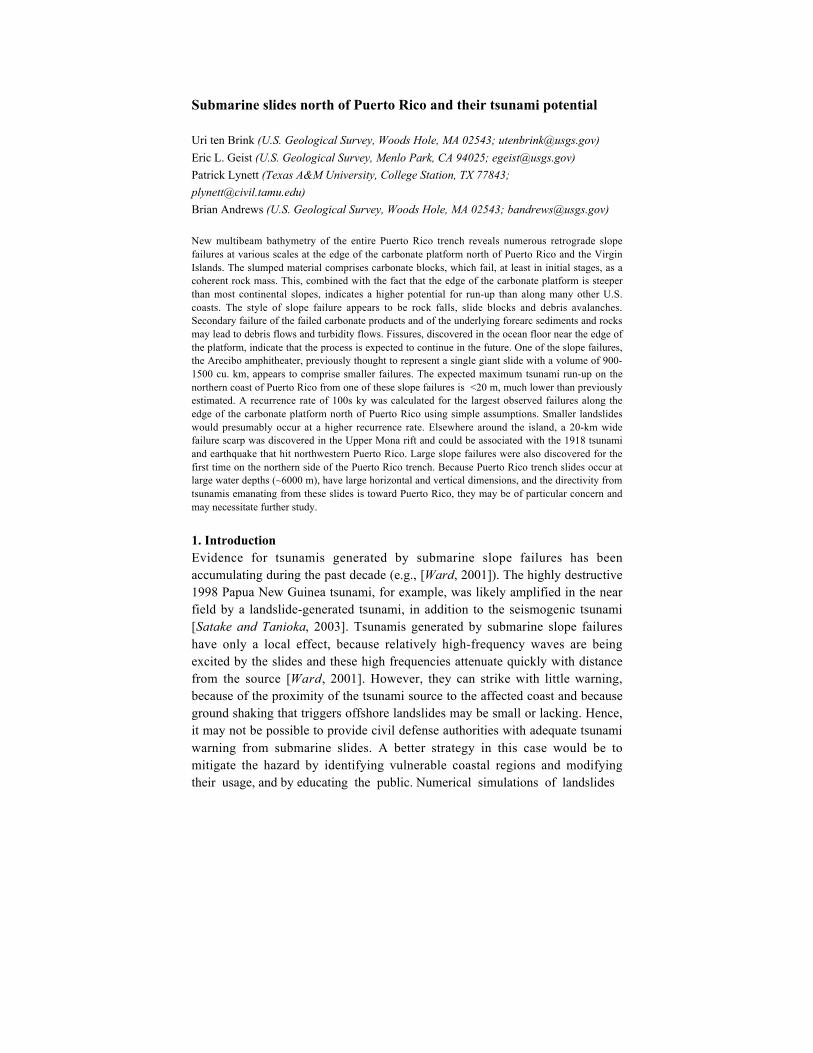
Figure 1. (a) Bathymetric map of the Puerto Rico trench and its vicinity from our new multibeamsonar survey [ten Brink et al., 2004a], single-beam bathymetry compilation around Puerto Rico (A.Mercado, written communication, 2003), LIDAR data near shore (J. Brock, written communication,2003), and topography of Puerto Rico. Contour interval is 500 m. Barbed white lines – thrust faults;white line – strike-slip fault; heavy black line – northern edge of tilted carbonate platform andsouthern edge on land; dashed lines – head scarp of slope failures; dotted line – possible debris toe;blue lines – fissures in the sea floor. (b) Map of the slope angle (in degrees) of the bathymetry of the
TEN BRINK ET AL. TSUNAMI POTENTIAL NORTH OF PUERTO RICO
Puerto Rico trench. The slope was calculated as the maximum horizontal slope on a grid interval of300 m. A finer grid interval will produce higher slope angles. Thin contours – bathymetry fromETOPO2 at 500 m intervals.
tsunamis and their run-up on shore can help identify these vulnerable coastalregions. Realistic simulations, however must rely on a good knowledge ofpotential sources, a good knowledge of the bathymetry, and an understanding ofthe style of slope failure.
The region north of Puerto Rico may pose significant tsunami hazards to PuertoRico, the Virgin Islands, and the Dominican Republic. A tsunami killed 40people in NW Puerto Rico following a magnitude 7.3 earthquake in 1918[Mercado and McCann, 1998]. Large landslide escarpments have been mappedon the seafloor north of Puerto Rico [Grindlay, 1998; Schwab et al., 1991],although their ages are unknown. One of the escarpments, the AreciboAmphitheater, was simulated as a single failure with run-up on the north shoreof Puerto Rico possibly reaching 55 m [Mercado et al., 2002]. In this paper weuse multibeam bathymetry [ten Brink et al., 2004a] and re-processed seismicreflection profiles to describe and quantify slope failures and to identify sites ofpotential future failures. The data indicate that slope failure is likely anincremental process even within the amphitheater. A numerical simulation forlandslide-generated tsunami is presented for the north coast of Puerto Rico fromone such failure in the Arecibo Amphitheater and indicates a run-up height only1/3 of the previous estimate.
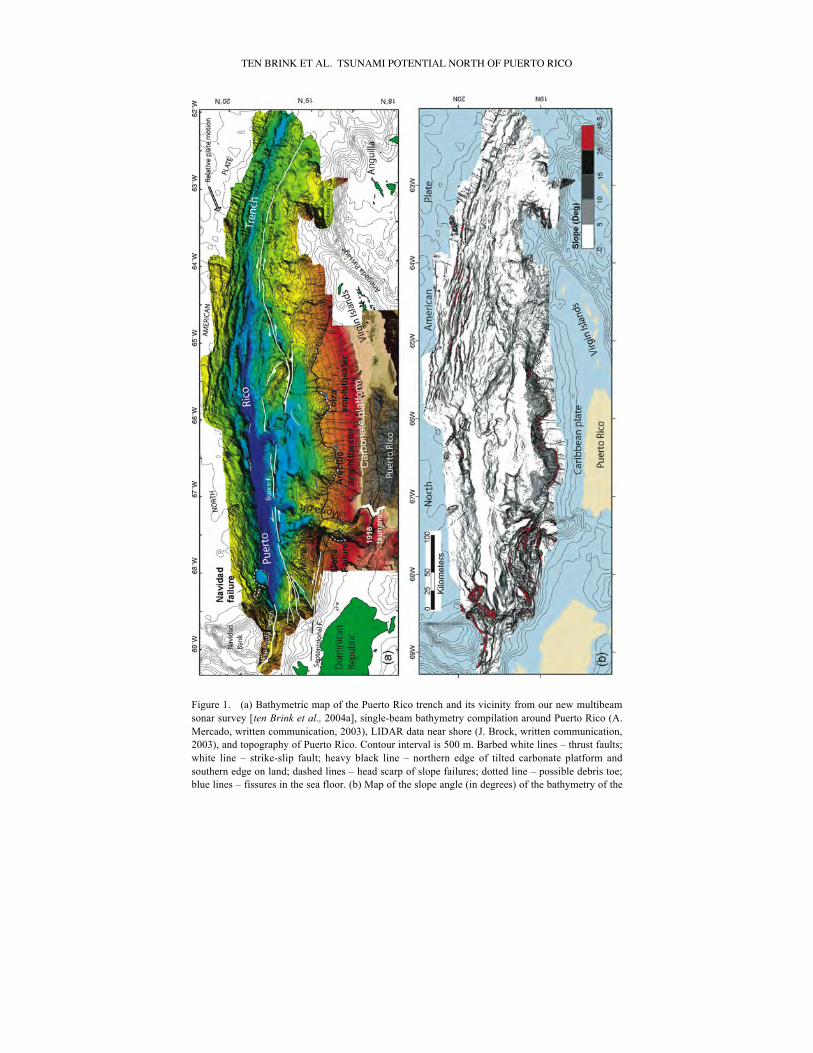
2. BackgroundThe Puerto Rico trench is a subduction zone, where the North American(NOAM) plate is subducting under the Caribbean plate (Figure 1). Subduction ishighly oblique (10°-20°) to the trench axis with a large component of left-lateralstrike slip motion [ten Brink et al., 2004b]. In addition to its extremely deepseafloor, the Puerto Rico trench is also characterized by the most negative free-air gravity anomaly on Earth, -380 mGal, which indicates a dynamic departurefrom isostatic equilibrium. It is unclear, however, whether the trench continuesto subside or whether subsidence has recently ended, and the trench has not yetfilled with sediment. Subsidence of the trench probably caused the north shoreof Puerto Rico and its offshore region, which are covered by carbonate rocks totilt northward. The carbonate platform was horizontally deposited overCretaceous to Paleocene arc rocks starting in the Late Oligocene. Then, at 3.3Ma or later, the carbonate platform was tilted by 4° toward the trench such thatits northern edge is at a depth of 4000 m and its reconstructed elevation on landin Puerto Rico is at +1300 m ([ten Brink, in press]; Figures 1, 2a). The tilting
TEN BRINK ET AL. TSUNAMI POTENTIAL NORTH OF PUERTO RICO
TEN BRINK ET AL. TSUNAMI POTENTIAL NORTH OF PUERTO RICO
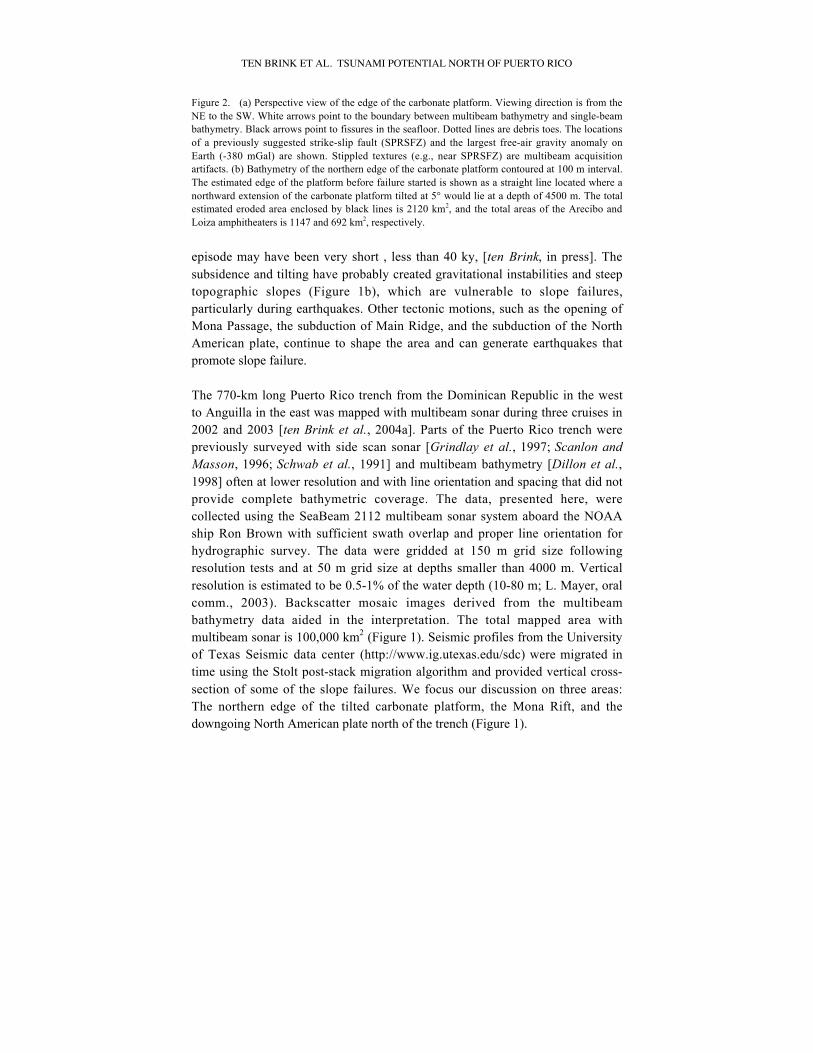
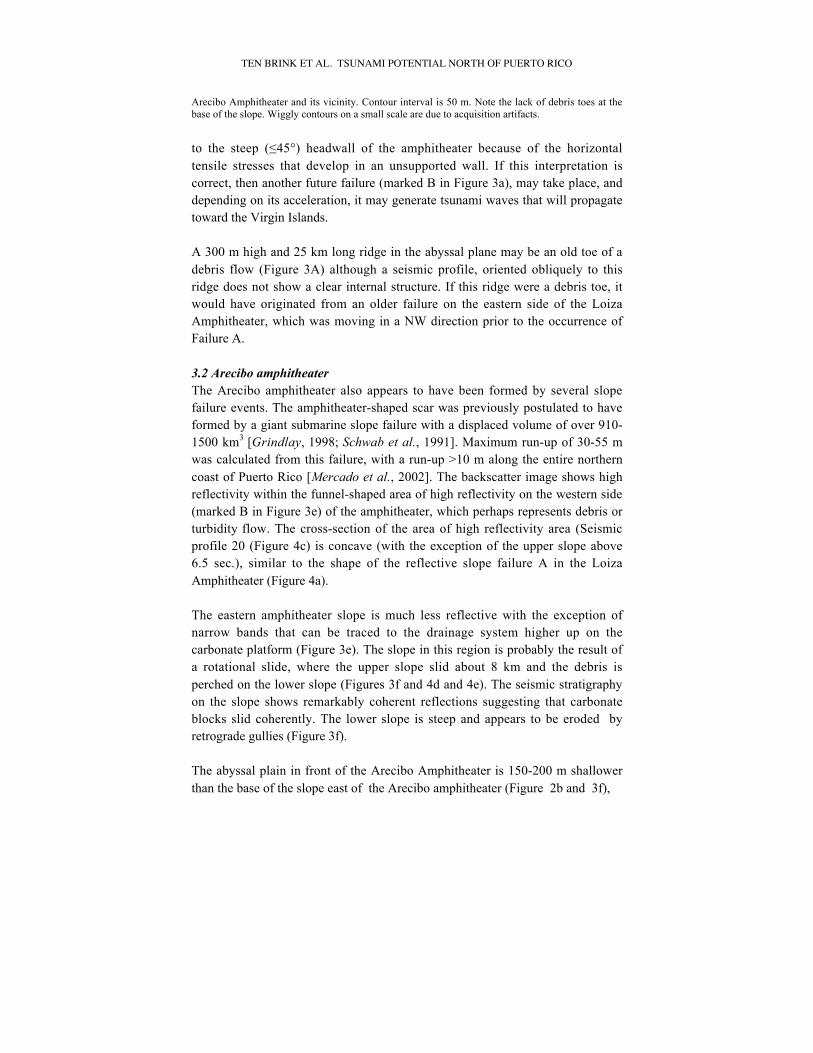
Figure 2. (a) Perspective view of the edge of the carbonate platform. Viewing direction is from theNE to the SW. White arrows point to the boundary between multibeam bathymetry and single-beambathymetry. Black arrows point to fissures in the seafloor. Dotted lines are debris toes. The locationsof a previously suggested strike-slip fault (SPRSFZ) and the largest free-air gravity anomaly onEarth (-380 mGal) are shown. Stippled textures (e.g., near SPRSFZ) are multibeam acquisitionartifacts. (b) Bathymetry of the northern edge of the carbonate platform contoured at 100 m interval.The estimated edge of the platform before failure started is shown as a straight line located where anorthward extension of the carbonate platform tilted at 5° would lie at a depth of 4500 m. The totalestimated eroded area enclosed by black lines is 2120 km2, and the total areas of the Arecibo andLoiza amphitheaters is 1147 and 692 km2, respectively.
episode may have been very short , less than 40 ky, [ten Brink, in press]. Thesubsidence and tilting have probably created gravitational instabilities and steeptopographic slopes (Figure 1b), which are vulnerable to slope failures,particularly during earthquakes. Other tectonic motions, such as the opening ofMona Passage, the subduction of Main Ridge, and the subduction of the NorthAmerican plate, continue to shape the area and can generate earthquakes thatpromote slope failure.
The 770-km long Puerto Rico trench from the Dominican Republic in the westto Anguilla in the east was mapped with multibeam sonar during three cruises in2002 and 2003 [ten Brink et al., 2004a]. Parts of the Puerto Rico trench werepreviously surveyed with side scan sonar [Grindlay et al., 1997; Scanlon andMasson, 1996; Schwab et al., 1991] and multibeam bathymetry [Dillon et al.,1998] often at lower resolution and with line orientation and spacing that did notprovide complete bathymetric coverage. The data, presented here, werecollected using the SeaBeam 2112 multibeam sonar system aboard the NOAAship Ron Brown with sufficient swath overlap and proper line orientation forhydrographic survey. The data were gridded at 150 m grid size followingresolution tests and at 50 m grid size at depths smaller than 4000 m. Verticalresolution is estimated to be 0.5-1% of the water depth (10-80 m; L. Mayer, oralcomm., 2003). Backscatter mosaic images derived from the multibeambathymetry data aided in the interpretation. The total mapped area withmultibeam sonar is 100,000 km2 (Figure 1). Seismic profiles from the Universityof Texas Seismic data center (http://www.ig.utexas.edu/sdc) were migrated intime using the Stolt post-stack migration algorithm and provided vertical cross-section of some of the slope failures. We focus our discussion on three areas:The northern edge of the tilted carbonate platform, the Mona Rift, and thedowngoing North American plate north of the trench (Figure 1).
TEN BRINK ET AL. TSUNAMI POTENTIAL NORTH OF PUERTO RICO
3. The northern edge of the carbonate platformThe northern edge of the carbonate platform north of Puerto Rico ischaracterized by two large amphitheater-shaped headwall scarps, the Areciboamphitheater 37 km north of Arecibo, Puerto Rico [Mercado et al., 2002;Scanlon and Masson, 1996; Schwab et al., 1991] which is 50-km across, and theLoiza amphitheater, 48 km north of Loiza, Puerto Rico [Scanlon and Masson,1996], which is 35-km across (Figures 2 and 3). Smaller failures are observedadjacent to these amphitheaters, and the westernmost edge of the platformappears to have collapsed but was translated very little. Several smaller scarpsand slope failures were also identified all along the edge of the carbonateplatform (Figures 2 and 3).
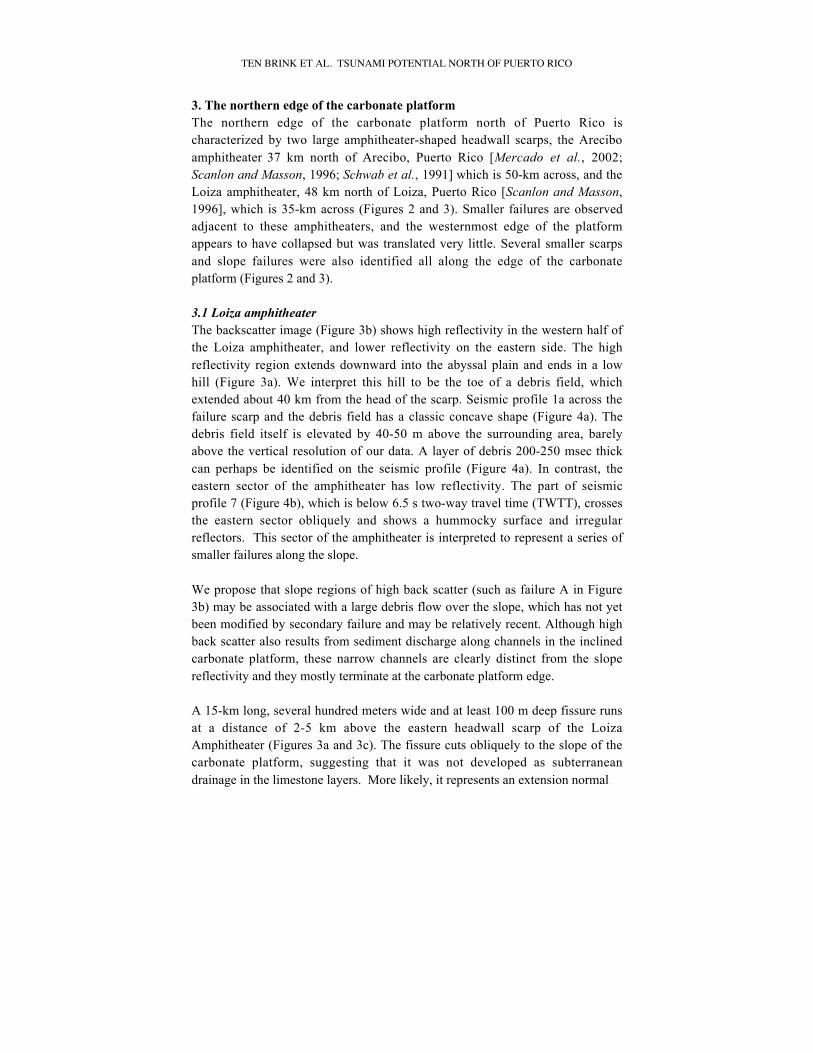
3.1 Loiza amphitheaterThe backscatter image (Figure 3b) shows high reflectivity in the western half ofthe Loiza amphitheater, and lower reflectivity on the eastern side. The highreflectivity region extends downward into the abyssal plain and ends in a lowhill (Figure 3a). We interpret this hill to be the toe of a debris field, whichextended about 40 km from the head of the scarp. Seismic profile 1a across thefailure scarp and the debris field has a classic concave shape (Figure 4a). Thedebris field itself is elevated by 40-50 m above the surrounding area, barelyabove the vertical resolution of our data. A layer of debris 200-250 msec thickcan perhaps be identified on the seismic profile (Figure 4a). In contrast, theeastern sector of the amphitheater has low reflectivity. The part of seismicprofile 7 (Figure 4b), which is below 6.5 s two-way travel time (TWTT), crossesthe eastern sector obliquely and shows a hummocky surface and irregularreflectors. This sector of the amphitheater is interpreted to represent a series ofsmaller failures along the slope.
We propose that slope regions of high back scatter (such as failure A in Figure3b) may be associated with a large debris flow over the slope, which has not yetbeen modified by secondary failure and may be relatively recent. Although highback scatter also results from sediment discharge along channels in the inclinedcarbonate platform, these narrow channels are clearly distinct from the slopereflectivity and they mostly terminate at the carbonate platform edge.
A 15-km long, several hundred meters wide and at least 100 m deep fissure runsat a distance of 2-5 km above the eastern headwall scarp of the LoizaAmphitheater (Figures 3a and 3c). The fissure cuts obliquely to the slope of thecarbonate platform, suggesting that it was not developed as subterraneandrainage in the limestone layers. More likely, it represents an extension normal
TEN BRINK ET AL. TSUNAMI POTENTIAL NORTH OF PUERTO RICO
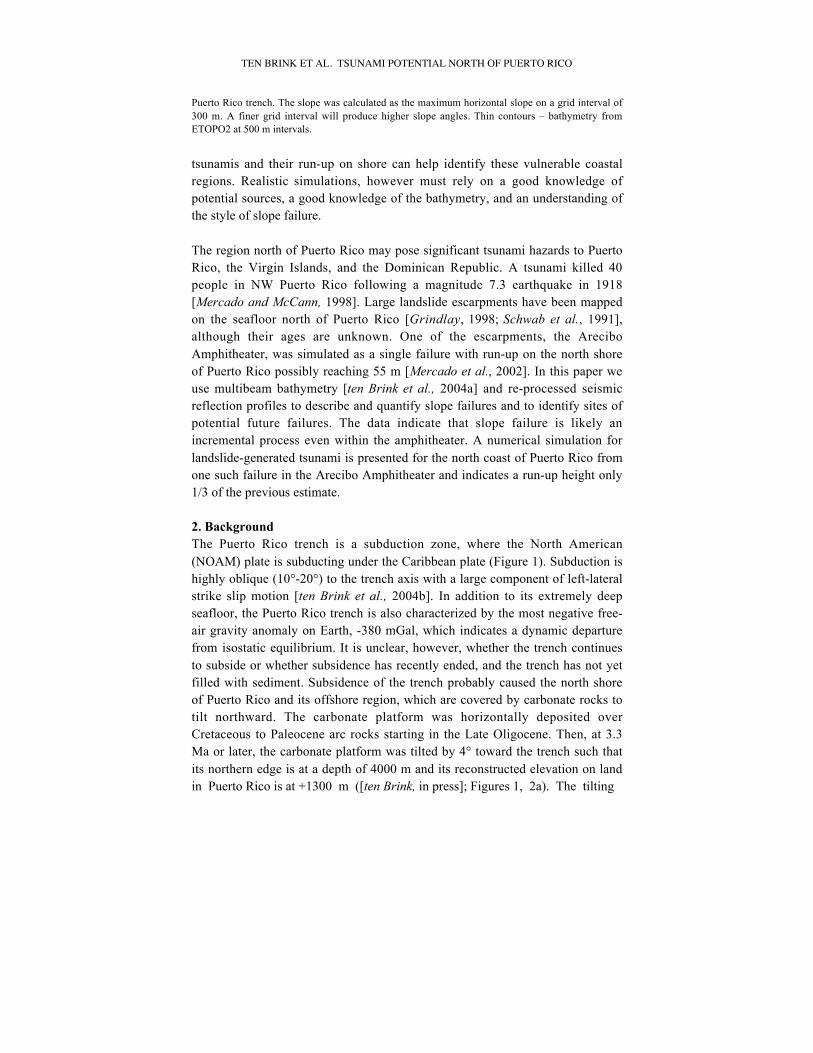
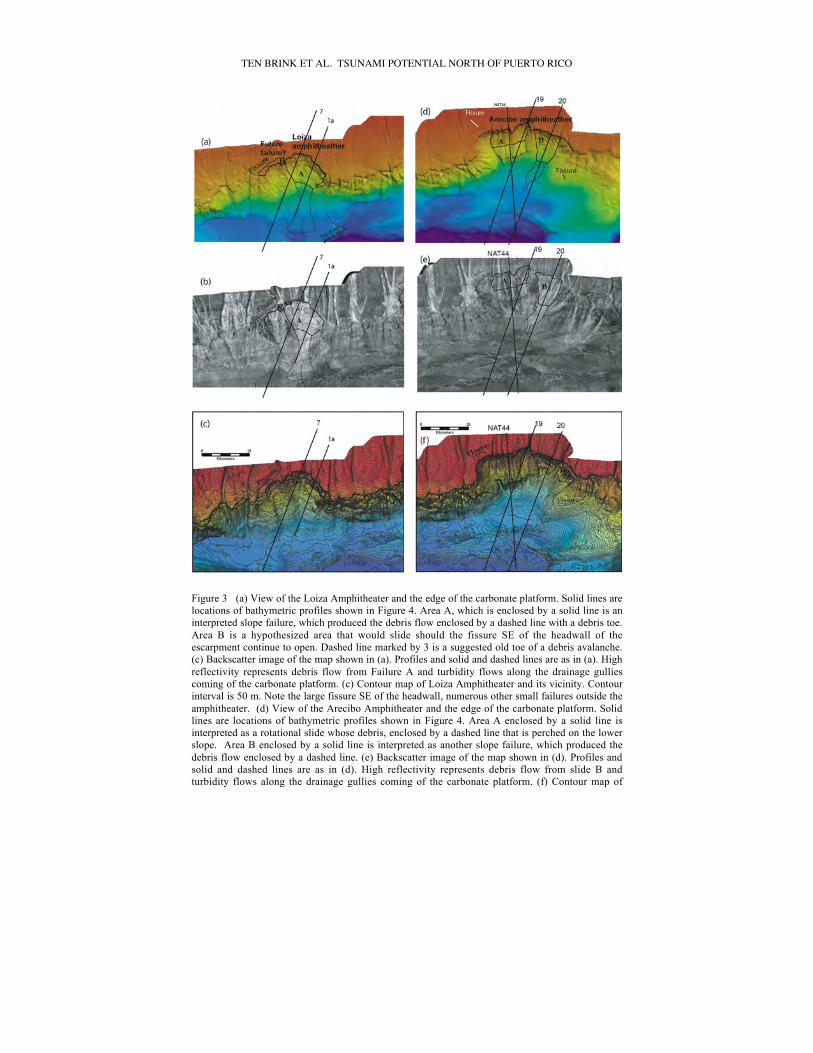
Figure 3 (a) View of the Loiza Amphitheater and the edge of the carbonate platform. Solid lines arelocations of bathymetric profiles shown in Figure 4. Area A, which is enclosed by a solid line is aninterpreted slope failure, which produced the debris flow enclosed by a dashed line with a debris toe.Area B is a hypothesized area that would slide should the fissure SE of the headwall of theescarpment continue to open. Dashed line marked by 3 is a suggested old toe of a debris avalanche.(c) Backscatter image of the map shown in (a). Profiles and solid and dashed lines are as in (a). Highreflectivity represents debris flow from Failure A and turbidity flows along the drainage gulliescoming of the carbonate platform. (c) Contour map of Loiza Amphitheater and its vicinity. Contourinterval is 50 m. Note the large fissure SE of the headwall, numerous other small failures outside theamphitheater. (d) View of the Arecibo Amphitheater and the edge of the carbonate platform. Solidlines are locations of bathymetric profiles shown in Figure 4. Area A enclosed by a solid line isinterpreted as a rotational slide whose debris, enclosed by a dashed line that is perched on the lowerslope. Area B enclosed by a solid line is interpreted as another slope failure, which produced thedebris flow enclosed by a dashed line. (e) Backscatter image of the map shown in (d). Profiles andsolid and dashed lines are as in (d). High reflectivity represents debris flow from slide B andturbidity flows along the drainage gullies coming of the carbonate platform. (f) Contour map of
TEN BRINK ET AL. TSUNAMI POTENTIAL NORTH OF PUERTO RICO
Arecibo Amphitheater and its vicinity. Contour interval is 50 m. Note the lack of debris toes at thebase of the slope. Wiggly contours on a small scale are due to acquisition artifacts.
to the steep (≤45°) headwall of the amphitheater because of the horizontaltensile stresses that develop in an unsupported wall. If this interpretation iscorrect, then another future failure (marked B in Figure 3a), may take place, anddepending on its acceleration, it may generate tsunami waves that will propagatetoward the Virgin Islands.
A 300 m high and 25 km long ridge in the abyssal plane may be an old toe of adebris flow (Figure 3A) although a seismic profile, oriented obliquely to thisridge does not show a clear internal structure. If this ridge were a debris toe, itwould have originated from an older failure on the eastern side of the LoizaAmphitheater, which was moving in a NW direction prior to the occurrence ofFailure A.
3.2 Arecibo amphitheaterThe Arecibo amphitheater also appears to have been formed by several slopefailure events. The amphitheater-shaped scar was previously postulated to haveformed by a giant submarine slope failure with a displaced volume of over 910-1500 km3 [Grindlay, 1998; Schwab et al., 1991]. Maximum run-up of 30-55 mwas calculated from this failure, with a run-up >10 m along the entire northerncoast of Puerto Rico [Mercado et al., 2002]. The backscatter image shows highreflectivity within the funnel-shaped area of high reflectivity on the western side(marked B in Figure 3e) of the amphitheater, which perhaps represents debris orturbidity flow. The cross-section of the area of high reflectivity area (Seismicprofile 20 (Figure 4c) is concave (with the exception of the upper slope above6.5 sec.), similar to the shape of the reflective slope failure A in the LoizaAmphitheater (Figure 4a).
The eastern amphitheater slope is much less reflective with the exception ofnarrow bands that can be traced to the drainage system higher up on thecarbonate platform (Figure 3e). The slope in this region is probably the result ofa rotational slide, where the upper slope slid about 8 km and the debris isperched on the lower slope (Figures 3f and 4d and 4e). The seismic stratigraphyon the slope shows remarkably coherent reflections suggesting that carbonateblocks slid coherently. The lower slope is steep and appears to be eroded byretrograde gullies (Figure 3f).
The abyssal plain in front of the Arecibo Amphitheater is 150-200 m shallowerthan the base of the slope east of the Arecibo amphitheater (Figure 2b and 3f),
TEN BRINK ET AL. TSUNAMI POTENTIAL NORTH OF PUERTO RICO
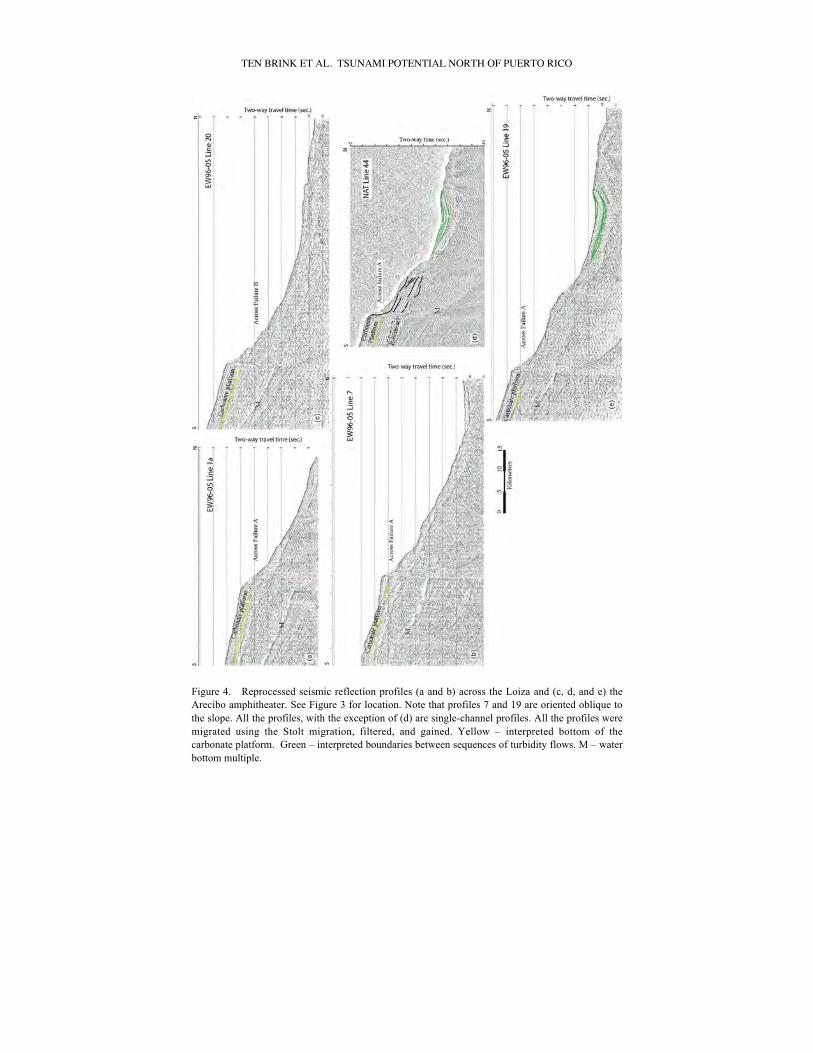
Figure 4. Reprocessed seismic reflection profiles (a and b) across the Loiza and (c, d, and e) theArecibo amphitheater. See Figure 3 for location. Note that profiles 7 and 19 are oriented oblique tothe slope. All the profiles, with the exception of (d) are single-channel profiles. All the profiles weremigrated using the Stolt migration, filtered, and gained. Yellow – interpreted bottom of thecarbonate platform. Green – interpreted boundaries between sequences of turbidity flows. M – waterbottom multiple.
TEN BRINK ET AL. TSUNAMI POTENTIAL NORTH OF PUERTO RICO
perhaps because more sediment was deposited in front of the amphitheater thanto the east. The abyssal plain is underlain by up to 2 s TWTT or over one kmthick packet of sediments that dip and thicken to the north (Figure 3c, 3d, and3e). Grindlay [1998] interpreted this sedimentary packet to be turbidities fromthe major slumping event that created the Arecibo amphitheater, but the internalstratigraphy indicates several distinct sedimentary packet, which were probablydeposited during different failure events, or during massive sediment run-offsfrom the Puerto Rico after heavy storms.
A 7x3 km area along the eastern headwall of the Arecibo amphitheater appearsto be surrounded by fissures (Figure 3d) and to be up to 200 m lower than thesurrounding carbonate platform (Figure 3f). This may be an indication of thebeginning of a new slope failure of part of the Arecibo amphitheater.
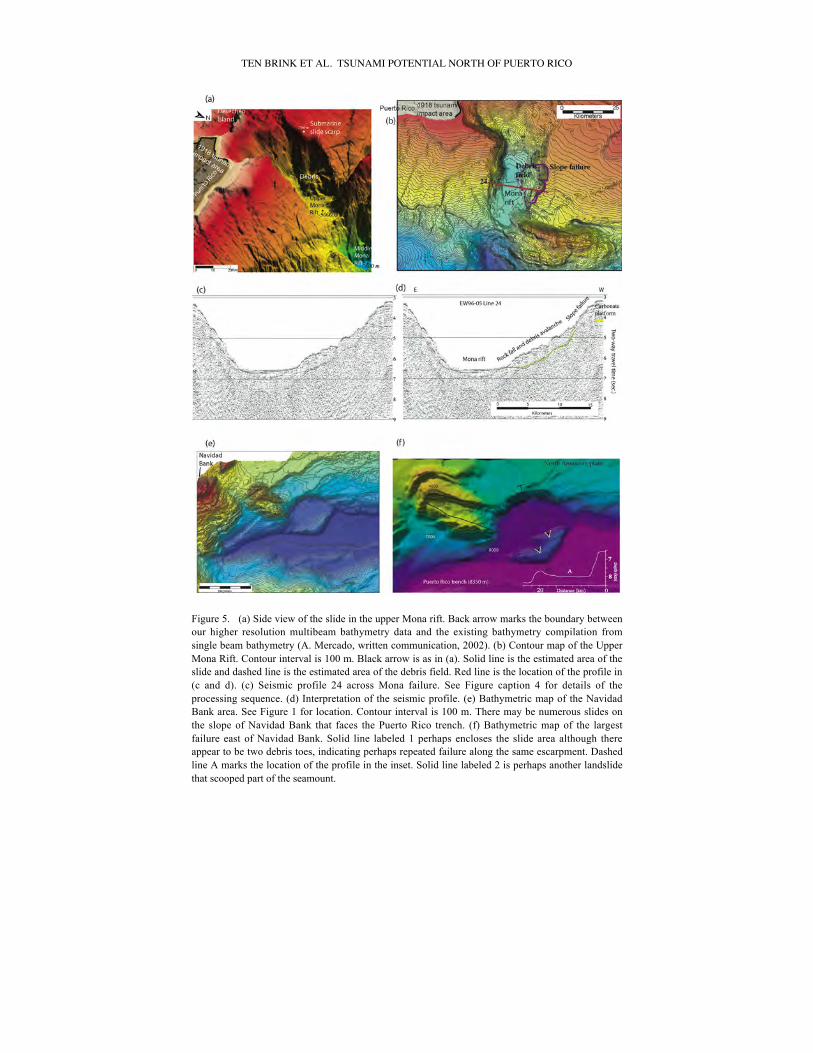
3.3 Mona riftA 20-km-long section of the western wall of the upper Mona Rift is scoured by aslope failure (Figures 5a and 5b). The headwall varies in height from 1250-3350m below sea level. The failure scarp appears in map view to be <5 km wide andthe debris field ahead of it is 2.5-10 km wide. In side view (Figure 5a), thefailure appears almost as a rock fall. A cross-section of the failure (Figure 5cand d) shows an 11-km-long by 0.5 thick blocky section of debris field. Thedebris field is interpreted as a combination of rock fall and debris avalanche.Using seismic velocity of 2 km/s for the debris field and 2.75 km/s for thecarbonate platform at the headwall [van Gestel et al., 1998], the area of thedebris field is the equivalent of a 4.1 km wide section of failed platform. Thefailure appears to be recent because the debris field comprises of discrete blocksand because does not cover the most recent sediments filling the rift.
The upper Mona rift (Figure 1a, 5a and b) cuts across the carbonate platformnorth of Puerto Rico. The rift walls are very steep (>25°) and are likely normalfault planes along which east-west extension between the Puerto Rico and theHispaniola blocks [Mann et al., 2002] takes place. The tsunami of 1918 whichkilled 40 people along the termination of the rift at the northwestern shore ofPuerto Rico, probably initiated at the upper Mona rift [Mercado and McCann,1998]. The tsunami followed almost immediately a magnitude 7.3 earthquakewhich caused extensive damage and additional 76 fatalities in NW Puerto Rico(ibid.). Eyewitness account (quoted in [Mercado and McCann, 1998]) describedthe sea receding before it returned to flood the shore with waves up to 6 m high.This indicates that the downward motion along the normal fault, on which theearthquake had likely occurred, was directed away from shore. Mercado and
TEN BRINK ET AL. TSUNAMI POTENTIAL NORTH OF PUERTO RICO
Figure 5. (a) Side view of the slide in the upper Mona rift. Back arrow marks the boundary betweenour higher resolution multibeam bathymetry data and the existing bathymetry compilation fromsingle beam bathymetry (A. Mercado, written communication, 2002). (b) Contour map of the UpperMona Rift. Contour interval is 100 m. Black arrow is as in (a). Solid line is the estimated area of theslide and dashed line is the estimated area of the debris field. Red line is the location of the profile in(c and d). (c) Seismic profile 24 across Mona failure. See Figure caption 4 for details of theprocessing sequence. (d) Interpretation of the seismic profile. (e) Bathymetric map of the NavidadBank area. See Figure 1 for location. Contour interval is 100 m. There may be numerous slides onthe slope of Navidad Bank that faces the Puerto Rico trench. (f) Bathymetric map of the largestfailure east of Navidad Bank. Solid line labeled 1 perhaps encloses the slide area although thereappear to be two debris toes, indicating perhaps repeated failure along the same escarpment. Dashedline A marks the location of the profile in the inset. Solid line labeled 2 is perhaps another landslidethat scooped part of the seamount.
TEN BRINK ET AL. TSUNAMI POTENTIAL NORTH OF PUERTO RICO
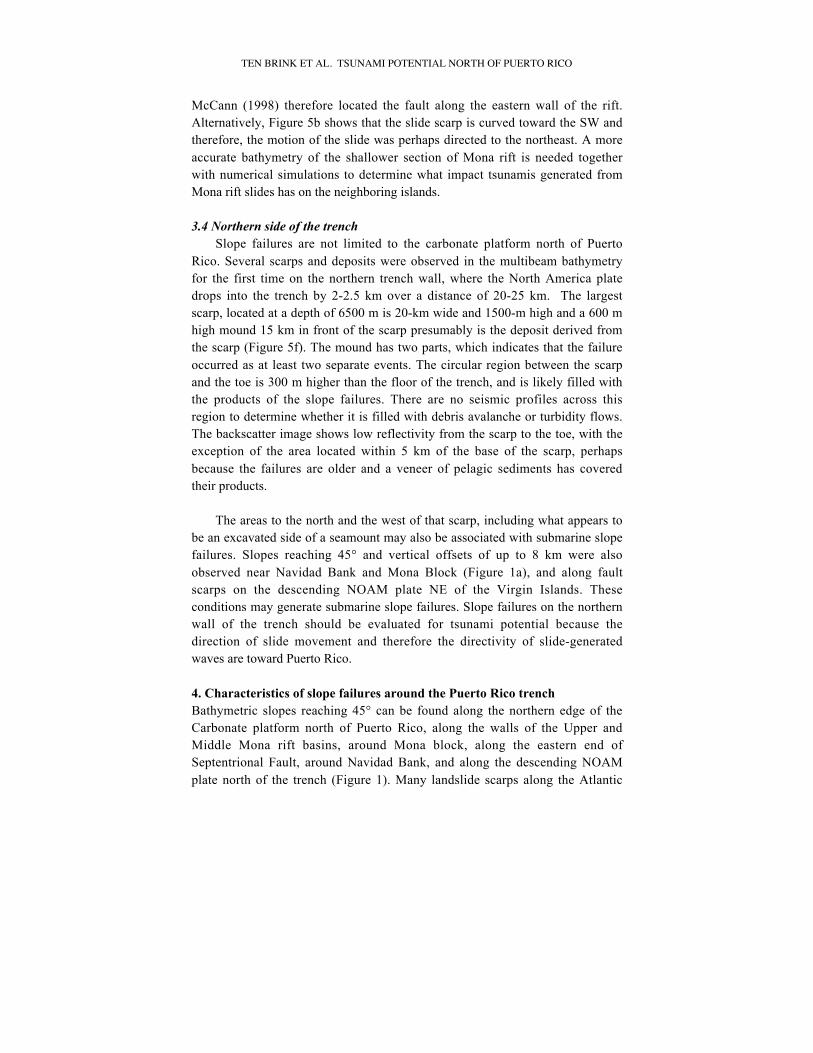
McCann (1998) therefore located the fault along the eastern wall of the rift.Alternatively, Figure 5b shows that the slide scarp is curved toward the SW andtherefore, the motion of the slide was perhaps directed to the northeast. A moreaccurate bathymetry of the shallower section of Mona rift is needed togetherwith numerical simulations to determine what impact tsunamis generated fromMona rift slides has on the neighboring islands.
3.4 Northern side of the trenchSlope failures are not limited to the carbonate platform north of Puerto
Rico. Several scarps and deposits were observed in the multibeam bathymetryfor the first time on the northern trench wall, where the North America platedrops into the trench by 2-2.5 km over a distance of 20-25 km. The largestscarp, located at a depth of 6500 m is 20-km wide and 1500-m high and a 600 mhigh mound 15 km in front of the scarp presumably is the deposit derived fromthe scarp (Figure 5f). The mound has two parts, which indicates that the failureoccurred as at least two separate events. The circular region between the scarpand the toe is 300 m higher than the floor of the trench, and is likely filled withthe products of the slope failures. There are no seismic profiles across thisregion to determine whether it is filled with debris avalanche or turbidity flows.The backscatter image shows low reflectivity from the scarp to the toe, with theexception of the area located within 5 km of the base of the scarp, perhapsbecause the failures are older and a veneer of pelagic sediments has coveredtheir products.
The areas to the north and the west of that scarp, including what appears tobe an excavated side of a seamount may also be associated with submarine slopefailures. Slopes reaching 45° and vertical offsets of up to 8 km were alsoobserved near Navidad Bank and Mona Block (Figure 1a), and along faultscarps on the descending NOAM plate NE of the Virgin Islands. Theseconditions may generate submarine slope failures. Slope failures on the northernwall of the trench should be evaluated for tsunami potential because thedirection of slide movement and therefore the directivity of slide-generatedwaves are toward Puerto Rico.
4. Characteristics of slope failures around the Puerto Rico trenchBathymetric slopes reaching 45° can be found along the northern edge of theCarbonate platform north of Puerto Rico, along the walls of the Upper andMiddle Mona rift basins, around Mona block, along the eastern end ofSeptentrional Fault, around Navidad Bank, and along the descending NOAMplate north of the trench (Figure 1). Many landslide scarps along the Atlantic
TEN BRINK ET AL. TSUNAMI POTENTIAL NORTH OF PUERTO RICO
and Pacific margins of North America and in the Gulf of Mexico are, on theother hand, found on much smaller slope angles (as small as 0.5°, [Prior andColeman, 1984]). The slope failures, which they represent, are thought to beinduced by rapid sedimentation and tectonic activity, causing the slope tobecome steeper, and by elevated pore pressure, gas pressure, wave generated ortidal generated bottom pressure (e.g., [Driscoll et al., 2000; Locat et al., 2004;Prior and Coleman, 1984]).
The edge of the continental shelf along much of North America is covered withclastic sediments, which in high sedimentation areas may be unconsolidated.(The exceptions are the Blake Escarpment and the exposed lower continentalslope from Florida to New Jersey, which are made of limestone and chalk[Dillon et al., 1993; Twitchell et al., 1993], and may be analogous to the PuertoRico margin.) When the slope fails, these sediments may disintegrate into debrisflows and a turbidity current, such as may have happened in the 1929 GrandBank event [Piper et al., 1999]. By contrast, slope failure around Puerto Ricoinvolves either carbonate layers or oceanic crust. The north coast of Puerto Ricoand the area surrounding the Upper Mona Rift are covered by an average of1600 m thick layer of carbonate rocks (mostly limestone) [van Gestel et al.,1998], which will tend to fail as a coherent rather than internally deformablerock mass. Navidad Bank is covered by several km of carbonate rocks[Freeman-Lynde and Ryan, 1987]. In all these areas we expect slope failure tooccur as rock falls, block and debris slides, and to a lesser extent, debrisavalanches, and debris flows (cf., Varnes, 1978). These failure modes areindeed observed in the multibeam imagery and seismic profiles, for example,Arecibo Failure A (Figures 3d, 4e and 4f) and Mona rift (Figures 5a and 5d).
The carbonate platform comprises a 1-2 km thick layer of highly massive orlayered limestone, with some shales and shaly sandstone toward the bottom ofthe section (the San Sebastian Formation)[Monroe, 1980; van Gestel et al.,1999]. It is underlain by volcanoclastic, volcanic, and igneous rocks of the arcand forearc, which may be less coherent during failure. The carbonate layer mayact as a cap that protects the underlying less coherent layers from failing (Figure4). When part of this cap detaches from the rest of the platform and either rotates(Figure 4d) or disintegrates (Figure 4a), it exposes the underlying layers tofurther failures, probably in the form of smaller more incremental events (e.g.,Figure 4b). A carbonate block may detach from the platform by a combinationof vertical fissures, in which carbonate dissolution may take place, and reducedbasal friction on basal shale and clay layers. The fissures must be orientedsubparallel to the edge of the platform to allow the blocks to detach, and the
TEN BRINK ET AL. TSUNAMI POTENTIAL NORTH OF PUERTO RICO
carbonate dissolution is probably aided by fresh water runoff from the island.The process may therefore be limited by the rate at which these fissures canform and cut through the entire thickness of the carbonate layer.
Slope failures off Navidad Bank, Mona Block, and the walls of Mona rift arelikely made of thick coherent limestone blocks. Slope failures on the NOAMplate are likely to comprise about 500 m of pelagic sediment and chert layersunderlain by upper oceanic crust basalts, and these failures may developdifferently than those along the carbonate platform.
The failure of coherent blocks on a steep slope appears to cause a high tsunamirun-up. The 1992 Flores Island tsunami was accompanied by slope failures inthe surrounding carbonate reef and generated a maximum run-up of 26 m[Imamura et al., 1995], however, the submarine portion of the slide has not beenmapped. The collapse of the Ritter Island volcano in 1888, which was associatedwith sliding of coherent blocks, had produced a maximum run-up of at least 15m [Ward and Day, 2003]. The 1975 Kalapana earthquake in Hawaii was arguedby some authors to be the result of a coherent slope failure of the flank ofKilauea volcano (e.g., [Ma et al., 1999]) and it produced a maximum run-up of15 m. While it appears that failure of coherent blocks on a steep slope maygenerate a high tsunami run-up, there is no evidence to suggest that the oppositeis also true, namely, that the failure of less coherent blocks on lower slopes willgenerate small tsunamis. The 1929 Grand Banks tsunami with a maximum run-up of 13 m was triggered by a M=7.2 earthquake, and was probably amplifiedby large-scale slope failure and turbidity flow ([Piper et al., 1999; HughesClark, 1990), but the exact contribution of the slope failure to the Grand Banksrun-up is unknown. Smaller scale failures such as the Palos Verde [Locat et al.,2004] and Goleta [Edwards et al., 1993] are prehistoric and have no knownassociated tsunami.
For a slide of constant spatial dimensions, tsunami wave height is affected bythe time evolution and terminal speed of the slide. These dynamic properties, inturn, depend on a complex interplay of forces (e.g., basal friction and drag) andphysical properties (e.g., friction coefficient along joints and fractures) forcoherent slides of the type studied here. (For comparable analysis of deformableslides, see Locat et al. [2004]) When performing the coupled landslide motion –hydrodynamic simulations, the impact of these factors on the generated tsunamiis tested by systematically modifying the time duration of the slide.
TEN BRINK ET AL. TSUNAMI POTENTIAL NORTH OF PUERTO RICO
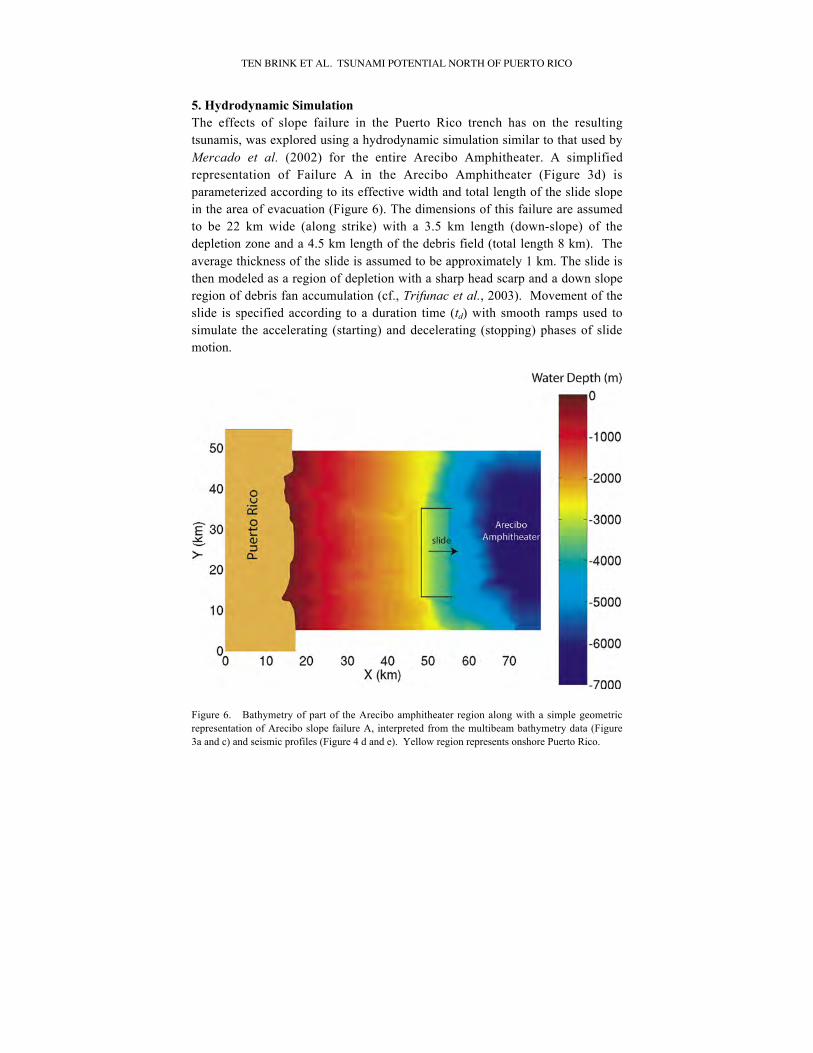
5. Hydrodynamic SimulationThe effects of slope failure in the Puerto Rico trench has on the resultingtsunamis, was explored using a hydrodynamic simulation similar to that used byMercado et al. (2002) for the entire Arecibo Amphitheater. A simplifiedrepresentation of Failure A in the Arecibo Amphitheater (Figure 3d) isparameterized according to its effective width and total length of the slide slopein the area of evacuation (Figure 6). The dimensions of this failure are assumedto be 22 km wide (along strike) with a 3.5 km length (down-slope) of thedepletion zone and a 4.5 km length of the debris field (total length 8 km). Theaverage thickness of the slide is assumed to be approximately 1 km. The slide isthen modeled as a region of depletion with a sharp head scarp and a down sloperegion of debris fan accumulation (cf., Trifunac et al., 2003). Movement of theslide is specified according to a duration time (td) with smooth ramps used tosimulate the accelerating (starting) and decelerating (stopping) phases of slidemotion.
Figure 6. Bathymetry of part of the Arecibo amphitheater region along with a simple geometricrepresentation of Arecibo slope failure A, interpreted from the multibeam bathymetry data (Figure3a and c) and seismic profiles (Figure 4 d and e). Yellow region represents onshore Puerto Rico.
TEN BRINK ET AL. TSUNAMI POTENTIAL NORTH OF PUERTO RICO
Slide movement is directly coupled with the hydrodynamic equations of motionthrough temporal and spatial derivatives of seafloor motion. As in Mercado etal., (2002) hydrodynamic modeling is based on weakly nonlinear “extended”equations described by [Lynett and Liu, 2002]. Because of the large verticalmotions associated with landslides, nonlinearity of the momentum equationsmay be more of a concern for landslide-generated tsunamis than for seismogenictsunamis. When the maximum seafloor displacement is much smaller than thewater depth above the slide, then the weakly nonlinear equations of [Lynett andLiu, 2002] can be used. Nonlinearity can also be important for accuratelydetermining tsunami run-up, especially for large incident waves. As the tsunamipropagates away from the source, frequency dispersion also becomes important.Landslide-generated waves are typically not the long waves characteristic ofseismogenic sources, and so energy will be dispersed in the direction of wavepropagation as different wave components (frequencies) travel at differentvelocities. Lynett and Liu (2002) use the arbitrary-level velocity computation[Nwogu, 1993] to “extend” the validity of frequency dispersion for the depth-integrated equations into the intermediate water regime, allowing for accuratesimulation of waves with lengths greater than two water depths. The WNL-EXT equations are implemented in the program COULWAVE using a finite-difference approximation using a high-order predictor-corrector scheme. Thespatial grid size used for the computations is 266 m with a time step of 0.51 s.In addition, bottom friction is accounted for with a constant friction factorf=0.01 (cf., Mercado et al., 2002), using the quadratic bottom frictionformulation. A moving boundary condition [Lynett et al., 2002] is implementedalong the coast to represent run-up and overland flow. For the open-oceanboundary conditions, a sponge-layer absorption scheme is used.
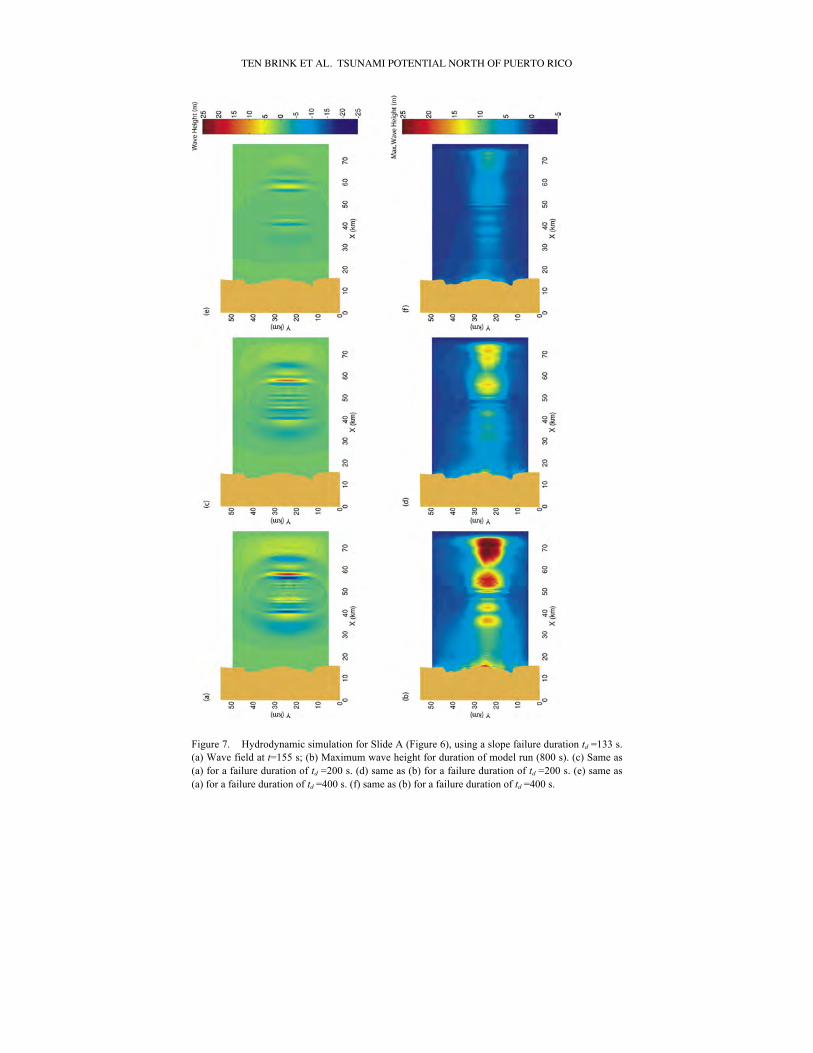
6. Hydrodynamic ResultsBecause Arecibo Slide A interpreted from the multibeam bathymetry is smallerin volume by nearly an order of magnitude than the large Arecibo amphitheaterslide modeled by [Mercado et al., 2002], the associated maximum run-up ofSlide A is also necessarily smaller (20 m instead of 55 m, Figure 7). Figure 7ashows the wave field at t=155 s and the maximum wave amplitude for Slide A,for td =133 s. This duration time is smaller than the shortest duration time usedby Mercado et al. (2002) for the much larger slide. It is reasonable to assumethat the duration time scales with the dimensions of the slope failure. Similarplots for td =200 s and td =400 s are shown in Figures 7c-f, respectively, at thesame scale as in Figures 7a and b. Increasing the slide duration dramaticallydecreases the maximum and near shore tsunami amplitude.
TEN BRINK ET AL. TSUNAMI POTENTIAL NORTH OF PUERTO RICO
Figure 7. Hydrodynamic simulation for Slide A (Figure 6), using a slope failure duration td =133 s.(a) Wave field at t=155 s; (b) Maximum wave height for duration of model run (800 s). (c) Same as(a) for a failure duration of td =200 s. (d) same as (b) for a failure duration of td =200 s. (e) same as(a) for a failure duration of td =400 s. (f) same as (b) for a failure duration of td =400 s.
TEN BRINK ET AL. TSUNAMI POTENTIAL NORTH OF PUERTO RICO
Because the slide is modeled as a region of progressive depletion and a downslope region of debris accumulation, it is difficult to assign an effective velocityfor the slide as with simple block slides commonly used in tsunami studies (cf.,[Ward, 2001]). Trifunac et al. (2003) describes composite slides of this typewhere different spreading velocities are assigned to the depletion andaccumulation zones. In simpler, but perhaps less accurate terms, one can assigndifferent length scales, such as run-out distance or horizontal displacement ofthe slide head, to calculate an effective velocity from td. Using 8 kmcharacteristic length scale for Slide A and td = 200 s (Figure 7c), the effectiveslide velocity is approximately 40 m/s. This compares to a tsunami phasevelocity (
€
c = gh for long waves) of 170 m/s at a water depth of h=3000 m(approximate average water depth of the slide). For tsunamis propagating in thedirection of slide motion (i.e., the outgoing tsunami), a slide velocity equal tothe tsunami phase velocity is considered the ideal tuning velocity (Ward, 2001).As the duration decreases, the effective slide velocity is closer to the phasevelocity and more efficient in terms of tsunami generation. For the tsunamipropagating opposite the direction of slide motion (i.e., the incoming tsunami),generation efficacy follows a more complex relationship to both the initialacceleration of the slide and its terminal velocity. For the generation model usedin this study, increasing the duration time does lead to a decrease in tsunami run-up on the near shore of Puerto Rico. We also examine the effect that a decreasein the friction factor f from f=0.01 to f=0.001 has on the maximum tsunami waveheights. A decrease in f results in a slight decrease in wave heights, similar tothe effects noted by Mercado et al. [2002].
7. Recurrence timeAn assessment of tsunami hazard assessment requires an estimate of recurrencetime for slope failures. The absence of a historical record and clearly identifiedtsunami deposits on the northern coast of Puerto Rico, and the lack of dates onthe observed slope failure, makes this task difficult. Nevertheless, the abundanceof observed slope failures and hypotheses about the underlying causes of slopefailures provide a starting point. A minimum recurrence time for slope failuresalong the edge of the carbonate platform was estimated assuming that the failureprocess was caused by the tilting of the platform at or after 3.3 m.y. ago, whenthe Puerto Rico trench collapsed and the island of Puerto Rico emerged (tenBrink, in press). We make the simplifying assumptions that slope failures weredistributed evenly in time since the tilt event, and that the edge of the platformwas initially straight (Figure 2b).
TEN BRINK ET AL. TSUNAMI POTENTIAL NORTH OF PUERTO RICO
Unlike earthquakes, the size-frequency distribution of submarine slope failuresis unknown. We therefore assume that the failures have a characteristic area andthickness similar to those observed. Three slope failure areas were calculated:Arecibo failure A with an area of 8x20 km, Loiza (future) failure B with an areaof 3x15 km, and the Mona rift failure with an area of 4x20 km. Two otherfailures, Loiza failure A and Arecibo failure B are 22 and 15 km long,respectively, but their width is unknown. Based on the 3 calculated failure areas,the characteristic failure area along the edges of the carbonate platform isestimated to be 45-160 km2. We take the number of large failures that occurredin the Arecibo and Loiza amphitheaters during the past 3.3 Ma to be theestimated lost area of carbonate platform divided by the characteristic failurearea (Figure 2b). For the Arecibo Amphitheater, the estimated number of largefailures is 7-25, and for the Loiza Amphitheater it is 4-13. The averagerecurrence time is therefore 470-132 ky for the Arecibo amphitheater and 825-253 ky for the Loiza amphitheater. The combined landslide tsunami recurrenceinterval at the north coast of Puerto Rico from the entire edge of the carbonateplatform is 253-70 ky. This is probably a minimum estimate considering thatthere are other smaller failures which are probably capable of producingtsunamis.
Placement and configuration of turbidity layers can also help constrain thenumber of past slope failures within each amphitheater. Several events can beidentified on the seismic profiles (Figure 4), but the resolution of these profilesis too poor to identify all the events. Additionally, some turbidity layers may bethe result of massive sediment run-offs from the island after heavy storms, asrepresented in the backscatter images by the highly reflective channels comingdown from the carbonate platform. A combination of near-bottom seismicreflection imaging and coring will help identify individual failure events.
8. ConclusionsAnalysis of detailed multibeam bathymetry and coincident backscatter imagesfrom the edge of the carbonate platform north of Puerto Rico and the VirginIslands combined with seismic cross-sections reveals numerous retrograde slopefailures of various scales. Fissures, discovered in the ocean floor near the edgeof the platform, indicate that the failure process is expected to continue in thefuture. The style of failure appears to be correlated with the presence of thecarbonate layers at the headwall of the slide. Where the carbonate layer is thick,the failure often takes place as a rock fall or a rotated slump block perched onthe lower slope, although debris avalanche or a debris flow may also take place.Secondary failure of the debris and of the exposed rocks that underlie the failed
TEN BRINK ET AL. TSUNAMI POTENTIAL NORTH OF PUERTO RICO
carbonate platform may lead to additional slope failures, probably in the form ofdebris flows and turbidity flows. Because the primary sliding material iscarbonate rocks, which are expected to fail in coherent rock masses, and becausethe edge of the carbonate platform is much steeper than many continental slopesaround the U.S., slides off Puerto Rico may result in a higher potential run-up oftsunamis than comparable slides elsewhere. However, a few conterminous U.S.margins such as the Blake Escarpment and the lower slope of the New Jerseymargin have composition and slope angle similar to those of Puerto Rico [Dillonet al., 1993], hence their failure mode may be analogous to our observations.
The 50-km wide escarpment, known as the Arecibo amphitheater, previouslythought to have been formed by a single giant voluminous failure, is in effect theresult of several slope failures. A hydrodynamic simulation using the weakly-nonlinear "extended" wave equations in the COULWAVE model, predicts amaximum run-up < 20 m on the northern coast of Puerto Rico from one of theslides at this place. This run-up amplitude is only 36% of the previouslyestimated run-up, which was calculated for the entire amphitheater sliding atonce. The run-up is predicted to be even smaller for a longer sliding duration. Arecurrence interval for the largest observed slope failures, such as the onemodeled here is estimated using many simplifying assumptions to be between100-800 ky. The lack of any established size-frequency relationship ofsubmarine slope failures prevents us from extending this estimate to smallerfailures.
Large submarine slides on the northern side of the Puerto Rico trench are foundat greater depths (~6000 m), but can nevertheless be hazardous, because theyaim toward Puerto Rico, have large horizontal and vertical dimensions and canexcite lower frequency waves. These slope failures as well as a slide scarpdiscovered in the Upper Mona rift, possibly associated with the 1918 tsunamithat hit northwestern Puerto Rico, should be further investigated.
This study demonstrates that high-resolution bathymetry, backscatter images,seismic profiles, and bottom samples, are necessary to evaluate the hazard fromlandslide tsunami. Emergency management cannot rely on tsunami warning forlandslide tsunamis, because landslide tsunamis have short travel time from theirsource to the coast. Improved knowledge of the sea floor coupled with realisticsimulations is needed to guide the preparation and mitigation of tsunami hazard.
The study was funded by NOAA Office of Ocean Exploration and the USGSCoastal and Marine Program and conducted aboard the NOAA ship Ronald
TEN BRINK ET AL. TSUNAMI POTENTIAL NORTH OF PUERTO RICO
Brown. Shep Smith, Gene Parker, Toshi Uozumi, Bill Danforth, Chris Polloni,Brian Andrews, and Pilar Llanes were instrumental in collecting and processingthe data. We thank Lisa Gahagan and the University of Texas seismic datacenter personnel for the seismic profiles. We thank David Twitchell, Jim Robb,and Tip Meckel for their constructive reviews.
References:Burroughs, S.M., and S.F. Tebbens, Power law scaling and probabilistic
forecasting of tsunami runup heights, Pure and Applied Geophysics, 162,331-342, 2005.
Dillon, W.P., J. Acosta, A. Uchupi, and U.S. ten Brink, Joint Spanish-Americanresearch uncovers fracture pattern in northeastern Caribbean, EOS, 79, 336-337, 1998.
Dillon, W.P., J.S. Risch, K.M. Scanlon, P.C. Valentine, and Q.J. Huggett,Ancient crustal fractures control the location and size of collapsed blocks atthe Blake Escarpment, east of Florida, in U. S. Geological Survey Bulletin,Report: B 2002, edited by W.C. Schwab, H.J. Lee, and D.C. Twichell, pp.54-59, 1993.
Driscoll, N.W., J.K. Weissel, and J.A. Goff, Potential for large-scale submarineslope failure and tsunami generation along the U.S. Mid-Atlantic coast,Geology, 28, 407-410, 2000.
Edwards, B.D., H.J. Lee, and M.E. Field, Seismically induced mudflow in SantaBarbara Basin, California, in U. S. Geological Survey Bulletin, Report: B2002, edited by W.C. Schwab, H.J. Lee, and D.C. Twichell, pp. 167-175,1993.
Freeman-Lynde, R.P., and W.B.F. Ryan, Subsidence history of the BahamaEscarpment and the nature of the crust underlying the Bahamas, Earth andPlanetary Science Letters, 84, 457-470, 1987.
Grindlay, N.R., Volume and density approximations of material involved indebris avalanche on the south slope of the Puerto Rico Trench, A report to thePuerto Rico civil Defense and the University of Puerto Rico Sea GrantCollege Program, 9 pp, 1998.
Grindlay, N.R., P. Mann, and J.F. Dolan, Researchers investigate submarinefaults north of Puerto Rico, EOS, 78, 404, 1997.
Heezen, B.C., and M. Ewing, Turbidity currents and submarine slumps, and the1929 Grand Bank earthquake, American journal of Science, 250, 849-873,1952.
Hughes Clarke, J.E., Late stage slope failure in the wake of the 1929 GrandBanks earthquake, Geo-Marine Letters, 10, 69-79, 1990.
Imamura, F., E. Gica, T. Takahashi, and N. Shuto, Numerical simulation of the
TEN BRINK ET AL. TSUNAMI POTENTIAL NORTH OF PUERTO RICO
1992 Flores tsunami: Interpretation of tsunami phenomena in northeasternFlores Island and damage at Babi Island, Pure and Applied Geophysics, 144,555-567, 1995.
Locat, J., H.J. Lee, P. Locat, and J. Imran, Numerical analysis of the mobility ofthe Palos Verdes debris avalanche, California, and its implication for thegeneration of tsunamis, Marine Geology, 203, 269-280, 2004.
Lynett, P., and P.L.-F. Liu, A Numerical Study of Submarine LandslideGenerated Waves and Runup, Proc. Royal Society of London A., 458, 2885-2910, 2002.
Lynett, P., T.-R. Wu, and P.L.-F. Liu, Modeling wave runup with depth-integrated equations, Coastal Engineering, 46, 89-107, 2002.
Ma, K.-F., H. Kanamori, and K. Satake, Mechanism of the 1975 Kalapana,Hawaii, earthquake inferred from tsunami data, Journal of GeophysicalResearch, 104, 13,153-13,168, 1999.
Mann, P., E. Calais, J.-C. Ruegg, C. DeMets, P.E. Jansma, and G.S. Mattioli,Oblique collision in the northeastern Caribbean from GPS measurements andgeological observations, Tectonics, 21, 1057, doi:10.1029/2001TC001304,2002.
Mercado, A., N.R. Grindlay, P. Lynett, and P.L.-F. Liu, Investigation of thepotential tsunami hazard on the north coast of Puerto Rico due to submarinelandslides along the Puerto Rico trench, Report submitted to Puerto RicoState Emergency Management Agency and Sea Grant College Program, 432,2002.
Mercado, A., and W. McCann, Numerical simulation of the 1918 Puerto Ricotsunami, Natural Hazards, 18, 57-76, 1998.
Monroe, W.H., Geology of the middle Tertiary formations of Puerto Rico, U. S.Geological Survey Professional Paper, P593, 93, 1980.
Nwogu, O., Alternative form of Boussinesq equations for nearshore wavepropagation, Journal of Waterway, Port, Coastal, and Ocean Engineering,119, 618-638, 1993.
Piper, D.J.W., P. Cochonat, and M. L. Morrison, The sequence of events aroundthe epicenter of the 1929 Grand Banks earthquake: initiation of debris flowsand turbidity current inferred from sidescan sonar, Sedimentology, 46, 79-97,1999.
Prior, D.B., and J.M. Coleman, Submarine slope instability, in Slope instability,edited by D. Brunsden, and D.B. Prior, pp. 419-455, Wiley and Sons,Chichester, 1984.
Satake, K. and Y. Tanioka, The July 1998 Papua New Guinea earthquake:Mechanism and quantification of unusual tsunami generation, Pure andApplied Geophysics, 160, 2087-2118, 2003.
TEN BRINK ET AL. TSUNAMI POTENTIAL NORTH OF PUERTO RICO
Scanlon, K.M., and D.G. Masson, Sedimentary processes in a tectonically activeregion: Puerto Rico North Insular Slope., in Geology of the U.S. Seafloor: theView from GLORIA, edited by J.V. Gardner, M. Field, and D.C. Twichell,pp. 123-134, Cambridge University Press, Cambridge, 1996.
Schwab, W.C., W.W. Danforth, K.M. Scanlon, and D.G. Masson, A giantsubmarine slope failure on the northern insular slope of Puerto Rico, MarineGeology, 96, 237-246, 1991.
ten Brink, U.S., Vertical motions of the Puerto Rico Trench and their cause, J.Geophys. Res., in press.
ten Brink, U.S., W.W. danforth, C. Polloni, B. Andrews, P. Llanes, S.V. Smith,E. Parker, and T. Uozumi, New sea floor map of the Puerto Rico trench helpsassess earthquake and tsunami hazards, EOS, 85, 349, 354, 2004a.
ten Brink, U.S., and J. Lin, Stress interaction between subduction earthquakesand forearc strike-slip faults: modeling and application to the northernCaribbean plate boundary, Journal of Geophysical Research, 109, B12310,10.1029/2004JB003031,2004b.
Trifunac, M.D., A. Hayir, and M.I. Todorovska, A note on tsunami caused bysubmarine slides and slumps spreading in one dimension with nonuniformdisplacement amplitudes, Soil Dynamics and Earthquake Engineering, 23,223-234, 2003.
Twichell, D.C., P.C. Valentine, and L.M. Parson, Slope failure of carbonatesediment on the West Florida Slope, in Submarine landslides; selectedstudies in the U.S. Exclusive Economic Zone, edited by W.C.L. Schwab, H J;Twichell, D C, pp. 69-78, U. S. Geological Survey Bulletin, Report: B 2002,1993.
van Gestel, J.-P., P. Mann, J.F. Dolan, and N.R. Grindlay, Structure andtectonics of the upper Cenozoic Puerto Rico-Virgin Islands carbonateplatform as determined from seismic reflection studies, Journal ofGeophysical Research, 103, 30,505-30,530, 1998.
van Gestel, J.-P., P. Mann, N.R. Grindlay, and J.F. Dolan, Three-phase tectonicevolution of the northern margin of Puerto Rico as inferred from anintegration of seismic reflection, well, and outcrop data, Marine Geology,161 (2-4), 259-288, 1999.
Varnes, D.J., Slope movement types and processes, in Landslides: Analysis andControl, edited by R. L Schuster and R. J. Krizek, pp. 11-33, NationalAcademy of Sciences, Washington, D.C., 1978.
Ward, S., Landslide tsunami, Journal of Geophysical Research, 106, 11201-11215, 2001.
Ward, S.N., and S. Day, Ritter Island Volcano; lateral collapse and the tsunamiof 1888, Geophysical Journal International, 154, 891-902, 2003.