Embed Size (px)
Citation preview

Sublimation Rate of Energetic Materials in Air: RDX and PETN
Journal: The Journal of Physical Chemistry
Manuscript ID: jp-2010-120004
Manuscript Type: Article
Date Submitted by the Author:
17-Dec-2010
Complete List of Authors: Gershanik, Arcady; Ben Gurion University, Biomedical Engineering
Zeiri, Yehuda; Ben-Gurion University
ACS Paragon Plus Environment
Submitted to The Journal of Physical Chemistry
Sublimation rate of energetic materials in air:
RDX and PETN
Arcady P.Gershanika and Yehuda Zeiri
a,b*
a Biomedical Engineering, Ben Gurion University of the Negev , Beer-Sheva 84105,
Israel
b Division of Chemistry, NRCN Beer-Sheva P.O. Box 9001, 84190, Israel
[email protected], [email protected]
ABSTRACT
This paper reports measurements in which the sublimation rate in air of RDX and PETN
samples was determined. For both explosives the initial samples were prepared by
deposition from a solution. For RDX we obtained a continuous thin film while the PETN
samples were constituted of small, well separated, single crystals. The sublimation
process was monitored using a quartz crystal microbalance (QCM). It is demonstrated
that a quantitative description of the sublimation rates can be obtained using molecular
diffusion equations in the surrounding air. A quantitative description is limited by the
large discrepancy of the reported vapor pressure of these explosives in the literature. An
additional obstacle in the accuracy of these predictions is the limited data related to
vapor-in-air diffusion coefficients. The results reported here allow us to determine the
most relevant vapor pressure source reported in the literature and the most probable
diffusion coefficient values.
Page 1 of 21
ACS Paragon Plus Environment
Submitted to The Journal of Physical Chemistry
123456789101112131415161718192021222324252627282930313233343536373839404142434445464748495051525354555657585960

2
1. Introduction
Pentaerythritol tetranitrate (PETN) and 1,3,5-Trinitroperhydro-1,3,5-triazine (RDX) are
two of the most widely used explosives among the common military energetic materials.
These two explosives have been also used by various terrorist groups in different
occasions. Both explosives exhibit very low vapor pressure, hence, their detection is
limited mainly to detection of solid samples. As a result, law enforcement authorities
need improved sampling procedures to collect trace amounts of these explosives that are
required for analysis by the analytical tools used. Thus, the main goal of sample
collection using swabs of passenger belongings and luggage in airports is to detect
minute residues of energetic materials. Trace amounts of material are expected to remain
on belongings of people that were involved in preparation or transport of explosives.
However, these small particles of energetic materials are expected to exhibit a finite life
time since they are located in an infinite open system. It is important to have an accurate
estimate of the lifetime of explosive particles since it determines the possibility to detect
them after their deposition.
It is well established and confirmed recently1
that the sublimation rate of small
explosive particles in air is limited by the diffusion process. The diffusion model used to
estimate sublimation rate requires knowledge of both the diffusion coefficients of the
energetic material's molecules in air and the magnitude of the saturation vapor pressures.
Since the vapor pressure of most explosives is quite low their accurate measurement is
difficult. Hence, considerable discrepancies are found in the literature2-8
. Moreover, to the
best of our knowledge, data of direct measurements of diffusion coefficients in air of the
two explosives investigated here are absent in literature. A few measurements of PETN
and RDX sublimation rates in atmospheric conditions were reported in the literature.9-12
Analysis of the results obtained in these experiments is not clear with respect to several
important points. For example, in the case of PETN: (i) some of the data was carried out
in the temperature range 110oC-125
oC in which considerable thermal decomposition of
the sample occurs according to the authors11,12
(ii) the lower temperature data obtained
9,10
reveals large discrepancies (of 300-400 times) between the AFM (Atomic Force
Microscope) measurements and the TGA (Thermal Gravimetric Analysis) results for
similar samples, (iii) the estimation9,10
of diffusion coefficient using TGA sublimation
Page 2 of 21
ACS Paragon Plus Environment
Submitted to The Journal of Physical Chemistry
123456789101112131415161718192021222324252627282930313233343536373839404142434445464748495051525354555657585960

3
rate measurements yields an extremely small value 8.10
-7 m
2/s. In the case of RDX
11, 12,
the following discrepancies were observed: (i) extremely large estimations of the vapor-
in-air diffusion coefficient, of order of 1x10⁻⁴
m2/s, was required for description of the
sublimation rate as a diffusion process. These large diffusion coefficients were
interpreted by the authors11, 12
as a possible consequence of the influence of surface
migration. The experiments related to RDX sublimation were carried out as weight loss
measurements of the solid RDX sample through a glass tube of known dimensions. The
authors could not estimate the influence of the glass walls on the measured data. In the
experiments described below we measured the RDX sublimation rate using a quartz
crystal microbalance (QCM) which allows continuous measurements of weight change
during the sublimation process into the open space without the need for a sublimation cell
with walls.
The quartz crystal microbalance (QCM) is a suitable system to measure sublimation
rates due to its high sensitivity to very small mass changes of order of nanograms. Hence,
in the present study we used QCM measurements to investigate the sublimation rate of
both Pentaerythritol tetranitrate (PETN) single crystals and 1, 3, 5-Trinitroperhydro-1, 3,
5-triazine (RDX) films directly precipitated from a solution of these explosives. The main
goal of the study was to obtain reliable data concerning the sublimation rates of these two
explosives together with a suitable model that will allow accurate predictions at various
conditions.
2. Experimental details
Materials
Military standard of Pentaerythritol tetranitrate (PETN) and 1, 3, 5-Trinitroperhydro-1,
3, 5-triazine (RDX),4,6-trinitritoluene solutions in acetonitrile with concentration of 1 g/L
and acetonitrile purity of 99.9% were received from Rafael Ltd.
Equipment
The quartz microbalance used is model QCM100 by Stanford Research Systems, Inc. The
AT-cut disk-shaped quartz crystal of 1 inch diameter was covered in the central area (0.5
inch diameter) by a thin gold layer. According to the manufacturer data, the crystal holder
withstands temperature up to 85oC. However, the preamplifier attached by a BNC
Page 3 of 21
ACS Paragon Plus Environment
Submitted to The Journal of Physical Chemistry
123456789101112131415161718192021222324252627282930313233343536373839404142434445464748495051525354555657585960

4
connection to the crystal holder may be exposed only to temperatures up to 40oC. To
eliminate this restriction, in all experiments reported here the preamplifier was separated
from the crystal holder by a 10 inch long cable. The temperature control was achieved by
placing the crystal holder with the sample on the crystal surface in an oven with polished
stainless steel walls with ventilation located at the top of the oven. Before placing the
sample in the oven it was heated to the desired temperature. The sublimation experiments
reported below were carried out at constant temperature with fluctuations less than
±0.2oC. The quartz crystal holder was usually placed on the bottom of the oven at a
distance of 5-6 cm from one of the walls with the sample facing the wall. The position of
the crystal was chosen to be as far as possible from the ventilator. To eliminate the
accumulation of explosive vapor in the volume above the sample during the sublimation
process, the oven was pumped out continuously using a small membrane pump (pumping
rate of 18 L/min). The present experiments differ from those described in Ref. 1 by the
addition of a preventive cage around the QCM sample holder to eliminate air flow in the
neighborhood of the sample (see Figure 1). This setup was very important especially in
the experiments with RDX samples whose characteristic dimension is similar to that of
the QCM electrode used as the substrate, radius of 0.25 inch. Samples with such a radius
require the absence of air flow at distances of at least 2.5 inch. The cage was made of
three layers of fiberglass grid with mesh size of 0.5mm x 0.5mm. The size of the cage
was ten times larger than the dimensions of the QCM electrode. We verified, by
increasing the number of net layers in the cage, that this precaution insured that the
measured sublimation rate is independent of the air flow caused by the ventilation in the
oven.
Page 4 of 21
ACS Paragon Plus Environment
Submitted to The Journal of Physical Chemistry
123456789101112131415161718192021222324252627282930313233343536373839404142434445464748495051525354555657585960

5
Figure 1. Air flows preventing cage
Sample preparation
PETN
The samples were prepared on the surface of the QCM electrode deposition of 10-20 µl
solution. Following solution deposition, the solvent was allowed to evaporate at
temperature of 15oC. The resultant PETN layer formed during the precipitation process
consisted of a collection of small well separated single crystals.
The crystal holder with the sample was placed in the oven at the desired temperature.
The sample reached the desired temperature typically within 2 hours. The data
acquisition by a computer was started only after once the target temperature was reached.
The sample sublimation process was monitored as fractional mass change as a function of
time according to equation
i
i
ff
ff
m
m
−
−=
∆
00
(1)
where ∆m is the sample mass change at time t relative to the initial sample mass m0 at
the beginning of the experiment (t=0), while f represent the QCM resonance frequency at
time t, fi is its value at t=0 and f0 represent the fundamental resonance frequency.
Multilayer grid
QCM sample
holder
Page 5 of 21
ACS Paragon Plus Environment
Submitted to The Journal of Physical Chemistry
123456789101112131415161718192021222324252627282930313233343536373839404142434445464748495051525354555657585960

6
RDX
The sample preparation was carried out by deposition of 40 µl solution on the QCM
electrode surface. Contrary to the PETN samples, the RDX formed, following solvent
evaporation and solute precipitation, an apparently continuous thin film on the QCM
surface. The solvent evaporation was carried out at elevated temperature of 60oC. The
equilibration time of the RDX sample in the oven was typically about 5 hours, somewhat
longer than for PETN probably due to existence of small amount of occluded solvent.
Contrary to PETN, for RDX samples the sublimation process was monitored as mass
change in absolute units. This type of measurements is usual for nearly homogeneous
samples. As has been shown in Ref. 1, the QCM sublimation measurements are
independent of the sample thickness for continuous macroscopic layers. However, there
is a necessity to calibrate the QCM readings. The calibration was performed before each
experiment once the sample was formed by precipitation at the elevated temperature and
cooled down to room temperature.
The QCM sensitivity value was determined by using the formulae
0m
fG
∆= (2)
where G is the QCM sensitivity in Hz/µg, m0 the dry mass of the sample and ∆f the
resonance frequency shift relative to fundamental. Usually, the frequency shift during the
first 5 hours of the thermal equilibration did not exceed 15-20 % of the full measurement
range. This value determines the calibration uncertainty.
3. Results
We shall start the description of the experimental data by an examination of the initial
sample morphology of the two explosives examined. Based on enlarged optical
microscope images, the PETN and RDX samples exhibit very different morphologies. An
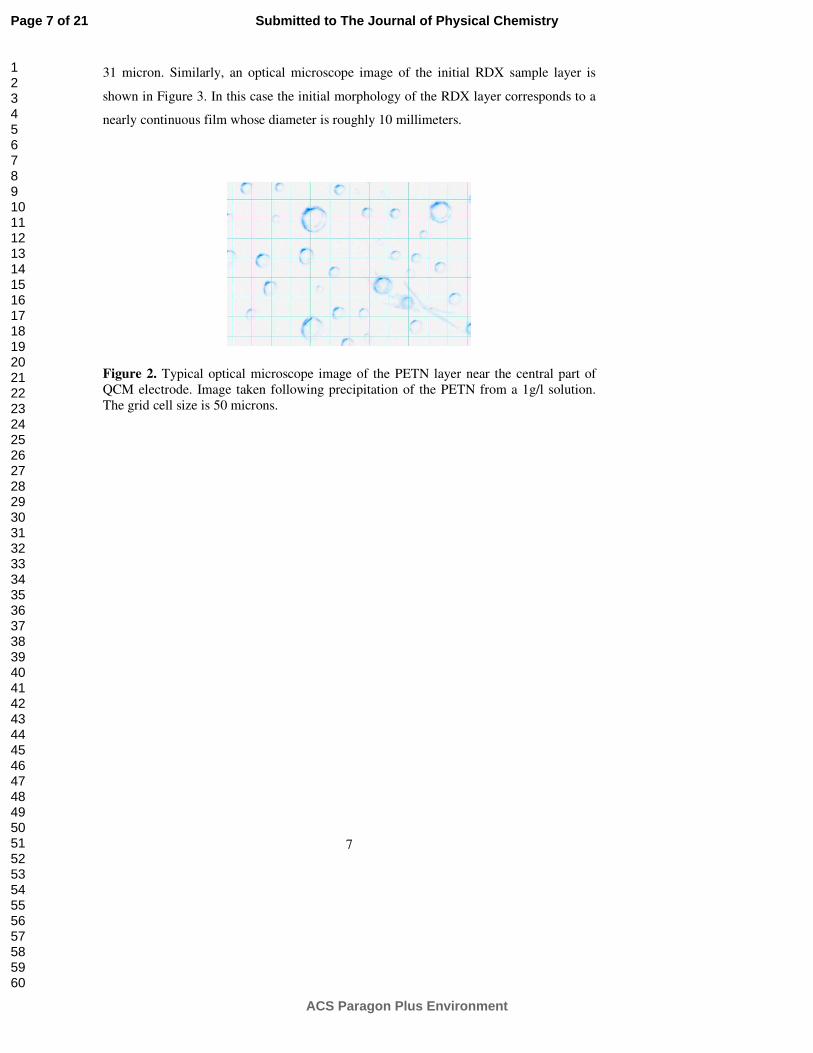
optical microscope image of a typical PETN sample morphology is shown in Fig. 2. It is
clear that the initial morphology of the PETN layer is composed of well separated
transparent micro crystals whose boundaries are easily visible. The diameter of these
PETN micro-crystals is in the range of 30-35 micrometers, and their average diameter is
Page 6 of 21
ACS Paragon Plus Environment
Submitted to The Journal of Physical Chemistry
123456789101112131415161718192021222324252627282930313233343536373839404142434445464748495051525354555657585960
7
31 micron. Similarly, an optical microscope image of the initial RDX sample layer is
shown in Figure 3. In this case the initial morphology of the RDX layer corresponds to a
nearly continuous film whose diameter is roughly 10 millimeters.
Figure 2. Typical optical microscope image of the PETN layer near the central part of
QCM electrode. Image taken following precipitation of the PETN from a 1g/l solution.
The grid cell size is 50 microns.
Page 7 of 21
ACS Paragon Plus Environment
Submitted to The Journal of Physical Chemistry
123456789101112131415161718192021222324252627282930313233343536373839404142434445464748495051525354555657585960

8
Figure 3. Typical optical microscope image of the RDX layer on the QCM electrode.
The layer obtained by precipitation of 40 µg RDX from a solution of 1g/l. The sample
seem to be composed of a nearly uniform thin film. The grid size in the picture is 50
microns.
The mass fraction change during the sublimation process of PETN as measured by the
QCM is shown in Figure 4 for three different temperatures. The reproducibility of the
measurements at any given temperature is very good (each curve corresponds to 2-4
different experiments). This result suggests that the approach used here for sample
preparation yield statistically very similar micro-crystal size and shape distributions.
0
20
40
60
80
100
0 20 40 60 80 100 120
Time, hours
Su
blim
atio
n, %
.
Figure 4. Variation of sample mass fraction of the PETN layers as a function of time.
The three groups of lines correspond to different temperatures at which sublimation was
monitored: red lines – at 70oC, blue lines - at 60
oC and brown line - at 50
oC.
Page 8 of 21
ACS Paragon Plus Environment
Submitted to The Journal of Physical Chemistry
123456789101112131415161718192021222324252627282930313233343536373839404142434445464748495051525354555657585960
9
0
0.5
1
1.5
2
2.5
3
3.5
4
4.5
5
0 10 20 30 40 50
Time, hours
Su
blim
ati
on
, m
icro
gra
m
The initial slopes of the curves presented in Fig. 4 are related to the rate of the
sublimation process. The initial rates of changes in the mass fractions at the three
different temperature examined are: 10.2%/h at 70oC, 2.66%/h at 60
oC and 0.68%/h at
50oC. The rates quoted above were obtained from the slopes up to a mass fractional
change of 40%. The deviations from linearity of the high temperature curves at large
mass fraction sublimation values is related to marked changes in the layer morphology.
Similar measurements of the mass change during the sublimation process of RDX, as
recorded by the QCM, are shown in Figure 5 for three different temperatures. The
reproducibility of the measurements at any given temperature is also very good,
considering the rather long measurement time required. Note that the experiments were
terminated after the sublimation of roughly 10% of the initial sample mass.
Figure 5. Sample mass change during RDX Sublimation at three different temperatures:
red lines - at 70oC, blue – at 65
oC and brown line – at 60
oC.
The initial slops of the curves are found to be 0.066 µg/h at 60oC, 0.119 µg/h at 65
oC,
and 0.220 µg/h at 70oC.
The slope of the various curves is related to the evaporation rate of the sample. The If
one assumes an Arrhenius form for the temperature dependence of evaporation rates, the
activation energy of the process can be obtained from the slope of the lines shown on the
Figures 6 and 7. The value obtained for the activation energy associated with PETN
sublimation is 125 kJ/mol comparing to the value of 140 kJ/mol reported in the
literature.9
Page 9 of 21
ACS Paragon Plus Environment
Submitted to The Journal of Physical Chemistry
123456789101112131415161718192021222324252627282930313233343536373839404142434445464748495051525354555657585960

10
R2 = 0.9998
-0.5
0
0.5
1
1.5
2
2.5
2.9 2.95 3 3.05 3.1
1000/TL
n[d
(m/m
o)/
dt,
%/h
]
Figure 6. Arrhenius plot of the experimental data for PETN that gives 125 kJ/mol for the
activation energy.
R2 = 0.9996
-2.9
-2.7
-2.5
-2.3
-2.1
-1.9
-1.7
-1.5
2.9 2.92 2.94 2.96 2.98 3 3.02
1000/T
Ln
(rate
)
Figure 7. Arrhenius plot of the experimental data for RDX that gives 114 kJ/mol for
activation energy.
The respective value for RDX is equal to 114 kJ/mol compared to 131 kJ/mol reported in
the literature12
. Inspection of Figs. 6 and 7 shows that the data corresponding to the three
temperature values examined here indeed follow an Arrhenius form, namely, the three
data points lie on a straight line with high accuracy.
4. Discussion
In the following we shall consider the diffusive motion of the sample's molecules from
the sample surface to the surrounding gas phase. It is claimed that the use of the net cage
(see Fig. 1) surrounding the sample prevents any influence of the convective or other
Page 10 of 21
ACS Paragon Plus Environment
Submitted to The Journal of Physical Chemistry
123456789101112131415161718192021222324252627282930313233343536373839404142434445464748495051525354555657585960
11
forced motion that contributes to the measured sublimation rates. Thus, molecular
diffusion is basically the only route of explosive molecules to “get away” from the
sample surface.
Let us consider the quasi stationary steady state diffusion process from the sample
surface into the open space. The diffusive flow considerably depends on the morphology
of the sample. Unfortunately, we have not found in the literature solutions of diffusion
equations that describe this process for the case of a sample with arbitrary shape.
Analytic expressions were derived for the cases of spherical (or hemispherical) 13
and
disk shaped source terms (i.e. sample shapes).14
The diffusive flow from a hemispherical source is expressed as
MDCrdtdm sat02/ π= , (3)
and from a disk shaped sample as
MDCrdtdm satd4/ = (4)
where dm/dt is diffusive flow from the source to open space in units of kg/s, r0 and rd are
radius of the hemisphere and disk respectively, D is the diffusion coefficient of the
sample vapor in surrounding medium, Csat represents the concentration of the saturated
vapor in the medium and M is the sample molecular mass.
We shall limit the following discussion to these two sample shapes that fit well our
PETN and RDX sample morphologies respectively. It is important to stress that the
diffusive flow into the surrounding space is always proportional to the linear dimension
of the source object and not to its surface area, as one can see in equations (3 and 4).
In the following each one of the explosives examined will be discussed separately.
PETN
As can be clearly seen in Figure 2, the precipitated on PETN layer consists of well
separated individual micro-crystals whose average diameter is 31 micron. If the shape of
each micro-crystal is approximated by a hemisphere the sample can be viewed as a
collection of independent hemispherical sources of vapor molecules. If one uses the ideal
Page 11 of 21
ACS Paragon Plus Environment
Submitted to The Journal of Physical Chemistry
123456789101112131415161718192021222324252627282930313233343536373839404142434445464748495051525354555657585960
12
gas equation of state for the vapor phase one can transform equation (3) to the following
expression
Tkr
MDPdtmmd
B
sat
ρ2
0
03
)/( =− ( 5)
where m0 stands now for initial (at t=0) mass of an average sized hemisphere of radius r0
(assumed to be with diameter of 31 microns), Psat represents the saturation vapor pressure
of explosive and ρ is the density of the solid sample.
Equation (5) that describes the fractional mass change obtained for a hemispherical
particle is used to model the sublimation of PETN samples. Hence, predictions using eq.
(5) relay on the availability of saturation vapor pressure and diffusion coefficient for the
explosive examined. The vapor pressure data found for PETN in the literature show large
discrepancies of order of magnitude.2-6
The temperature dependence (Clausius-Clyperon
plot) of the PETN vapor pressure values reported in the literature are presented in Fig. 8
below. The large difference between the various measurements is clearly observed. These
vapor pressure data correspond to sublimation heat values in the range from 122 kJ/mol
(Crimmins6, close to our value of 125 kJ/mol) to a maximal value of 150 kJ/mol
(Cundall2).
In addition, as it is pointed out in the introduction, the only, non direct, experimental
determination of PETN vapor diffusion coefficient in air we found in the literature11
seems to be unusually small (8x10⁻⁷
m2/s)
9. A theoretical estimation of PETN diffusion
coefficient is about an order of magnitude larger15
, i.e. D= 5.10
-6 m
2/s. Therefore, in the
following eq. (5) is used, together with the different vapor pressure values reported in the
literature2-6
, to evaluate the magnitude of the diffusion coefficient. Thus, the data
Page 12 of 21
ACS Paragon Plus Environment
Submitted to The Journal of Physical Chemistry
123456789101112131415161718192021222324252627282930313233343536373839404142434445464748495051525354555657585960

13
-10
-9
-8
-7
-6
-5
-4
2.85 2.9 2.95 3 3.05 3.1 3.15
1000/T
Ln
(Psa
t,P
a)
obtained in the sublimation experiments is used to calculate the PETN diffusion
coefficient in air by expression
MP
TkrdtmmdD
sat
B
3
])/([2
00 ρ−= . (6)
The calculated values of D for PETN are summarized in Table I. Inspection of the
results in Table I shows that the diffusion coefficient values obtained for PETN in air
using vapor pressure values of Refs.2-5
are of order 1x10⁻⁵
m2/s -5x10
-5 m
2/s. This
estimate seems to be unreasonably large for heavy molecules such as PETN (molecular
weight 316). In addition, this value is much larger than the theoretically calculated value
which is 5.10-6
m2/s. Moreover, for these four vapor pressure data sources the magnitude
of D decreases for increasing temperatures in contrary to the usual expectations. The D
values obtained using Crimmins6 vapor pressure agree very well with the theoretical
values and their magnitude increase as a function of temperature.
Figure 8. Clausius-Clpeyron plots related to vapor pressure data found in the literature
for PETN: blue line - following Cundall et al.2, magenta - following Edwards3, light blue
- following Dionne et al.4, brown - following Burnham et al.5, yellow - following
Crimmins.6
Table I. Diffusion coefficients (in m2/s) of the PETN vapor in air as calculated from the
measured evaporation rates using expression (6)
Temperature, Measured
evaporation
Vapor pressure data source
Page 13 of 21
ACS Paragon Plus Environment
Submitted to The Journal of Physical Chemistry
123456789101112131415161718192021222324252627282930313233343536373839404142434445464748495051525354555657585960

14
oC rate, %/hour Cundall
2 Edwards
3 Crimmins
6 Dionne
4 Burnham
5
50 0.68 4.85.10
-5 4.02
.10
-5 3.70
.10
-6 2.13
.10
-5 1.51
.10
-5
60 2.66 3.53.10
-5 2.99
.10
-5 3.82
.10
-6 1.77
.10
-5 1.14
.10
-5
70 10.20 2.87.10
-5 2.48
.10
-5 4.08
.10
-6 1.63
.10
-5 9.59
.10
-6
Thus, one can conclude that the vapor pressure data reported by Crimmins6 are the best to
describe PETN sublimation rate. As described earlier, Burnham et al.9 used AFM
measurements to evaluate the evaporation rate of PETN samples. The measurements
were based on AFM monitoring of the shrinkage rates of PETN micro crystals. The AFM
measurement based sublimation rates were compared to results obtained using TGA
measurements. These authors found a discrepancy of 300-400 times between the results
of the two sublimation rate measurement methods. Unfortunately, the authors9 published
their results only as reduced quantities. Such presentation of diffusion in the atmosphere
is not sufficient without indication of the sample linear dimensions and shape. As a result
we cannot compare directly our data with the results reported in Ref. 9. However, we
could recalculate the PETN evaporation rates of their AFM measurements9 using the
particles time dependent shrinkage values presented in the form of graphs in Ref 9. By
this procedure we could obtain the original sublimation rate values before their reduction
to sample unit area and then compare them with our results. The results of this re-
processing of the AFM data are presented in Table II together with results of our re-
calculation employing eq. (5) and the vapor pressure values reported by Crimmins6
together with the corresponding D values in Table I.
Table II. Comparison of the AFM reprocessed sublimation rate of PETN9 with those
calculated using expression (5) with vapor pressure reported by Crimmins6
and the
corresponding diffusion coefficient from Table I.
Temperature,
oC
Crystal
radius,9
nm
Shrinkage
rate,9
nm/s
Reprocessed
sublimation
rate,
Sublimation
rate,
calculated
Ratio between
measured and
calculated rate
Page 14 of 21
ACS Paragon Plus Environment
Submitted to The Journal of Physical Chemistry
123456789101112131415161718192021222324252627282930313233343536373839404142434445464748495051525354555657585960
15
ng/s ng/s values
30 330 0.0394 4.77.10
-8 3.33
.10
-8 1.43
35 130 0.1282 2.41.10
-8 2.95
.10
-8 0.82
40 320 0.3194 3.64.10
-7 1.63
.10
-7 2.23
In Table II one can see that results of the AFM measurements coincide well with the
results of our simple diffusion model using vapor pressures and diffusion coefficients
values that were fitted to reproduce the data obtained in our QCM measurements. Since
QCM measurements are similar by their nature as TGA data, it remains unclear the
observed9 discrepancy of 300-400 times, between the AFM and TGA rates.
Unfortunately we cannot recalculate the TGA results due to the absence of “raw”, un-
treated, TGA data in the paper.9 Once accepted vapor pressure and diffusion coefficient
are defined it is possibile to follow PETN particles size evolution as a function of time.
The equation describing the process for hemispherical particles is1
tTρk
MDP)(tr(t)r
B
sat20
2
00 −== (7)
where (t)r0 is the time dependent radius of the particle.
The results presented in Figure 9 were calculated using expression (7) for PETN
hemispherical particles of diameters 6 and 20 microns respectively. Tee particles size
variation due to sublimation was carried out at temperature of 30oC. The particle with 6
micron diameter expected to disappear after approximately 5 days while the 20 micron
diameter particle will last for about 50 days.
0
10
20
30
40
50
60
70
80
90
100
0 10 20 30 40 50 60
Elapsed time, days
Rem
ain
ed d
imen
sio
n, %
Page 15 of 21
ACS Paragon Plus Environment
Submitted to The Journal of Physical Chemistry
123456789101112131415161718192021222324252627282930313233343536373839404142434445464748495051525354555657585960

16
Figure 9. PETN hemispherical particle size evolution in time at 30 oC: blue line
represents particle of 6 micron initial diameter, magenta line is for particle of 20 micron
initial diameter
RDX
As is clear from observation of the sample morphology shown in Figure 3, RDX
precipitated as continuous layer. Hence, its sublimation rate would be described by
equation (4). As in the case of PETN, the literature vapor pressure data for RDX is very
contradictory.2-4,7,8
Figure 9 shows a comparison between the results of various
measurements reported in the literature.
-9.5
-9
-8.5
-8
-7.5
-7
-6.5
-6
-5.5
2.9 2.92 2.94 2.96 2.98 3 3.02
1000/T, K
Ln
(Psa
t,P
a)
Figure 10. Clausius-Clpeyron plots of RDX vapor pressure measurements reported in
the literature: blue line - after Cundall et al.2, red line - after Edwards3, brown line –
after Dionne et al.4, yellow line – after Rosen et al. et al.7 and green line - after Stimac.8
The vapor pressure data presented in Fig. 9 corresponds to the heat of sublimation
values in the range 115 kJ/mol ÷134 kJ/mol. The lowest sublimation heat corresponds to
data of Stimac8, 115 kJ/mol, and the largest to Cundall
2, sublimation heat of 134 kJ/mol.
As for PETN, reliable, i.e. independent of saturated vapor pressure values, diffusion
coefficients of the RDX vapors in air were not reported in the literature. The theoretical
Page 16 of 21
ACS Paragon Plus Environment
Submitted to The Journal of Physical Chemistry
123456789101112131415161718192021222324252627282930313233343536373839404142434445464748495051525354555657585960

17
value of the RDX vapors diffusion coefficient, based on molecular theory, is 7.4.10-6
m2/s
at room temperature.16
If the temperature dependence of the diffusion coefficient of RDX
molecules is T1.75
as claimed by11, 12
, one would expect a theoretical value of 1.05x10⁻⁵
m2/s at 70
oC, the highest temperatures used in the present study.
Measurements of RDX sublimation rate have been reported.11,12
Exceptionally large
diffusion coefficient, D=1x10⁻⁴
m2/s using the vapor pressure values reported by Dionne
4
were required11,12
to describe the data. However, using vapor pressure data of Stimac8
reasonable diffusion coefficient of D=1.17x10⁻⁵
m2/s at 79
oC was suggested. The
authors11,12
expressed some doubts regarding the vapor pressure values of Stimac8
and
considered the possible influence of RDX surface migration along the walls of the
diffusion cell on the measured results16
. Thus, the best choice of the parameters Psat and D
remains uncertain.
In the present investigation wall effects were eliminated. The diffusion coefficient
values calculated using expression (4) are shown in Table III for all the available vapor
pressure data in the literature.
Table III. Diffusion coefficients (in m2/s) of the RDX vapor in air as calculated from the
measured evaporation rates according to expression (4)
Vapor pressure data source Temperature,
oC
Sublimation
rate, µg/h Cundall
2 Edwards
3 Dionne
4 Rosen
7 Stimac
8
60 0.066 4.77.10
-5 3.32
.10
-5 7.63
.10
-5 1.12
.10
-4 1.04
.10
-5
65 0.119 4.26.10
-5 3.34
.10
-5 7.20
.10
-5 1.06
.10
-4 1.03
.10
-5
70 0.220 3.98.10
-5 3.51
.10
-5 7.11
.10
-5- 1.05
.10
-4 1.07
.10
-5
Inspection of the data in Table III shows that for all vapor pressures reported in the
literature, the best agreement with the theoretical D value is obtained using the vapor
pressure by Stimac7.
Using these value for the vapor pressure and diffusion coefficient we can estimate the
life time of a RDX particle. The variation of particle size was estimated using eq. (7) as
for PETN particles described above.The results are shown in Figure 11 for RDX particles
Page 17 of 21
ACS Paragon Plus Environment
Submitted to The Journal of Physical Chemistry
123456789101112131415161718192021222324252627282930313233343536373839404142434445464748495051525354555657585960
18
0
10
20
30
40
50
60
70
80
90
100
0 10 20 30 40 50 60 70 80 90 100 110 120
Elapsed time, days
Re
ma
ined
dim
en
sio
n, %
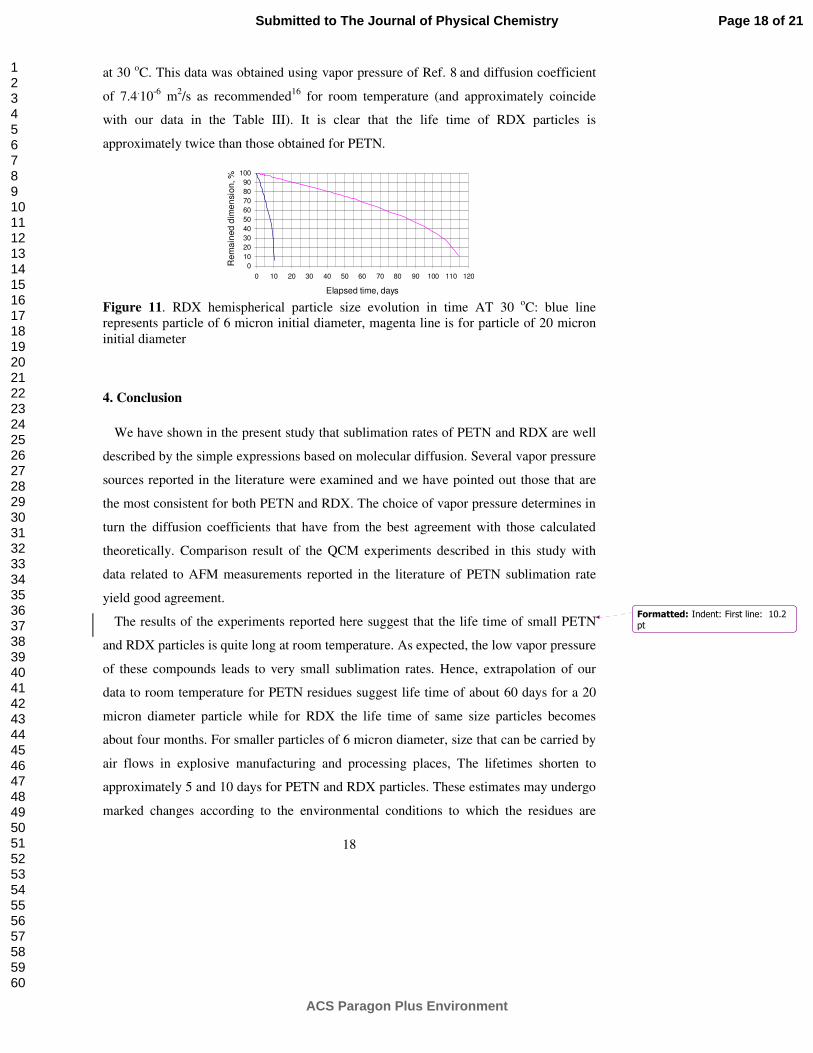
at 30 oC. This data was obtained using vapor pressure of Ref. 8
and diffusion coefficient
of 7.4.10
-6 m
2/s as recommended
16 for room temperature (and approximately coincide
with our data in the Table III). It is clear that the life time of RDX particles is
approximately twice than those obtained for PETN.
Figure 11. RDX hemispherical particle size evolution in time AT 30 oC: blue line
represents particle of 6 micron initial diameter, magenta line is for particle of 20 micron
initial diameter
4. Conclusion
We have shown in the present study that sublimation rates of PETN and RDX are well
described by the simple expressions based on molecular diffusion. Several vapor pressure
sources reported in the literature were examined and we have pointed out those that are
the most consistent for both PETN and RDX. The choice of vapor pressure determines in
turn the diffusion coefficients that have from the best agreement with those calculated
theoretically. Comparison result of the QCM experiments described in this study with
data related to AFM measurements reported in the literature of PETN sublimation rate
yield good agreement.
The results of the experiments reported here suggest that the life time of small PETN
and RDX particles is quite long at room temperature. As expected, the low vapor pressure
of these compounds leads to very small sublimation rates. Hence, extrapolation of our
data to room temperature for PETN residues suggest life time of about 60 days for a 20
micron diameter particle while for RDX the life time of same size particles becomes
about four months. For smaller particles of 6 micron diameter, size that can be carried by
air flows in explosive manufacturing and processing places, The lifetimes shorten to
approximately 5 and 10 days for PETN and RDX particles. These estimates may undergo
marked changes according to the environmental conditions to which the residues are
Formatted: Indent: First line: 10.2
pt
Page 18 of 21
ACS Paragon Plus Environment
Submitted to The Journal of Physical Chemistry
123456789101112131415161718192021222324252627282930313233343536373839404142434445464748495051525354555657585960

19
exposed. For example, UV sun radiation may shorten these estimates dramatically. Such
environmental effects on explosives residue life times will be discussed in a future
publication.
Acknowledgement
This work was partially supported by The Center of Excellence for Explosives
Detection, Mitigation and Response, a Department of Homeland Security Center of
Excellence in The University of Rhode Island.
References
1. Gershanik A.P.; Zeiri Y. J. Phys. Chem. A 2010, 114, 12403-12410
2. Cundall, R.B.; Palmer,T.F.; Wood C.E.C. J.Chem.Soc.Farad.Trans. 1978, 74, 1339-
1345
3. Edwards, G. Trans Faraday Soc. 1950, 46, 423-427
4. B.C. Dionne, D.P. Rounbehehler, E.K. Achter, J.R. Hobbs, D.H. Fine, J. Energ.
Mater. 1986, 4, 447-472
5. Burnham, A.; Gee, R.; Maiti, A.; Qiu, R.; Rajasekar, P.; Weeks,B.; Zepeda-Ruiz, L.
LLNL Technical Report UCRL TR 216963, 2005. Experimental results on vapor pressure
of PETN documented in this work are from R. Behrens’ presentation: “Update on the
Analysis of Thermally and Chemically Stabilized PETN Powders,” JOWOG Focused
Exchange Meeting, May 2003, Sandia National Lab, Albuquerque, NM.
6. F.T. Crimmins, Report UCRL- 50704, Lowrence Radiation Lab. Ca, 1969
7. J. M. Rosen , C. Dickinson J. Chem. Eng Data, 1969,14,120-124
8. R.Stimac data published in G.A.Eiceman, D.Preston, G.Tiano, J.Rodrigues,
J.E.Parmeter, Talanta 1997, 45, 57-74
9. A. K. Burnham, S. R. Qiu, R. Pitchimani, B. L. Weeks, J. Appl. Phys,2009, 105,
104312
Page 19 of 21
ACS Paragon Plus Environment
Submitted to The Journal of Physical Chemistry
123456789101112131415161718192021222324252627282930313233343536373839404142434445464748495051525354555657585960

20
10. R. Pitchimani, A.K. Burnham, B. L. Weeks, J. Phys. Chem .B Letters,
2007,111,9182-9185
11. J. E. Parmeter, G. A. Eiceman, D. A Preston, G. S. Tiano, Sandia Report SAND-96-
2016C, Conf--960767- 2 1,1996, Sandia National Laboratories, Albuquerque, NM
12. G.A. Eiceman, D. Preston, G. Tiano, J. Rodrigues, J.E. Parmeter, Talanta 1997, 45,
57-74 13.
13. Crank, J. Mathematics of Diffusion: Oxford University Press: Oxford, 1975
14.Gray, A.; Mathews, B. B.; MacRobert, T. M. A Treatise on Bessel Functions and
their Applications to Physics: Macmillan and Co.Ltd: London, UK, 1931
15. Dortch M.; Furey J.; Meyer R.; Fant S.; Gerald J.; Qasim M.; Fredrickson H.;
Honea P.; Bausum H.; Walker K.; Johnson M. Data Gap Analysis and Database
Expansion of Parameters for Munitions Constituents, US Army Gorps.of Engineers
Report ERDC/EL TR-05-16, 2005, 35
16. McKone T.E.; Layton D.W. Regulatory Toxicology and Pharmacology, 1986,
6,359-380,
Page 20 of 21
ACS Paragon Plus Environment
Submitted to The Journal of Physical Chemistry
123456789101112131415161718192021222324252627282930313233343536373839404142434445464748495051525354555657585960

21
Table of contents
Sublimation rate of Energetic Materials in air: RDX and PETN
Arcady P.Gershanik, Yehuda Zeiri
J. Phys. Chem. A, Articles ASAP (As Soon As Publishable)
Publication Date (Web): (Article)
Air, grad C
QCM RDX PETN
Page 21 of 21
ACS Paragon Plus Environment
Submitted to The Journal of Physical Chemistry
123456789101112131415161718192021222324252627282930313233343536373839404142434445464748495051525354555657585960